Financial Performance of SDG Mutual Funds Focused on Biotechnology and Healthcare Sectors


Abstract
:1. Introduction
2. Literature Review and Development of Hypotheses
3. Research Method
3.1. Sample
3.2. Financial Performance Models
3.3. Managerial Abilities Models
4. Empirical Results and Discussion
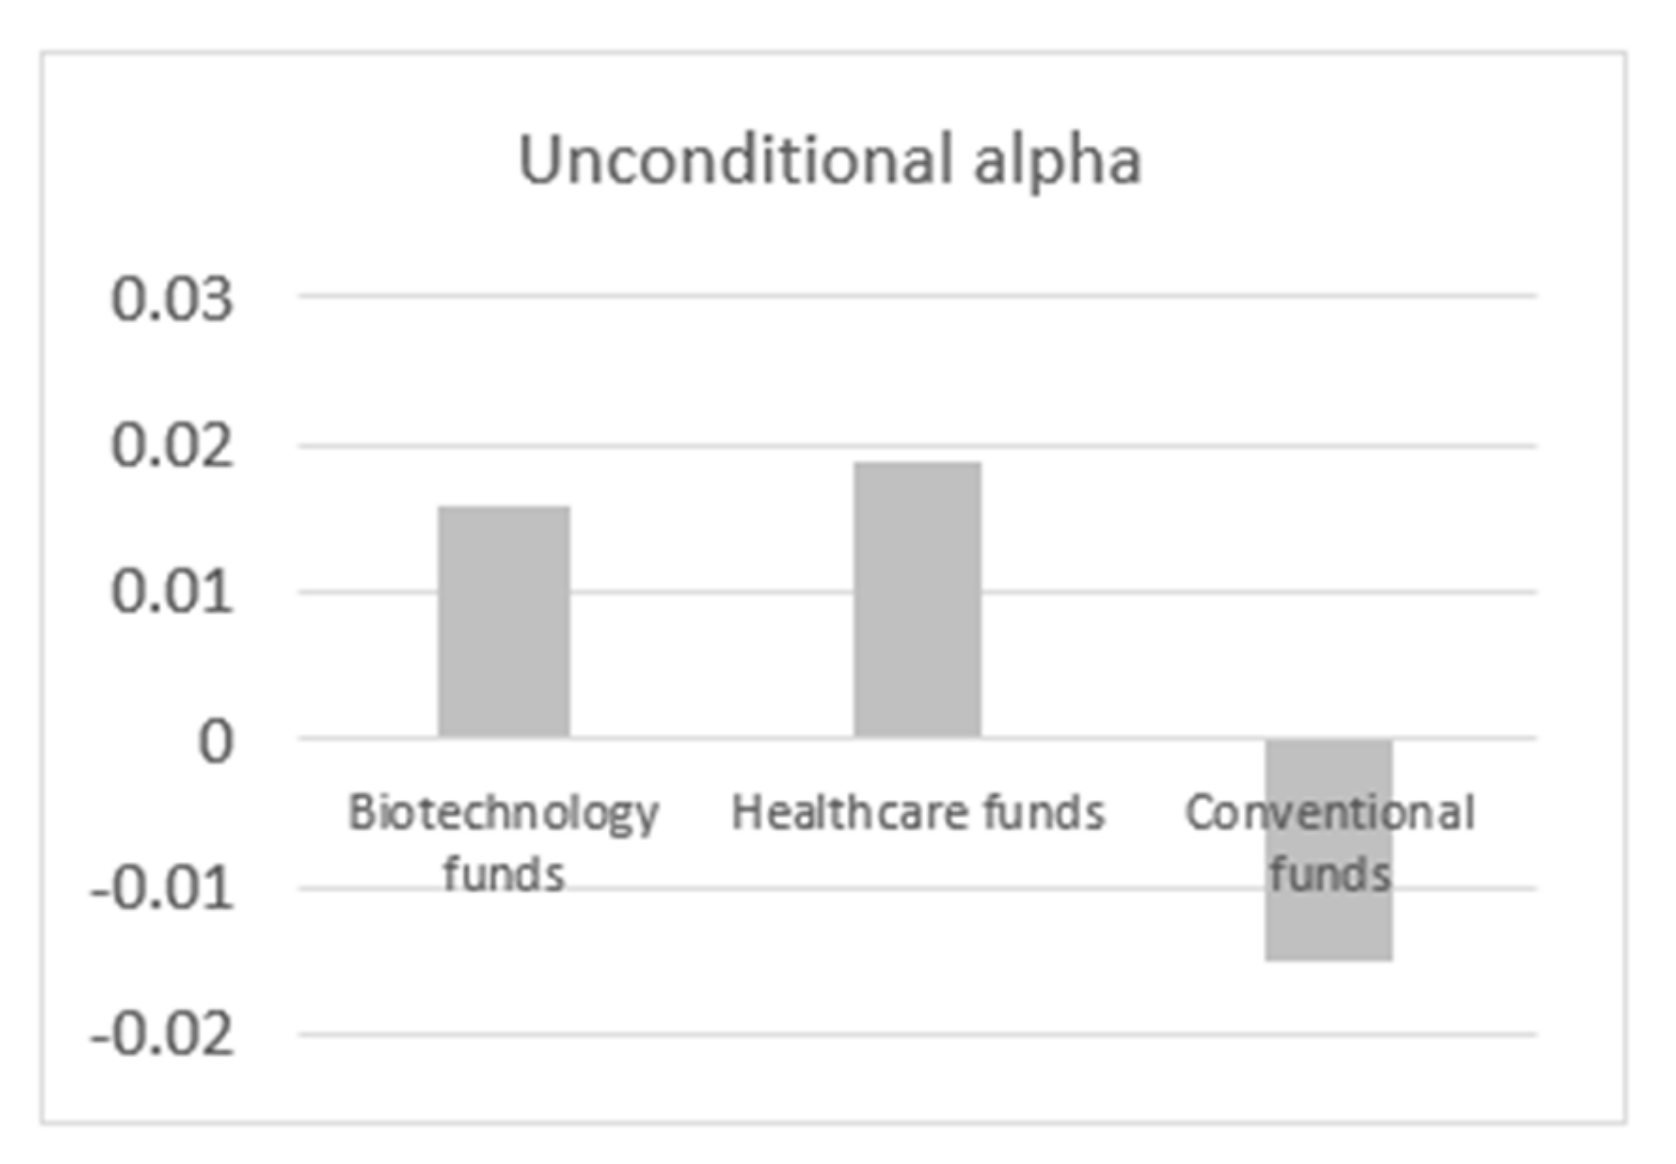
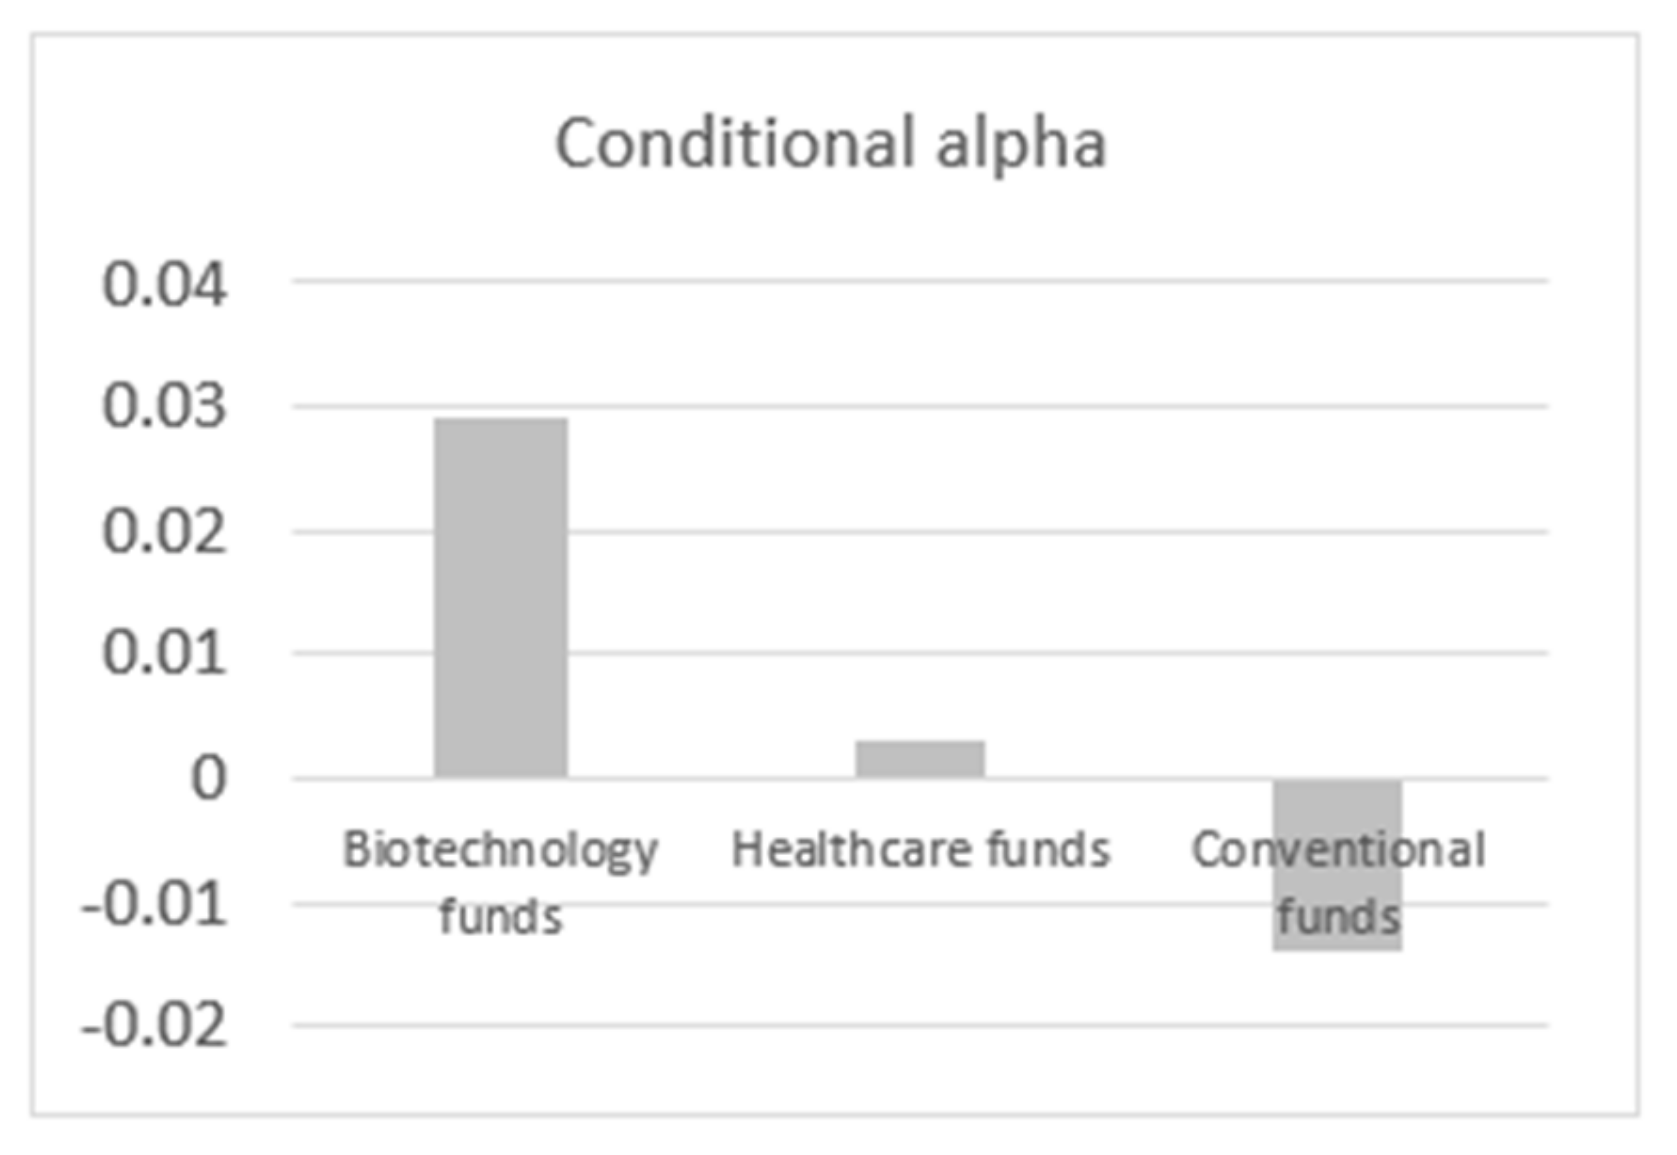
4.1. Financial Performance of Biotechnology, Healthcare, and Conventional Mutual Funds
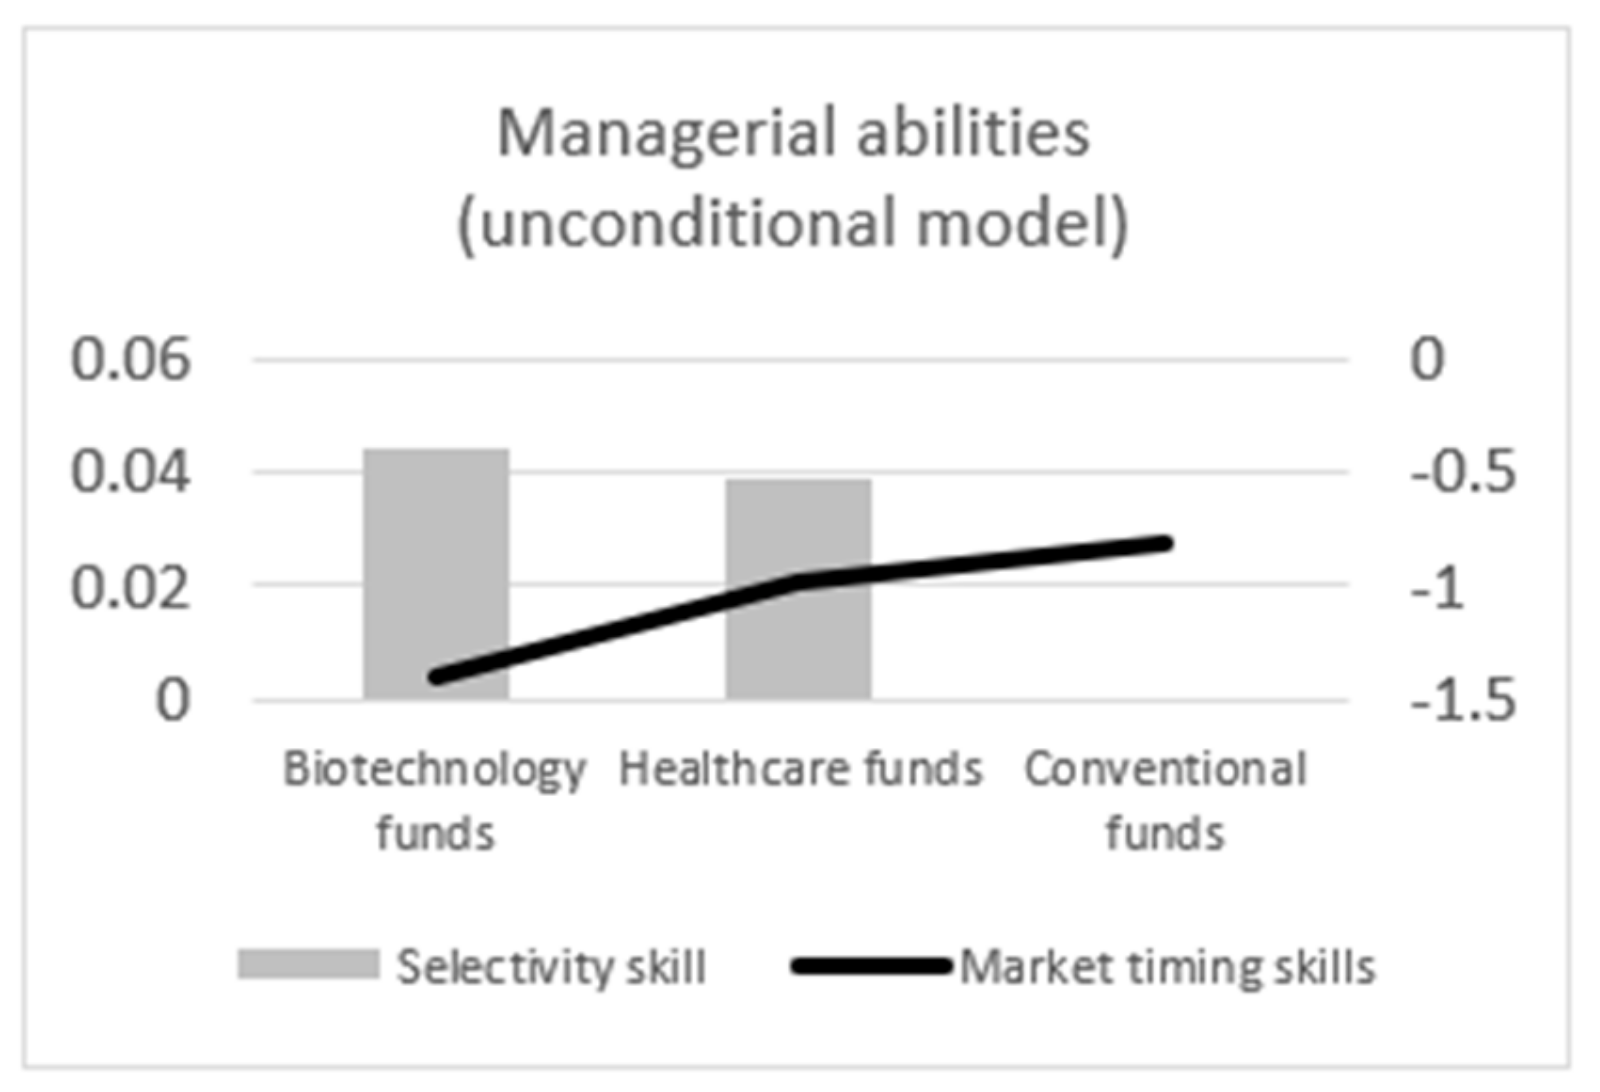
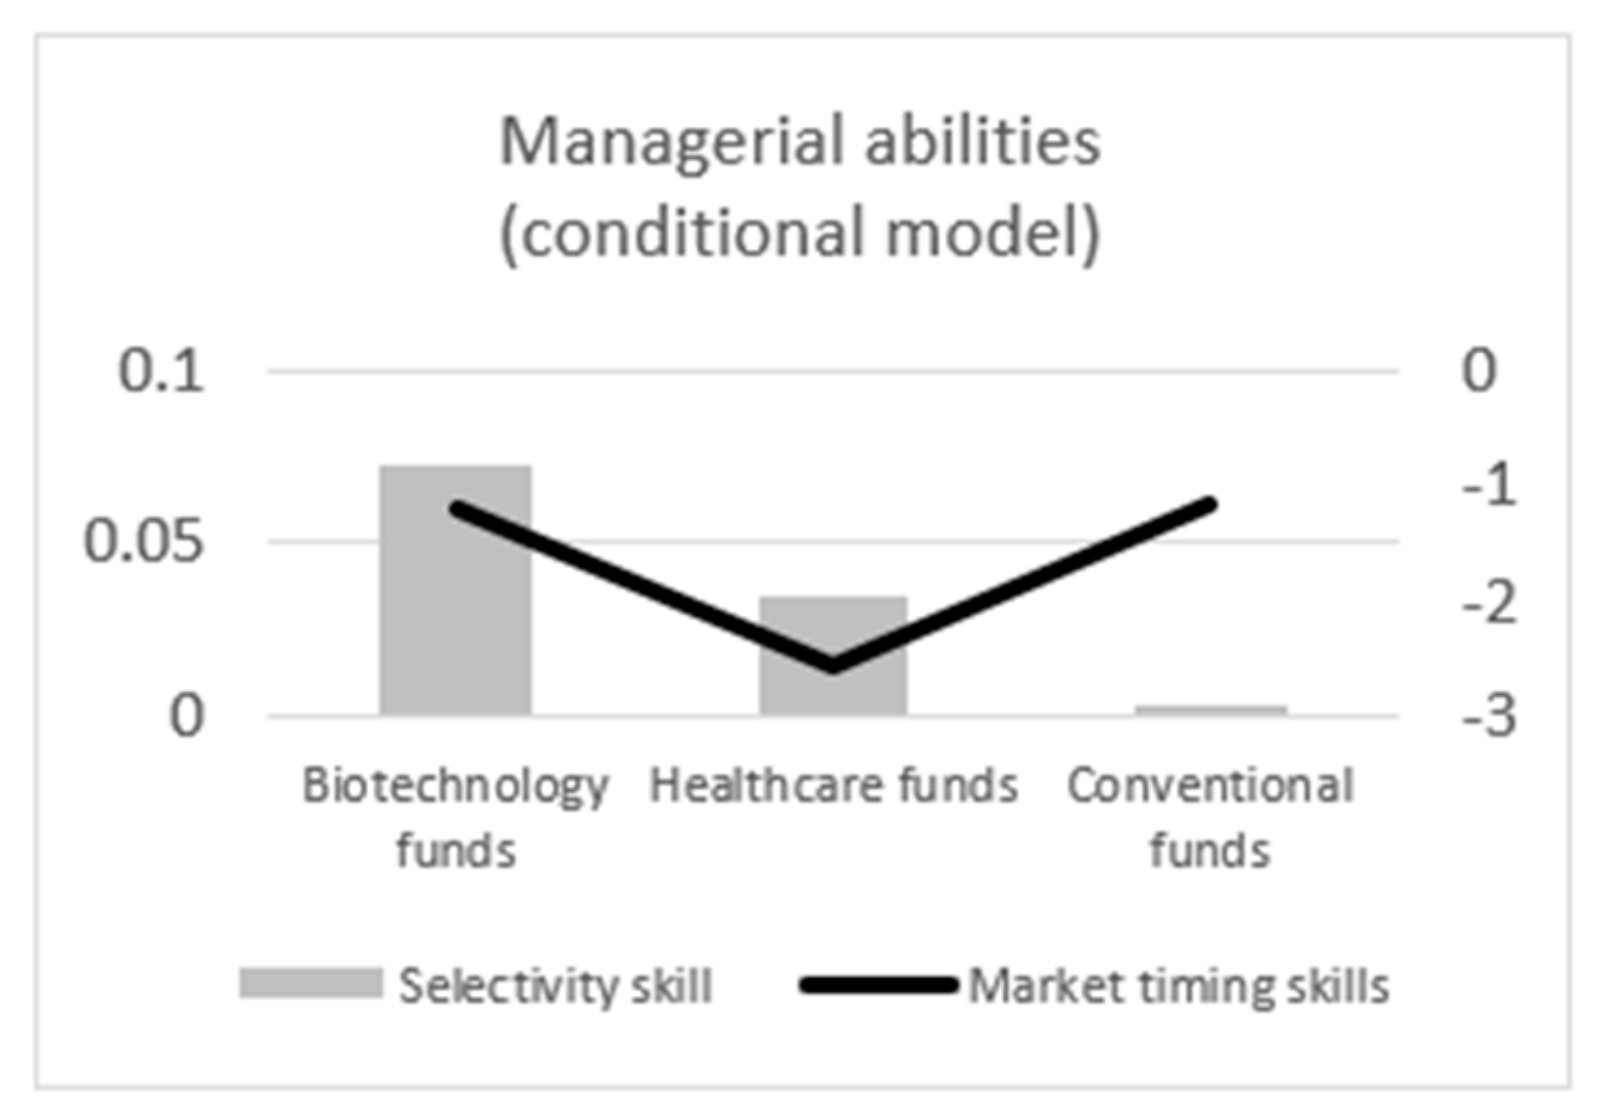
4.2. Managerial Skills for Biotechnology, Healthcare, and Conventional Mutual Funds
5. Conclusions
5.1. Implications for Policy Maker
5.2. Implications for The Public
5.3. Limitations of This Study
Funding
Acknowledgments
Conflicts of Interest
Appendix A
References
- Alvarez, M.; Rodríguez, J. Water-related mutual funds: Investment performance and social role. Soc. Responsib. J. 2015, 11, 502–512. [Google Scholar] [CrossRef]
- Ibikunle, G.; Steffen, T. European green mutual fund performance: A comparative analysis with their conventional and black peers. J. Bus. Ethics 2017, 145, 337–355. [Google Scholar] [CrossRef] [Green Version]
- Reboredo, J.C.; Quintela, M.; Otero, L.A. Do investors pay a premium for going green? Evidence from alternative energy mutual funds. Renew. Sustain. Energy Rev. 2017, 73, 512–520. [Google Scholar] [CrossRef]
- Martí-Ballester, C.P. The role of mutual funds in the sustainable energy sector. Bus. Strategy Environ. 2019, 28, 1107–1120. [Google Scholar] [CrossRef]
- Martí-Ballester, C.P. Do European renewable energy mutual funds foster the transition to a low-carbon economy? Renew. Energy 2019, 143, 1299–1309. [Google Scholar] [CrossRef]
- Martí-Ballester, C.P. Analysing Alternative Energy Mutual Fund Performance in the Spanish Market. In Energy Sustainability in Built and Urban Environments; Springer: Singapore, 2019; pp. 201–213. [Google Scholar]
- Ielasi, F.; Rossolini, M. Responsible or Thematic? The True Nature of Sustainability-Themed Mutual Funds. Sustainability 2019, 11, 3304. [Google Scholar] [CrossRef] [Green Version]
- Eurosif. European SRI Study 2018. Available online: http://www.eurosif.org/wp-content/uploads/2018/11/European-SRI-2018-Study.pdf (accessed on 30 January 2020).
- Eurosif. SDGs for SRI investors. Available online: http://www.eurosif.org/wp-content/uploads/2018/01/Eurosif-SDGs-brochure.pdf (accessed on 30 January 2020).
- Thakor, R.T.; Anaya, N.; Zhang, Y.; Vilanilam, C.; Siah, K.W.; Wong, C.H.; Lo, A.W. Just how good an investment is the biopharmaceutical sector? Nat. Biotechnol. 2017, 35, 1149. [Google Scholar] [CrossRef]
- Ferreira, M.A.; Keswani, A.; Miguel, A.F.; Ramos, S.B. The determinants of mutual fund performance: A cross-country study. Rev. Financ. 2013, 17, 483–525. [Google Scholar] [CrossRef] [Green Version]
- Ferson, W.; Mo, H. Performance measurement with selectivity, market and volatility timing. J. Financ. Econ. 2016, 121, 93–110. [Google Scholar] [CrossRef]
- Markowitz, H. Portfolio selection. J. Financ. 1952, 7, 77–91. [Google Scholar]
- Solnik, B.H. Why not diversify internationally rather than domestically? Financ. Anal. J. 1995, 51, 89–94. [Google Scholar] [CrossRef]
- Abuduxike, G.; Aljunid, S.M. Development of health biotechnology in developing countries: Can private-sector players be the prime movers? Biotechnol. Adv. 2012, 30, 1589–1601. [Google Scholar] [CrossRef] [PubMed]
- Chunhua, L.; Moneta, F.; Wermers, R. Mutual Fund Investment Horizon and Performance. 2015. Available online: https://www.econstor.eu/bitstream/10419/113656/1/833265369.pdf. (accessed on 1 September 2019).
- Lalor, F.; Fitzpatrick, J.; Sage, C.; Byrne, E. Sustainability in the biopharmaceutical industry: Seeking a holistic perspective. Biotechnol. Adv. 2019, 37, 698–707. [Google Scholar] [CrossRef] [PubMed]
- Walsh, G. Biopharmaceutical benchmarks. Nat. Biotechnol. 2014, 32, 992. [Google Scholar]
- Hong, M.S.; Severson, K.A.; Jiang, M.; Lu, A.E.; Love, J.C.; Braatz, R.D. Challenges and opportunities in biopharmaceutical manufacturing control. Comput. Chem. Eng. 2018, 110, 106–114. [Google Scholar] [CrossRef]
- Shin, K.; Choy, M.; Lee, C.; Park, G. Government R&D Subsidy and Additionality of Biotechnology Firms: The Case of the South Korean Biotechnology Industry. Sustainability 2019, 11, 1583. [Google Scholar]
- Vondeling, G.T.; Cao, Q.; Postma, M.J.; Rozenbaum, M.H. The impact of patent expiry on drug prices: A systematic literature review. Appl. Health Econ. Health Policy 2018, 16, 653–660. [Google Scholar] [CrossRef] [Green Version]
- Cooper, Z.; Gibbons, S.; Skellern, M. Does competition from private surgical centres improve public hospitals’ performance? Evidence from the English National Health Service. J. Public Econ. 2018, 166, 63–80. [Google Scholar] [CrossRef]
- Lin, H.C.; Kao, S.; Wen, H.C.; Wu, C.S.; Chung, C.L. Length of stay and costs for asthma patients by hospital characteristics—A five-year population-based analysis. J. Asthma 2005, 42, 537–542. [Google Scholar] [CrossRef]
- Woolhandler, S.; Campbell, T.; Himmelstein, D.U. Costs of health care administration in the United States and Canada. New Engl. J. Med. 2003, 349, 768–775. [Google Scholar] [CrossRef] [Green Version]
- Bel, G.; Esteve, M. Is Private Production of Hospital Services Cheaper than Public Production? A Meta-Regression of Public Versus Private Costs and Efficiency for Hospitals. Int. Public Manag. 2019. [Google Scholar] [CrossRef]
- García-Cornejo, B.; Pérez-Méndez, J.A. Assessing the effect of standardized cost systems on financial performance. A difference-in-differences approach for hospitals according to their technological level. Health Policy 2018, 122, 396–403. [Google Scholar] [CrossRef] [PubMed]
- Irwin, J.G.; Hoffman, J.J.; Lamont, B.T. The effect of the acquisition of technological innovations on organizational performance: A resource-based view. J. Eng. Technol. Manag. 1998, 15, 25–54. [Google Scholar] [CrossRef]
- Simou, E.; Koutsogeorgou, E. Effects of the economic crisis on health and healthcare in Greece in the literature from 2009 to 2013: A systematic review. Health Policy 2014, 115, 111–119. [Google Scholar] [CrossRef] [Green Version]
- Nofsinger, J.; Varma, A. Socially responsible funds and market crises. J. Bank. Financ. 2014, 48, 180–193. [Google Scholar] [CrossRef]
- Carhart, M.M. On persistence in mutual fund performance. J. Financ. 2014, 52, 57–82. [Google Scholar] [CrossRef]
- Newey, W.K.; West, K.D. A Simple, Positive Semi-Definite, Heteroskedasticity and Autocorrelation Consistent Covariance Matrix. Econometrica 1987, 55, 703–708. [Google Scholar] [CrossRef]
- Ferson, W.E.; Schadt, R.W. Measuring fund strategy and performance in changing economic conditions. J. Financ. 1996, 51, 425–461. [Google Scholar] [CrossRef]
- Christopherson, J.A.; Ferson, W.E.; Glassman, D.A. Conditioning manager alphas on economic information: Another look at the persistence of performance. Rev. Financ. Stud. 1998, 11, 111–142. [Google Scholar] [CrossRef]
- Silva, F.; Cortez, M.C. The performance of US and European green funds in different market conditions. J. Clean. Prod. 2016, 135, 558–566. [Google Scholar] [CrossRef]
- Bollen, N.P.; Busse, J.A. On the timing ability of mutual fund managers. J. Financ. 2001, 56, 1075–1094. [Google Scholar] [CrossRef]
- Treynor, J.; Mazuy, K. Can mutual funds outguess the market. Harv. Bus. Rev. 1966, 44, 131–136. [Google Scholar]
- Martí-Ballester, C.P. Examining the financial performance of pension funds focused on sectors related to sustainable development goals. Int. J. Sustain. Dev. World Ecol. 2020, 27, 179–191. [Google Scholar] [CrossRef]
- Mitropoulos, P. Production and quality performance of healthcare services in EU countries during the economic crisis. Oper. Res. 2019. [Google Scholar] [CrossRef]
- Cao, D.; Long, W.; Yang, W. Sector indices correlation analysis in China’s stock market. Procedia Comput. Sci. 2013, 17, 1241–1249. [Google Scholar] [CrossRef] [Green Version]

| Category | Return | Standard Deviation | TNA ($ Millions) | TER | Number of Funds | Of Which are Active |
|---|---|---|---|---|---|---|
| Biotechnology | 0.059 | 0.014 | 97.837 | 2.196 | 34 | 25 |
| Healthcare | 0.057 | 0.011 | 126.916 | 1.886 | 178 | 151 |
| Conventional | 0.019 | 0.011 | 174.680 | 1.655 | 4352 | 3049 |
| Full sample | 0.021 | 0.011 | 172.237 | 1.668 | 4564 | 3225 |
| Variable | Type of Variable | Database |
|---|---|---|
| Mutual fund category Biotechnology Healthcare Conventional | Independent variables (t-Student test) | Lipper Global (EIKON) |
| Rf,t | Dependent variable (Models 1–4) | Datastream (funds’ raw returns) Kenneth French’s website (one-month Treasury bill return) |
| Rm,t | Independent variable (Models 1–4) | Datastream (benchmarks) Kenneth French’s website (one-month Treasury bill return) |
| SMB HML WML | Control variables (Models 1–4) | Kenneth French’s website |
| Zt−1 Constant-maturity 3-month US Treasury Bill Moody’s AAA-rated corporate bond yield Moody’s BAA-rated corporate bond yield | Moderating variables (Models 2 and 4) | Federal Reserve Bank of St Louis |
| Financial performance αf (Models 1–2) αf (Models 3–4) βm,f2 (Models 3–4) | Dependent variables (t-Student test) | From Models 1–4 |
| Panel A | Alpha | Benchmark | SMB | HML | WML | R-squared |
|---|---|---|---|---|---|---|
| Biotechnology (1) | ||||||
| Mean | 0.016 | 0.686 | 0.522 | −0.560 | −0.074 | 0.259 |
| Std dev | 0.060 | 0.349 | 0.507 | 0.537 | 0.166 | 0.194 |
| Max | 0.159 | 1.451 | 1.767 | 0.172 | 0.160 | 0.585 |
| Min | −0.146 | 0.159 | −0.101 | −1.711 | −0.541 | 0.010 |
| No. of +/0/− estimates | 2/32/0 | 34/0/0 | 25/9/0 | 1/9/24 | 7/17/10 | |
| Healthcare (2) | ||||||
| Mean | 0.019 | 0.610 | 0.376 | −0.312 | −0.010 | 0.363 |
| Std dev | 0.049 | 0.254 | 0.504 | 0.357 | 0.120 | 0.234 |
| Max | 0.192 | 1.072 | 2.012 | 0.240 | 0.229 | 0.718 |
| Min | −0.184 | −0.036 | −0.267 | −1.341 | −0.393 | 0.001 |
| No. of +/0/− estimates | 22/152/4 | 172/6/0 | 105/44/29 | 11/53/114 | 54/89/35 | |
| Conventional funds (3) | ||||||
| Mean | −0.015 | 0.657 | 0.433 | 0.062 | −0.056 | 0.418 |
| Std dev | 0.050 | 0.312 | 0.437 | 0.199 | 0.130 | 0.292 |
| Max | 0.419 | 1.639 | 3.334 | 1.965 | 1.241 | 0.965 |
| Min | −1.156 | −0.248 | −1.594 | −1.844 | −1.912 | 0.000 |
| No. of +/0/− estimates | 50/3617/685 | 4176/147/29 | 3284/747/321 | 1693/1962/697 | 502/2164/1686 | |
| Panel B | Student-t test | |||||
| Biotechnology vs. (2) | 0.308 | |||||
| Biotechnology vs. (3) | 3.014 | *** | ||||
| Healthcare vs. (3) | 0.161 | *** | ||||
| Panel A | Alpha | Benchmark | SMB | HML | WML | R-squared |
|---|---|---|---|---|---|---|
| Biotechnology | ||||||
| Mean | 0.029 | 0.705 | 0.426 | −0.834 | −0.251 | 0.288 |
| Std dev | 0.077 | 0.340 | 0.573 | 0.812 | 0.448 | 0.192 |
| Max | 0.224 | 1.323 | 1.818 | 0.761 | 0.172 | 0.593 |
| Min | −0.107 | 0.144 | −0.569 | −2.646 | −2.210 | 0.020 |
| No. of +/0/− estimates | 2/32/0 | 32/2/0 | 18/15/1 | 0/7/27 | 1/22/11 | |
| Healthcare | ||||||
| Mean | 0.003 | 0.613 | 0.308 | −0.405 | −0.024 | 0.382 |
| Std dev | 0.088 | 0.327 | 0.564 | 0.503 | 0.249 | 0.236 |
| Max | 0.391 | 1.627 | 1.685 | 0.659 | 1.682 | 0.728 |
| Min | −0.411 | −1.211 | −1.309 | −2.077 | −0.979 | 0.011 |
| No. of +/0/− estimates | 17/154/7 | 164/13/1 | 86/55/37 | 7/59/112 | 27/112/39 | |
| Conventional funds | ||||||
| Mean | −0.014 | 0.664 | 0.394 | −0.008 | −0.066 | 0.443 |
| Std dev | 0.094 | 0.330 | 0.467 | 0.265 | 0.204 | 0.290 |
| Max | 1.832 | 3.225 | 5.448 | 4.135 | 2.086 | 0.966 |
| Min | −2.793 | −1.226 | −1.781 | −3.382 | −1.775 | 0.000 |
| No. of +/0/− estimates | 64/3658/630 | 4034/289/29 | 2983/951/418 | 883/2517/952 | 408/1962/1982 | |
| Panel B | Student-t test | |||||
| Biotechnology vs. (2) | −1.581 | |||||
| Biotechnology vs. (3) | 2.645 | *** | ||||
| Healthcare vs. (3) | 2.533 | ** | ||||
| Panel A | Alpha | Benchmark | SMB | HML | WML | Benchmark 2 | R-squared |
|---|---|---|---|---|---|---|---|
| Biotechnology | |||||||
| Mean | 0.044 | 0.678 | 0.512 | −0.559 | −0.073 | −1.390 | 0.260 |
| Std dev | 0.073 | 0.349 | 0.504 | 0.538 | 0.167 | 2.724 | 0.193 |
| Max | 0.191 | 1.411 | 1.741 | 0.177 | 0.160 | 5.671 | 0.585 |
| Min | −0.186 | 0.149 | −0.130 | −1.719 | −0.542 | −8.982 | 0.011 |
| No. of +/0/− estimates | 7/27/0 | 34/0/0 | 25/8/1 | 1/9/24 | 7/17/10 | 0/27/7 | |
| Healthcare | |||||||
| Mean | 0.039 | 0.604 | 0.369 | −0.312 | −0.009 | −0.977 | 0.364 |
| Std dev | 0.067 | 0.257 | 0.504 | 0.357 | 0.120 | 2.301 | 0.234 |
| Max | 0.310 | 1.068 | 2.015 | 0.244 | 0.230 | 6.049 | 0.719 |
| Min | −0.185 | −0.041 | −0.276 | −1.341 | −0.393 | −10.898 | 0.005 |
| No. of +/0/− estimates | 58/117/3 | 171/7/0 | 104/44/30 | 11/53/114 | 54/90/34 | 2/149/27 | |
| Conventional funds | |||||||
| Mean | 0.000 | 0.651 | 0.428 | 0.062 | −0.056 | −0.808 | 0.420 |
| Std dev | 0.069 | 0.314 | 0.435 | 0.199 | 0.130 | 2.705 | 0.291 |
| Max | 0.507 | 1.811 | 3.434 | 1.983 | 1.244 | 41.183 | 0.966 |
| Min | −1.629 | −0.274 | −1.566 | −1.808 | −1.923 | −27.811 | 0.000 |
| No. of +/0/− estimates | 241/3719/392 | 4160/162/30 | 3266/745/341 | 1711/1942/699 | 509/2147/1696 | 97/3585/670 | |
| Panel B | Selectivity skills | Market timing skill | |||||
| Student-t test | Student-t test | ||||||
| Biotechnology vs. (2) | −0.437 | 0.925 | |||||
| Biotechnology vs. (3) | 3.744 | *** | −1.249 | ||||
| Healthcare vs. (3) | 7.551 | *** | −0.821 | ||||
| Panel A | Alpha | Benchmark | SMB | HML | WML | Benchmark 2 | R-squared |
|---|---|---|---|---|---|---|---|
| Biotechnology | |||||||
| Mean | 0.072 | 0.689 | 0.426 | −0.846 | −0.260 | −1.188 | 0.291 |
| Std dev | 0.137 | 0.347 | 0.572 | 0.810 | 0.463 | 6.846 | 0.191 |
| Max | 0.472 | 1.342 | 1.801 | 0.652 | 0.175 | 16.701 | 0.594 |
| Min | −0.262 | −0.031 | −0.519 | −2.650 | −2.319 | −31.690 | 0.023 |
| No. of +/0/− estimates | 5/29/0 | 32/2/0 | 18/15/1 | 0/7/27 | 1/20/13 | 2/26/6 | |
| Healthcare | |||||||
| Mean | 0.035 | 0.600 | 0.308 | −0.410 | −0.029 | −2.544 | 0.385 |
| Std dev | 0.129 | 0.326 | 0.564 | 0.503 | 0.249 | 12.322 | 0.236 |
| Max | 0.880 | 1.337 | 1.690 | 0.646 | 1.692 | 14.720 | 0.730 |
| Min | −0.348 | −1.212 | −1.278 | −2.071 | −0.976 | −98.445 | 0.011 |
| No. of +/0/− estimates | 48/123/7 | 163/15/0 | 85/55/38 | 8/57/113 | 26/111/41 | 12/129/37 | |
| Conventional funds | |||||||
| Mean | 0.003 | 0.656 | 0.393 | −0.010 | −0.066 | −1.154 | 0.446 |
| Std dev | 0.133 | 0.333 | 0.465 | 0.267 | 0.206 | 9.044 | 0.289 |
| Max | 2.329 | 3.347 | 5.648 | 4.342 | 2.465 | 40.220 | 0.966 |
| Min | −3.163 | −1.295 | −1.804 | −3.416 | −1.759 | −261.395 | 0.000 |
| No. of +/0/− estimates | 316/3455/581 | 3991/331/30 | 2986/936/430 | 882/2508/962 | 410/1965/1977 | 342/3474/536 | |
| Panel B | Selectivity skills | Market timing skill | |||||
| Student-t test | Student-t test | ||||||
| Biotechnology vs. (2) | −1.506 | −0.621 | |||||
| Biotechnology vs. (3) | 3.036 | *** | −0.021 | ||||
| Healthcare vs. (3) | 3.212 | *** | −1.484 | ||||
© 2020 by the author. Licensee MDPI, Basel, Switzerland. This article is an open access article distributed under the terms and conditions of the Creative Commons Attribution (CC BY) license (http://creativecommons.org/licenses/by/4.0/).
Share and Cite
Martí-Ballester, C.-P. Financial Performance of SDG Mutual Funds Focused on Biotechnology and Healthcare Sectors. Sustainability 2020, 12, 2032. https://doi.org/10.3390/su12052032
Martí-Ballester C-P. Financial Performance of SDG Mutual Funds Focused on Biotechnology and Healthcare Sectors. Sustainability. 2020; 12(5):2032. https://doi.org/10.3390/su12052032
Chicago/Turabian StyleMartí-Ballester, Carmen-Pilar. 2020. "Financial Performance of SDG Mutual Funds Focused on Biotechnology and Healthcare Sectors" Sustainability 12, no. 5: 2032. https://doi.org/10.3390/su12052032
APA StyleMartí-Ballester, C.-P. (2020). Financial Performance of SDG Mutual Funds Focused on Biotechnology and Healthcare Sectors. Sustainability, 12(5), 2032. https://doi.org/10.3390/su12052032