Article

Interpreting the Sustainable Development of Human Capital and the Sheepskin Effects in Returns to Higher Education: Empirical Evidence from Pakistan

1
College of Public Administration, Nanjing Agricultural University, Nanjing 210095, China
2
College of Land Management, Nanjing Agricultural University, Nanjing 210095, China
*
Author to whom correspondence should be addressed.
Sustainability 2020, 12(6), 2393; https://doi.org/10.3390/su12062393
Submission received: 9 January 2020 / Revised: 20 February 2020 / Accepted: 25 February 2020 / Published: 19 March 2020
(This article belongs to the Special Issue Economics of Education and Sustainable Development)

Abstract

:
According to poststructuralists, workers with higher level of education and possession of potential experience are supposed to have higher wages. Yet, there are plausible questions that arise as to what levels of education or work history are needed for the enhancement of wage discrimination. Additionally, the outcomes arising from rehashing years of schooling are worth considering. We used a several methods, employing the administrative Household Integrated Economic Survey (HIES) data from Pakistan without ignoring environmental effects. Our estimated results support the conventional assumptions of linearity of log-wage. First, we found substantial returns for postgraduate diploma holders in both public and private sectors, even after controlling the individual’s heterogeneity. Second, we did notice a significant divergence in return to low-level education (LLE) and job history. Third, rehashing years of education may create suspiciousness regarding the lack of competence. Our results suggest that continuous investment in human capital toward postgraduate diploma may result in higher premiums.

1. Introduction

The economic theory emphasizes that individuals who possess higher education diplomas are likely to earn more. While it is not solely education that makes them productive, it does identify them as being productive with accreditation, which is called the sheepskin effect (diploma). A huge and growing literature base has cited a positive relationship between education and its outcomes; for example, scholars [1,2,3,4,5,6] reported the compensation from human capital investment in schooling, which is insufficient for theoretical contribution. However, there are more debates and unresoved research issues that need more explanation on how the level of education may affect wage. Without necessarily invoking a theoretical standpoint, it is an unquestionable empirical fact that high-level educated (HLE) workers are generally paid more compared to their low-level educated (LLE) cohorts. Similarly, the individual’s marginal productivity tends to differ by occupation in earnings in the labor market. However, employers rely on proxies of accumulated diplomas, as it is difficult to observe the productive capacity of employees by screening their behavior or attitude.
A theoretical framework reflects an internal connection between these theories, providing the most likely mechanism for employers, called sheepskin (diploma or certificate) effects. For example, the level of education has an impact on outcomes with an institutional setting, considering evidence of existing sheepskin effects. The Norweigan tourism industry [7] reported the net profit value for accumulated schooling years with exceptional returns. Another Spanish study [8] implicates that secondary education diploma holders enjoy higher premiums in the private sector, while the tertiary diploma holders enjoy higher premiums in the public sector.
According to the human capital theory, the accumulation of schooling can reflect the ability of a workforce by conveying knowledge and skills in the labor market [9,10]. The human capital theory explains the nature of the causal relationship between schooling and throughput by providing theoretical justifications for the earnings which are linearly related to specific mechanism of schooling levels. Moreover, education enhances the worker’s productivity through the amplification of their inherent capacity and installation of applicable expertness [3]. The leading empirical suppliance of the human capital theory is executed by demonstrating that earnings vary linearly with schooling years and labor market work experience [11].
The prospective study seeks to explore wage discrimination in terms of how the nonlinearity of academic qualification and acquired experience create variation in the market. We differentiated schooling achievements in two dimensions: years of education and earnings relation, that is, earnings experience, as a quadratic function where the square of experience is related to employment history (as experience is the concave function). On the other hand, [12,13] reported the individuals’ outcome differences based on their obtained schooling diplomas. In doing so, they showed that the acknowledgment of diplomas (sheepskin effects) is related to earnings by controlling the years of education. Most scholars have underestimated this relationship, such as the frequent measurement related with acquired and rehashed years of education. It is also worth considering the pure human capital function, in which the logarithm of earning is regressed on constant education, job history in the labor market and other control conditions [14].
It is challenging for an employer to make a direct hypothesis for high or low productivity of an employee by considering their innate ability and cognitive skills. However, entry to the market for an employee requires a productivity signal, which is exactly how sheepskin (diploma) works as a signaling device. In places unlike France, where schooling years are frequently repeated (more than 50% of students retake a year in some discipline), individuals who repeat schooling years are probably considered as owning less intellectual capital. Such measurements are worthless in countries where individuals get priority for repeating years of schooling instead of obtaining specified diploma years. In Figure 1, a description of wage distribution for all designed levels of diplomas is given, where the slope of wage increases step by step with each level of schooling. Kindergarten can formulate a greater capacity for cumulative ability in the preliminary years of schooling.
Previous pieces of evidence in the literature, that considered sheepskin effects [15,16] reported a great upsurge in returns related to schooling years, such as at twelve years (higher secondary) and sixteen years (graduation). The deficiency of extant studies is that the data did not categorize the graduate and dropout students; also, they have ignored the regional effects. However, first, we identified the dominance of sheepskin effects, primarily from log earning deviations between the diploma completers and incompleters by the attainment of dissimilar years of schooling. Second, we identified the outcomes of rehashing schooling years. Third, we identified the different outcomes of work history along with schooling by using multidimensional data measurement over time. Moreover, we believe that all regions are not parallel, which is a significant limitation.
The next section presents the interpretation of sheepskin effects; Section 3: human capital investment toward wage distribution; Section 4: data description; Section 5: results; Section 6: discussion: Section 7: conclusion: and Section 8: policy recommendation.

2. Interpreting Convexity of Sheepskin Effects

Very few studies have addressed the existence of sheepskin effects in Pakistan. Partial evidence [17] suggested that higher premiums are related to a completed primary diploma as compared to an incomplete primary diploma. However, this evidence only supports the existing primary diploma at the restricted dataset for the assessment of a private rate of returns. Moreover, the above evidence declares paucity of study, which constitutes an inappropriate dataset of an individual’s education.
The circumstances for non-developed countries are not exceptionally different from the conditions of Pakistan, when it comes to unambiguous breakdowns of the effects of diploma. In general, very few studies have been conducted on the issue in non-developed countries. A Malaysian study [18] reported that university dropouts are able to get higher rate of returns than post-secondary diploma holders because dropouts invest more years in schooling and consequently earning rates become higher for them. Nevertheless, it is acknowledged that university dropouts accumulate more cognitive skills and knowledge due to more investment in human capital compared to secondary schooling. However, it might be an incompatible implication that they can earn higher rate of returns compared to their university cohorts. Another Philippine study revealed that sheepskin returns are substantially significant for only tertiary diploma holders [19].
The signaling hypothesis interprets that schooling is not only a tool that can enhance the workforce’s productivity, but it also serves as an existing tool for the employer to sort out employability. However, it is difficult to comprehend directly in the labor market that a signal had taken place. The findings regarding sheepskin or diploma effects on the cornerstone of worker’s earnings are endorsements that signaling occurs.
Several scholars have determined the workforce’s (log) earnings by inspecting the role of sheepskin effects. For the most part, these analyses provided backup for the perception of sheepskin effects. The simplified punctuated spline function allows the stipulation of the altered rate of return to contrasting years of schooling and dissimilar returns to diploma years. These three studies [15,16,20] are primarily applicable to our research.
Many revisions have not observed the tenacity of sheepskin effects in statistical discriminations because they have endeavored to assess whether sheepskins occur in the countries. For example, Denny and Harmon [21] determined the sheepskin effects for two continents’ five nations, which are the U.S, Canada, Ireland, Great Britain, and Sweden. [1] Established a suggestion that the impact of sheepskin in the Canadian labor market is associated with the attainment of course credit hours after controlling educational inputs.
It is noticed that sheepskin effects are in a harmonious format with the notion of signaling, and these are also compatible with the explanation of the human capital theory. In the Midwestern United States, an Ohio state’s scholar [22] found substantial returns for college diploma holders, who were considered as more proficient learners compared to those who did not complete college. Another study [23] estimated a female’s primary education has a sole impact on fertility and survival of children and moderated effects of quality educational returns from the investment on human capital. The human capital hypothesis [24] observed the different outcomes between the early entrants and late entrants, who were holding diplomas that comprised year-wise courses in a peculiar area. Henceforth, there is no doubt that productive skills are needed for the sustainable development of a firm, which is a key determinant of a country’s internationalization competitiveness in the rapidly growing world economy [6].

3. Human Capital Investment toward Wage Distribution

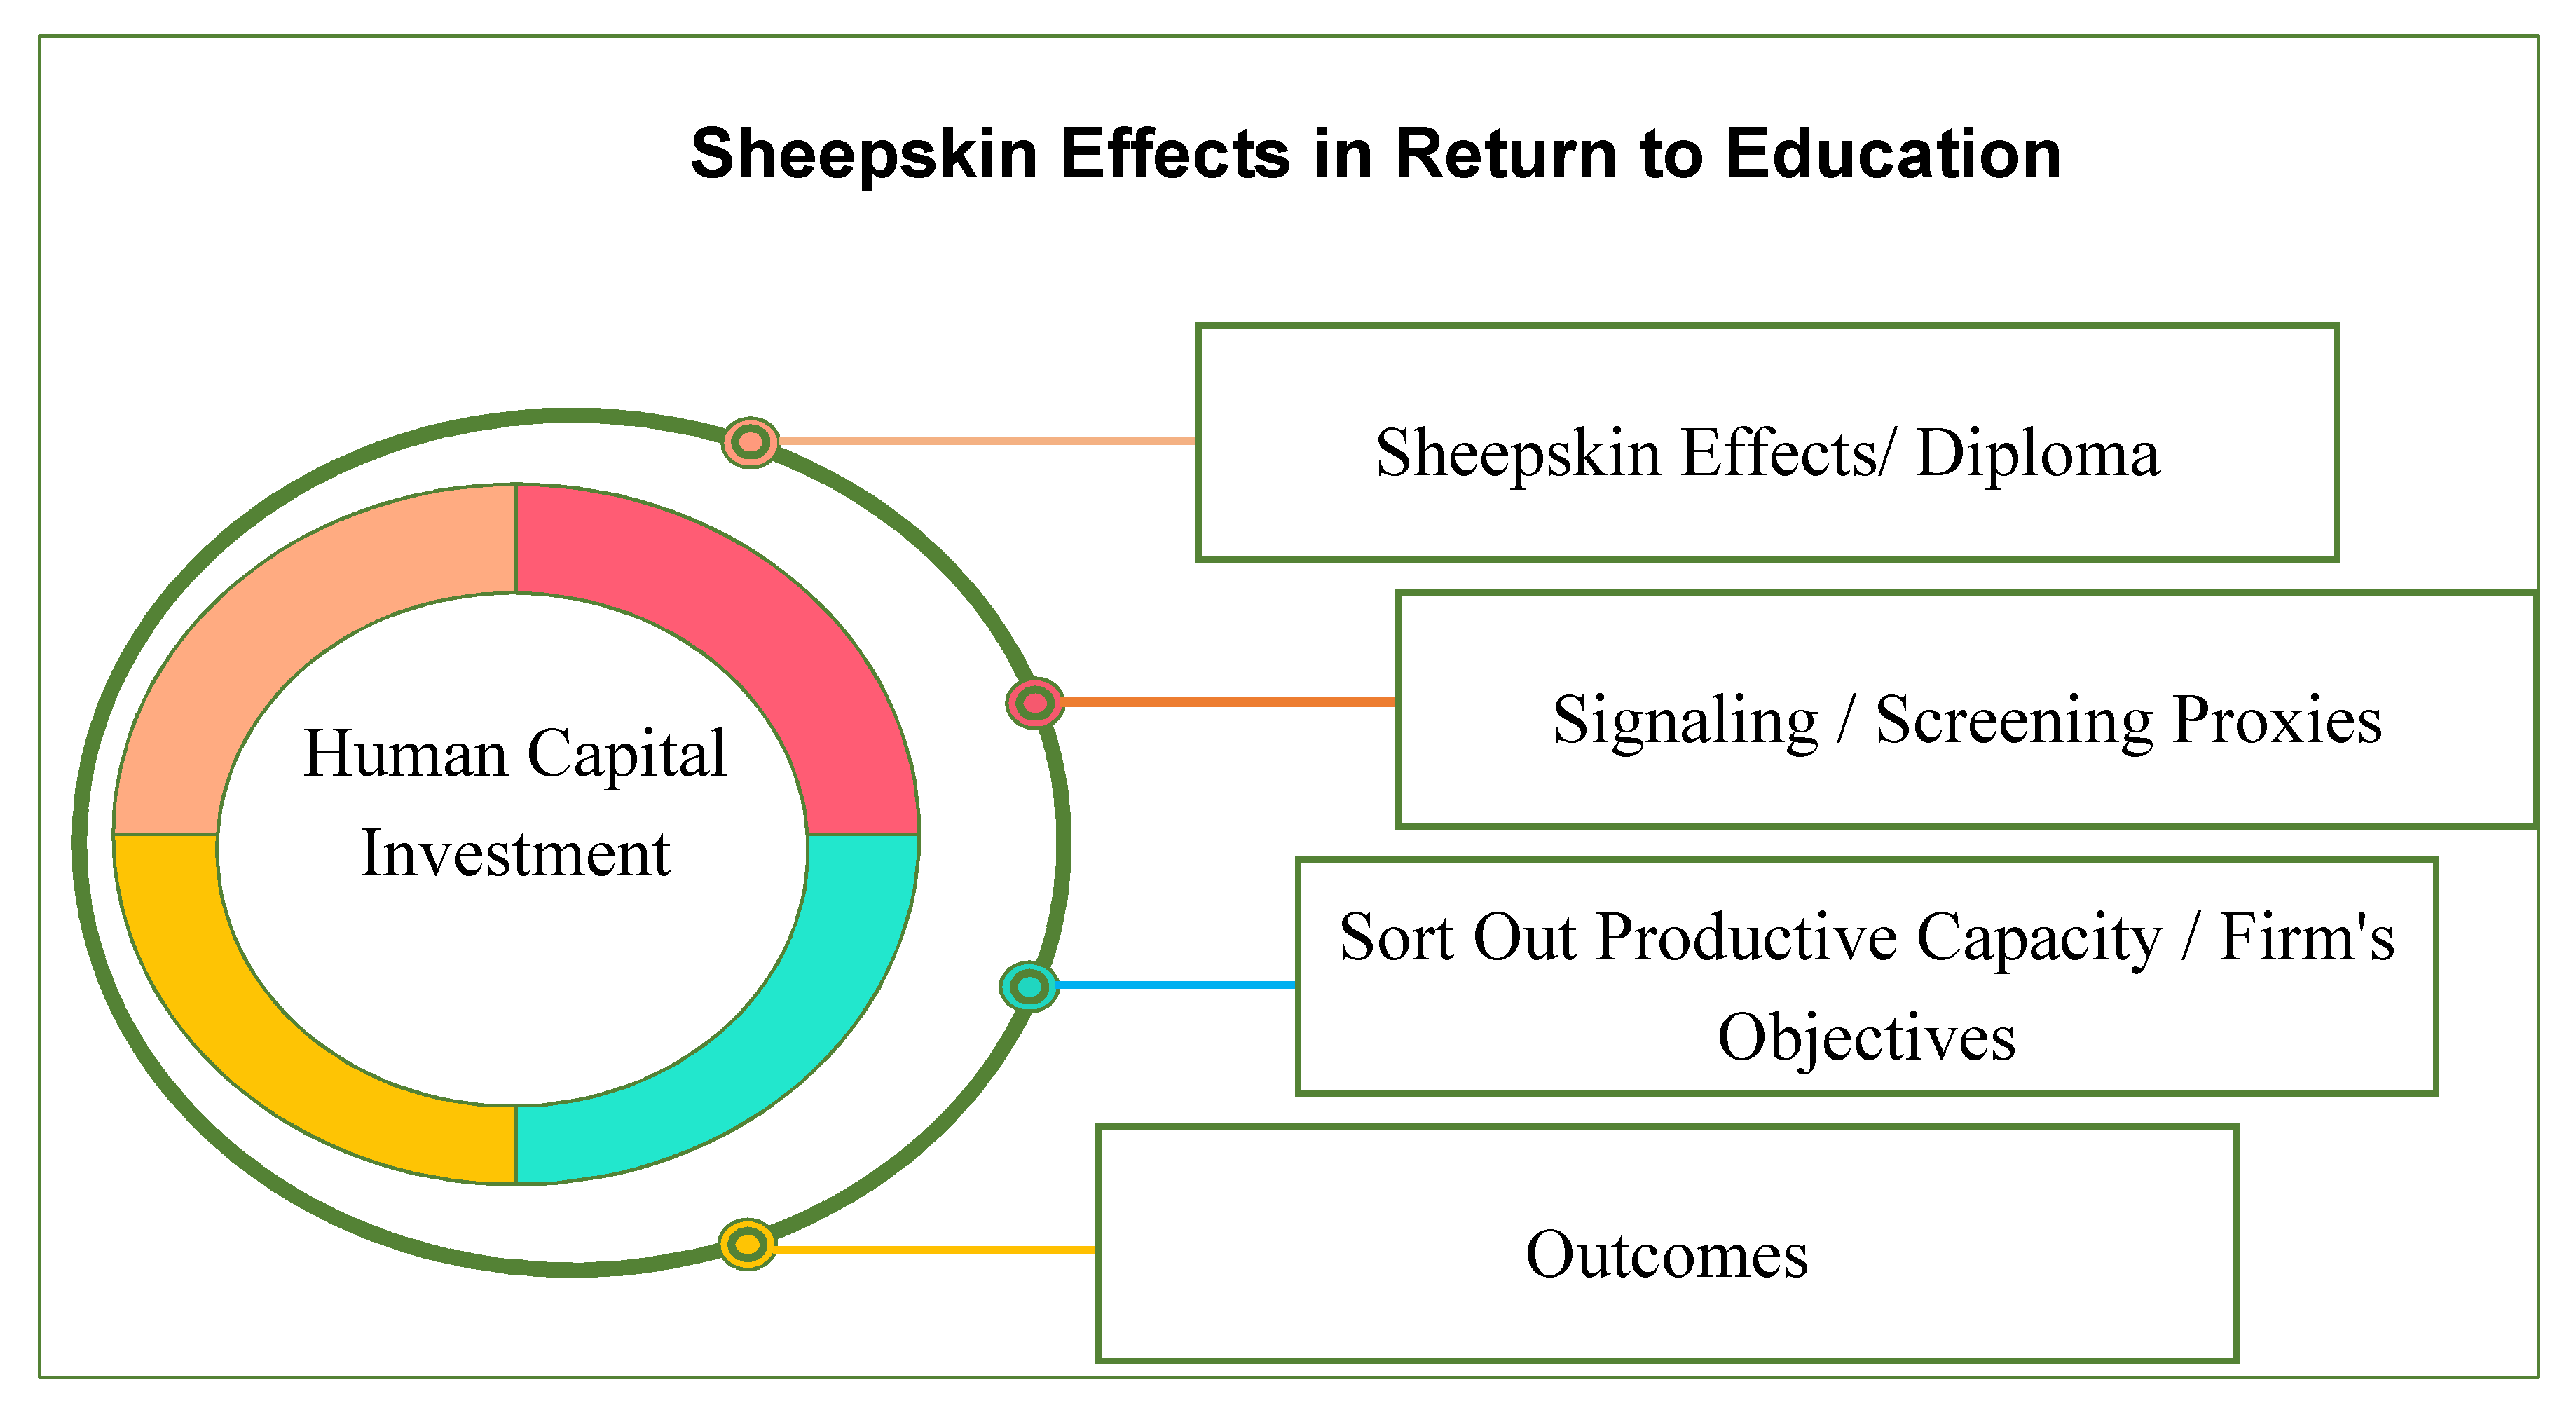
Capital investments are made based on the objectives of the firms, such as shares or infrastructure for the enhancement of production. Figure 2 presents the graphical explanation of human capital inputs in education toward the future outcomes. The investment on human capital is made on the preferences of intellectual capital including present vs. future outcomes. For example, few jobs require no more than 12 years of schooling whereas some jobs require more than 12 years of schooling. Similarly, more investment on schooling tends to result in endogenous growth in the distribution of income.
In the current era, there is massive economic competition among the labor markets, including a strict way of hiring employees. Employers rely on the proxies (diploma) to sort out the productive capability or mental agility on behalf of the firm. However, the firm is the only place where human capital can be effectively appreciated and the returns on human capital are higher [25].

4. Data Description

4.1. Data Collection

To assess the effectiveness of sheepskin, we have used Pakistan’s annual administrative dataset, named Household Integrated Economic Survey (HIES). Every year, the Pakistan Bureau of Statistics (PBS) conducts the HIES survey in all provinces, comprising matters on education, health, income, and expenditures, which can assist in the estimation of all-encompassing studies or an individual’s wage equilibrium in Pakistan. The survey is an appropriate dataset for the characteristic of sheepskin effects. This study focuses on three years of data: 2004/05, 2007/08, and 2010/11 on 31 populated cantons. This is consistent with our aim to manage the fluctuations in the curve of personal average returns to the different levels of diplomas. This modification can be seen over the next five years, as a result of skill development programs all over the world.
The latest HIES is also convenient for providing valuable information for the assessment of efficiency related to investment in human capital (education). Impressive features were considered for the sample selection performed from 2004/05 to 2010/11. First of all, the individual’s selection criteria were restricted at the age between 15 and 64. Second, those individuals who did not attend school or who had no formal education were excluded. Third, also excluded were those who were working while studying or who were self-employed (to be consistent with preceding literature), those currently enrolled in schools, migrant workers, or those whose qualifications were not recognized by Pakistan’s Ministry of Education (MoE). Fourth, workers who worked without salary, pensioners, unpaid family, and housewives were also excluded. The self-employed or employed were excluded because there was a problem in the measurement of their incomes. The selection standard of individuals consisting of education, occupation, and average wages are shown in Table 1.

4.2. Sheepskins Estimation Methodology

We have followed a conventional approach to estimate the sheepskin effects by inducing a distinctive and detailed look at the educational curricula of workers. We have employed the binary method (0 and 1) for the actual years spent in school and the degree achieved within the educational milestone [26,27].
The sheepskin effects are often defined as an excessively large rate of return to schooling, followed by the accomplishment of a certain year’s program that entails a diploma. The description ascends in large parts from the nonexistence of data that represents information on both actual years of education and years of an obtained degree. Hence, the scholar’s approximation mostly depends on the proxies of logarithm wage (Mincer’s equation), to measure the sheepskin effects as follows:
l o g W i = α + β 1 S i + β 2 E x p i + β 3 E x p i 2 + β 4 D 6 i + β 5 D 10 i + β 6 D 12 i + β 7 D 14 i + β 8 D 15 i + β 9 D 16 i + β 10 D 18 i +
In our estimation, the dependent variable (DV) is the natural logarithm l o g W i of earnings, i is the index, and independent variables (IV) is the fixed or actual diploma years.   S i   :   β is the coefficient of obtained diploma, where each diploma has been created as a proxy of dichotomous variable to evaluate the log wage distribution. The number of years of experience E x p i   and the quadratic function of labor market E x p i 2   are applied to hold the concavity of earning experience profiles. For consistency with the previous standard formulation in the literature, it is assumed that children begin school at six years of age, and they immediately join the labor market after completion of S years. To control the individual’s possible heterogeneity effects, certain classifications may be inherent in the ability that may cause biases in educational effectiveness. This is specified by using the spline function in Equation (2). By inspecting whether the sheepskin’s returns decline with rehashing years, the above variant of Equation (1) is used, to estimate the interaction terms among the proxy variables of schooling with Expi. Similarly, Equation (2) analyses the rehashing years’ outcome in the following equation:
l o g W i = α + β 1 S i + β 2 E x p i + β 3 E x p i 2 + β 4 [ ( S i 6 ) * D 6 i ]                + β 5 [ ( S i 10 ) * D 10 i ] + β 6 [ ( S i 12 ) * D 12 i ] + β 7 D 6 + β 8 D 10          + β 9 D 12 + β 10 D 14 + β 11 D 15 + β 12 D 16 + β 13 D 18 +
The spline (Si − 6) * D6i, (Si − 10) * D10i and (Si − 12) * D12i is applied to capture the variation in the slope of S levels. The variable is the error term.
To investigate whether or not the sheepskin effects decline with experience, the following variant of Equation (2) is used, whereby the interaction terms between the dummy variables for completion D10i, D12i, and D16i are interacted with Expi in Equation (3) as follows:
l o g W i = α + β 1   S i + β 2   E x p i + β 3 E x p i 2 + β 4 D 6 i + β 5 [ ( S i 6 ) * D 6 i ] + β 6 D 10 i        + β 7 [ ( S i 10 ) * D 10 i ] + β 8 D 12 i + β 9 [ ( S i 12 ) * D 12 i ]          + β 10 D 14 i + β 11 D 15 i + β 12 D 16 i + β 13 D 18 i + β 14 ( D 10 i * E x p i ) + β 15 ( D 12 i * E x p i ) + β 16 ( D 16 i * E x p i ) +
In addition to proceeds, sheepskin’s examination may support the diplomas with interaction of experience. The results are estimated separately for male and female employees in both public and private sectors, which are known as the p-test [28,29]. Under the strong screening hypothesis, employers will pay higher wages to post-graduate diploma holders compared to the low dimensional diploma holders.

5. Results

This study aims to examine the exceptional effects of schooling years and the marginal differences between HLE and LLE. First, we underlined the contributed results of the sheepskin effects using natural log model [30] and human capital theories [31].
Table 2 presents the estimated results of Mincer Model Equation (1). First, we found that only a single year of investment on schooling (Si) can tend 2.4% premium. Second, all diplomas have outcomes either positive or negative, as D6i diploma did not make a significant variation in remunerations (at 95% confidence level in all samples), it seems, by the time, LLE has dropped it’s worth. The propensity from the ancestral to the modern profession (using LLE as a reference) is not sufficient to adapt to the 21st-century competitive environment. Third, our results were supportive of more investment on schooling after higher secondary diploma (D12i); those individuals who have obtained a tertiary diploma or higher are able to get charge out for higher premiums. Table 2 shows that earnings are consistently increasing with extra years of schooling, with D15i = 33%, D16i = 38%, and D18i = 55% respectively.
Hence, after tertiary education (TE), a little bit more investment in the accumulation of post-graduation diplomas can uncover higher premiums. Our results are in contrast with a previous study [32] that found significant effects of elementary, secondary, and tertiary diploma. Two other related studies on Pakistan [33,34] implicated that higher returns to schooling can be determined until graduation level, but they have not discussed the post-graduate diploma and the impact of repeated years of schooling.
Table 3 presents the estimated spline function results from the stochastic sample of PBS. The result contains corresponding specifications for all recorded earning relationships, identified as a piece-wise linear. Several worthwhile observations have been found in the estimated results in Table 3. First, by incorporating the F-test statistics flexibility, the spline function significantly fits all of the specifications over the prototypical Mincer’s model. Second, the outcomes for rehashing years (Si − 10) *D10i and (Si − 12) *D12i are proportionately less effective than an investment on D16i or D18i diplomas, which might be beneficial for higher wage discrimination.
Although the predictions about having longer work history may often be associated with higher premiums, these effects are not necessarily true for workers who have completed only secondary and higher secondary education. Taking experience into account, the Equation (3) estimated results as shown in Table 4 indicate positive and significant estimated coefficients for D16*Exp. It shows that diploma holders are enjoying higher premiums with interaction of job history even with a negative effect for secondary (D10*Exp) and post-secondary (D12*Exp). Therefore, our results partially confirm the hypothesis in a cross-wise sub-sample of both public and private sectors. Our results suggest that individuals with the same length of experience but with less education are not able to get premiums like those with D15, D16, and D18 who are enjoying higher premiums. Moreover, the estimated results are similar to an Italian study, which [35] found higher outcomes for only intermediate education in the public sector by using a p-test.
Table 5 suggests that earnings are constant at every level of education. The DVs have flexible impact on every place, and we have used panel data time series around 31 cantons. The Hausman test compared the estimated coefficients from the fixed effect model, β ^   F E , to those from a random effects model, β ^   R E . Under the present specifications and according to our assumption, the individuals’ diplomas are adequately modeled, which is resoundingly rejected by a random effects model. Table 5 results are beached on the rest of our model specifications, and random effects might be an appropriate for some alternative models of wages.
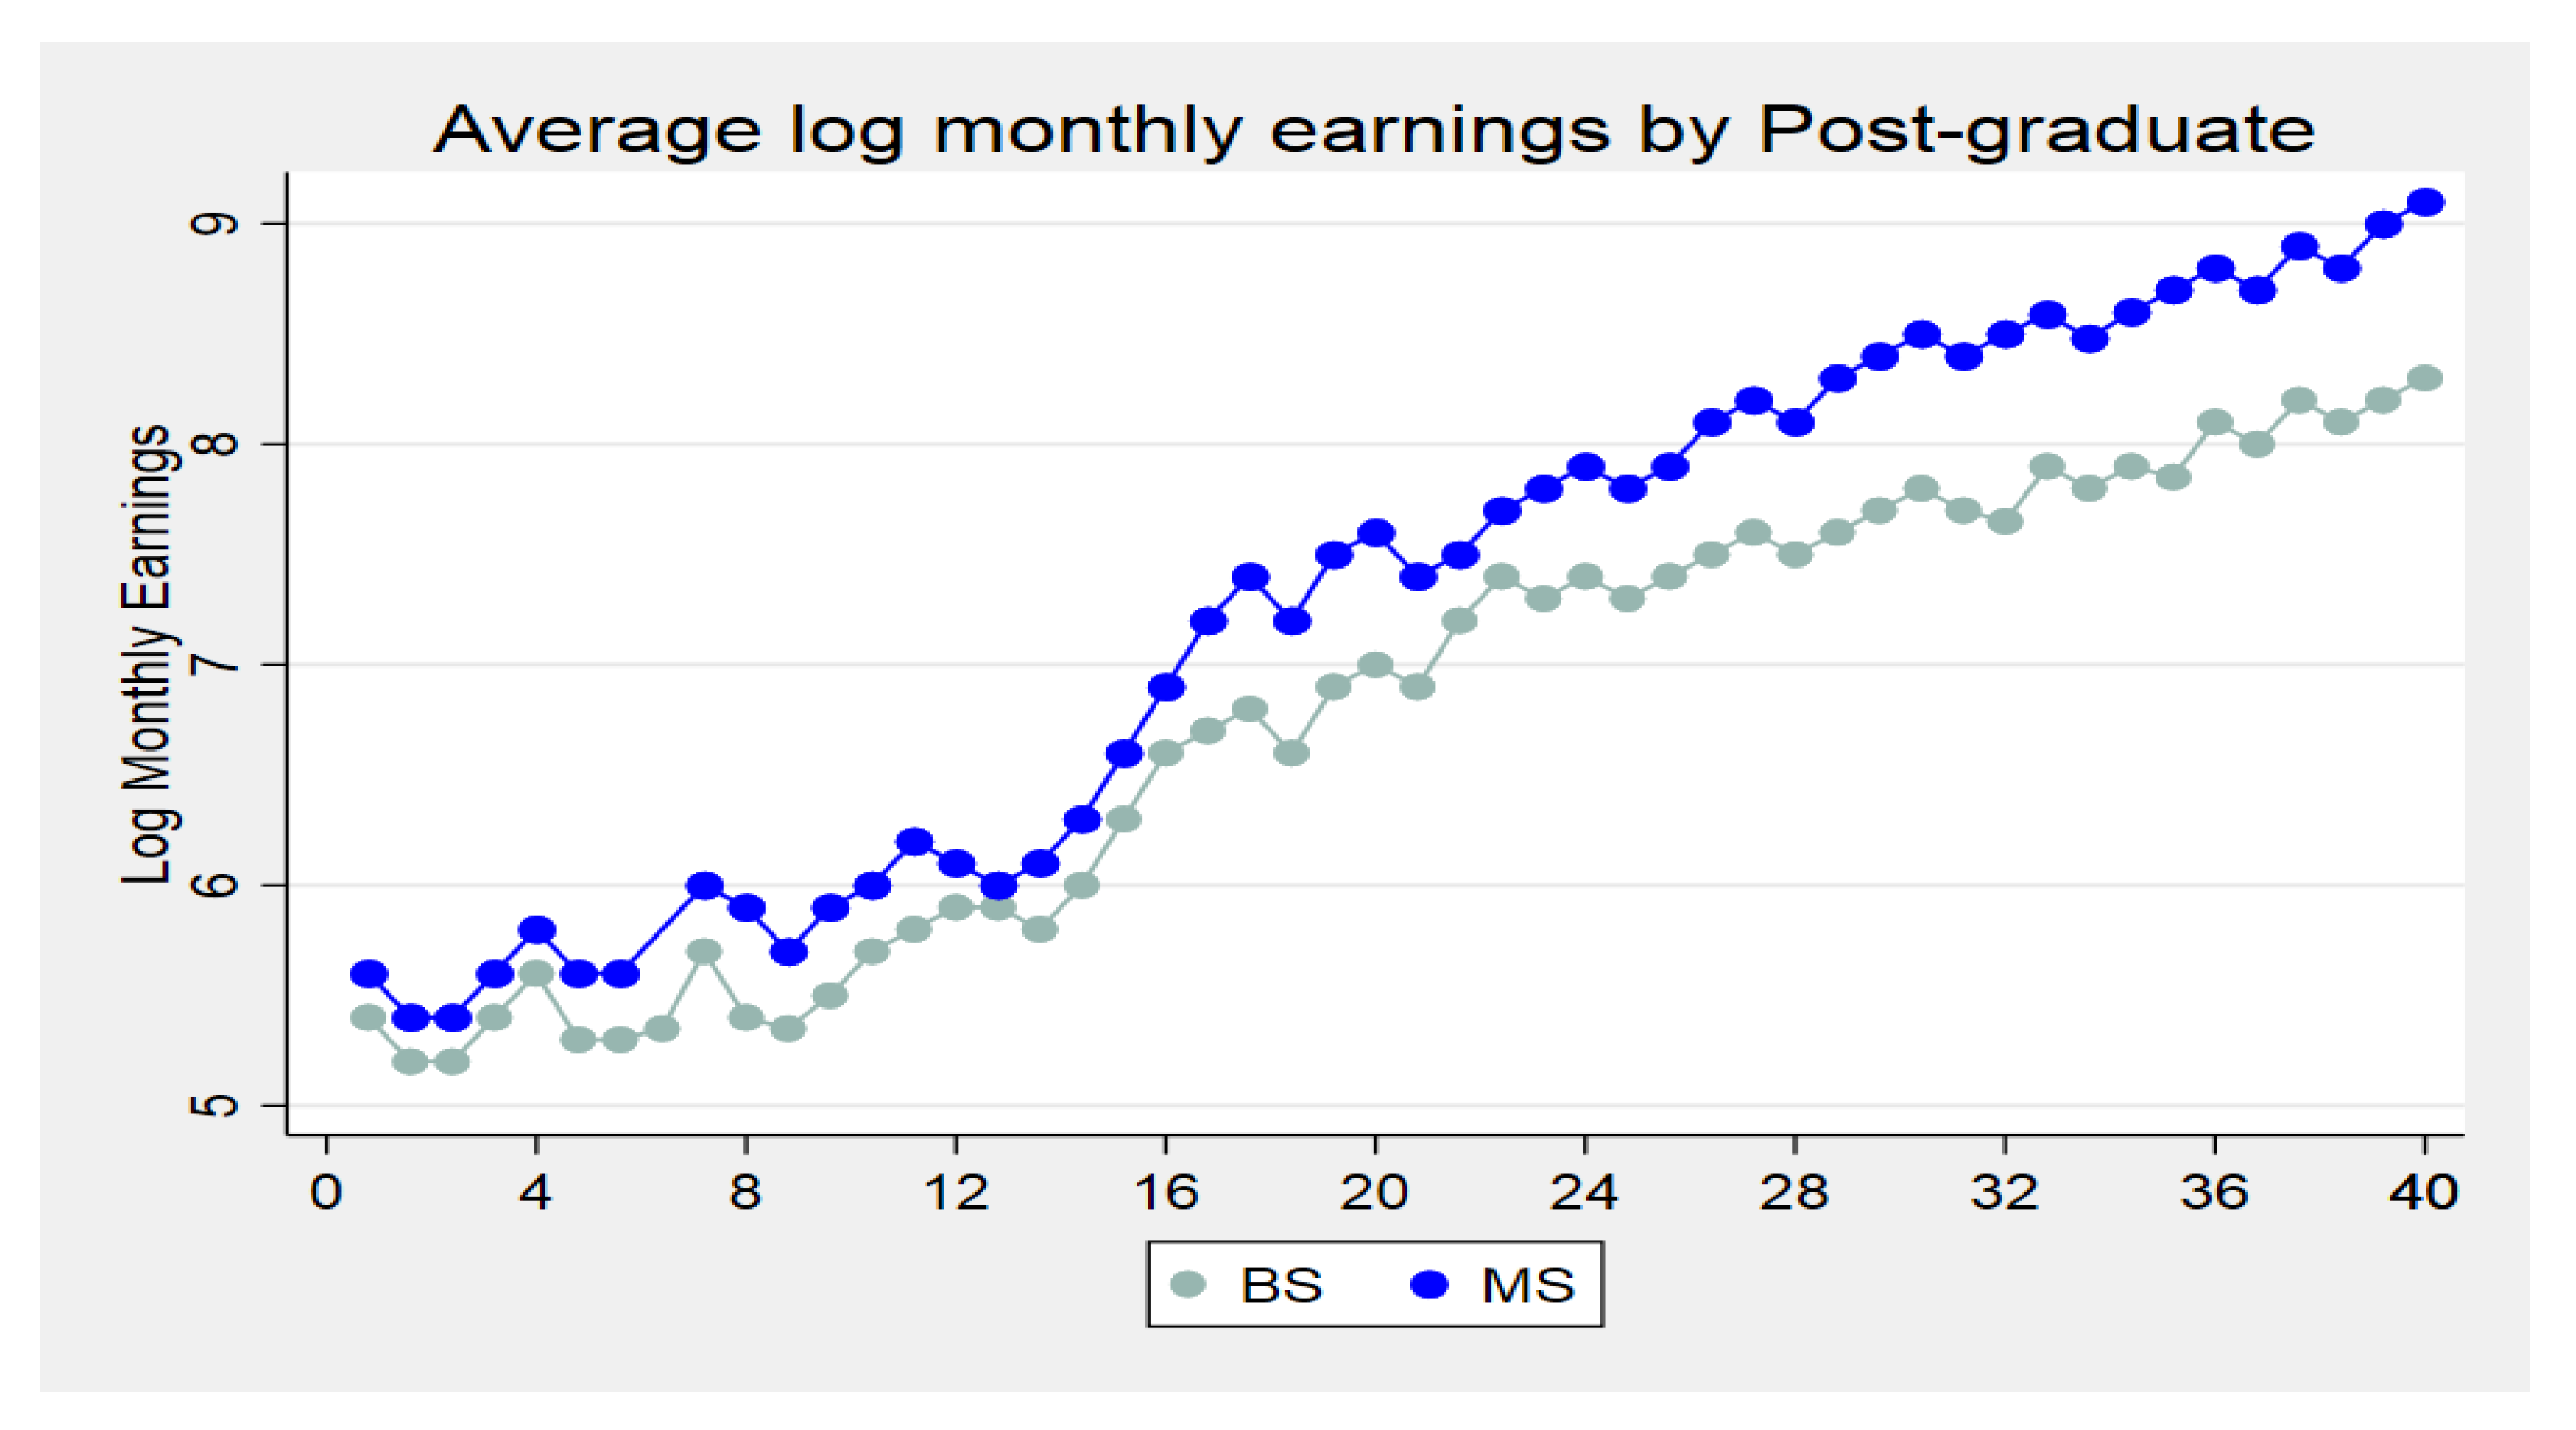
Although our primary focus is on the advancement over TE outcomes, we have sorted out the data to explain more on the association between graduation and post-graduation returns. Figure 3 shows log earning gaps between BS and MS degrees. We have separated the individual’s BS or MS degree accomplishment in order to interpret the earning differences by their employment. Those who procure BS and do not procure MS likely, reflects a causal impact of MS in a flexible way without imposing restrictive forms on the higher rate of return function.
The selected pattern reveals several outcomes in Figure 3. In a horizontal line, the first quarter indicates that both degrees have comprising earnings. The second quarter does not line up perfectly with gains. Though at the initial three quarters both degrees have fewer gains, after the fourth quarter, substantial increments have been observed in MS diploma. This suggests that additional years (MS) are able to overtake BS shortly after completion of a post-graduate diploma.
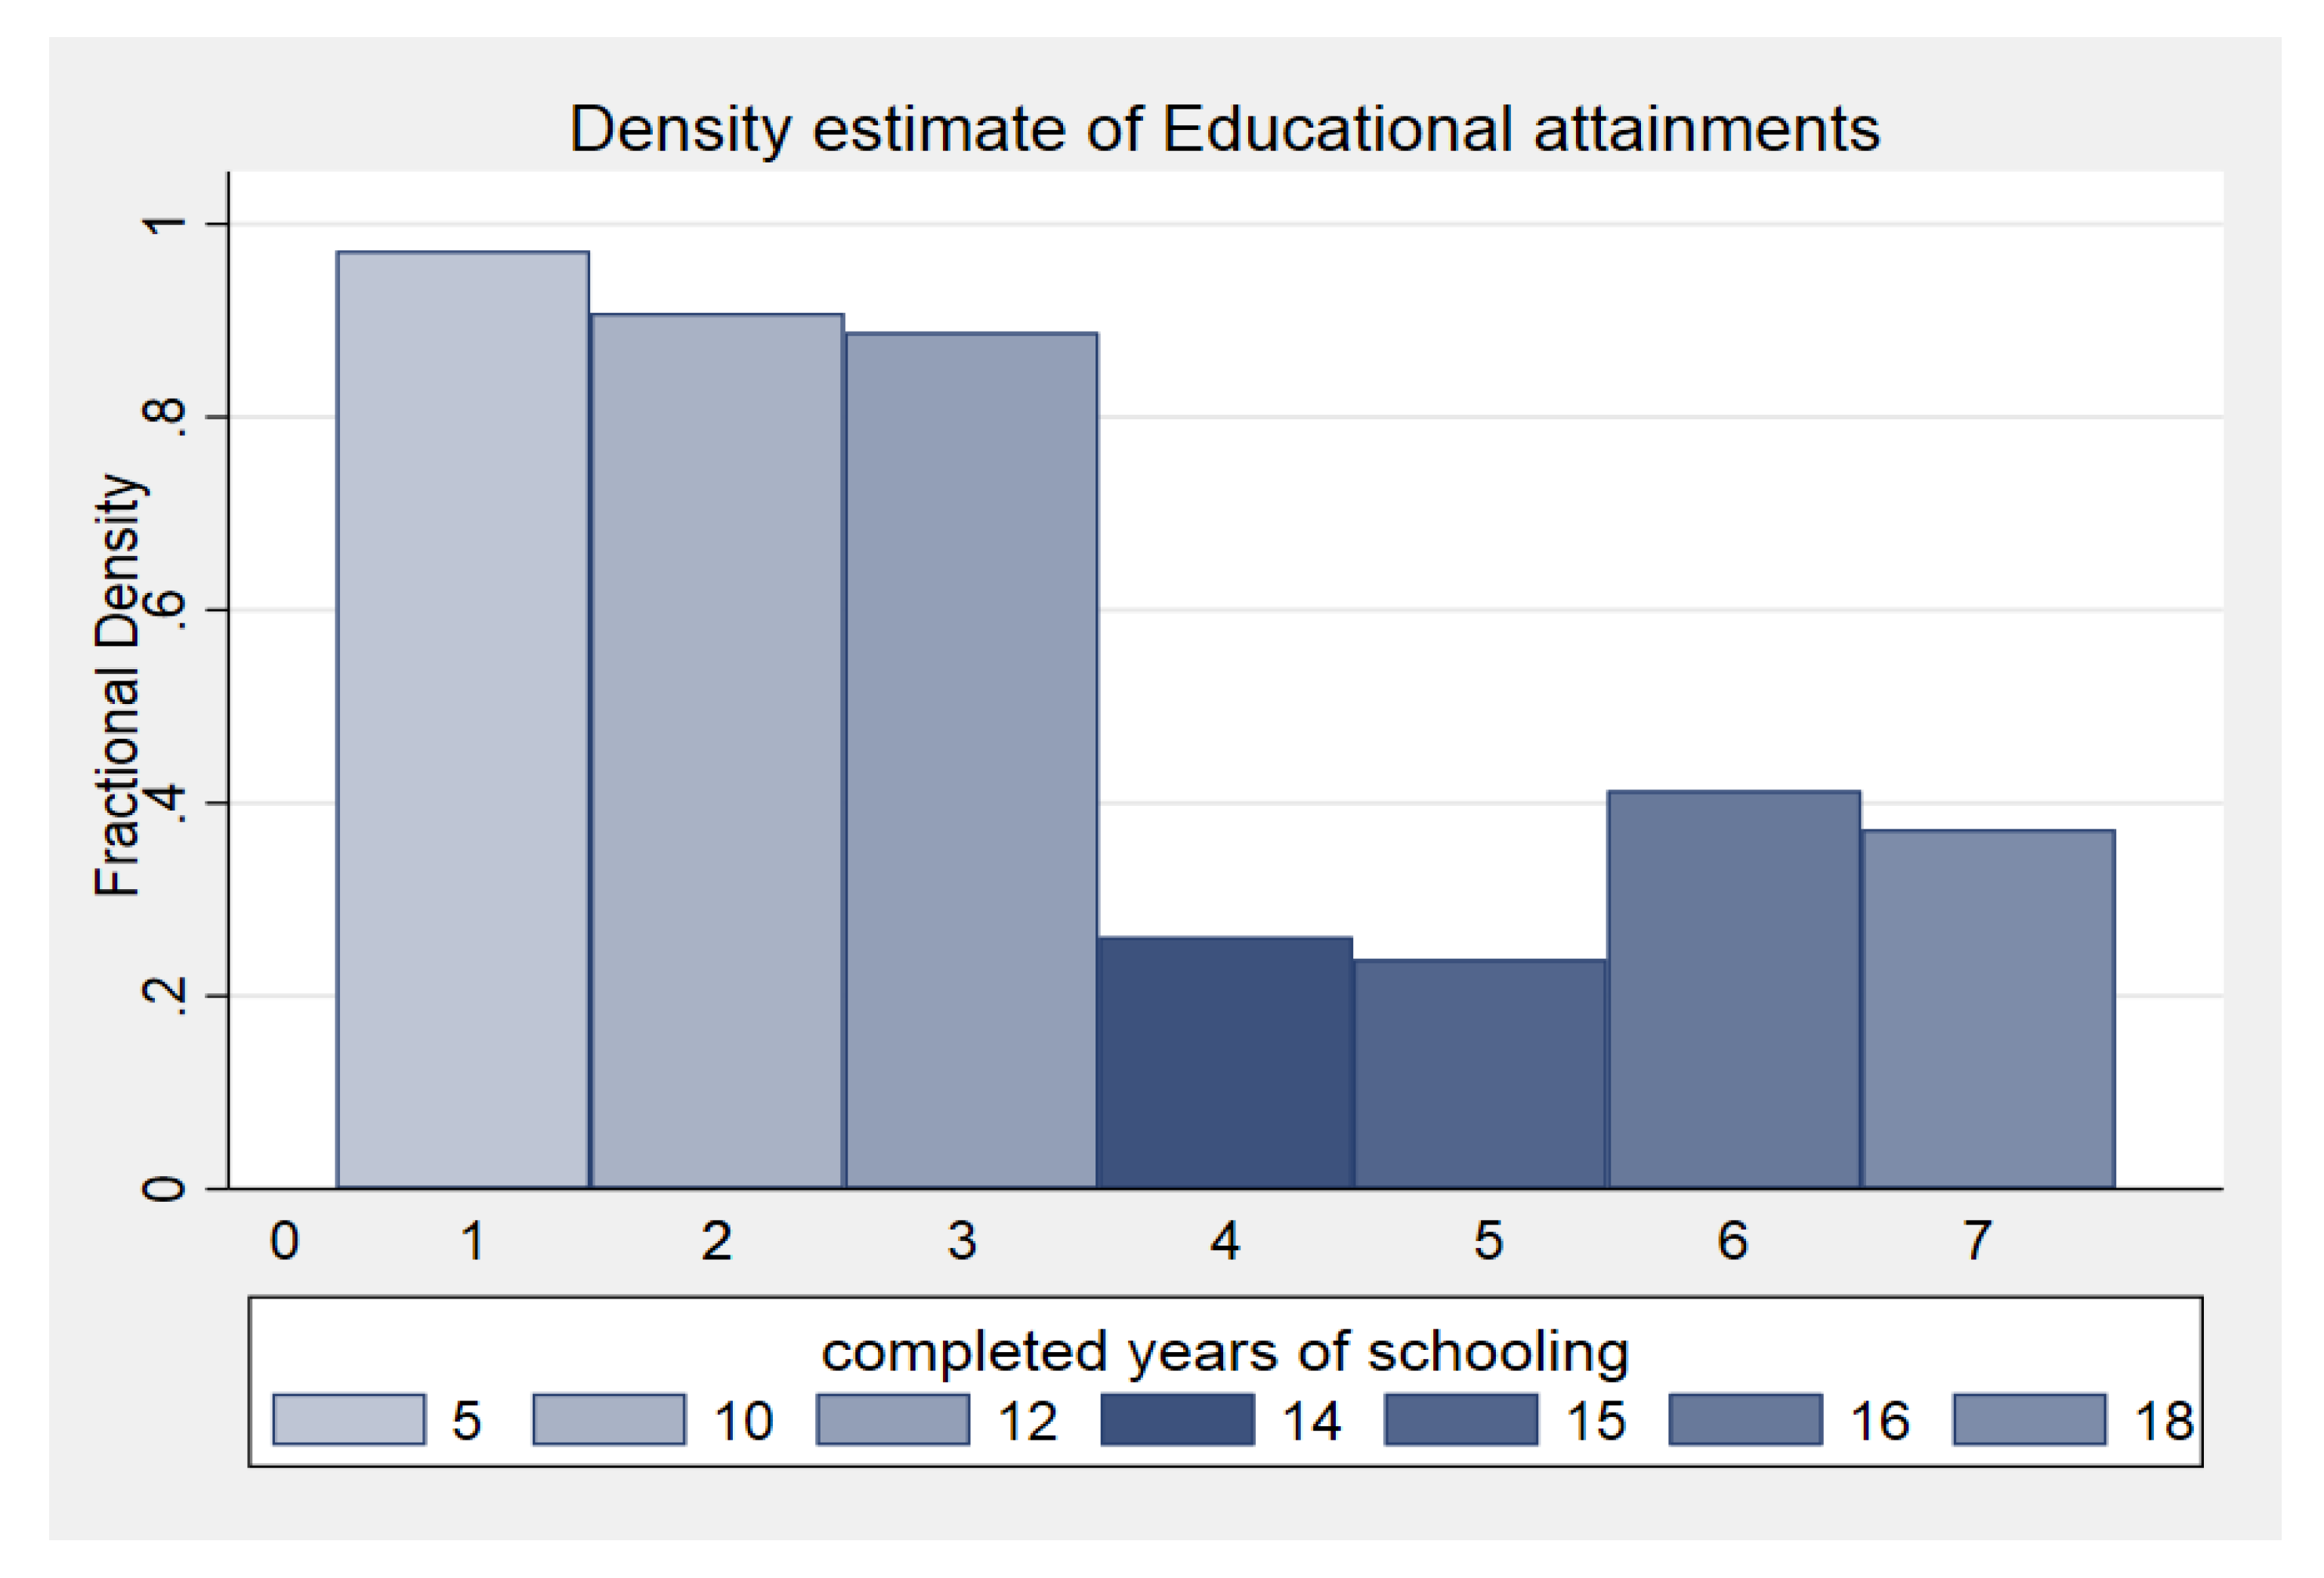
From the above perspective, it is observed that statistical comparison of wage shows a symmetrical productive approach for graduate BS (D16i) and postgraduate MS (D18i) diplomas. Under the contextual interpretation, the educational consequences on wage are exclusively emerging on the influence of productivity, not from any screening capacity. Unfortunately, the enrollment in the post-graduation diploma is very low (Table A2 and Figure A1 in Appendix A).

6. Discussion

The investigations on the characteristics of market supply/demand factors have enabled economists to explore that those individuals who accumulate LLE or HLE will contribute significantly towards a nation’s endurance. College or higher education enrollment is considered imperative in developed or non-developed countries [36], especially when the government is responsible for managing all sustainable resources for public support, for example, in enhancing mobility or investment on education and its co-occurrence for the community welfare net.
Although in the literature, the association between education and wage-aspirations is well-established, yet it’s unclear what aspects of education drive this association [37,38,39]. However, we have found that individuals who possess postgraduate diploma are able to hold standard jobs with high return, because more investment on schooling makes them capable and more productive.
The education seems to be an individual’s productive investment, which brings drastic change in the detected wage returns by type of qualification (sheepskin effects). Especially, the academic conference or baccalaureate diploma seems to be fascinated more substantial incentives on the labor market. Employers rely on the proxies to screen out the hypothesis of sheepskin effect and as a signaling model against human capital by looking at the external effects of education, for example, individuals’ behavior or attitude. The central difference between the models is not only how employers are rewarding the individual at educational level, but also the primary difference that occurs at the societal level. While the human capital theory suggests that the external effects remain absent, most signaling models and sheepskin effects predict that private returns are higher than social returns.
Notwithstanding, a number of students have obtained qualifications from high to low level, and all the educational benefits for men and women have remained unchanged from 2004/2005 to 2010/2011, the only exception being the withdrawal of returns from LLE. First, our estimated results indicated that the signaling model fit better than the human capital model does. The strong sheepskin effects at additional dimension of schooling (postgraduate) were discovered. The additional investment on higher-degree can have value as a signal, whereas LLE has almost negative impact on wages. Second, the years spent on education even rehashed years on explicit dimensions have a small effect on wages by using Mincer equation and spline function. This could clarify the non-appeared effects of longer years of education. For example, students who obtain rehashing years might be understood as possessing low-ability or low-motivational power or low-catching power compared to their cohorts. This goes directly against the human capital model, which expresses that consistently spending more years in education can enhance someone’s productivity. If less-able students spend more years in education than strictly necessary, then everyone will observe an overall decline in the private rate of return and decline in validity. Third, by giving the same length of experience, we found that experience did not make any change at the possession of LLE.
As, I have no control over unobserved heterogeneity, I have used preventative comments at its place. It means the heterogeneity is observed by the employer during the employee selection process. A scholar [40] argued that other attributes should not be included to capture the productivity differences except the effects of education. However, only the employer can screen out the tentative signaling model against the human capital model, because he/she has already settled the imaginary sketch of productivity. Hence, other scholars and I determined to examine the sheepskin effects and their impact on wage discrimination.
Consequently, our results are in contrast with a Netherland study [41], which reported significant returns on schooling years. In this paper we have utilized a distinctive procedure as used by Van der Meer (2011) to estimate wage equation. Van der Meer did not take into account the outcome effects for repeated years of education or the outcomes’ relationship with experience, even no one has focused on regional effects as we did in the current study. However, this fact is not the cause of different results since we have estimated spline function, results (Table 3) and interaction of schooling with experience in (Table 4). Although there is no age for learning and education cannot be presumed, but the sustainable development of human capital relies on more investment toward a baccalaureate diploma.

7. Conclusions

There is a strong belief that general education is responsible for the sustainable development of skills and learning, that learning is called human capital. Individuals are more likely to be highly paid, with the presence of human capital and baccalaureate diploma (sheepskins). The individuals studying at the public or private institutions, it grants them baccalaureate diplomas after the completion of degree years.
However, current study showed an exceptional rate of returns to education and the cumulative convexity in the income function will be greater over time. We had observed the number of possible explanations in the patterns. First, the postgraduate diploma had substantial returns compared to rest of diplomas, because the ability or divisibility of human capital formation makes a difference in the organizational objectives or in the productivity. Second, there was a negative impact on rehashing diploma years as repetition may create doubt on the individual’s ability or motivation. Third, for school-to-work transition program, the firm seeks perspective productive elements from the employee. Hardly, very few candidates may fit on those elements, all because of lack of investment on human capital or education. There should be a systematic supporting ground to polish the skills of candidates, by the arrangement of sustainable developmental internship programs for inclusion in the curricula.

8. Policy Recommendation

The higher education systems in the non-developed countries are surviving under pressure and fluctuating conditions. By comparing the progress of sustainable development of education, it has been statistically noticed from the standard—through the supply and demand mismatch, that there is sparse information flow in the labor market. In this complex environment, government should review their applied policies.
The college or university sectors need to improve the quality of standards of education, and update the syllabus, as the latest technologies exist in the transitive labor market. Moreover, the government should retain an optimum interest in the complex range of objectives for higher education by funding and strategically planning to overcome poverty. To promote the national objectives, there is a need to stimulate an appropriate improvement in the quality of higher education. Let the nation be assured that resources are employed in higher education and will ensure equity access and equality in the opportunity.

Author Contributions

Conceptualization, A.A.M.; Methodology, A.A.M.; Software, A.A.M.; Validation, W.N.; Formal analysis, A.A.M.; Investigation, A.A.M.; Resources, A.A.M.; Data curation, A.A.M. and H.K.; Writing—original draft, A.A.M.; Writing—review & editing, Z.L., A.A.M. and W.N.; Visualization, W.N. and H.K.; Supervision, A.A.M.; Project administration, Z.L.; Funding acquisition, Z.L. All authors have read and agreed to the published version of the manuscript.

Funding

We acknowledge financial support by “JSSRP On the governance pathway of “Newly Formed” WCUs (17JYA003)” within the funding program Open Access Publishing.

Acknowledgments

I would like to thank professor Liu Zhimin for his expert advice, funding and encouragement throughout this article. Moreover, I am also thankful to reviewers for there suggestions in order to improve our manuscript.

Conflicts of Interest

The authors declare no conflict of interest.

Appendix A

Table A1. Description of variables with definitions.
VariablesVariable’s Description
YNatural log of the income (Pak rupees)
SAccumulated schooling
AGEAge in years
EXPNo. years’ experience
D6Primary (s ≥ 5)
D10Secondary (s ≥ 10)
D12Higher secondary (s ≥ 12)
D14B.A (s ≥ 14)
D15Vocational/Polytechnical (s ≥ 15)
D16BSc (honors) (s ≥ 16)
D18MSc/MPhil (s ≥ 18)
Director ManagerEmployment status
Professional
Associated Teachers
Agriculture and Fisheries
Supervisors
Finance
Plant and machine operator
Clerks
Elementary
Table A2. Density of educational attainment and dropouts.
VariablesMeanStandard ErrorKurtosisSkewnessConfidence Level (95.0%)
Incomplete Primary0.11070230.0041353713.13092193.889572570.008105996
Complete Primary0.28673040.007975725.571233562.751421920.01563368
Incomplete Secondary0.49382710.011898463.242661022.289570000.02332287
Complete Secondary0.65734600.015277822.759331342.181485770.029946943
Completed Higher1.10767720.021049940.643905501.625976700.041261215
Source: The Pakistan Bureau of Pakistan (PBS); author’s calculation.
Figure A1. Estimated mean of actual years of degree attainment according to MOE system. Source: Pakistan Bureau of Statistics 2011; author’s calculation.
Sustainability 12 02393 g0a1
Table A3. Robust regression.
Independent VariablesCoefficient (Standard Errors)
Model 1aModel 1b
Intercept0.655
(0.269) ***
1.348
(0.138) ***
Age0.0044
(0.002)
−0.001
(0.001) **
S0.115
(0.0163) ***
0.050
(0.008) ***
Exp0.107
(0.005) ***
0.027
(0.002) **
Exp20.0114
(0.000025) **
0.0007
(0.0000078) *
Primary−0.858
(0.352) **
−0.478
(0.133) ***
SSc0.538
(0.212) **
0.434
(0.132) **
HSc0.887
(0.161) ***
0.851
(0.122) ***
Vocational1.92
(0.079) ***
2.034
(0.046) ***
Associate degree1.269
(0.302) ***
1.991
(0.055) **
Graduate2.455
(0.100) ***
2.492
(0.055) ***
Postgraduate1.647
(0.098) ***
2.822
(0.047) **
Marital status0.029
(0.093) *
−0.0107
(0.047)
Gender0.982
(0.072) **
0.371
(0.038) *
F-Test560.921734.4
N351412,104
Standard errors are in parentheses. * significant differences at the 1% level; ** significant differences at the 5% level; *** significant differences at the 10% level.

References

  1. Ferrer, A.M.; Riddell, W.C. The role of credentials in the Canadian labour market. Can. J. Econ. Rev. Can. Écon. 2002, 35, 879–905. [Google Scholar] [CrossRef]
  2. Mora, J.J. Sheepskin effects and screening in Colombia. Colombian Econ. J. 2003, 1, 95–108. [Google Scholar]
  3. Bauer, T.K.; Dross, P.J.; Haisken-DeNew, J.P. Sheepskin effects in Japan. Int. J. Manpower 2005, 26, 320–335. [Google Scholar] [CrossRef]
  4. Teixeira, P.N. Great expectations, mixed results and resilient beliefs: The troubles of empirical research in economic controversies. J. Econ. Methodol. 2007, 14, 291–309. [Google Scholar] [CrossRef]
  5. Peet, E.D.; Fink, G.; Fawzi, W. Returns to education in developing countries: Evidence from the living standards and measurement study surveys. Econ. Educ. Rev. 2015, 49, 69–90. [Google Scholar] [CrossRef]
  6. Memon, A.A.; Liu, Z.J.S. Assessment of Sustainable Development of the Performance of Higher Education Credentials in the Transitive Labor Market. Sustainability 2019, 11, 2628. [Google Scholar] [CrossRef] [Green Version]
  7. Thrane, C. Education and earnings in the tourism industry–the role of sheepskin effects. Tour. Econ. 2010, 16, 549–563. [Google Scholar] [CrossRef]
  8. Alba-Ramirez, A.; San Segundo, M.J. The returns to education in Spain. Econ. Educ. Rev. 1995, 14, 155–166. [Google Scholar] [CrossRef]
  9. Becker, G.S. Investment in human capital: A theoretical analysis. J. Polit. Econ. 1962, 70, 9–49. [Google Scholar] [CrossRef]
  10. Schultz, T.W. Investment in Human Capital The Role of Education. Econ. Dev. Cult. Chang. 1971, 23, 553–559. [Google Scholar] [CrossRef]
  11. Mincer, J.; Polachek, S. Family investments in human capital: Earnings of women. J. Polit. Econ. 1974, 82, S76–S108. [Google Scholar] [CrossRef] [Green Version]
  12. Flores-Lagunes, A.; Light, A. Interpreting degree effects in the returns to education. J. Hum. Resour. 2010, 45, 439–467. [Google Scholar] [CrossRef] [Green Version]
  13. Lemieux, T. Increasing residual wage inequality: Composition effects, noisy data, or rising demand for skill? Am. Econ. Rev. 2006, 96, 461–498. [Google Scholar] [CrossRef] [Green Version]
  14. Card, D. The causal effect of education on earnings. In Handbook of Labor Economics; Elsevier: Amsterdam, The Netherlands, 1999; Volume 3, pp. 1801–1863. [Google Scholar]
  15. Hungerford, T.; Solon, G. Sheepskin effects in the returns to education. Rev. Econ. Stat. 1987, 69, 175–177. [Google Scholar] [CrossRef]
  16. Belman, D.; Heywood, J.S. Sheepskin effects in the returns to education: An examination of women and minorities. Rev. Econ. Stat. 1991, 73, 720–724. [Google Scholar] [CrossRef]
  17. Hamdani, K.A. Education and the income differential: An estimation for Rawalpindi city. Pak. Dev. Rev. 1977, 16, 144–164. [Google Scholar] [CrossRef] [Green Version]
  18. Yunus, N.M. Sheepskin effects in the returns to higher education: New evidence for Malaysia. Asian Acad. Manag. J. 2017, 22, 151. [Google Scholar] [CrossRef]
  19. Olfindo, R. Diploma as signal? Estimating sheepskin effects in the Philippines. Int. J. Educ. Dev. 2018, 60, 113–119. [Google Scholar] [CrossRef]
  20. Crespo, A.; Reis, M.C. Sheepskin effects and the relationship between earnings and education: Analyzing the evolution over time in Brazil. Rev. Brasil. Econ. 2015, 69, 209–231. [Google Scholar] [CrossRef] [Green Version]
  21. Denny, K.J.; Harmon, C.P. Testing for sheepskin effects in earnings equations: Evidence for five countries. Appl. Econ. Lett. 2001, 8, 635–637. [Google Scholar] [CrossRef]
  22. Ost, B.; Pan, W.; Webber, D. The returns to college persistence for marginal students: Regression discontinuity evidence from university dismissal policies. J. Labor Econ. 2018, 36, 779–805. [Google Scholar] [CrossRef] [Green Version]
  23. Kaffenberger, M.; Pritchett, L.; Sandefur, J. Estimating the Impact of Women’s Education on Fertility, Child Mortality, and Empowerment When Schooling Ain’t Learning. Available online: https://www.gov.uk/dfid-research-outputs/estimating-the-impact-of-women-s-education-on-fertility-child-mortality-and-empowerment-when-schooling-ain-t-learning#abstract (accessed on 10 November 2019).
  24. Lang, K.; Kropp, D. Human capital versus sorting: The effects of compulsory attendance laws. Q. J. Econ. 1986, 101, 609–624. [Google Scholar] [CrossRef] [Green Version]
  25. Dustmann, C.; Fadlon, I.; Weiss, Y. Return migration, human capital accumulation and the brain drain. J. Dev. Econ. 2011, 95, 58–67. [Google Scholar] [CrossRef] [Green Version]
  26. Trostel, P.A. Nonlinearity in the return to education. J. Appl. Econ. 2005, 8, 191–202. [Google Scholar] [CrossRef] [Green Version]
  27. Heckman, J.J.; Lochner, L.J.; Todd, P.E. Fifty Years of Mincer Earnings Regressions, No. w9732; IZA Discussion Paper Series; National Bureau Of Economic Research: Cambridge, MA, USA, 2003. [Google Scholar]
  28. Psacharopoulos, G.; Teixeira, P. Rates of Return to Education: Conceptual and Methodological Issues. In Encyclopedia of International Higher Education Systems and Institutions; Springer: Dordrecht, Germany, 2019; pp. 1–8. [Google Scholar]
  29. Patrinos, H.A. Estimating the return to schooling using the Mincer equation. IZA World Labor 2016. [Google Scholar] [CrossRef] [Green Version]
  30. Mincer, J. Schooling, Experience, and Earnings; National Bureau Of Economic Research: Cambridge, MA, USA, 1974. [Google Scholar]
  31. Becker, G.S. Human capital revisited. In Human Capital: A Theoretical and Empirical Analysis with Special Reference to Education, 3rd ed.; The University of Chicago Press: Chicago, IL, USA, 2009; pp. 15–28. [Google Scholar]
  32. Schady, N. Convexity and Sheepskin Effects in the Human Capital Earnings Function: Recent Evidence for Filipino Men; The World Bank: Washington, DC, USA, 2001. [Google Scholar] [CrossRef] [Green Version]
  33. Shabbir, T. Sheepskin effects in the returns to education in a developing country. Pak. Dev. Rev. 1991, 30, 1–19. [Google Scholar] [CrossRef] [Green Version]
  34. Aslam, M. Education gender gaps in Pakistan: Is the labor market to blame? Econ. Dev. Cult. Chang. 2009, 57, 747–784. [Google Scholar] [CrossRef] [Green Version]
  35. Brown, S.; Sessions, J.G. Education and employment status: A test of the strong screening hypothesis in Italy. Econ. Educ. Rev. 1999, 18, 397–404. [Google Scholar] [CrossRef]
  36. Pagani, L.S.; Brière, F.N.; Janosz, M.J.I. Fluid reasoning skills at the high school transition predict subsequent dropout. Intelligence 2017, 62, 48–53. [Google Scholar] [CrossRef]
  37. Liu, V.Y.; Belfield, C.R.; Trimble, M.J. The medium-term labor market returns to community college awards: Evidence from North Carolina. Econ. Educ. Rev. 2015, 44, 42–55. [Google Scholar] [CrossRef] [Green Version]
  38. Limam, I.; Hafaiedh, A.B. Education, Earnings and Returns to Schooling in Tunisia. Econ. Res. Forum Working Papers 2017. Available online: https://erf.org.eg/publications/education-earnings-and-returns-to-schooling-in-tunisia/ (accessed on 10 November 2019).
  39. Mateos-Romero, L.; del Mar Salinas-Jiménez, M. Labor Mismatches: Effects on Wages and on Job Satisfaction in 17 OECD Countries. Soc. Indic. Res. 2018, 140, 369–391. [Google Scholar] [CrossRef]
  40. Weiss, A. Human capital vs. signalling explanations of wages. J. Econ. Perspect. 1995, 9, 133–154. [Google Scholar] [CrossRef]
  41. Van der Meer, P.H. Mobility. Educational credentials and external effects: A test for the Netherlands. Res. Soc. Stratif. Mobility 2011, 29, 107–118. [Google Scholar] [CrossRef]
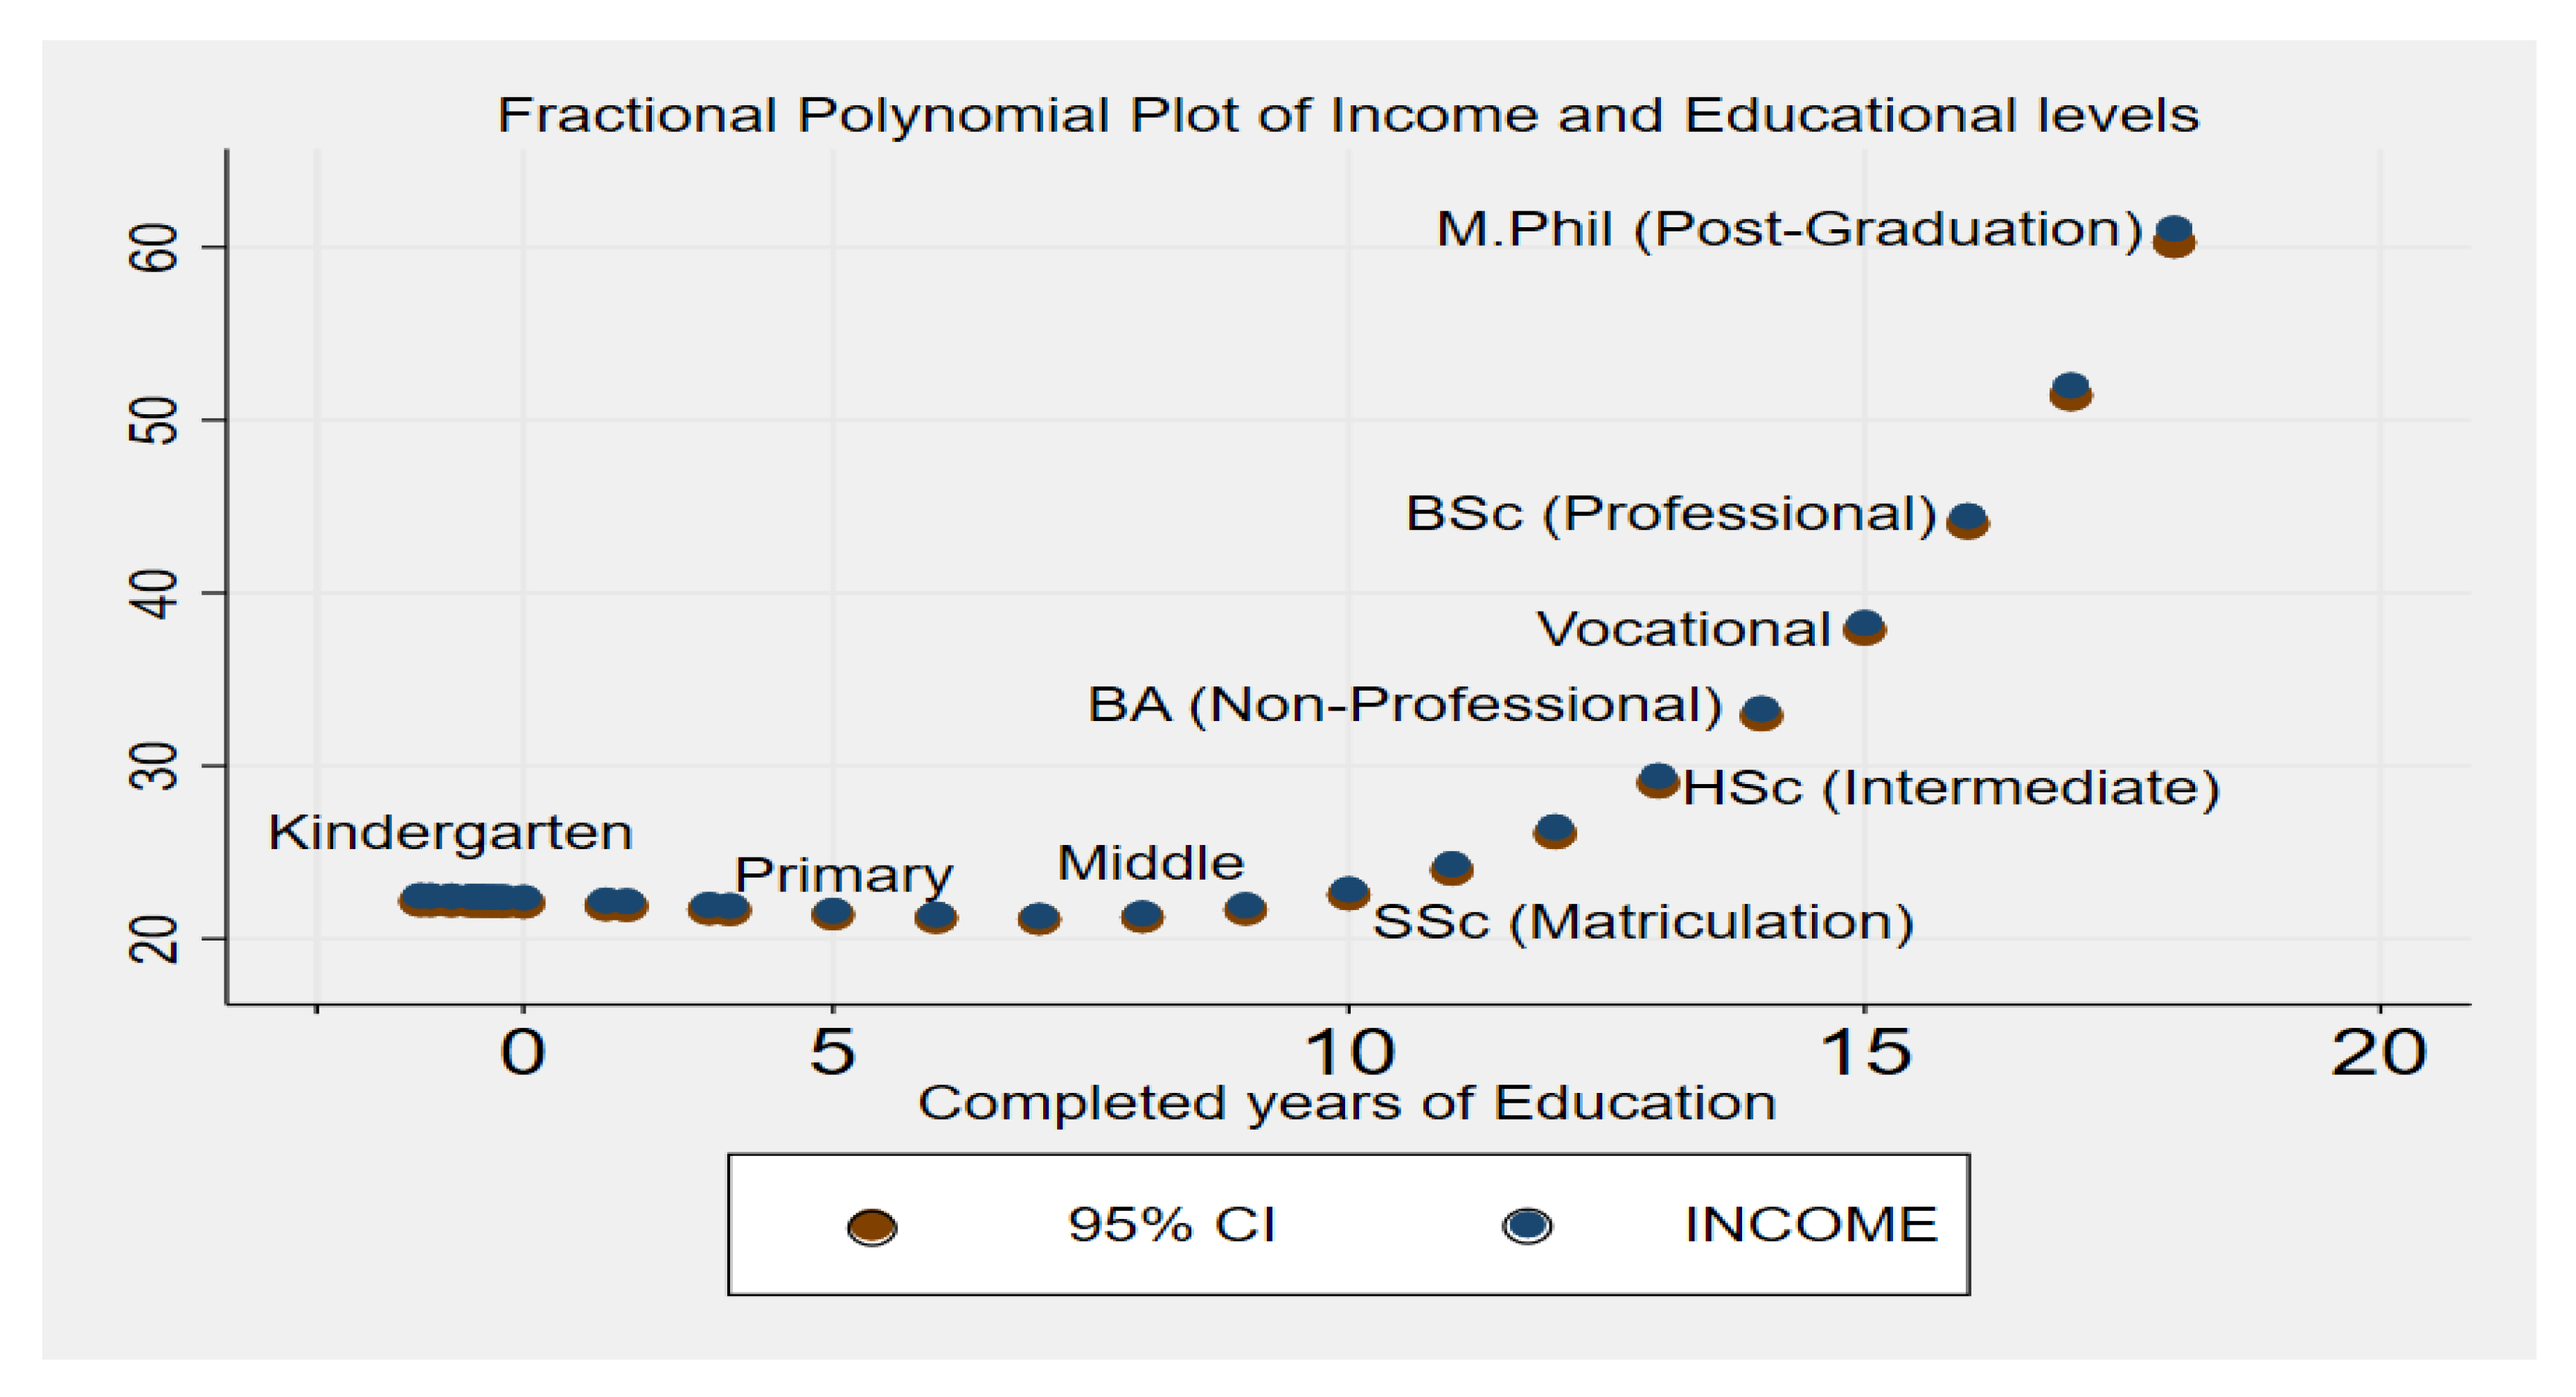
Figure 1. Average earnings for each level of education. Source: Pakistan Bureau of Statistics 2011 sample from public sector employees; author’s calculation.
Sustainability 12 02393 g001
Figure 2. Capital investment toward the outcomes. Author-designed schematic diagram.
Sustainability 12 02393 g002
Figure 3. This figure depicts the monthly log earnings of public sector employees with 16 years (BS(honors)) education and 18 years (MS(honors)) education from the sample period.
Sustainability 12 02393 g003
Table 1. Descriptive statistics (enrolment)
MaleFemale
MeanStd. Dev.MeanStd. Dev.
Log Wage (Pkr)1.53230.87841.51300.5894
Income26,773.8213,320.3324,423.5521,340.71
S4.46432.13584.12872.0744
AGE31.66191.846631.25081.0178
EXP12.88477.989112.76575.1641
Director Manager0.14270.34980.09550.2940
Professional0.05760.23310.15780.3647
Associated Teachers0.09870.29840.09130.2882
Agriculture and Fisheries0.09490.29320.11790.3226
Supervisors0.00100.03310.02530.4350
Finance0.02410.15350.02340.4167
Plant and machine operator0.11630.32070.07890.2697
Clerks0.24030.42740.19090.3914
Elementary0.22610.41840.13000.3340
Public 0.64270.47930.57470.4945
Private 0.35720.47930.42520.4945
Data Source: Household Integrated Economic Survey (HIES), conducted every year by the Pakistan Bureau of Statistics, figures are based on a stochastic subsample; Log Wage in Pakistani rupee (Pkr).
Table 2. Estimated coefficient of (logWi) Equation (1).
VariablesMincer Model
Equation (1a)Equation (1b)Equation (1c)
α0.9280
(0.090) ***
1.1226
(0.041) **
1.1675
(0.046) ***
S0.024
(0.005) ***
0.026
(0.002) **
0.027
(0.002) ***
Exp0.050
(0.007) **
0.049
(0.003) **
0.049
(0.004) ***
Exp2−0.001
(0.0002) ***
−0.001
(0.0001) ***
−0.0014
(0.0001) ***
D6−0.779
(0.083) **
−0.938
(0.038) **
−0.974
(0.043) *
D10−0.06
(0.069)
0.0005
(0.032) *
0.002
(0.036)
D120.257
(0.063)
0.254
(0.029) **
0.241
(0.032)
D140.313
(0.033) **
0.294
(0.015) **
0.290
(0.017) *
D150.337
(0.029) ***
0.328
(0.013) *
0.325
(0.015) ***
D160.387
(0.033) **
0.377
(0.015) **
0.374
(0.017) ***
D180.558
(0.029) ***
0.556
(0.013) **
0.556
(0.015) ***
R-squared0.38900.35890.3524
No. Obs.302615,25712,231
Note: Estimated coefficients are significantly different from zero at * at 10% level; ** at 5% level and *** at 1% level. Standard Errors are reported in the parenthesis.
Table 3. Estimated coefficient of (logWi) Equation (2).
VariableSpline Function
Equation (2a)Equation (2b)Equation (2c)
α0.987
(0.087) ***
1.203
(0.040) **
1.254
(0.045) ***
S0.1140.1270.130
(0.004) ***(0.001) **(0.001) ***
Exp0.050679
(0.007) ***
0.049
(0.003)
0.048
(0.004) **
Exp2−0.001438
(0.0002) ***
−0.001
(0.0001) ***
−0.001
(0.0002) **
D6−0.637
(0.085) **
−0.800
(0.038) ***
−0.837
(0.043) ***
(S-6) *D60.083
(0.016) **
0.085
(0.007) ***
0.085
(0.008) **
D100.1642
(0.217) *
0.170
(0.098)
0.171
(0.111)
(S-10) *D100.080
(0.033) ***
0.091
(0.015) ***
0.094
(0.017) **
D12−0.721
(0.274) *
−0.826
(0.124) ***
−0.853
(0.138) **
(S-12) *D12−0.148
(0.030) ***
−0.159
(0.014) **
−0.162
(0.015) **
D140.318
(0.033) **
0.299
(0.015) **
0.295
(0.017) ***
D150.344
(0.028) ***
0.334
(0.013) ***
0.332
(0.015) ***
D160.398
(0.033) *
0.390
(0.015) **
0.388
(0.017) **
D180.553
(0.029) ***
0.549
(0.013) ***
0.549
(0.015) ***
R-squared0.39620.36640.3600
F-test164.801 ***734.7497 ***572.755 ***
No. of Obs.302615,25712,231
Note: Estimated coefficients are significantly different from zero at * at 10% level; ** at 5% level and *** at 1% level. Standard Errors are reported in the parenthesis.
Table 4. Estimated coefficient of (logWi) Equation (3).
Public SectorPrivate Sector
MaleFemaleMaleFemale
α1.63079
(0.1541) ***
1.5072
(0.2507) ***
1.6104
(0.2061) ***
1.6424
(0.3060) ***
S0.1669
(0.0173) ***
0.1574
(0.0138) ***
0.1741
(0.0235) ***
0.1547
(0.0164) ***
Exp0.0282
(0.0121) ***
0.0520
(0.0153) ***
0.0270
(0.0162) ***
0.0354
(0.0178) ***
Exp2−0.0004
(0.0003) **
−0.0014
(0.0004) ***
−0.0003
(0.00051) ***
−0.0009
(0.0005) ***
D6−0.5018
(0.1252) ***
−0.6613
(0.1348) ***
−0.4295
(0.1692) ***
−0.7122
(0.1669) ***
(S-6) *6−0.1358
(0.0536) **
−0.0454
(0.0523) *
−0.1183
(0.0723) *
−0.0233
(0.0576)
D100.2138
(0.1276) **
0.0915
(0.1147) *
0.1929
(0.1705) **
0.1500
(0.1385) **
(S-10) *10−0.1580
(0.0576) ***
−0.0884
(0.0445) **
−0.1664
(0.0817) **
−0.0841
(0.0527) *
D120.2350
(0.0835) ***
0.1548
(0.0797) ***
0.2030
(0.1123) ***
0.1890
(0.0953) ***
(S-12) *120.2318
(0.0427) ***
0.1195
(0.0390) ***
0.2299
(0.0597) ***
0.1042
(0.0447) ***
D140.2980
(0.0557) ***
0.2027
(0.0775) ***
0.2974
(0.0753) ***
0.2165
(0.0921) ***
D150.3127
(0.0434) ***
0.2473
(0.0522) ***
0.3041
(0.0588) ***
0.2359
(0.0612) ***
D160.3550
(0.0554) ***
0.2930
(0.0685) ***
0.3350
(0.0737) ***
0.2695
(0.0797) ***
D180.4680
(0.0467) ***
0.3792
(0.0541) ***
0.4879
(0.0632) ***
0.3988
(0.0641) ***
D10*Exp−0.0059
(0.0138)
−0.0204
(0.0224) **
−0.0127
(0.0186)
−0.0200
(0.0242) **
D12*Exp−0.0313
(0.0190) **
−0.0247
(0.0244) **
−0.0403
(0.0255) ***
−0.0163
(0.0282) *
D16*Exp0.0356
(0.0180) ***
0.0269
(0.0311) ***
0.0348
(0.0239) **
0.0285
(0.0339) ***
R-Squared0.46290.42400.46620.4171
F-Statistics61.74 ***32.34 ***34.77 ***22.00 ***
No. of Obs1163720654509
Note: Estimated coefficients are significantly different from zero at * at 10% level; ** at 5% level and *** at 1% level. Standard Errors are reported in the parenthesis.
Table 5. Labor market outcomes related with diplomas.
All Variables(b) Fixed-Effects(B) Random-EffectsHausman Test
Coef. (Std. Err.)Coef. (Std. Err.)Difference (b)-(B) (Std. Err.)
α3.616
(0.383) ***
3.161
(0.344) ***
age−0.0111
(0.005) **
−0.010
(0.004) **
−0.0008
(0.0028)
Exp0.410
(0.255) *
0.407
(0.209) *
0.0035
(0.1463)
Exp2−0.00005
(0.0005) ***
−0.0002
(0.0005) ***
0.0001
(0.0001) **
D6−3.137
(0.437) ***
−2.668
(0.391) ***
−0.4689
(0.1944) ***
D10−1.902
(0.597) ***
−1.423
(0.563) **
−0.4787
(0.1982)
D120.566
(0.201) ***
0.247
(0.175)
0.3192
(0.0973)
D14−0.173
(0.261)
0.322
(0.221)
−0.4960
(0.1403) **
D151.146
(0.197) ***
0.927
(0.180) ***
0.2186
(0.0786) **
D162.081
(0.588) ***
1.499
(0.541) ***
0.5822
(0.2284) ***
D181.367
(0.281) ***
1.729
(0.244) ***
−0.3614
(0.1393) ***
R2
Within0.94230.9355
Between0.45370.6063
Overall0.82400.8609
Note: Estimated coefficients are significantly different from zero at * at 10% level; ** at 5% level and *** at 1% level. Standard Errors are reported in the parenthesis.