Abstract
Previous applications of DEA (data envelopment analysis) models in the field of franchising have been scarce. In particular, measurement and analysis of the operational efficiency of coffee shop franchisors in the explosively growing coffee market in Korea is required. In this study, we categorize 29 Korean coffee shop franchisors into three groups according to their number of franchisees and employ the metafrontier analysis to measure the efficiency of coffee shop franchisors from 2015 to 2018. Based on the results of metafrontier DEA, this study identifies sources of inefficiency within individual coffee shop franchisors to provide insights for coffee franchise operators and investigates efficiency differences between small-chain and medium-chain coffee shop franchisors. Furthermore, the results of bootstrapped truncated regression provide that the external environmental factors affecting the efficiency of each individual group are totally different patterns depending on the franchise group. Based on the analysis results, this study suggests strategic initiatives tailored to individual coffee shop groups to enhance their operating efficiency and identifies the principal operational drivers of the environmental variables to achieve sustainable growth.
1. Introduction
Due to the skyrocketing coffee consumption in Korea, coffee shop chains are one of the fastest-growing service industries in Korea. Recently, Korea has grown to become the world’s sixth-largest coffee consuming country, following Europe and the United States. Global coffee brands such as Starbucks, Costa Coffee, and Blue Bottle, as well as domestic brands such as EDIYA and YOGERPRESSO, are especially in competition with each other to attain a competitive advantage in the Korean coffee market by continuously innovating their operations. Moreover, Korean coffee shop brands such as EDIYA and A Twosome Place have grown into mega coffee shop franchisors with more than 1000 outlets (franchisees) in Korea [1,2].
In the explosively growing coffee market in Korea, measurement and analysis of the relative operation efficiency of coffee shop franchisors are required to strengthen the franchisors’ core capabilities and to manage coffee shop franchisees successfully [3]. Therefore, this study measures the relative efficiency of 29 coffee shop franchisors in Korea from 2015 to 2018 based on the premise that the franchisors’ brand can maintain sustainable growth by managing their franchisees effectively and efficiently. This efficiency index can provide strategic initiatives in establishing an operational plan for coffee shop franchisors and offer more efficient internal resource allocation and coordination to achieve their operational objectives [4,5,6].
Meanwhile, a set of coffee shop franchisors has technological homogeneity in that they deliver various types of coffee and beverages to customers visiting coffee shop franchises, but it also has heterogeneities in production technology due to size differences between mega-chain and small-chain coffee shops, which ultimately induce the franchisor to have differentiated operating patterns and alternatives for the franchisee [2,7,8,9]. For instance, the EDIYA coffee shop brand with 2142 chains and the Coffine Gurunaru brand with 50 chains in 2018 have homogenous characteristics as coffee shop franchisors, however, their operation strategies for the franchises differ depending on the number of franchisees. Thus, if coffee shop franchisors with both homogenous and heterogeneous characteristics are analyzed together within the same production set, this can lead to inaccuracies and analytical errors in efficiency analysis [8,9]. In comparing a franchisor’s efficiency among individual groups with different strategic characteristics, the efficiency of heterogeneous groups should be measured separately, depending on their operational alternatives and business model [9,10]. This procedure mainly offers efficient operating resource allocation policies and strategic benchmarking initiatives to compare franchisors’ operation efficiency with industry best practices.
In this study, we categorize Korean coffee shop franchisors into three groups according to their number of franchisees , such as large coffee shop chains , medium coffee shop chains , and small coffee shop chains . Based on these classifications, we employed a metafrontier analysis that allows each group to have its own group frontier to compare the efficiency levels of other groups operating under different technical conditions. That is, the metafrontier production function is defined as a common boundary that envelops the group frontiers (GF) [7,8,9]. Additionally, this metafrontier methodology offers a technology gap ratio (TGR), which is expressed as the distance between the group frontier and the metafrontier [11,12]. Based on the results of the metafrontier analysis, this study investigated the efficiency difference among coffee shop franchisors’ groups in Korea based on the Kruskal-Wallis test. Thus, this study suggested strategic initiatives tailored to individual coffee shop groups to enhance their operating efficiency and sustainable growth of coffee shop franchisors. Moreover, we identified the principal operational drivers of the environmental variables to increase the coffee shop franchisors’ efficiency in Korea by double bootstrapping truncated regression suggested by Simar and Wilson [13,14]. Identifying how external determinants impact operational efficiency is essential for coffee franchisors to identify performance improvement strategies. The specific research questions addressed in this study are as follows:
- Research Question 1: What are the main reasons for the observed inefficiency (e.g., pure technical inefficiency or scale inefficiency) in coffee shop franchisors in Korea?
- Research Question 2: Is there any difference in efficiency among coffee shop franchisors’ groups in Korea?
- Research Question 3: What are the principal determinants affecting operational efficiency, from the perspective of coffee shop franchisors’ group respectively?
The remainder of this paper is structured as follows: The theoretical background of previous studies on franchise efficiency is reviewed in the next section. Section 3 describes the methodologies used in our study. Section 4 defines the research model and input/output variables necessary for DEA (data envelopment analysis) and explores the characteristics of the decision-making units (DMUs). Section 5 presents the empirical metafrontier results, namely, the analysis of annual meta efficiency (ME), group efficiency (GE), and TGR of Korean coffee shop franchisors. Section 6 investigates the main driver of environmental factors to increase ME. Lastly, Section 7 discusses these results and presents the study’s conclusions, limitations, and research opportunities.
2. Literature Review of Franchise Efficiency
In franchise efficiency literature [2,15,16,17,18,19,20,21], a few studies have applied non-parametric DEA to measure the franchise efficiency of an individual decision-making unit (DMU), as seen in Table 1. The DEA model uses all observed franchising networks to assess the relative efficiency of each observed chain, comparing its productive results to those of all the sample chains. Table 1 tabulates previous studies on franchise efficiency, which are based on the employed methodology, DMUs’ characteristics, and different inputs/outputs variables.

Table 1.
Literature Review of Franchise Efficiency.
Barros and Perrigot [15] explored the franchising network performance, and more specifically, the relative franchising network efficiency of the US franchising sector, using a population of 150 franchising networks whose data are published in the Entrepreneur’s 25 Annual Franchise 500® (www.entrepreneur.com/franchises/500. Botti et al. [16] analyzed efficiency with DEA models of franchises versus other organizational forms on French hotel chains to discusses the hypothesis that there is a relationship between the organizational form of the chain and its efficiency score. The results of study demonstrated that plural form networks are, on average, more efficient than strictly franchised and wholly owned chains. In a similar perspective, Roh and Choi [17] empirically compare and contrast the efficiency of multiple brands within the same franchise in the Pacific Rim utilizing DEA methodology. In addition, Martin et al. [18] measured the super-efficiency of 143 franchises in the trade and other services sector in Spain and characterized the best companies, confirming the relationship between efficiency and profit. This study suggested that, whilst the number of establishments is irrelevant in achieving greater efficiency, many of the most efficient enterprises have high returns. More recently, Kim et al. [2] analyzes the efficiency in the operation of the top six coffee franchisors in Korea with the aim to find out what the consumers think is important in the selection of coffee franchises and what factors meet their demands.
In franchise efficiency literature using metafrontier DEA, Medal-Bartual et al. [19] adopted a non-concave metafrontier DEA approach to enable a comparison between different groups, and takes into account any heterogeneity between the franchise firms of several sectors. This study compared the techno-economic efficiency of small franchise firms from the five main economic sectors in Spain. Additionally, Piot-Lepetit et al. [20] analyze the impact of the industry in which the franchisor operates its business on its chain efficiency by comparing 43 chains’ efficiency between and across industries (retail versus services) using a meta-DEA and a context-dependent DEA. In this study, they developed a level-by-level benchmarking path with the context-dependent DEA approach to provide realistic short-term and long-term objectives to inefficient chains.
3. Methodology
3.1. Analysis Technique (1): Metafrontier DEA Model
Traditional DEA models consider the units selected for analysis as a homogenous group, thus, it is supposed that all the considered DMUs use the same technology and are completely homogenous organizations [18]. Comparisons of technological efficiencies among groups cannot be performed using conventional DEA because the technical efficiency of a particular company is difficult to compare with that of others operating with other technologies [9,10]. However, franchising activity includes numerous and diverse sectors and groups, such as travel agencies, hotels, restaurants, and fashion outlets. This fact makes us to suppose that there can be differences between the efficiency of franchise firms depending on their belonging sector or their franchise group managed by individual franchisors [18]. To account for this heterogeneity problem, there are several approaches that take account of different production technologies. In particular, Battese et al. [7], Battese and Rao [22], and O’Donnell et al. [23] consider the fact that technology could differ across regions and develop the stochastic metafrontier approach. A metafrontier approach is able to measure efficiencies of DMUs associated with distinctive and heterogeneous technologies. This involves a metafrontier estimation, which represents the envelope of all stochastic production frontiers for all groups or regions, as seen in Figure 1. The limits for groups such as T1, T2, and T3 can be differences in country geography, regional production environment, or the economic development of each area or region [23,24]. The difference between these two values is the technology gap, measuring the distance gap between the group frontier and the metafrontier in Figure 1 [24].
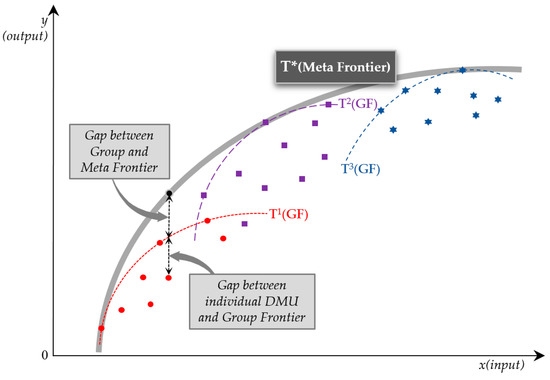
Figure 1.
Research model for metafrontier in the Korean coffee shop franchise.
This study uses the stochastic frontier analysis (SFA) to measure the effectiveness of coffee shop franchise brands in Korea and a metafrontier production function that involves the production function of all groups to compare the efficiency levels of three other groups (large-, medium-, and small-chain) of franchise brands operating under different technical conditions. For more details on this metafrontier approach, see Assaf [8], Battese and Rao [22], and O’Donnell et al. [23].
Technical efficiency for the i-th coffee shop franchisor indexed for a particular group k frontier can then be computed estimating a stochastic production frontier for each group as follows:
where is now a column vector of inputs for the i-th coffee shop franchisor associated with the k group. is the estimated (unknown) parameter for the k-th group. is the statistical random error, which is assumed to be independent and identically distributed with mean zero and variance []. The technical inefficiency term is non-negative unobservable random error and assumed to be half normal distributed with variance [22,23]. The technical efficiency indicator for coffee shop franchisor i-th for the k-th group is given by the ratio of the actual output to the output at the frontier such as in (2).
O’Donnell et al. [23] defined a deterministic metafrontier as Equation (3), where denotes the metafrontier output and is a vector of metafrontier parameters which satisfies the condition (4). The metafrontier production function model from Battese et al. [22] is defined as follows:
From Equations (3) and (4), the graph of the metafrontier production function is located above the graph of the production frontier function of each group for all periods. To simplify, Equation (1) can be transformed as (5):
In Equation (5) shown above, the second part is the ratio of the K group frontier production function to the metafrontier production function, which is expressed as either the TGR or the meta-technology ratio (MTR), measuring the distance between the group frontier and the metafrontier. O’Donnell et al. [16] indicated that a higher TGR implied that the gap between the group frontier and the metafrontier was shrinking. In effect, the MTR takes a value between 0 and 1, where 1 indicates no gap between the DMU in a particular region and the metafrontier.
The , representing the technical efficiency of the metafrontier function, is decomposed as the product of and , and can be expressed as follows:
Above all, the metafrontier approach is able to measure the efficiencies of DMUs associated with distinctive technologies and estimate the technical efficiency, TGR, and metafrontier efficiency of each group [8,22,23,24].
3.2. Analysis Technique (2): Simar and Wilson’s Bootstrap-Truncated Regression
Non-parametric approaches such as DEA are primarily concerned with estimating a production-possibility frontier and measuring the distance of observed input-output combinations to this frontier. However, shedding light on what determines the magnitude of this distance is out of the narrow scope of non-parametric approaches. When analyzing what determines the efficiency of production, regressing efficiency scores estimated by DEA on explanatory variables has much intuitive appeal. To overcome this limitation of non-parametric approaches, Simar and Wilson [13,14] proposed the semi-parametric bootstrap to provide bias-corrected technical efficiency scores in DEA. They construct an underlying data generating process that is consistent with a two-stage estimation procedure, which implies a truncated rather than censored regression model. Moreover, they develop a parametric bootstrap procedure that is consistent with the assumed data generating process to yield estimated standard errors and confidence intervals that do not suffer from bias due to estimated efficiency scores being correlated [25].
Simar and Wilson [13,14] considered a well-defined, coherent statistical model in which a second-stage regression is meaningful, in the sense that the form of the second-stage regression equation is determined by the structure of the model in the first stage where the initial DEA estimates are obtained. In an attempt to rationalize studies where second-stage regressions have been estimated but no statistical model has been specified, Simar and Wilson [13,14] introduced assumptions that led to a truncated regression in the second stage which can be estimated consistently using the maximum likelihood (ML) method. This study employs Simar and Wilson’s bootstrap algorithm as suggested by Badunenko and Tauchmann [25] and Barros and Assaf [26]. The main assumption is that the original efficiency score is given by and can be translated into the following regression specification:
where . is a smooth continuous function, is a vector of the environmental variables, is a vector of parameters estimated by maximum likelihood, and is a continuous i.i.d random variable independent of .
The steps of the algorithm are presented below:
Step 1: Estimate the efficiency score
using DEA.
Step 2: Fitting truncated regression using the maximum likelihood (ML) method to obtain estimates of and an estimate of .
- Efficient DMUs excluded
- . (input-orient): right-truncation at 1
- (output-orient): left-truncation at 1
Step 3: Repeat steps 3.1 to 3.3 B times (b = 1, …, B ) to obtain a set of bootstrap estimates.
- 3.1.
- For each draw with left-truncation at
- 3.2.
- For each , compute
- 3.3.
- Estimate and through the truncated regression model using the artificial efficiency scores as lhs-variable
Step 4: Construct standard errors for and (confidence intervals for and ) from the simulated distribution of and .
For the sake of brevity, we refer the reader to Simar and Wilson [13,14] and Barros and Assaf [26] for the details of the smoothed bootstrap-based DEA algorithm for computing efficiency.
4. Research Model and Data
In general, franchising is a business arrangement in which a business owner licenses the right to use another company’s business system, name or names, logos, and trademarks [18,19,20,27,28]. Typically, an individual or company pays an initial franchising fee to the company that owns the franchise, along with regular royalty payments for continued use of the system and intellectual property. There are two parties with different positions in a franchise business: franchisor (ownership) and franchisee (responsibilities) [18,19]. The difference between a franchisor and franchisee is similar to the licensee, licensor difference. The franchisor is the established business and the parent company that allows a third party (individual or business entity) to start and run a business using its trademarks, products and processes, usually for a fee. The franchisee is an individual or entity who purchases the right to operate a franchise business under the franchisor’s name and system. That is, the franchisor owns the brand, the brand’s trademarks, and sets the terms for licensing a franchisee to use the brand’s name and its trademarks. The franchisee operates a business under the franchise’s brand [17,18,20]. In this study, we investigated the efficiency of coffee shop franchisors that have a franchising arrangement with a number of franchisees in Korea.
Essentially, conventional DEA models rely primarily on the assumption that all DMUs have a set of DMUs sharing homogeneous technology. However, significant operating size disparities such as resource limitation, operational strategies, and management level in Korean coffee shop franchises provide a realistic basis for studying the franchisor’s operation efficiency in the presence of heterogeneity, which can be implemented by conducting a metafrontier analysis [22,25]. In particular, Korean coffee shop franchisors can be classified into three groups according to their number of franchisees , such as large coffee shop chains , medium coffee shop chains , and small coffee shop chains . Although these coffee shop franchisees have the homogenous characteristics of providing coffee and beverage services to customers, the franchisor’s operational policies appear to be somewhat heterogeneous, depending on the number of franchisees managed by individual franchisors [1,18,19,20,27,28].
To compare the contemporaneous meta efficiency (ME) of the 29 Korean coffee shop franchisors, financial and non-financial data were collected from the ‘Korean Franchise Ranking’ published by Startup & Business’ newspaper (sbiznews.com) and the Fair Trade Commission (franchise.ftc.go.kr), a ministerial-level central administrative organization in Korea, from 2015–2018. Based on the previous literature review and data availability, we employ () Franchisor’s Employee, () Franchisee’s Average Sales, () Number of Franchisee as input, and () Franchisor’s Financial Stabilization, () Franchisor’s Total Sales, () Franchisor’s Total Asset as output variables to measure ME.
The definition of input/output variables illustrated by ‘Korean Franchise Ranking’ is as follows:
- Franchisor’s Employee: The number of both full and part time employees of the franchise parent company, e.g., franchise supervisor and franchise development manager.
- Franchisee’s Average Sales: The annual gross sales amount per franchisee during a given period.
- Number of Franchisee: The total number of franchised outlets under the franchisor’s brand and system.
- Franchisor’s Financial Stabilization: This financial indicator includes the current ratio, capital adequacy ratio, debt to equity ratio, and cash flow ratio of franchise parent company.
- Franchisor’s Total Assets: The sum of total current and intangible assets, long term receivables, investment in unconsolidated subsidiaries, other investments, net property plant and equipment and other assets.
- Franchisor’s Total Sales: An annual gross sales amount per franchisor, including (a) franchisees’ sales-based royalties, (b) initial franchise fee revenue, and (c) revenue allocated to goods and services distinct from the franchise’s right.
Additionally, a set of external environment variables used in the bootstrapped truncated regression are as follows: () Total Franchise Fee, () Franchise Turnover/Failure Rates, () Advertisement and Promotions, () Growth Rate of Franchisor, () Franchisor’s Management Control, () Franchise History, and () ROE (Return on Equity) of Franchisor, as seen in Figure 2 and Table 2.
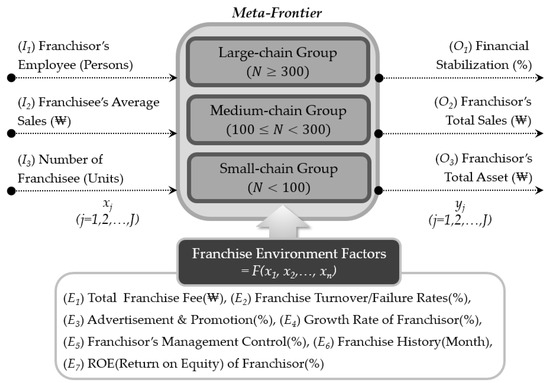
Figure 2.
Research model for metafrontier in the Korean coffee shop franchise.
Table 2.
Input-output variables in the Korean coffee shop franchise from 2015 to 2018.
In general, most coffee shop franchisors strive to trigger a franchisee’s sales volumes through the franchisor’s continuous management control of the franchisee, ultimately promoting the franchisor’s total sales and maintaining the franchisor’s sustainable growth [17,18,19,20,27,28]. Thus, this study used output-oriented DEA to estimate and compare the contemporaneous efficiency score of Korean coffee shop franchisors from 2015 to 2018. In an output-oriented DEA model, an inefficient unit is made efficient through the proportional increase of its outputs, while the inputs’ proportions remain unchanged.
Table 2 summarizes descriptive statistics related to the changes in inputs/outputs from 2015 to 2018 used in the metafrontier DEA. Additionally, this study used the MaxDEA 6.9 (maxdea.com) and STATA 14 software packages to measure the metafrontier DEA estimations and second-stage truncated bootstrapped regression suggested by Simar and Wilson [13,14].
5. Empirical Metafrontier Results
In this study, we measured the ME, GE, and TGR of coffee shop franchisors in Korea on the premise that franchisors carried out different types of operations and differentiated resource utilization according to the number of franchisees. By using a metafrontier production function, this study compared the efficiency levels of other groups operating under different technical conditions. Based on the results of the metafrontier analysis, this study suggests strategic operation initiatives by decomposing whether the change in efficiency of the individual DMU is caused by changes in the technology level of the individual DMU or changes in the efficiency within the group.
Table 3 and Figure 3 show the metafrontier (MF), group frontier (GF), and TGR scores of coffee shop franchisors in Korea from 2015 to 2018. First, average MF for large coffee shop chain franchisors (0.8875) is ranked first, followed by small coffee shop chains (0.8342) and medium coffee shop chains (0.8028), under the constant returns-to-scale (CRS) assumption. Meanwhile, on the basis of the variable returns-to-scale (VRS), large-chain franchisors (0.9384) have the highest ME, followed by medium-chain franchisors (0.8985) and small-chain franchisors (0.8921).
Table 3.
Metafrontier score comparison among the Korean coffee shop franchise from 2015 to 2018.
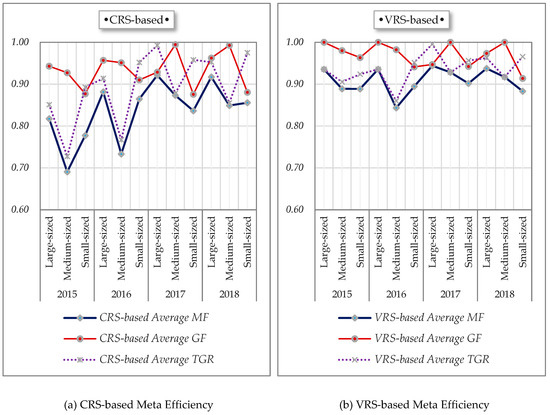
Figure 3.
Average metafrontier (CRS-based and VRS-based) score comparisons from 2015 to 2018.
Second, on the basis of group efficiency (GE), the rank of average GF scores is in the following order: medium-chain franchisors (CRS-based average GF: 0.9727, VRS-based average GF: 0.9926), large-chain franchisors (CRS-based average GF: 0.9476, VRS-based average GF: 0.99783), and small-chain franchisors (CRS-based average GF: 0.8869, VRS-based average GF: 0.406).
Third, the TGR refers to the distance between the group frontier and the metafrontier, which is also the ratio of the optimal group frontier to the optimal metafrontier for the DMU in question. The closer the ratio is to 1, the closer the optimal group frontier is to the optimal meta-frontier for the DMU concerned. As seen in Table 3 and Figure 3, in terms of the TGR of Korean coffee shop franchisors, the medium-chain franchise group (CRS-based average TGR: 0.8200, VRS-based average TGR: 0.9051) is ranked lower in the TGR, which is farthest away from the metafrontier. Therefore, the medium-chain franchise group requires strategic alternatives to reduce the distance from the group frontier to the metafrontier. Looking at the yearly change of the TGR in Figure 3, the lowest TGR score is in 2015; regardless of the size of franchisors, however, this score exhibits an upward trend.
Meanwhile, this study conducted the Kruskal–Wallis H test to compare the GE of the Korean coffee brands depending on the size of franchisors. The results revealed that, test statistics) = 7.876(CRS) and 7.002(VRS), Asymp. Sig = 0.019(CRS) and 0.030(VRS) < 0.05, showing a statistically significant difference, and thus indicating that there is a difference in the medians among the large-, medium- and small-chain groups of Korean coffee brands. The mean rank is in the following order: (CRS-based) Medium, 65.12; Large, 63.43; Small 49.65 and (VRS-based) Medium, 63.03; Large, 61.27; Small 51.48.
In addition, a pairwise comparison was performed to conduct a post-hoc test on how each franchisor group is different. Table 4 shows the pairwise comparison results by franchisor group, which prove that there are significant differences between the Small-Medium group. However, the Small-Large and Large-Medium groups have no significant differences.
Table 4.
Pairwise comparison using the Kruskal–Wallis test for GE scores among coffee franchise groups.
This study measured the technical efficiency (TE: CRS-based), pure technical efficiency (PTE: VRS-based), and scale efficiency (SE) scores of 29 coffee shop franchisors in Korea, as seen in the Appendix A Table A1. In particular, coffee franchisor brands such as Amasvin, EDIYA COFFEE, and HOLLYS COFFEE have almost maintained a TE and PTE score of 1 from 2015 to 2018, whereas Arista (CRS-based: 0.5108, VRS-based: 0.6392) and YOGERPRESSO (CRS-based: 0.5918, VRS-based: 0.7031) have noticeably low efficiency scores.
In terms of efficiency of individual DMUs, the ratio of constant returns-to-scale is 36.6% out of 112 overall DMUs. Moreover, a close look at the main driver of inefficiency in coffee shop franchisors reveals that the inefficiency is relatively attributed to pure technical inefficiency rather than scale inefficiency , which implies that coffee shop franchisors failed to allocate service resources efficiently and had poor input utilization (i.e., managerial inefficiency). Consequently, these DMUs with pure technical inefficiency need innovative operating policies and alternatives to improve managerial performance.
From an RTS (Return-to-Scale) perspective, 20.5% of DMUs were located in the increasing returns-to-scale regions (IRS), indicating that these DMUs in the IRS region need to expand their business size to dramatically improve efficiency. Conversely, 42.9% of DMUs were in the decreasing returns-to-scale regions (DRS) region. In general, a DRS occurs when the proportion of output ( is less than the desired increased input (. This is a managerial inefficiency mainly caused by a complexity of communication and the decision-making system within a business entity. Thus, DMUs in the DRS region can improve their efficiency levels by optimizing business size such as eliminating overcapacity and adjusting overlapping employee responsibilities.
6. Determinants of Meta Efficiency
While standard DEA is simple in estimating the relative efficiency among DMUs, it is limited in terms of identifying the relation between the efficiency score and its external determinants on efficiency. To examine how environmental variables exert a significant impact on Korean coffee shop franchisors’ measured efficiency, we adopted the bootstrapped truncated regression suggested by Simar and Wilson [13,14]. The estimated specification for the regression is:
where is the bootstrapped bias-corrected efficiency score of the original metafrontier scores of individual coffee shop franchise brand i, which is a valid estimate for the parameters in the regression model [13,14]; is a constant term, are coefficients of technical ME determinants in Korean coffee shop franchisor operating environments, and is the error term (statistical noise).
Following Badunenko and Tauchmann [25], we employ a STATA 14 program to obtain unbiased coefficients and confidence intervals with 2000 replications. A set of exogenous covariates affecting CRS- and VRS-based ME scores were developed for the second-stage regression analysis, which represents the operating environments of a coffee shop franchisor in Korea, i.e., Franchise History (Hisi), Total Franchise Fee (Feei), Advertisement and Promotion (Advi), Franchisor’s Management Control (Coni), Growth Rate of Franchisor (GRi), Return on Equity of Franchisor (ROEi) and Franchise Turnover/Failure Rates (Faili) [29,30]. The estimated coefficients and significance levels are shown in Table 5.
Table 5.
Bootstrap-truncated regression: the effect of a franchisor’s environmental attributes on the metafrontier scores based on CRS and VRS.
The Wald test statistics [e.g., 27.89 (large-chain, CRS), 25.08 (medium-chain, CRS), 18.62 (small-chain, CRS) and 25.85 (large-chain, VRS), 17.47 (medium-chain, VRS), 18.77 (small-chain, VRS)] reject the null hypothesis that the parameters in the regression equation are jointly equal to zero. Additionally, all the sigma values, or the robust standard deviation in the truncated regression of the reciprocal of the DEA score on environmental variables, are statistically significant at the 0.01 level.
Considering the effects of seven explanatory variables on the ME of a large coffee shop franchisor group, Total Franchise Fee and Growth Rate of Franchisor have a positive and statistically significant effect on the ME of a large-chain franchisor group at each significance level, but other variables do not have a statistically significant relationship between the franchisor’s operating environment and the ME of a large-chain franchisor group.
From the perspective of ME of a large coffee shop franchisor group, the incremental number of franchisees augments the franchisors’ total sales by the non-refundable up-front fee for each new franchisee location and the ongoing sales-based royalties received over the term of the franchise agreement. This leads to stabilize a financial status of franchisors through the expansion of franchisors’ total assets quantitatively and qualitatively. The higher financial growth of the franchisor not only expands the market size of the Korean coffee franchisors, but also further increases the number of preliminary franchisees, as seen in Figure 4 (R1/R2/R3 reinforcing loop). However, franchisees exceeding a certain limited number are beyond the controllability of a franchisor’s management, and this gives rise to weaken the franchisors’ control or supervision over franchisees (B1 balancing loop). Thus, franchisors require new strategic initiatives and alternatives to maintaining sustainable growth depending on changes in the number of franchisees.
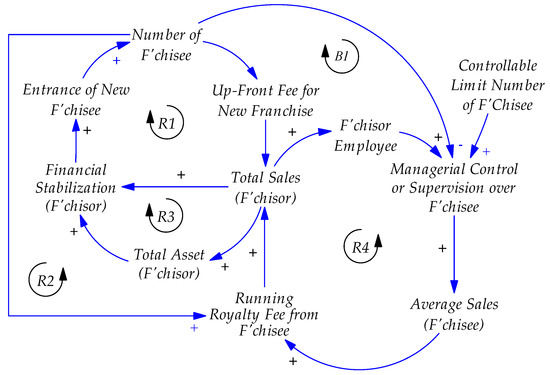
Figure 4.
Causal Loop Diagram on the Profit Chain of the Korean Coffee Shop Franchise.
Meanwhile, the franchisor’s operating environment variables with a significantly positive effect on the ME of a small-chain franchisor are Franchisor’s Management Control and ROE (Return on Equity) of Franchisor .
These results demonstrated that small-chain franchisor groups can increase ME with ongoing supervision over franchisees. That is, small-chain franchisor groups can enhance their efficiency by strengthening the more systematic training and education systems for manpower such as the franchisor’s supervisor or franchise manager. This leads to increase average sales of franchisees, which ultimately contribute to enlarge total sales of franchisors, as seen in Figure 4 (R4 reinforcing loop). Thus, small-chain franchisors require strategic initiatives to strengthen their capabilities for the sustainable growth of a Korean coffee shop franchise.
From the perspective of the ME of a medium-chain franchisor group, the Total Franchise Fee has a significant positive effect on the CRS-based ME at the 0.05 significance level, while the Growth Rate of Franchisor has a positive effect on VRS-based ME.
7. Discussion and Conclusions
7.1. Implications for Theoretical and Operating Practice
Recently, franchising as an innovative business format, has been rapidly growing in the Korean food and beverage industry. Nonetheless, previous applications of DEA models in the field of franchising have been scarce. Therefore, this study employed the metafrontier analysis to measure the efficiency of Korean coffee shop franchisors from 2015 to 2018 and adopted a double bootstrap regression analysis suggested by Simar and Wilson [13,14] to reveal the impact of external determinants on ME.
The results presented herein suggest the following three theoretical and managerial implications:
First, this study contributes to the literature on efficiency in franchising. Specifically, it is focused on the sector of coffee shop franchisors which operate in the franchising system in Korea. Moreover, this study first employed a metafrontier DEA approach to compare the efficiency levels of three other groups of franchise brands operating under different technical conditions depending on franchise size difference. This fact is an original literature contribution and is critical because, up to now, there have not been any prior studies about efficiency in this sector of franchising.
Second, this study classified coffee shop franchisors in Korea into three groups according to the number of franchisees and accurately estimated the GE of different-sized coffee shop franchisors by analyzing various groups and ME values. Moreover, we investigated the comparison of GE among the Korean coffee shop brands using the Kruskal–Wallis test. The analysis results proved that there are significant differences between small-chain and medium-chain coffee shop franchisors. Consequently, franchisors require new strategic initiatives and alternatives depending on the characteristics of the individual group.
Third, this study outlines a way to improve ME with respect to operation management interfaces and coordination. That is, the previous literatures have analyzed the efficiency in various franchise fields; however, these studies cannot explore the critical operation factor affecting efficiency [2,3,6,15,16,17,18,19,20,21,27,28]. Therefore, this study investigated the principal drivers of the franchisors’ environmental variables to increase the ME of the Korean coffee shop franchisors. In particular, the results of bootstrapped truncated regression provided that the external environmental factors affecting the efficiency of each individual group are totally different patterns depending on the franchise group (e.g., large-, medium-, and small-chain franchisees). In particular, the external operating environments affecting large-chain franchise groups are different from those of small-chain. The environmental factors affecting the efficiency of large-chain coffee shop franchisors are the Total Franchise Fee and Growth Rate of Franchisor, whereas the efficiency of the small-chain coffee shop franchisors are affected by the Franchisor’s Management Control and Return on Equity (ROE) of Franchisor. For small-chain franchisors, strengthening management and supervision over franchisees is a critical strategic factor to increase efficiency. However, for large-chain franchisors, a higher growth rate of franchisors triggers the transition from potential franchisee to actual franchisee, in that a preliminary franchisee wants to sign a franchising arrangement with the competitive franchisor.
This research highlights the following results:
- A majority of Korean coffee shop franchisors are located in the decreasing returns-to-scale regions. Thus, these franchisors should seek out sources of a managerial inefficiency and develop a sophisticated framework for achieving their optimal scale to improve their efficiency.
- There are significant group efficiency differences between small-chain and medium-chain groups of Korean coffee brands. The individual franchisor needs strategic initiatives tailored to the characteristics of the franchise group to enhance efficiency and achieve sustainable growth in a coffee shop franchise market in Korea.
- The principal operational drivers affecting meta efficiency differ depending on the preferred operational strategies and characteristics of each franchise group. Thus, a differentiated operating strategy of large-, medium-, and small-chain groups of coffee shop franchisors is required to maximize the individual coffee shop franchisor’s efficiency.
Consequently, this study suggests that a franchisor requires new and innovative operation policies that are appropriate for each step of growth [31]. In addition, this research model can be applied to other service industries as well as the franchise industry. By measuring ME according to business scope, these results may help a franchise brand practitioner identify their franchisor brand position from the perspective of ME. In addition, this study provides strategic franchise initiatives to increase ME with more efficient internal resource allocation and coordination.
7.2. Limitations and Future Research
While providing important insights to both franchise management theory and practice, this study has two main kinds of limitations: those related to the data set and those related to the analysis periods. First, this study employs three input and output variables exclusively based on the financial data and does not address other confounding factors that have an important impact on the profitability of a coffee shop and customers’ coffee shop brand choice: coffee price, convenience of location and parking, and atmosphere and styling. These additional variables are very important to precisely measure the efficiency of coffee shop franchisors. Nonetheless, we excluded certain information from our model such as coffee prices of an individual coffee shop franchisor due to the difficulty of data accessibility. Moreover, this study has a limitation that we failed to consider about franchise service quality in this study, despite its importance in the franchise industry. Therefore, further research must include franchise-related other factors as well as franchise service quality to confirm the adequacy of these results. Second, this study focused on the contemporaneous meta efficiency measurement based only on Korean coffee shop franchisors from 2015 to 2018. Hence, we need more longitudinal data accumulation to accurately measure ME and figure out the key drivers of efficiency fluctuation.
Author Contributions
All authors worked collectively and significantly contributed to this paper. Conceptualization, D.-Y.P. and K.C.; methodology, D.-Y.P. and K.C.; validation, D.-Y.P. and K.C.; writing, D.-Y.P. and K.C.; suggestion, D.-H.K. and K.C.; data gathering, D.-Y.P. and D.-H.K. All authors have read and agreed to the published version of the manuscript.
Funding
This research was financially supported by Hansung University.
Acknowledgments
We thank the editor and two anonymous reviewers for their careful reading of our article and their constructive comments and suggestions, which helped us to improve the article. This paper is based on the franchise data from the doctoral dissertation of Park Doo-Young.
Conflicts of Interest
The authors declare no conflicts of interest.
Appendix A
Table A1.
Metafrontier Efficiency of the Korean Coffee Franchises from 2015 to 2018.
Table A1.
Metafrontier Efficiency of the Korean Coffee Franchises from 2015 to 2018.
| DMU | Year | CRS-Based | VRS-Based | SE | RTS | Major Cause of Inefficiency | |||||
|---|---|---|---|---|---|---|---|---|---|---|---|
| MF(TE) | GF | TGR | MF(PTE) | GF | TGR | PTE | SE | ||||
| Amasvin | 2018 | 1.0000 | 1.0000 | 1.0000 | 1.0000 | 1.0000 | 1.0000 | 1.0000 | CRS | ||
| 2017 | 1.0000 | 1.0000 | 1.0000 | 1.0000 | 1.0000 | 1.0000 | 1.0000 | CRS | |||
| 2016 | 1.0000 | 1.0000 | 1.0000 | 1.0000 | 1.0000 | 1.0000 | 1.0000 | CRS | |||
| 2015 | N/A | ||||||||||
| Average | 1.0000 | 1.0000 | 1.0000 | 1.0000 | 1.0000 | 1.0000 | 1.0000 | ||||
| Arista | 2018 | 0.5279 | 0.5279 | 1.0000 | 0.5929 | 0.6353 | 0.9333 | 0.8904 | DRS | ✓ | |
| 2017 | 0.4764 | 0.4764 | 1.0000 | 0.5930 | 0.6026 | 0.9840 | 0.8034 | DRS | ✓ | ||
| 2016 | 0.5641 | 0.5641 | 1.0000 | 0.6342 | 0.6377 | 0.9944 | 0.8895 | DRS | ✓ | ||
| 2015 | 0.4749 | 0.4749 | 1.0000 | 0.7368 | 0.7368 | 1.0000 | 0.6446 | DRS | ✓ | ||
| Average | 0.5108 | 0.5108 | 1.0000 | 0.6392 | 0.6531 | 0.9779 | 0.8070 | ||||
| Café Lu&B | 2018 | 1.0000 | 1.0000 | 1.0000 | 1.0000 | 1.0000 | 1.0000 | 1.0000 | CRS | ||
| 2017 | 0.9825 | 1.0000 | 0.9825 | 1.0000 | 1.0000 | 1.0000 | 0.9825 | IRS | ✓ | ||
| 2016 | 1.0000 | 1.0000 | 1.0000 | 1.0000 | 1.0000 | 1.0000 | 1.0000 | CRS | |||
| 2015 | N/A | ||||||||||
| Average | 0.9942 | 1.0000 | 0.9942 | 1.0000 | 1.0000 | 1.0000 | 0.9942 | ||||
| Café Amote | 2018 | 0.8258 | 0.8258 | 1.0000 | 1.0000 | 1.0000 | 1.0000 | 0.8258 | IRS | ✓ | |
| 2017 | 0.7283 | 0.7470 | 0.9750 | 1.0000 | 1.0000 | 1.0000 | 0.7283 | IRS | ✓ | ||
| 2016 | 0.8110 | 0.8110 | 1.0000 | 1.0000 | 1.0000 | 1.0000 | 0.8110 | IRS | ✓ | ||
| 2015 | 0.8025 | 0.8025 | 1.0000 | 1.0000 | 1.0000 | 1.0000 | 0.8025 | IRS | ✓ | ||
| Average | 0.7919 | 0.7966 | 0.9938 | 1.0000 | 1.0000 | 1.0000 | 0.7919 | ||||
| Café-bombom | 2018 | 0.7225 | 1.0000 | 0.7225 | 0.9497 | 1.0000 | 0.9497 | 0.7608 | DRS | ✓ | |
| 2017 | 0.7281 | 1.0000 | 0.7281 | 0.8192 | 1.0000 | 0.8192 | 0.8888 | DRS | ✓ | ||
| 2016 | 0.7388 | 0.7583 | 0.9744 | 0.8331 | 0.8933 | 0.9326 | 0.8868 | DRS | ✓ | ||
| 2015 | N/A | ||||||||||
| Average | 0.7298 | 0.9194 | 0.8083 | 0.8674 | 0.9644 | 0.9005 | 0.8454 | ||||
| Caffé Glen | 2018 | 1.0000 | 1.0000 | 1.0000 | 1.0000 | 1.0000 | 1.0000 | 1.0000 | CRS | ||
| 2017 | 1.0000 | 1.0000 | 1.0000 | 1.0000 | 1.0000 | 1.0000 | 1.0000 | CRS | |||
| 2016 | 1.0000 | 1.0000 | 1.0000 | 1.0000 | 1.0000 | 1.0000 | 1.0000 | CRS | |||
| 2015 | 0.7742 | 0.7742 | 0.9999 | 1.0000 | 1.0000 | 1.0000 | 0.7742 | DRS | ✓ | ||
| Average | 0.9436 | 0.9436 | 1.0000 | 1.0000 | 1.0000 | 1.0000 | 0.9436 | ||||
| Caffe One+One | 2018 | 1.0000 | 1.0000 | 1.0000 | 1.0000 | 1.0000 | 1.0000 | 1.0000 | CRS | ||
| 2017 | 0.9792 | 0.9900 | 0.9891 | 1.0000 | 1.0000 | 1.0000 | 0.9792 | IRS | ✓ | ||
| 2016 | 1.0000 | 1.0000 | 1.0000 | 1.0000 | 1.0000 | 1.0000 | 1.0000 | CRS | |||
| 2015 | 0.6765 | 0.7719 | 0.8764 | 0.8779 | 0.9980 | 0.8797 | 0.7706 | DRS | ✓ | ||
| Average | 0.9139 | 0.9405 | 0.9664 | 0.9695 | 0.9995 | 0.9699 | 0.9375 | ||||
| CAFFE-BENE | 2018 | 0.7995 | 0.9638 | 0.8295 | 0.8327 | 1.0000 | 0.8327 | 0.9601 | DRS | ✓ | |
| 2017 | 1.0000 | 1.0000 | 1.0000 | 1.0000 | 1.0000 | 1.0000 | 1.0000 | CRS | |||
| 2016 | 1.0000 | 1.0000 | 1.0000 | 1.0000 | 1.0000 | 1.0000 | 1.0000 | CRS | |||
| 2015 | 1.0000 | 1.0000 | 1.0000 | 1.0000 | 1.0000 | 1.0000 | 1.0000 | CRS | |||
| Average | 0.9499 | 0.9910 | 0.9574 | 0.9582 | 1.0000 | 0.9582 | 0.9900 | ||||
| Coffee Myungga | 2018 | 0.9784 | 1.0000 | 0.9784 | 0.9827 | 1.0000 | 0.9827 | 0.9957 | DRS | ✓ | |
| 2017 | 1.0000 | 1.0000 | 1.0000 | 1.0000 | 1.0000 | 1.0000 | 1.0000 | CRS | |||
| 2016 | 1.0000 | 1.0000 | 1.0000 | 1.0000 | 1.0000 | 1.0000 | 1.0000 | CRS | |||
| 2015 | 1.0000 | 1.0000 | 1.0000 | 1.0000 | 1.0000 | 1.0000 | 1.0000 | CRS | |||
| Average | 0.9946 | 1.0000 | 0.9946 | 0.9957 | 1.0000 | 0.9957 | 0.9989 | ||||
| Coffee-banhada | 2018 | 1.0000 | 1.0000 | 1.0000 | 1.0000 | 1.0000 | 1.0000 | 1.0000 | CRS | ||
| 2017 | 1.0000 | 1.0000 | 1.0000 | 1.0000 | 1.0000 | 1.0000 | 1.0000 | CRS | |||
| 2016 | 0.9091 | 1.0000 | 0.9091 | 1.0000 | 1.0000 | 1.0000 | 0.9091 | DRS | ✓ | ||
| 2015 | 0.7646 | 1.0000 | 0.7646 | 0.9464 | 1.0000 | 0.9464 | 0.8079 | DRS | ✓ | ||
| Average | 0.9184 | 1.0000 | 0.9184 | 0.9866 | 1.0000 | 0.9866 | 0.9292 | ||||
| COFFEE-BAY | 2018 | 0.9154 | 1.0000 | 0.9154 | 1.0000 | 1.0000 | 1.0000 | 0.9154 | DRS | ✓ | |
| 2017 | 0.9560 | 1.0000 | 0.9560 | 1.0000 | 1.0000 | 1.0000 | 0.9560 | DRS | ✓ | ||
| 2016 | 0.8188 | 1.0000 | 0.8188 | 1.0000 | 1.0000 | 1.0000 | 0.8188 | DRS | ✓ | ||
| 2015 | 0.6680 | 1.0000 | 0.6680 | 1.0000 | 1.0000 | 1.0000 | 0.6680 | DRS | ✓ | ||
| Average | 0.8395 | 1.0000 | 0.8395 | 1.0000 | 1.0000 | 1.0000 | 0.8395 | ||||
| Coffee-mama | 2018 | 0.8148 | 1.0000 | 0.8148 | 0.8299 | 1.0000 | 0.8299 | 0.9819 | DRS | ✓ | |
| 2017 | 0.9202 | 1.0000 | 0.9202 | 0.9299 | 1.0000 | 0.9299 | 0.9896 | IRS | ✓ | ||
| 2016 | 0.6289 | 0.8656 | 0.7265 | 0.8080 | 0.8762 | 0.9222 | 0.7784 | DRS | ✓ | ||
| 2015 | 0.4229 | 0.8903 | 0.4749 | 0.7527 | 0.9006 | 0.8358 | 0.5618 | DRS | ✓ | ||
| Average | 0.6967 | 0.9390 | 0.7341 | 0.8301 | 0.9442 | 0.8794 | 0.8279 | ||||
| Coffeenie | 2018 | 0.7960 | 1.0000 | 0.7960 | 0.8394 | 1.0000 | 0.8394 | 0.9484 | DRS | ✓ | |
| 2017 | 0.7788 | 1.0000 | 0.7788 | 0.7951 | 1.0000 | 0.7951 | 0.9795 | DRS | ✓ | ||
| 2016 | 0.6914 | 1.0000 | 0.6914 | 0.8320 | 1.0000 | 0.8320 | 0.8310 | DRS | ✓ | ||
| 2015 | 0.6366 | 1.0000 | 0.6366 | 0.8738 | 1.0000 | 0.8738 | 0.7286 | DRS | ✓ | ||
| Average | 0.7257 | 1.0000 | 0.7257 | 0.8351 | 1.0000 | 0.8351 | 0.8719 | ||||
| Coffine Gurunaru | 2018 | 0.6931 | 0.9966 | 0.6955 | 0.7084 | 1.0000 | 0.7084 | 0.9784 | IRS | ✓ | |
| 2017 | 0.6011 | 1.0000 | 0.6011 | 0.6048 | 1.0000 | 0.6048 | 0.9939 | DRS | ✓ | ||
| 2016 | 0.6131 | 0.8609 | 0.7122 | 0.6208 | 0.9463 | 0.6561 | 0.9876 | IRS | ✓ | ||
| 2015 | 0.8792 | 1.0000 | 0.8792 | 0.8793 | 1.0000 | 0.8793 | 0.9999 | IRS | ✓ | ||
| Average | 0.6966 | 0.9644 | 0.7220 | 0.7034 | 0.9866 | 0.7122 | 0.9899 | ||||
| Compose Coffee | 2018 | 0.9300 | 1.0000 | 0.9300 | 1.0000 | 1.0000 | 1.0000 | 0.9300 | DRS | ✓ | |
| 2017 | 1.0000 | 1.0000 | 1.0000 | 1.0000 | 1.0000 | 1.0000 | 1.0000 | CRS | |||
| 2016 | 1.0000 | 1.0000 | 1.0000 | 1.0000 | 1.0000 | 1.0000 | 1.0000 | CRS | |||
| 2015 | N/A | ||||||||||
| Average | 0.9767 | 1.0000 | 0.9767 | 1.0000 | 1.0000 | 1.0000 | 0.9767 | ||||
| Dal.komm Coffee | 2018 | 0.8161 | 1.0000 | 0.8161 | 0.9010 | 1.0000 | 0.9010 | 0.9058 | DRS | ✓ | |
| 2017 | 1.0000 | 1.0000 | 1.0000 | 1.0000 | 1.0000 | 1.0000 | 1.0000 | CRS | |||
| 2016 | 0.8009 | 1.0000 | 0.8009 | 0.8123 | 1.0000 | 0.8123 | 0.9860 | IRS | ✓ | ||
| 2015 | 1.0000 | 1.0000 | 1.0000 | 1.0000 | 1.0000 | 1.0000 | 1.0000 | CRS | |||
| Average | 0.9043 | 1.0000 | 0.9043 | 0.9283 | 1.0000 | 0.9283 | 0.9729 | ||||
| Davinci Coffee | 2018 | 1.0000 | 1.0000 | 1.0000 | 1.0000 | 1.0000 | 1.0000 | 1.0000 | CRS | ||
| 2017 | 0.6577 | 0.6577 | 1.0000 | 1.0000 | 1.0000 | 1.0000 | 0.6577 | IRS | ✓ | ||
| 2016 | 0.6549 | 0.6558 | 0.9986 | 0.6604 | 0.6604 | 1.0000 | 0.9917 | IRS | ✓ | ||
| 2015 | 0.4893 | 0.5579 | 0.8771 | 0.7018 | 0.7500 | 0.9357 | 0.6972 | DRS | ✓ | ||
| Average | 0.7005 | 0.7179 | 0.9689 | 0.8406 | 0.8526 | 0.9839 | 0.8367 | ||||
| Deété espresso | 2018 | 1.0000 | 1.0000 | 1.0000 | 1.0000 | 1.0000 | 1.0000 | 1.0000 | CRS | ||
| 2017 | 0.9079 | 1.0000 | 0.9079 | 1.0000 | 1.0000 | 1.0000 | 0.9079 | IRS | ✓ | ||
| 2016 | 0.7886 | 1.0000 | 0.7886 | 0.8057 | 1.0000 | 0.8057 | 0.9787 | DRS | ✓ | ||
| 2015 | 0.6474 | 0.9595 | 0.6748 | 0.7525 | 0.9666 | 0.7786 | 0.8603 | DRS | ✓ | ||
| Average | 0.8360 | 0.9899 | 0.8428 | 0.8896 | 0.9916 | 0.8961 | 0.9367 | ||||
| DROPTOP | 2018 | 0.9034 | 1.0000 | 0.9034 | 1.0000 | 1.0000 | 1.0000 | 0.9034 | DRS | ✓ | |
| 2017 | 1.0000 | 1.0000 | 1.0000 | 1.0000 | 1.0000 | 1.0000 | 1.0000 | CRS | |||
| 2016 | 0.9248 | 1.0000 | 0.9248 | 0.9715 | 1.0000 | 0.9715 | 0.9519 | DRS | ✓ | ||
| 2015 | 1.0000 | 1.0000 | 1.0000 | 1.0000 | 1.0000 | 1.0000 | 1.0000 | CRS | |||
| Average | 0.9570 | 1.0000 | 0.9570 | 0.9929 | 1.0000 | 0.9929 | 0.9638 | ||||
| EDIYA COFFEE | 2018 | 1.0000 | 1.0000 | 1.0000 | 1.0000 | 1.0000 | 1.0000 | 1.0000 | CRS | ||
| 2017 | 1.0000 | 1.0000 | 1.0000 | 1.0000 | 1.0000 | 1.0000 | 1.0000 | CRS | |||
| 2016 | 1.0000 | 1.0000 | 1.0000 | 1.0000 | 1.0000 | 1.0000 | 1.0000 | CRS | |||
| 2015 | 1.0000 | 1.0000 | 1.0000 | 1.0000 | 1.0000 | 1.0000 | 1.0000 | CRS | |||
| Average | 1.0000 | 1.0000 | 1.0000 | 1.0000 | 1.0000 | 1.0000 | 1.0000 | ||||
| Havana Express | 2018 | 1.0000 | 1.0000 | 1.0000 | 1.0000 | 1.0000 | 1.0000 | 1.0000 | CRS | ||
| 2017 | 0.9119 | 0.9187 | 0.9926 | 1.0000 | 1.0000 | 1.0000 | 0.9119 | IRS | ✓ | ||
| 2016 | 0.9696 | 0.9747 | 0.9948 | 1.0000 | 1.0000 | 1.0000 | 0.9696 | IRS | ✓ | ||
| 2015 | 1.0000 | 1.0000 | 1.0000 | 1.0000 | 1.0000 | 1.0000 | 1.0000 | CRS | |||
| Average | 0.9704 | 0.9733 | 0.9968 | 1.0000 | 1.0000 | 1.0000 | 0.9704 | ||||
| HOLLYS COFFEE | 2018 | 1.0000 | 1.0000 | 1.0000 | 1.0000 | 1.0000 | 1.0000 | 1.0000 | CRS | ||
| 2017 | 1.0000 | 1.0000 | 1.0000 | 1.0000 | 1.0000 | 1.0000 | 1.0000 | CRS | |||
| 2016 | 1.0000 | 1.0000 | 1.0000 | 1.0000 | 1.0000 | 1.0000 | 1.0000 | CRS | |||
| 2015 | 1.0000 | 1.0000 | 1.0000 | 1.0000 | 1.0000 | 1.0000 | 1.0000 | CRS | |||
| Average | 1.0000 | 1.0000 | 1.0000 | 1.0000 | 1.0000 | 1.0000 | 1.0000 | ||||
| Joe’s Sandwich& Coffee | 2018 | 0.9247 | 0.9285 | 0.9959 | 0.9825 | 1.0000 | 0.9825 | 0.9412 | DRS | ✓ | |
| 2017 | 1.0000 | 1.0000 | 1.0000 | 1.0000 | 1.0000 | 1.0000 | 1.0000 | CRS | |||
| 2016 | 0.9860 | 1.0000 | 0.9860 | 1.0000 | 1.0000 | 1.0000 | 0.9860 | IRS | ✓ | ||
| 2015 | 0.7120 | 0.8139 | 0.8748 | 0.8841 | 1.0000 | 0.8841 | 0.8054 | DRS | ✓ | ||
| Average | 0.9057 | 0.9356 | 0.9642 | 0.9666 | 1.0000 | 0.9666 | 0.9331 | ||||
| Selecto Coffee | 2018 | 0.8741 | 1.0000 | 0.8741 | 0.8744 | 1.0000 | 0.8744 | 0.9997 | IRS | ✓ | |
| 2017 | 1.0000 | 1.0000 | 1.0000 | 1.0000 | 1.0000 | 1.0000 | 1.0000 | CRS | |||
| 2016 | 1.0000 | 1.0000 | 1.0000 | 1.0000 | 1.0000 | 1.0000 | 1.0000 | CRS | |||
| 2015 | 1.0000 | 1.0000 | 1.0000 | 1.0000 | 1.0000 | 1.0000 | 1.0000 | CRS | |||
| Average | 0.9685 | 1.0000 | 0.9685 | 0.9686 | 1.0000 | 0.9686 | 0.9999 | ||||
| Super Coffee | 2018 | 0.9452 | 0.9645 | 0.9800 | 0.9595 | 0.9888 | 0.9704 | 0.9851 | DRS | ✓ | |
| 2017 | 0.7319 | 0.8027 | 0.9118 | 0.7813 | 0.8791 | 0.8887 | 0.9368 | DRS | ✓ | ||
| 2016 | 0.8403 | 0.8448 | 0.9947 | 0.8463 | 0.8629 | 0.9808 | 0.9930 | DRS | ✓ | ||
| 2015 | 1.0000 | 1.0000 | 1.0000 | 1.0000 | 1.0000 | 1.0000 | 1.0000 | CRS | |||
| Average | 0.8794 | 0.9030 | 0.9716 | 0.8968 | 0.9327 | 0.9599 | 0.9787 | ||||
| The Kind Coffee | 2018 | 0.4677 | 0.4677 | 1.0000 | 0.4981 | 0.5150 | 0.9672 | 0.9389 | DRS | ✓ | |
| 2017 | 0.7270 | 1.0000 | 0.7270 | 0.9740 | 1.0000 | 0.9740 | 0.7464 | IRS | ✓ | ||
| 2016 | 0.5766 | 0.9116 | 0.6325 | 0.6245 | 1.0000 | 0.6245 | 0.9233 | IRS | ✓ | ||
| 2015 | 0.8132 | 1.0000 | 0.8132 | 0.8494 | 1.0000 | 0.8494 | 0.9574 | IRS | ✓ | ||
| Average | 0.6461 | 0.8448 | 0.7932 | 0.7365 | 0.8788 | 0.8538 | 0.8915 | ||||
| Topresso | 2018 | 0.7835 | 0.9340 | 0.8389 | 0.8585 | 1.0000 | 0.8585 | 0.9126 | DRS | ✓ | |
| 2017 | 0.7967 | 0.9506 | 0.8382 | 0.8360 | 1.0000 | 0.8360 | 0.9531 | DRS | ✓ | ||
| 2016 | 0.6132 | 0.8814 | 0.6957 | 0.8622 | 1.0000 | 0.8622 | 0.7112 | DRS | ✓ | ||
| 2015 | 0.3865 | 0.7461 | 0.5180 | 0.8658 | 1.0000 | 0.8658 | 0.4464 | DRS | ✓ | ||
| Average | 0.6450 | 0.8780 | 0.7227 | 0.8556 | 1.0000 | 0.8556 | 0.7558 | ||||
| YOGER-PRESSO | 2018 | 0.7876 | 0.8114 | 0.9707 | 0.7927 | 0.8409 | 0.9427 | 0.9936 | IRS | ✓ | |
| 2017 | 0.5717 | 0.5717 | 1.0000 | 0.6641 | 0.6816 | 0.9743 | 0.8609 | DRS | ✓ | ||
| 2016 | 0.5887 | 0.7848 | 0.7501 | 0.6783 | 1.0000 | 0.6783 | 0.8678 | DRS | ✓ | ||
| 2015 | 0.4192 | 0.7148 | 0.5864 | 0.6772 | 1.0000 | 0.6772 | 0.6190 | DRS | ✓ | ||
| Average | 0.5918 | 0.7207 | 0.8268 | 0.7031 | 0.8806 | 0.8181 | 0.8353 | ||||
| Zoo Coffee | 2018 | 0.6166 | 0.6166 | 1.0000 | 0.6392 | 0.6550 | 0.9760 | 0.9645 | DRS | ✓ | |
| 2017 | 0.6410 | 0.6675 | 0.9602 | 0.6460 | 0.7106 | 0.9090 | 0.9923 | DRS | ✓ | ||
| 2016 | 0.7189 | 1.0000 | 0.7189 | 0.8038 | 1.0000 | 0.8038 | 0.8943 | IRS | ✓ | ||
| 2015 | 0.6345 | 1.0000 | 0.6345 | 0.6528 | 1.0000 | 0.6528 | 0.9719 | DRS | ✓ | ||
| Average | 0.6527 | 0.8210 | 0.8284 | 0.6855 | 0.8414 | 0.8354 | 0.9557 | ||||
References
- Cha, J.B.; Jo, M.N. The Effect of the Corporate Social Responsibility of Franchise Coffee Shops on Corporate Image and Behavioral Intention. Sustainability 2019, 11, 6849. [Google Scholar] [CrossRef]
- Kim, C.; Lee, S.; Kim, S.W. Surviving in the Red Ocean: Measuring Factors for Business Excellence among Coffee Franchises in Korea. Total Qual. Manag. Bus. Excell. 2016, 27, 761–774. [Google Scholar] [CrossRef]
- Joo, S.J.; Stoeberl, P.A.; Fitzer, K. Measuring and Benchmarking the Performance of Coffee Stores for Retail Operations. Benchmarking Int. J. 2009, 16, 741–753. [Google Scholar] [CrossRef]
- Calderon-Monge, E.; Pastor-Sanz, I.; Huerta-Zavala, P. Economic Sustainability in Franchising: A Model to Predict Franchisor Success or Failure. Sustainability 2017, 9, 1419. [Google Scholar] [CrossRef]
- Sveum, M.; Sykuta, M. The Effect of Franchising on Establishment Performance in the U.S. Restaurant Industry. Cornell Hosp. Q. 2019, 60, 104–115. [Google Scholar] [CrossRef]
- Uli, L.D.; Martín, F.V.; Catalunña, F.J.R. Analysis of Efficiency of Own and Franchised Units in the Spanish Franchise System. Eur. Res. Manag. Bus. Econ. 2017, 23, 165–172. [Google Scholar]
- Battesse, G.E.; Rao, D.S.P.; O’Donnell, C.J. A Metafrontier Production Function for Estimation of Technical Efficiencies and Technology Gaps for Firms Operating Under Different Technologies. J. Prod. Anal. 2004, 21, 91–103. [Google Scholar] [CrossRef]
- Assaf, A.G. Accounting for Size in Efficiency Comparisons of Airports. J. Air Transp. Manag. 2009, 15, 256–258. [Google Scholar] [CrossRef]
- Kim, H.; Lee, D.; Ryu, M.H. An Optimal Strategic Business Model for Small Businesses Using Online Platforms. Sustainability 2018, 10, 579. [Google Scholar] [CrossRef]
- Wang, Q.; Zhou, P.; Zhao, Z.; Shen, N. Energy Efficiency and Energy Saving Potential in China: A Directional Meta-Frontier DEA Approach. Sustainability 2014, 6, 5476–5492. [Google Scholar] [CrossRef]
- Assaf, A.G.; Barros, C.P.; Josiassen, A. Hotel efficiency: A Bootstrapped Metafrontier Approach. Int. J. Hosp. Manag. 2012, 31, 621–629. [Google Scholar] [CrossRef]
- Tsai, W.H.; Lee, H.L.; Yang, C.H.; Huang, C.C. Input-Output Analysis for Sustainability by Using DEA Method: A Comparison Study between European and Asian Countries. Sustainability 2016, 8, 1230. [Google Scholar] [CrossRef]
- Simar, L.; Wilson, P.W. A General Methodology for Bootstrapping in Non-Parametric Frontier Models. J. Appl. Stat. 2000, 27, 779–802. [Google Scholar] [CrossRef]
- Simar, L.; Wilson, P.W. Estimation and Inference in Two-Stage, Semi-Parametric Models of Production Processes. J. Econ. 2007, 136, 31–64. [Google Scholar] [CrossRef]
- Barros, C.P.; Perrigot, R. Franchised Network Efficiency: A DEA Application to US Networks. In Economics and Management of Networks; Cliquet, G., Tuunanen, M., Hendrikse, G., Windsperger, J., Eds.; Contributions to Management Science; Physica-Verlag HD: Heidelberg, Germany, 2007. [Google Scholar]
- Botti, L.; Briec, W.; Cliquet, G. Plural forms versus franchise and company-owned systems: A DEA approach of hotel chain performance. Omega 2009, 37, 566–578. [Google Scholar] [CrossRef]
- Roh, E.Y.; Choi, K. Efficiency Comparison of Multiple Brands within the Same Franchise: Data Envelopment Analysis Approach. Int. J. Hosp. Manag. 2010, 29, 92–98. [Google Scholar] [CrossRef]
- Martin, C.J.G.; Medal-Bartual, A.; Peris-Ortiz, M. Analysis of Efficiency and Profitability of Franchise Services. Serv. Ind. J. 2014, 34, 796–810. [Google Scholar] [CrossRef]
- Medal-Bartual, A.; Garcia-Martina, C.-J.; Sala-Garrido, R. Efficiency Analysis of Small Franchise Enterprises through a DEA Metafrontier Model. Serv. Ind. J. 2012, 32, 2421–2434. [Google Scholar] [CrossRef]
- Piot-Lepetit, I.; Perrigot, R.; Cliquet, G. Impact of the Industry on Franchise Chain Efficiency: A Meta-DEA and Context-Dependent DEA Approach. J. Oper. Res. Soc. 2014, 65, 1692–1699. [Google Scholar] [CrossRef]
- Reynolds, D. An Exploratory Investigation of Multiunit Restaurant Productivity Assessment Using Data Envelopment Analysis. J. Travel Tour. Mark. 2004, 16, 19–26. [Google Scholar] [CrossRef]
- Battese, G.E.; Rao, D.S.P. Technology Gap, Efficiency and a Stochastic Metafrontier Function. Int. J. Bus. Econ. 2002, 1, 1–7. [Google Scholar]
- O’Donnell, C.J.; Rao, D.S.P.; Battese, G.E. Metafrontier Frameworks for the Study of Firm-Level Efficiencies and Technology Ratios. Empir. Econ. 2008, 34, 231–255. [Google Scholar] [CrossRef]
- Lee, Y.L.; Kuo, S.H.; Jiang, M.Y.; Li, Y. Evaluating the Performances of Taiwan’s International Tourist Hotels: Applying the Directional Distance Function and Meta-Frontier Approach. Sustainability 2019, 11, 5773. [Google Scholar] [CrossRef]
- Badunenko, O.; Tauchmann, H. Simar and Wilson Two-Stage Efficiency Analysis for Stata. Stata J. 2019, 19, 950–988. [Google Scholar] [CrossRef]
- Barros, C.P.; Assaf, A.G. Bootstrapped Efficiency Measures of Oil Blocks in Angola. Energy Policy 2009, 37, 4098–4103. [Google Scholar] [CrossRef]
- Piot-Lepetit, I.; Perrigot, R.; Cliquet, G. Organizational Form and Efficiency of Franchise Chains. Int. J. Retail Distrib. Manag. 2014, 42, 671–684. [Google Scholar] [CrossRef]
- Perrigot, R.; Piot-Lepetit, I.; Cliquet, G. Plural Form and Franchise Chains Efficiency: A DEA Meta-Frontier Approach Applied to French Chains. In Economics Working Paper Archive (University of Rennes 1 & University of Caen); Center for Research in Economics and Management (CREM): Caen, France, 2012. [Google Scholar]
- Castrogiovanni, G.J.; Justice, R.T.; Julian, S.D. Franchise Failure Rates: An Assessment of Magnitude and Influencing Factors. J. Small Bus. Manag. 1993, 31, 105–114. [Google Scholar]
- Holmberg, S.; Morgan, K.B. Franchise Turnover and Failure: New Research and Perspectives. J. Bus. Ventur. 2003, 18, 403–418. [Google Scholar] [CrossRef]
- Choi, K. Multi-Period Efficiency and Productivity Changes in US Domestic Airlines. J. Air Transp. Manag. 2017, 59, 18–25. [Google Scholar] [CrossRef]


© 2020 by the authors. Licensee MDPI, Basel, Switzerland. This article is an open access article distributed under the terms and conditions of the Creative Commons Attribution (CC BY) license (http://creativecommons.org/licenses/by/4.0/).