Abstract
Converting natural ecosystems to cultivated land, driven by human activities, has been considered a significant driver of limiting the delivery of ecosystem services (ES). The ES loss in the past was mainly caused by agricultural activities that have been taken to meet people’s needs in Northeast China. Quantifying historical declining ecosystem service values is essential to facilitate sustainable development. In this study, remote sensing images were used to investigate the history of cultivated land expansion over the last five decades. Additionally, ES variations caused by agricultural expansion since 1965 were quantified in the Small Sanjiang Plain (SSP), Northeast China. From the results, cultivated land expanded from 3.97% of the total SSP area to 66.40% from 1965 to 2015 (approximately 898.23 million ha), of which paddy field expanded drastically from 0% to 55.93%. Variations in cultivated land resulted in a loss of ecosystem service values by 11,893.85 million dollars, of which 62.98 million dollars were caused by the internal conversion between cultivation during 1965–2015. Agricultural expansion accelerated the export of agricultural products function, while it decreased almost all other functions, especially hydrological regulation and freshwater supply function. For future sustainability of the SSP, some suggestions, such as restoring natural ecosystems, planting trees between cultivated land, coculture systems, and winter-flooding of paddy rice were provided in our study.
1. Introduction
Providing plenty of services and goods to humans, natural ecosystems play an important role in human survival and socioeconomic development [1,2,3,4]. Balance between exploitation of natural ecosystems for socioeconomic development and conserving natural landscape is the key to achieve sustainability [5,6]. Compared with any comparable period in human history, human beings have changed natural ecosystems more swiftly and extensively in the last fifty years [7,8]. Extraction of natural ecosystems has brought considerable net benefits to human beings and socioeconomic development, but it has also caused a great loss of ecosystem services (ES) [9,10]. Land-use changes are the most direct manifestations of the interaction between humans and natural ecosystems [11,12,13,14]. Previous studies have indicated that land-use changes caused by both natural and anthropogenic factors have greatly affected the delivery of crucial ES, such as gas regulation, soil conservation, and biodiversity maintenance [15,16,17,18]. The influence of land-use changes on eco-environment was an important part of global environmental change research [19,20,21].
Ecosystem service values (ESV) are the welfare and benefits provided for human beings by natural ecosystems, which are crucial to human survival and development [2,3,22]. Quantitative assessment of ESV helps to identify the spatiotemporal variations of ES and understand the impact of human activities on ES. Due to the important role of ES in human survival, there has been increasing emphasis on ES assessments and evaluations since the 1990s [23,24,25]. Attention has been given to ESV changes in response to different kinds of land-use changes, including urban expansion [26,27], forest loss [23,28], grassland ecosystem [25,29], wetland degradation [30,31], and agricultural expansion [6,32], Grain-for-Green program [33]. For example, Estoque investigated the changes in ESV in response to urban expansion in Baguio, Philippines [26]. Wang et al. estimated the effect the Grain-for-Green Program on ESV changes, i.e., the transformation from cultivated land to grassland [33]. These studies have contributed to raising ecological consciousness and enhanced management of natural resources. However, these studies usually applied a same coefficient for assessing the ES provided by different cultivated land such as paddy and dry farmland. Additionally, little attention has been paid to the impact of internal conversion of cultivated land on ES.
As one of the most important land-use types influenced by human activities [34], cultivated land has been the most visible indicator of human footprint, and the dominant driver of ES loss [35]. Cultivated land can be divided into two categories: Paddy fields and dry farmland. Paddy fields are typical irrigation land, and are inundated in the growing season. Dry farmland generally refers to cultivated land where dry crops are grown, mainly by natural precipitation. Landscape degradation caused by agricultural expansion is notable all over the world as a result of population pressure [36,37]. Occupying only approximately 15% of global farmland, paddy rice feeds more than half of the world’s population [38]. Paddy rice has a significant role in ensuring national as well as global food security. Different from dry farmland, paddy fields are also important artificial wetlands. Inundated in the growing season, paddy fields are important sources of methane caused by human activities [39,40], influencing the emissions of greenhouse gases (GHG). Paddy rice consumes a lot of water resources, which affects water security. As an important habitat for wild waterfowl, paddy fields have also been linked to disease transmission [41,42]. Contributed by climate warming, technological innovation and policies, paddy fields indicated a continuous growth trend in Northeast China since the 1970s [43]. Therefore, tracking agricultural expansion history by distinguishing paddy from dry farmland are necessary in this region. The ES provided by paddy and dry farmland also quite different. Therefore, it is necessary to separate paddy from dry farmland to quantitatively study the ES changes in response to agricultural expansion, which was relatively lacking in previous studies.
The Sanjiang Plain in Northeast China is one of China’s important commodity grain bases. It also contains China’s largest freshwater marshy wetland. Large-scale natural ecosystems, especially marshy wetlands, have been converted to cultivated land since the 1950s. Attentions have been paid on land use/cover change, wetland loss, agricultural expansion, as well as the effect of these changes on ES in the whole or part of the Sanjiang Plain [44,45,46,47,48]. For example, Song et al. described agricultural expansion pattern in the Sanjiang Plain and indicated that the total area of agricultural continues to grow [48]. Yan et al. illustrate the paddy expansion process since 1976 by combing remote-sensing images [40]. However, the detailed agricultural expansion pattern is still needed to study, such as the transformation between dry farmland and other land-use types.
Our study focuses on the Small Sanjiang Plain (SSP), the hinterland of Sanjiang Plain. Based on multi-source remote sensing (RS) data containing CORONA, Landsat TM (Thematic Mapper), and OLI (Operational Land Imager) images, this study described the process of agricultural expansion and its related land-use changes by distinguishing paddy from dry farmland. Additionally, we tracked the ES changes in response to agricultural expansion and the impact of internal conversion of cultivated land on ES quantitatively. In particular, the objectives are:
- (1)
- To illustrate the agricultural expansion pattern in the SSP during 1965–2015;
- (2)
- to analyze land-use changes related to agricultural expansion in the past five decades;
- (3)
- to track the ES changes in response to agricultural expansion as well as internal conversion of cultivated land quantitatively.
2. Materials and Methods
2.1. Study Area
Our study focuses on the SSP, which ranges between 46°50′05″ N and 48°27′56″ N, and 130°32′57″ E and 135°05′26″ E. Formed by alluviation of three rivers (Amur, Ussuri, and Songhua Rivers), the SSP is a floodplain located at Northeast China (As shown in Figure 1). Three important National Nature Reserves are included in the SSP (Sanjiang, Honghe, and Bachadao National Nature Reserve). The total surface area is about 1.6 million ha, with 65% occupied by marshy wetland. SSP has a flat landscape with an altitude varying from 27 m to 473 m. Yearly mean temperature is relatively stable and ranges between 1.4 °C and 4.3 °C in the SSP, with the warmest month in July and the coldest month in January [49]. Annual mean precipitation ranges between 500 mm and 650 mm in this region. The cultivated land area continually increased in the SSP, reaching to more than 60% of the total area. Land-use changes in the SSP mainly drove by climate change, population expansion, and government policies [44,49].
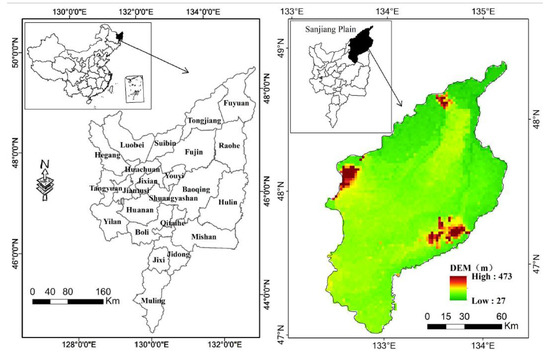
Figure 1.
The study area.
2.2. Data Source and Handling
A series of remote-sensing data, which were downloaded from Earth Explorer, USGS including CORONA images, Landsat TM, and OLI images, were applied in our study to obtain the agricultural expansion pattern from 1965 to 2015. Eighteen CORONA black-and-white images with a resolution of 6 feet (about 1.8 m) and a ground coverage of 14 × 188 (in kms) were used to map cultivated land distribution in 1965. We resampled CORONA images to 30 m, which is the same as Landsat TM/ OLI images. Georeferencing of RS images in our study was taken by Ground Control Points (GCPs), with a root mean squared (RMS) error of no less than four pixels in our study. Before developing the land-use distribution maps, field surveys were performed widely to obtain interpreting samples. The interpreters were first trained to recognize different land-use types from CORONA/Landsat imageries. Interpreters drew the outlines of different land-use types and added related attributes by ArcGIS 10 software after being trained to recognize the image features of the different land-use types. In our study, topographic maps, vegetation maps, Digital Elevation Model (DEM) data, and soil maps were used as auxiliary data for identifying land-use types. Extensive field survey, aerial photos, historical field survey records, Statistical Yearbook, and interviews with locals were adopted to evaluate the accuracy of our results [50,51,52,53,54,55].
2.3. Data Analyses
2.3.1. Cultivated Land Change
Cultivated land changes between two periods was analyzed by Land transformation matrix using ArcGIS 10 software. The annual change area (ACA, ha/year) was calculated by [44] as a supplement in this study:
where ACA means the average annual change area from time t1 to time t2. At1 and At2 represent the area of cultivated land at time t1 and time t2, respectively.
ACA = (At2 − At1)/(t2 − t1) × 100%,
2.3.2. Ecosystem Service Value Estimation
In this study, ESV was calculated as shown in Equation (2) [43]:
where Ai represents the area, while VCi is the ESV per unit area of the ith ecosystem. Xie et al. provided the VCi on a national scale, and Zhang et al. amended the VCi by crop yield in the Sanjiang Plain based on Xie’s Table. The correction coefficient λ of VCi was calculated by Equation (3) [45].
where Q stands for the yield per unit of the Sanjiang Plain, while Q0 represents that of China. Zhang et al. modified the coefficients of China by crop yield data in 2010 to apply to the Sanjiang Plain. The SSP is located in the hinterland of the Sanjiang Plain, with similar geography and climatic environment. Therefore, the same coefficients were used in our study as Zhang’s [41]. The difference is that we expressed the coefficient in US dollars based on the 2010 exchange rate (Table S1).
λ = Q/Q0
3. Results
3.1. Spatio-Temporal Change
3.1.1. Percentage Change
Results indicated that agricultural land expanded from 3.97% of the total area in 1965 to 66.40% in 2015, with an area increase of 898.23 million ha. Figure 2 demonstrates percentage changes of paddy and dry farmland in different periods. Statistics indicate that the proportion of paddy field area has continued to increase over the past 50 years, increasing from 0% in 1965 to 55.93% in 2015, with a drastic drop of 53.17% during the study period. Over the past 50 years, the area of dry farmland increased first and then decreased. The dry farmland in the SSP increased from 3.97% in 1965 to 41.44% in 1995 drastically, and then it decreased to 11.47% in 2015. Figure 3 describes the spatial changes of cultivated land in the SSP. The spatial expansion of cultivated land as well as the conversion from dry farmland to paddy can be seen clearly from Figure 3.
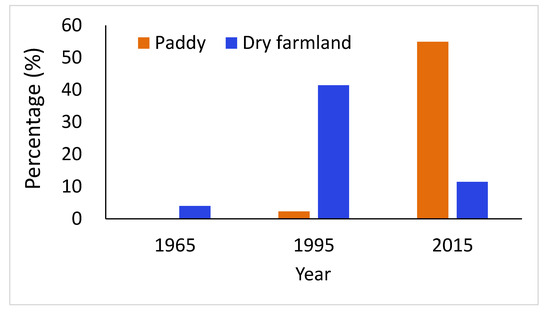
Figure 2.
The percentage changes of paddy and dry farmland in different periods.
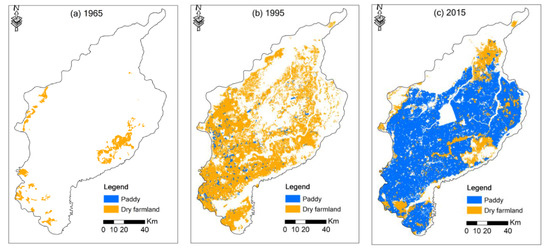
Figure 3.
The spatial changes of cultivated land since 1965: (a) 1965; (b) 1995; (c) 2015.
3.1.2. Annual Change Area
Total and annual change area of cultivated land since 1965 is described in Table 1. Among them, a positive value stands for an increase in area, and a negative value stands for a decrease in area. Statistics indicated that paddy increased by 36,412.97 ha during 1965–1995, with an annual change area of 1213.77 ha/year. Additionally, paddy continued to increase by 844,206.05 ha during 1995–2015, with an annual change area of 42,210.30 ha/year. The area expansion of paddy in two periods was mostly contributed to by the conversion of dry farmland and marsh. Dry farmland increased by 600,815.44 ha from 1965 to 1995, with an annual change area of 20,027.18 ha/year, while it decreased by 480,548.45 ha during 1965–1995, with an annual loss area of 24,027.42 ha/year. During 1965–1995, the area growth of dry farmland mostly contributed by marsh conversion, while the large-scale transformation from dry farmland to paddy greatly decreased the area of dry farmland from 1995 to 2015. The net increased area of paddy in the study period was 0.88 million ha, while that of dry farmland was 0.12 million ha. The area of cultivated land increased by 1.00 million ha during 1965–2015, with an annual change area of 0.02 million ha/year.

Table 1.
Cultivated land change in different time intervals.
3.1.3. Land-Use Changes Related to Cultivated Land
The land-use changes related to cultivated land in the past five decades are described in Tables S2 and S3. Table S2 listed the transformation between paddy and different land-use types in two periods. During 1965–1995, there was no paddy loss because paddy was not planted in the SSP in 1965. Paddy gain was mostly due to the conversion from marsh (18,963.58 ha), grassland (14,781.08 ha), and dry farmland (2366.25 ha). Paddy loss was mainly due to the transformation to dry farmland (1966.55 ha) during 1995–2015, while paddy gain was contributed by the transformation from dry farmland (522,877.29 ha), forest (189,852.52 ha), and marsh (131,257.69 ha).
Table S3 listed the gain and loss of dry farmland in different periods. During 1965–1995, the area gain of dry farmland was much larger than loss. The gain of dry farmland was mainly at the expense of marsh (366.93 thousand ha) and grassland (222.90 ha) loss, while the loss was mainly due to the conversion to forest (4.43 thousand ha). Since 1995, area loss of dry farmland was much greater than gain, and the loss was mainly due to the transformation to paddy field (522.88 thousand ha). Additionally, the gain of dry farmland from 1995 to 2015 was mainly contributed by marsh and forest transformation.
3.2. Ecosystem Service Value
3.2.1. Temporal Changes of Ecosystem Service Value
Based on Table S1, ESV changes per unit area caused by paddy changes and dry farmland changes can be calculated (Tables S4 and S5 in the Supplementary Materials). Combined area of land-use changes related to cultivated land (Tables S2 and S3 in the Supplementary Materials), we calculated ESV variations caused by agricultural expansion in different periods (Tables S6 and S7 in the Supplementary Materials). Table S6 listed the ESV variations caused by paddy changes in two periods in the SSP. In the past five decades, paddy expansion decreased the total ESVs by 69,221.20 million dollars. The ESV changes as a result of paddy expansion in the SSP were −2862.25 and −66,358.96 million dollars, during 1965–1995 and 1995–2015, respectively. The greatest decrease in ESVs occurred in period 1995–2015, when paddy area increased quickly. The largest decline was freshwater supply, followed by hydrological regulation in two periods. ESVs of agricultural products and gas regulation functions showed a growing trend at the expense of the decline of other functions. During 1965–2015, the ESV changes of freshwater supply function were the biggest (−30,351.38 million dollars), followed by hydrological regulation function (−26,995.73 million dollars) and biodiversity maintenance function (−4591.25 million dollars). The greatest increase in ESVs was the growth of agricultural product function.
Table S7 listed the ESV variations caused by dry farmland changes in two periods in the SSP. In the past five decades, dry farmland changes decreased the total ESVs by 9337.81 million dollars (Table S7 in the Supplementary Materials). The ESV changes as a result of dry farmland conversions in the SSP were −46,648.72 and 37,310.91 million dollars, during 1965–1995 and 1995–2015, respectively. The area gain of dry farmland decreased ESVs by 46,648.72 million dollars from 1965 to 1995, while loss of dry farmland increased ESVs by 37,310.91 million dollars during 1995–2015. The greatest drop was hydrological regulation, followed by freshwater supply, while the growth of ESV focused on agricultural products, raw materials, and soil conservation functions in the whole study periods. During 1965–1995, the ESVs of hydrological regulation function decreased by 23,870.00 million dollars, which was the largest, followed by freshwater supply and climate regulation functions. Agricultural products and raw materials functions increased by 780.87 and 293.91 million dollars from 1965 to 1995, respectively. During 1995 to 2015, agricultural products, raw materials, and soil conservation functions showed a slight decline trend while all other functions indicated increasing trends, especially hydrological regulation function (19,091.87 million dollars).
3.2.2. Ecosystem Service Value Variations of Different Ecosystems
Table 2 listed the ESV changes of conversions between paddy and other ecosystems in different periods. The biggest drop in ESVs related to paddy expansion was contributed by marsh conversion (3104.88 million dollars), followed by forestland (1256.96 million dollars) and dry farmland (62.98 million dollars). In two periods, the ESV decline as a result of marsh conversions was the biggest, indicating that marsh reclamation for paddy decreased ESVs significantly since 1965. Transformation between forest and paddy decreased the total ESVs in all two stages, and the decline mainly focused on the second stage (1995–2015). Conversion from dry farmland to paddy caused an ESV loss by 62.98 million dollars in the last five decades and the decline mainly focused on the second stage (1995–2015). In general, transformation between grassland and paddy caused a decline of ESVs by 54.09 million dollars, of which, it dropped by 50.32 million dollars in the first stage (1965–1995). ESV variations brought by the conversion between remaining ecosystems and paddy were relatively small from 1965 to 2015.
Table 2.
ESV changes of conversions between different ecosystems and paddy in different periods (million dollars).
Table 3 listed the ESV changes of conversions between dry farmland and other ecosystems in different periods. The ESV loss related to dry farmland was mostly contributed by marsh (8622.63 million dollars), grassland (692.01 million dollars), and forest conversion (301.17 million dollars). In two periods, the ESV loss as a result of marsh conversions was much larger than the other ecosystems, indicating that marsh reclamation for dry farmland decreased ESVs significantly since 1965. Transformation between grassland and dry farmland decreased the total ESVs during 1965–1995 while increased the total ESVs during 1995–2015. In general, transformation between forest and dry farmland caused a decline of ESVs by 301.17 million dollars, and the decline mainly focused on the second stage (1995–2015). ESV variations brought by the conversion between remaining ecosystems (settlement, water, and other unused land) and dry farmland were relatively small during 1965–2015.
Table 3.
ESV changes of conversions between different ecosystems and dry farmland in different periods (million dollars).
Table 4 listed ESV variations caused by agricultural expansion in the last five decades. The biggest ESV loss related to agricultural expansion was contributed by marsh (11,727.51 million dollars), following by forest (1558.12 million dollars) and grassland conversion (746.10 million dollars), indicating that transformation from natural ecosystems to cultivated land was the main reason for ESV loss in the SSP. It cannot be ignored that the internal conversion between cultivated land has caused the ESV to drop by 62.98 million dollars. The ESV variations brought by the conversion between remaining ecosystems (settlement, water, and other unused land) and cultivated land were relatively small from 1965 to 2015. Agricultural products function increased at the expense of all other functions, especially hydrological regulation, biodiversity maintenance, and freshwater supply functions. Statistics showed that agricultural expansion led to an ESV loss of 14,171.08 million dollars, of which the contribution of paddy field expansion was far greater than that of dry farmland in the past five decades in the SSP.
Table 4.
ESV changes in response to agricultural expansion in the last five decades (million dollars).
4. Discussion
4.1. Driving Force of Agricultural Expansion in the SSP
In many cases, agricultural expansion is the main reason for the degradation of natural ecosystems. The SSP was no exception. Our results indicated that from 1965 to 2015, the area percentage of cultivated land increased from 3.97% to 66.40% at the expense of marsh, grassland, and forest. Previous studies showed that land-use changes have a close relationship with anthropogenic activities [49,56,57]. This study also indicated that agricultural expansion, which has a great relationship with anthropogenic activities, was the main land-use change type in the past five decades in the SSP. In cold regions like SSP, low temperature is a limitation for agricultural planting. Over the past 50 years, the temperature in the SSP has shown a rising trend. Climate warming has greatly facilitated agricultural production in this region. Strong wind also limits agricultural activities. Studies showed that wind speed decreased obviously in the last decades in Sanjiang Plain [58], which benefited agricultural activities. In 1964, the government published “The decision to mobilize and organize educated youth to attend in rural socialist construction”, promoting a lot of educated-people to Northeast China for agricultural reclamation [59,60]. The “Agricultural Modernization” [44,61] policy in the late 1970s introduced advanced agricultural equipment, which greatly facilitated large-scale reclamation. In the 1990s, “to promote dry farmland to paddy” policy greatly promoted internal conversion of cultivated land and paddy expansion [44,59]. The “High-standard basic farmland” policy from 2011 to 2015 greatly promoted agricultural modernization [40,62]. Technological progresses, including breeding of cold-tolerant crops and advanced irrigation equipment, contributed to agricultural expansion [36].
4.2. The Effect of Agricultural Expansion on Ecosystem Services
Agricultural expansion is usually accompanied by the loss of natural systems, causing the simplification and decline of ES [47,63]. This study also indicated that agricultural expansion greatly decreased ES and affected the structure of ES. Agricultural expansion accelerated the export of agricultural products function, as well as the decline of all other functions, especially hydrological regulation and biodiversity maintenance function [6,32]. The categories of those who lose ES was public, while the categories of those who earn ES was private. The ES loss mostly distributed in the study area. However, because SSP is an important commodity grain base, the ES gain (agricultural production) was distributed not only within the study area, but also outside the study area. Few studies estimated the ES changes in response to internal conversion between cultivated land, as well as the transformation from different kinds of cultivated land to other land-use types. This study noticed the obvious internal conversion between cultivated land (mainly the transformation from dry farmland to paddy) and found that it caused the ESVs to drop by 62.98 million dollars during 1965–2015 in the SSP. Previous studies usually used the same coefficients for paddy and dry farmland, and therefore they can’t detected ES variations in response to internal conversion between cultivated land in these studies. Future studies should pay attention to internal conversion between cultivated land in analyzing cultivated land change and its impact on ES. Continuing conversion of marsh, grassland, and forest to cultivated land was the main reason for ES loss during the process of agricultural expansion in the study area. Previous studies also indicated that loss of natural ecosystems was the main reason for agricultural expansion and ES loss [32,64].
4.3. Management of Ecosystem Services for Future Sustainability
Integrating ES and land-use changes into landscape planning for sustainable development is still a challenge [47,65]. Studies have begun to try to integrate ES with land-use change to provide recommendations for future sustainability. For example, Liang et al. integrated ESVs to optimal model to optimal future distribution of land investment of Changsha city, China [66]. H. Goldstein et al. quantified ESVs to design a land-use development plan for Hawaii [67]. White et al. extended analyzing trade-offs from economics to simultaneously estimate multiple ES to guide marine spatial planning [68]. In our study, we found that agricultural products function increased quickly at the expense of the loss of ES provided by other functions, such as freshwater supply function, in the past fifty years in the SSP. Due to the government’s emphasis on the protection of natural systems, we think that the area of cultivated land will not fluctuate significantly in the future, and it will show a stable or slightly reduced trend. More and more attention has been paid to the protection of natural systems, and therefore, we think that ESVs in the region will increase in the future. This region has begun to implement the Grain-for-Green Program. The Grain-for-Green Program should be paid more attention in the future. Planed conversion from cultivated land to natural ecosystems (marsh, forest and grassland) should be taken in the SSP. Marsh loss was the dominant reason for agricultural expansion and ES loss. Therefore, restoring cultivated land to marsh should be a priority. Increasing public’s awareness of protecting natural ecosystems, as well as incorporating farmers’ knowledge and scientific research are also necessary for future sustainability [69,70,71]. The largest decline was hydrological regulation, followed by freshwater supply. Previous studies also found the over-exploitation of groundwater as well as the decline of water resources in the SSP [72,73], which was consistent with our study. Therefore, this region needs to rationally allocate water resources and cultivated land distribution to achieve sustainability of water resources as well as agricultural activities. Additionally, planting trees between cultivated land, coculture systems including rice-fish, rice-crab, marsh-fish, and marsh-crab, organic farming, as well as winter-flooding of paddy, can be implemented in the SSP to increase ES [74,75,76,77].
5. Conclusions
Based on information obtained from multi-source remote sensing imageries, this article investigated the historical process of agricultural expansion and its influence on ES in the past five decades in the SSP. Statistics indicate that cultivated land expanded from 3.97% of the total area in 1965 to 66.40% in 2015, with an area increase of 898.23 million ha, leading to an ESVs loss of 11,893.85 million dollars. Paddy field expanded drastically from 0% to 55.93% during 1965–2015, while dry farmland increased from 4.97% to 41.44% during 1965–1995, and then decreased to 11.47% in 2015. The area growth of paddy field was mostly contributed by conversion of marsh, dry farmland, forest, and grassland. We noticed area decline of dry farmland during 1995–2015, which was mostly caused by the conversion from dry farmland to paddy. Climate warming, decreased wind speed, and human activities all promoted agricultural expansion in this region in the past five decades. Government policies also greatly influenced agricultural changes in the SSP. For example, the loss of dry farmland during 1995–2015 was mostly promoted by “to promote dry farmland to paddy” policy. In the past five decades, area changes in paddy and dry farmland decreased the total ESVs by 69,221.20 and 9337.81 million dollars, respectively. The internal conversion between cultivated land caused the ESV to drop by 62.98 million dollars during 1965–2015. Agricultural expansion accelerated the export of agricultural products function, as well as the decline of all other functions, especially hydrological regulation and freshwater supply function. For sustainability in the future, we suggest reasonable allocation of water resources and arable land allocation, planting trees between cultivated land, restoring cultivated land to natural ecosystems (marsh, grassland, and forest), coculture systems including rice-fish, rice-crab, marsh-fish, and marsh-crab, organic farming, and winter-flooding of paddy in the SSP to increase ES. Additionally, the effectiveness of the restoration projects needs to be assessed to ensure their success.
Supplementary Materials
The following are available online at https://www.mdpi.com/2071-1050/12/6/2430/s1, Table S1: VCi of different ecosystems (dollars/ha); Table S2: Loss and gain of paddy during different time periods (ha); Table S3: Loss and gain of dry farmland during different time periods (thousand ha); Table S4: ESV changes per unit area caused by land-use changes related to paddy (million dollar); Table S5: ESV changes per unit area caused by land-use changes related to dry farmland (million dollar); Table S6: ESV changes caused by paddy expansion since 1965 (million dollars); Table S7: ESV changes caused by dry farmland changes since 1965 (million dollars).
Author Contributions
J.C., F.Y. and S.Z. designed the experiments; J.C. and L.Y. performed the experiments; F.Y., L.Y., and S.Z. collected and analyzed the data. J.C. and F.Y. wrote the paper. All authors have read and agreed to the published version of the manuscript.
Funding
This research was funded by the National Science and Technology Basic Resources Survey Project of China (2017FY101301, 2017YFC0504202), the special project of strategic leading science and technology of Chinese Academy of Sciences (XDA2003020301), the National Natural Science Foundation of China (41601475, 41901383). And the APC was funded by the National Science and Technology Basic Resources Survey Project of China (2017FY101301).
Acknowledgments
We thank the anonymous reviewers who provided valuable comments on this research. We are very grateful to those who participated in the data preparation, processing and analysis for this research.
Conflicts of Interest
The authors declare no conflict of interest.
References
- Cardinale, B.J.; Duffy, J.E.; Gonzalez, A.; Hooper, D.U.; Perrings, C.; Venail, P.; Narwani, A.; Mace, G.M.; Tilman, D.; Wardle, D.A.; et al. Biodiversity loss and its impact on humanity. Nature 2012, 486, 59–67. [Google Scholar] [CrossRef] [PubMed]
- Costanza, R.; d’Arge, R.; De Groot, R.; Faber, S.; Grasso, M.; Hannon, B.; Limburg, K.; Naeem, S.; O’neill, R.V.; Paruelo, J. The value of the world’s ecosystem services and natural capital. Nature 1997, 387, 253–260. [Google Scholar] [CrossRef]
- Daily, G. Nature’s Services: Societal Dependence on Natural Ecosystems; Island Press: Washington, DC, USA, 1997. [Google Scholar]
- Ouyang, Z.; Wang, R.; Zhao, J. Ecosystem services and their economic valuation. Chin. J. Appl. Ecol. 1999, 10, 635–640. [Google Scholar]
- Opdam, P.; Steingröver, E.; van Rooij, S. Ecological networks: A spatial concept for multi-actor planning of sustainable landscapes. Landsc. Urban Plan. 2006, 75, 322–332. [Google Scholar] [CrossRef]
- Rukundo, E.; Liu, S.; Dong, Y.; Rutebuka, E.; Asamoah, E.F.; Xu, J.; Wu, X. Spatio-temporal dynamics of critical ecosystem services in response to agricultural expansion in Rwanda, East Africa. Ecol. Indic. 2018, 89, 696–705. [Google Scholar] [CrossRef]
- Keenan, R.J.; Reams, G.A.; Achard, F.; De Freitas, J.V.; Grainger, A.; Lindquist, E. Forest ecology and management dynamics of global forest area: Results from the FAO global forest resources assessment. For. Ecol. Manag. 2015, 352, 9–20. [Google Scholar] [CrossRef]
- Sandker, M.; Finegold, Y.; Min, Z. Forest ecology and management projecting global forest area towards 2030. For. Ecol. Manag. 2015, 52, 124–133. [Google Scholar]
- Costanza, R.; Kubiszewski, I. The authorship structure of “ecosystem services” as a transdisciplinary field of scholarship. Ecosyst. Serv. 2012, 1, 16–25. [Google Scholar] [CrossRef]
- Braat, L.C.; de Groot, R. The ecosystem services agenda: Bridging the worlds of natural science and economics, conservation and development, and public and private policy. Ecosyst. Serv. 2012, 1, 4–15. [Google Scholar] [CrossRef]
- Khan, M.M.H.; Bryceson, I.; Kolivras, K.N.; Faruque, F.; Rahman, M.M.; Haque, U. Natural disasters and land use/land-cover change in the southwest coastal areas of Bangladesh. Reg. Environ. Chang. 2015, 15, 241–250. [Google Scholar] [CrossRef]
- Roth, D.; Torres-Rojo, J.M.; Moreno-Sánchez, R.; Moreno-Sanchez, R. Estimation of human induced disturbance of the environment associated with 2002, 2008 and 2013. land use/cover patterns in Mexico. Appl. Geogr. 2016, 66, 22–34. [Google Scholar] [CrossRef]
- Bosso, L.; Ancillotto, L.; Smeraldo, S.; D’Arco, S.; Migliozzi, A.; Conti, P.; Russo, D. Loss of potential bat habitat following a severe wildfire: A model-based rapid assessment. Int. J. Wildland Fire 2018, 27, 756–769. [Google Scholar] [CrossRef]
- Kertész, Á.; Nagy, L.A.; Bertalan-Balázs, B. Effect of land use change on ecosystem services in Lake Balaton Catchment. Land Use Policy 2019, 80, 430–438. [Google Scholar] [CrossRef]
- Russo, D.; Bosso, L.; Ancillotto, L. Novel perspectives on bat insectivory highlight the value of this ecosystem service in farmland: Research frontiers and management implications. Agric. Ecosyst. Environ. 2018, 266, 31–38. [Google Scholar] [CrossRef]
- Quintas-Soriano, C.; García-Llorente, M.; Norström, A.; Meacham, M.; Peterson, G.; Castro, A.J. Integrating supply and demand in ecosystem service bundles characterization across Mediterranean transformed landscapes. Landsc. Ecol. 2019, 34, 1619–1633. [Google Scholar] [CrossRef]
- Liu, S.; Deng, L.; Dong, S.; Zhao, Q.; Yang, J.; Wang, C. Landscape connectivity dynamics based on network analysis in the Xishuangbanna Nature Reserve, China. Acta Oecol. 2014, 55, 66–77. [Google Scholar] [CrossRef]
- Stockmann, U.; Adams, M.; Crawford, J.W.; Field, D.; Henakaarchchi, N.; Jenkins, M.; Minasny, B.; McBratney, A.B.; Courcelles, V.D.R.D.; Singh, K.; et al. The knowns, known unknowns and unknowns of sequestration of soil organic carbon. Agric. Ecosyst. Environ. 2015, 164, 80–99. [Google Scholar] [CrossRef]
- Daniel, D.W.; Smith, L.M.; Belden, J.; McMurry, S.T.; Swain, S. Effects of land-use change and fungicide application on soil respiration in playa wetlands and adjacent uplands of the U.S. High Plains. Sci. Total Environ. 2015, 514, 290–297. [Google Scholar] [CrossRef]
- Dubreuil, V.; Debortoli, N.S.; Funatsu, B.; Nédélec, V.; Durieux, L. Impact of land-cover change in the Southern Amazonia climate: A case study for the region of Alta Floresta, Mato Grosso, Brazil. Environ. Monit. Assess. 2012, 184, 877–891. [Google Scholar] [CrossRef]
- Natkhin, M.; Dietrich, O.; Schäfer, M.P.; Lischeid, G. The effects of climate and changing land use on the discharge regime of a small catchment in Tanzania. Reg. Environ. Chang. 2015, 15, 1269–1280. [Google Scholar] [CrossRef]
- Sherrouse, B.C.; Semmens, D.J.; Ancona, Z.H.; Brunner, N.M. Analyzing land-use change scenarios for trade-offs among cultural ecosystem services in the Southern Rocky Mountains. Ecosyst. Serv. 2017, 26, 431–444. [Google Scholar] [CrossRef]
- Martinez, M.L.; Perez-Maqueo, O.; Vazquez, G.; Castillo-Campos, G.; Garcia-Franco, J.; Mehltreter, K.; Landgrave, R. Effects of land use change on biodiversity and ecosystem services in tropical montane cloud forests of Mexico. For. Ecol. Manag. 2009, 258, 1856–1863. [Google Scholar] [CrossRef]
- Rodriguez-Echeverry, J.; Echeverria, C.; Oyarzun, C.; Morales, L. Impact of land-use change on biodiversity and ecosystem services in the Chilean temperate forests. Lands. Ecol. 2018, 33, 439–453. [Google Scholar] [CrossRef]
- Pommier, T.; Cantarel, A.A.M.; Grigulis, K.; Lavorel, S.; Legay, N.; Baxendale, C.; Clement, J.C. The added value of including key microbial traits to determine nitrogen-related ecosystem services in managed grasslands. J. Appl. Ecol. 2018, 55, 49–58. [Google Scholar] [CrossRef]
- Estoque, R.C.; Murayama, Y. Landscape pattern and ecosystem service value changes: Implications for environmental sustainability planning for the rapidly urbanizing summer capital of the Philippines. Lands. Urban Plan. 2013, 116, 60–72. [Google Scholar] [CrossRef]
- Su, S.L.; Li, D.L.; Hu, Y.N.; Xiao, R.; Zhang, Y. Spatially non-stationary response of ecosystem service value changes to urbanization in Shanghai, China. Ecol. Indic. 2014, 45, 332–339. [Google Scholar] [CrossRef]
- Nesbitt, L.; Hotte, N.; Barron, S.; Cowan, J.; Sheppard, S.R.J. The social and economic value of cultural ecosystem services provided by urban forests in North America: A review and suggestions for future research. Urban For. Urban Green. 2017, 25, 103–111. [Google Scholar] [CrossRef]
- Lavorel, S.; Grigulis, K.; Leitinger, G.; Kohler, M.; Schirpke, U.; Tappeiner, U. Historical trajectories in land use pattern and grassland ecosystem services in two European alpine landscapes. Reg. Environ. Chang. 2017, 17, 2251–2264. [Google Scholar] [CrossRef]
- Gaglio, M.; Aschonitis, V.G.; Gissi, E.; Castaldelli, G.; Fano, E.A. Land use change effects on ecosystem services of river deltas and coastal wetlands: Case study in Volano-Mesola-Goro in Po river delta (Italy). Wetl. Ecol. Manag. 2017, 25, 67–86. [Google Scholar] [CrossRef]
- Zorrilla-Miras, P.; Palomo, I.; Gomez-Baggethun, E.; Martin-Lopez, B.; Lomas, P.L.; Montes, C. Effects of land-use change on wetland ecosystem services: A case study in the Donana marshes (SW Spain). Lands. Urban Plan. 2014, 122, 160–174. [Google Scholar] [CrossRef]
- Kroeger, T.; Casey, F. An assessment of market-based approaches to providing ecosystem services on agricultural lands. Ecol. Econ. 2007, 64, 321–332. [Google Scholar] [CrossRef]
- Wang, J.T.; Peng, J.; Zhao, M.Y.; Liu, Y.X.; Chen, Y.Q. Significant trade-off for the impact of grain-for-green programme on ecosystem services in north-western Yunnan, China. Sci. Total Environ. 2017, 574, 57–64. [Google Scholar] [CrossRef] [PubMed]
- Gamfeldt, L.; Snäll, T.; Bagchi, R.; Jonsson, M.; Gustafsson, L.; Kjellander, P.; Ruiz-Jaen, M.C.; Fröberg, M.; Stendahl, J.; Philipson, C.D.; et al. Higher levels of multiple ecosystem services are found in forests with more tree species. Nat. Commun. 2013, 4, 1340. [Google Scholar] [CrossRef] [PubMed]
- Hooper, D.; Adair, E.C.; Cardinale, B.J.; Byrnes, J.E.K.; Hungate, B.A.; Matulich, K.L.; Gonzalez, A.; Duffy, J.E.; Gamfeldt, L.; O’Connor, M.I.; et al. A global synthesis reveals biodiversity loss as a major driver of ecosystem change. Nature 2012, 486, 105–108. [Google Scholar] [CrossRef] [PubMed]
- Viglizzo, E.F.; Frank, F.C.; Carreño, L.V.; Jobbágy, E.G.; Pereyra, H.; Clatt, J.; Pincén, D.; Ricard, M.F. Ecological and environmental footprint of 50 years of agricultural expansion in Argentina. Glob. Chang. Biol. 2011, 17, 959–973. [Google Scholar] [CrossRef]
- Maeda, E.; Clark, B.J.; Pellikka, P.; Siljander, M. Modelling agricultural expansion in Kenya’s Eastern Arc Mountains biodiversity hotspot. Agric. Syst. 2010, 103, 609–620. [Google Scholar] [CrossRef]
- Xiao, X.; Boles, S.; Frolking, S.; Li, C.; Babu, J.Y.; Salas, W.; Moore, B. Mapping paddy rice agriculture in South and Southeast Asia using multi-temporal MODIS images. Remote Sens. Environ. 2006, 100, 95–113. [Google Scholar] [CrossRef]
- Zhang, B.; Tian, H.; Ren, W.; Tao, B.; Lu, C.; Yang, J.; Pan, S. Methane emissions from global rice fields: Magnitude, spatiotemporal patterns, and environmental controls. Glob. Biogeochem. Cycles 2016, 30, 1246–1263. [Google Scholar] [CrossRef]
- Yan, F.; Yu, L.; Yang, C.; Zhang, S. Paddy Field Expansion and Aggregation Since the Mid-1950s in a Cold Region and Its Possible Causes. Remote Sens. 2018, 10, 384. [Google Scholar] [CrossRef]
- Gilbert, M.; Golding, N.; Zhou, H.; Wint, G.R.W.; Robinson, T.P.; Tatem, A.J.; Yu, H.J. Predicting the risk of avian influenza A H7N9 infection in live-poultry markets across Asia. Nat. Commun. 2014, 5, 4116. [Google Scholar] [CrossRef]
- Gilbert, M.; Xiao, X.M.; Pfeiffer, D.U.; Epprecht, M.; Boles, S.; Czarnecki, C.; Slingenbergh, J. Mapping H5N1 highly pathogenic avian influenza risk in Southeast Asia. Proc. Natl. Acad. Sci. USA 2008, 105, 4769–4774. [Google Scholar] [CrossRef]
- Dong, J.; Xiao, X.; Menarguez, M.A.; Zhang, G.; Qin, Y.; Thau, D.; Moore, B. Mapping paddy rice planting area in northeastern Asia with Landsat 8 images, phenology-based algorithm and Google Earth Engine. Remote Sens. Environ. 2016, 185, 142–154. [Google Scholar] [CrossRef]
- Yan, F.Q.; Zhang, S.W.; Liu, X.T.; Yu, L.X.; Chen, D.; Yang, J.C.; Yang, C.B.; Bu, K.; Chang, L.P. Monitoring spatiotemporal changes of marshes in the Sanjiang Plain, China. Ecol. Eng. 2017, 104, 184–194. [Google Scholar] [CrossRef]
- Zhang, L.; Yu, X.; Jiang, M.; Xue, Z.; Lu, X.; Zou, Y. A consistent ecosystem services valuation method based on total economic value and equivalent value factors: A case study in the Sanjiang Plain, Northeast China. Ecol. Complex. 2017, 29, 40–48. [Google Scholar] [CrossRef]
- Wang, Z.M.; Zhang, B.; Zhang, S.Q.; Li, X.Y.; Liu, D.W.; Song, K.S.; Li, J.P.; Li, F.; Duan, H.T. Changes of land use and of ecosystem service values in Sanjiang Plain, northeast China. Environ. Monit. Assess. 2006, 112, 69–91. [Google Scholar] [CrossRef] [PubMed]
- Yan, F.Q.; Zhang, S.W.; Liu, X.T.; Chen, D.; Chen, J.; Bu, K.; Yang, J.C.; Chang, L.P. The effects of spatiotemporal changes in land degradation on ecosystem services values in Sanjiang Plain, China. Remote Sens. 2016, 8, 917. [Google Scholar] [CrossRef]
- Song, K.; Liu, D.; Wand, Z.; Zhang, B.; Jin, C.; Li, F.; Liu, H. Analysis of cultivated land dynamics in the last 50 years in sanjiang plain and its driving forces. J. Soil Water Conserv. 2008, 22, 75–81. (In Chinese) [Google Scholar]
- Chen, J.; Sun, B.M.; Chen, D.; Wu, X.; Guo, L.Z.; Wang, G. Land Use changes and Their effects on the value of ecosystem services in the small Sanjiang Plain in China. Sci. World J. 2014, 2014, 752846. [Google Scholar] [CrossRef]
- Liu, J.; Zhan, J.; Deng, X. Spatio-temporal patterns and driving forces of urban land expansion in China during the economic reform era. Ambio 2005, 34, 450–455. [Google Scholar] [CrossRef]
- Liu, J.; Zhang, Z.; Xu, X.; Kuang, W.; Zhou, W.; Zhang, S.; Li, R.; Yan, C.; Yu, N.; Wu, S.; et al. Spatial patterns and driving forces of land use change in China during the early 21st century. J. Geogr. Sci. 2010, 20, 483–494. [Google Scholar] [CrossRef]
- Jiyuan, L.; Mingliang, L.; Xiangzheng, D.; Dafang, Z.; Zengxiang, Z.; Di, L. The land use and land cover change database and its relative studies in China. J. Geogr. Sci. 2002, 12, 275–282. [Google Scholar] [CrossRef]
- Zhuang, D.; Liu, J.; Liu, M. Research activities on land-use/cover change in the past ten years in China using space technology. Chin. Geogr. Sci. 1999, 9, 330–334. [Google Scholar] [CrossRef]
- Liu, J.; Liu, M.; Zhuang, D.; Zhang, Z.; Deng, X. Study on spatial pattern of land-use change in China during 1995–2000. Sci. China Ser. D Earth Sci. 2003, 46, 373–384. [Google Scholar]
- Liu, J.; Melillo, J.M.; Tian, H.; Zhuang, D.; Zhang, Z. China’s changing landscape during the 1990s: Large-scale land transformations estimated with satellite data. Geophys. Res. Lett. 2005, 32. [Google Scholar] [CrossRef]
- Dan, W.; Wei, H.; Zhang, S.W.; Kun, B.; Bao, X.; Yi, W.; Yue, L. Processes and prediction of land use/land cover changes (lucc) driven by farm construction: The case of naoli river basin in sanjiang plain. Environ. Earth Sci. 2015, 73, 4841–4851. [Google Scholar] [CrossRef]
- Frondoni, R.; Mollo, B.; Capotorti, G. A landscape analysis of land cover change in the municipality of Rome (Italy): Spatio-temporal characteristics and ecological implications of land cover transitions from 1954 to 2001. Landsc. Urban Plan. 2011, 100, 117–128. [Google Scholar] [CrossRef]
- Jin, W.; Ren, G.Y.; Qu, Y.; Liu, X.L. Change in Surface Mean Wind Speed of Northeast China during the Period of 1971–2010. Arid Zone Res. 2012, 29, 648–653. (In Chinese) [Google Scholar]
- Wang, Z.M.; Song, K.S.; Ma, W.H.; Ren, C.Y.; Zhang, B.; Liu, D.W.; Chen, J.M.; Song, C.C. Loss and fragmentation of marshes in the sanjiang plain, northeast China, 1954–2005. Wetlands 2011, 31, 945–954. [Google Scholar] [CrossRef]
- Liu, H.Y.; Zhang, S.K.; Li, Z.F.; Lu, X.G.; Yang, Q. Impacts on wetlands of large-scale land-use changes by agricultural development: The small sanjiang plain, China. Ambio 2004, 33, 306–310. [Google Scholar] [CrossRef]
- Liu, X.; Dong, G.; Wang, X.; Xue, Z.; Jiang, M.; Lu, X.; Zhang, Y. Characterizing the spatial pattern of marshlands in the sanjiang plain, northeast China. Ecol. Eng. 2013, 53, 335–342. [Google Scholar] [CrossRef]
- Pu, L.; Zhang, S.; Yang, J.; Yan, F.; Chang, L. Assessment of High-standard Farmland Construction Effectiveness in Liaoning Province During 2011–2015. Chin. Geogr. Sci. 2019, 29, 667–678. [Google Scholar] [CrossRef]
- Laurance, W.F.; Sayer, J.; Cassman, K.G. Agricultural expansion and its impacts on tropical nature. Trends Ecol. Evol. 2014, 29, 107–116. [Google Scholar] [CrossRef] [PubMed]
- Yan, F.; Zhang, S.; Su, F. Variations in ecosystem services in response to paddy expansion in the Sanjiang Plain, Northeast China. Int. J. Agric. Sustain. 2019. [Google Scholar] [CrossRef]
- Shi, P.J.; Yu, D.Y. Assessing urban environmental resources and services of Shenzhen, China: A landscape-based approach for urban planning and sustainability. Landsc. Urban Plan. 2014, 125, 290–297. [Google Scholar] [CrossRef]
- Liang, J.; Zhong, M.; Niu, C.-G.; Chen, G.; Hua, S.; Li, X.; Yuan, Y.; Wu, H.; Gao, X. Risk management for optimal land use planning integrating ecosystem services values: A case study in Changsha, Middle China. Sci. Total Environ. 2017, 579, 1675–1682. [Google Scholar] [CrossRef] [PubMed]
- Goldstein, J.H.; Caldarone, G.; Duarte, T.K.; Ennaanay, D.; Hannahs, N.; Mendoza, G.; Polasky, S.; Wolny, S.; Ouyang, Z. Integrating ecosystem-service tradeoffs into land-use decisions. Proc. Natl. Acad. Sci. USA 2012, 109, 7565–7570. [Google Scholar] [CrossRef]
- White, C.; Halpern, B.S.; Kappel, C.V. Ecosystem service tradeoff analysis reveals the value of marine spatial planning for multiple ocean uses. Proc. Natl. Acad. Sci. USA 2012, 109, 4696–4701. [Google Scholar] [CrossRef]
- Turner, R.; Bergh, J.C.V.D.; Söderqvist, T.; Barendregt, A.; Van Der Straaten, J.; Maltby, E.; Van Ierland, E.C. Ecological-economic analysis of wetlands: Scientific integration for management and policy. Ecol. Econ. 2000, 35, 7–23. [Google Scholar] [CrossRef]
- Olsson, P.; Folke, C.; Hahn, T. Social-Ecological Transformation for Ecosystem Management: The Development of Adaptive Co-management of a Wetland Landscape in Southern Sweden. Ecol. Soc. 2004, 9, 2. [Google Scholar] [CrossRef]
- Wang, Y.; Yao, Y.; Ju, M. Wise Use of Wetlands: Current State of Protection and Utilization of Chinese Wetlands and Recommendations for Improvement. Environ. Manag. 2008, 41, 793–808. [Google Scholar] [CrossRef]
- Du, J.; Zhang, B.; Song, K.S.; Wang, Z.M. Study on water consumption and water budget in the Sanjiang Plain. J. Hydraul. Eng. 2010, 41, 155–163. (In Chinese) [Google Scholar]
- Jiang, Q.X.; Fu, Q.; Wang, Z.L.; Jiang, N. Spatial matching patterns of land and water resources in Sanjiang Plain. J. Nat. Resour. 2011, 26, 270–277. (In Chinese) [Google Scholar]
- Seabloom, E.W.; Valk, A.G. Plant diversity, composition, and invasion of restored and natural prairie pothole wetlands: Implications for restoration. Wetlands 2003, 23, 1–12. [Google Scholar] [CrossRef]
- Liu, X.P.; Wang, K.; Zhang, G. Perspectives and policies: Ecological industry substitutes in wetland restoration of the Middle Yangtze. Wetlands 2004, 24, 633–641. [Google Scholar]
- Willison, J.H.M.; Li, R.; Yuan, X. Conservation and ecofriendly utilization of wetlands associated with the Three Gorges Reservoir. Environ. Sci. Pollut. Res. 2013, 20, 6907–6916. [Google Scholar] [CrossRef]
- Yu, X.; Mingju, E.; Sun, M.; Xue, Z.; Lu, X.; Jiang, M.; Zou, Y. Wetland recreational agriculture: Balancing wetland conservation and agro-development. Environ. Sci. Policy 2018, 87, 11–17. [Google Scholar] [CrossRef]


© 2020 by the authors. Licensee MDPI, Basel, Switzerland. This article is an open access article distributed under the terms and conditions of the Creative Commons Attribution (CC BY) license (http://creativecommons.org/licenses/by/4.0/).