Regional Differences in Fossil Energy-Related Carbon Emissions in China’s Eight Economic Regions: Based on the Theil Index and PLS-VIP Method


Abstract
:1. Introduction
2. Literature Review
2.1. Exploration of China’s Carbon Emissions
2.2. Emissions Research Methodologies
3. Methods
3.1. Econometric Model of Carbon Emissions
3.2. Theil Index
3.3. PLS-VIP Method
4. Empirical Results and Discussion
4.1. Division of Economic Regions
4.2. Carbon Emission Estimation and Data Sources
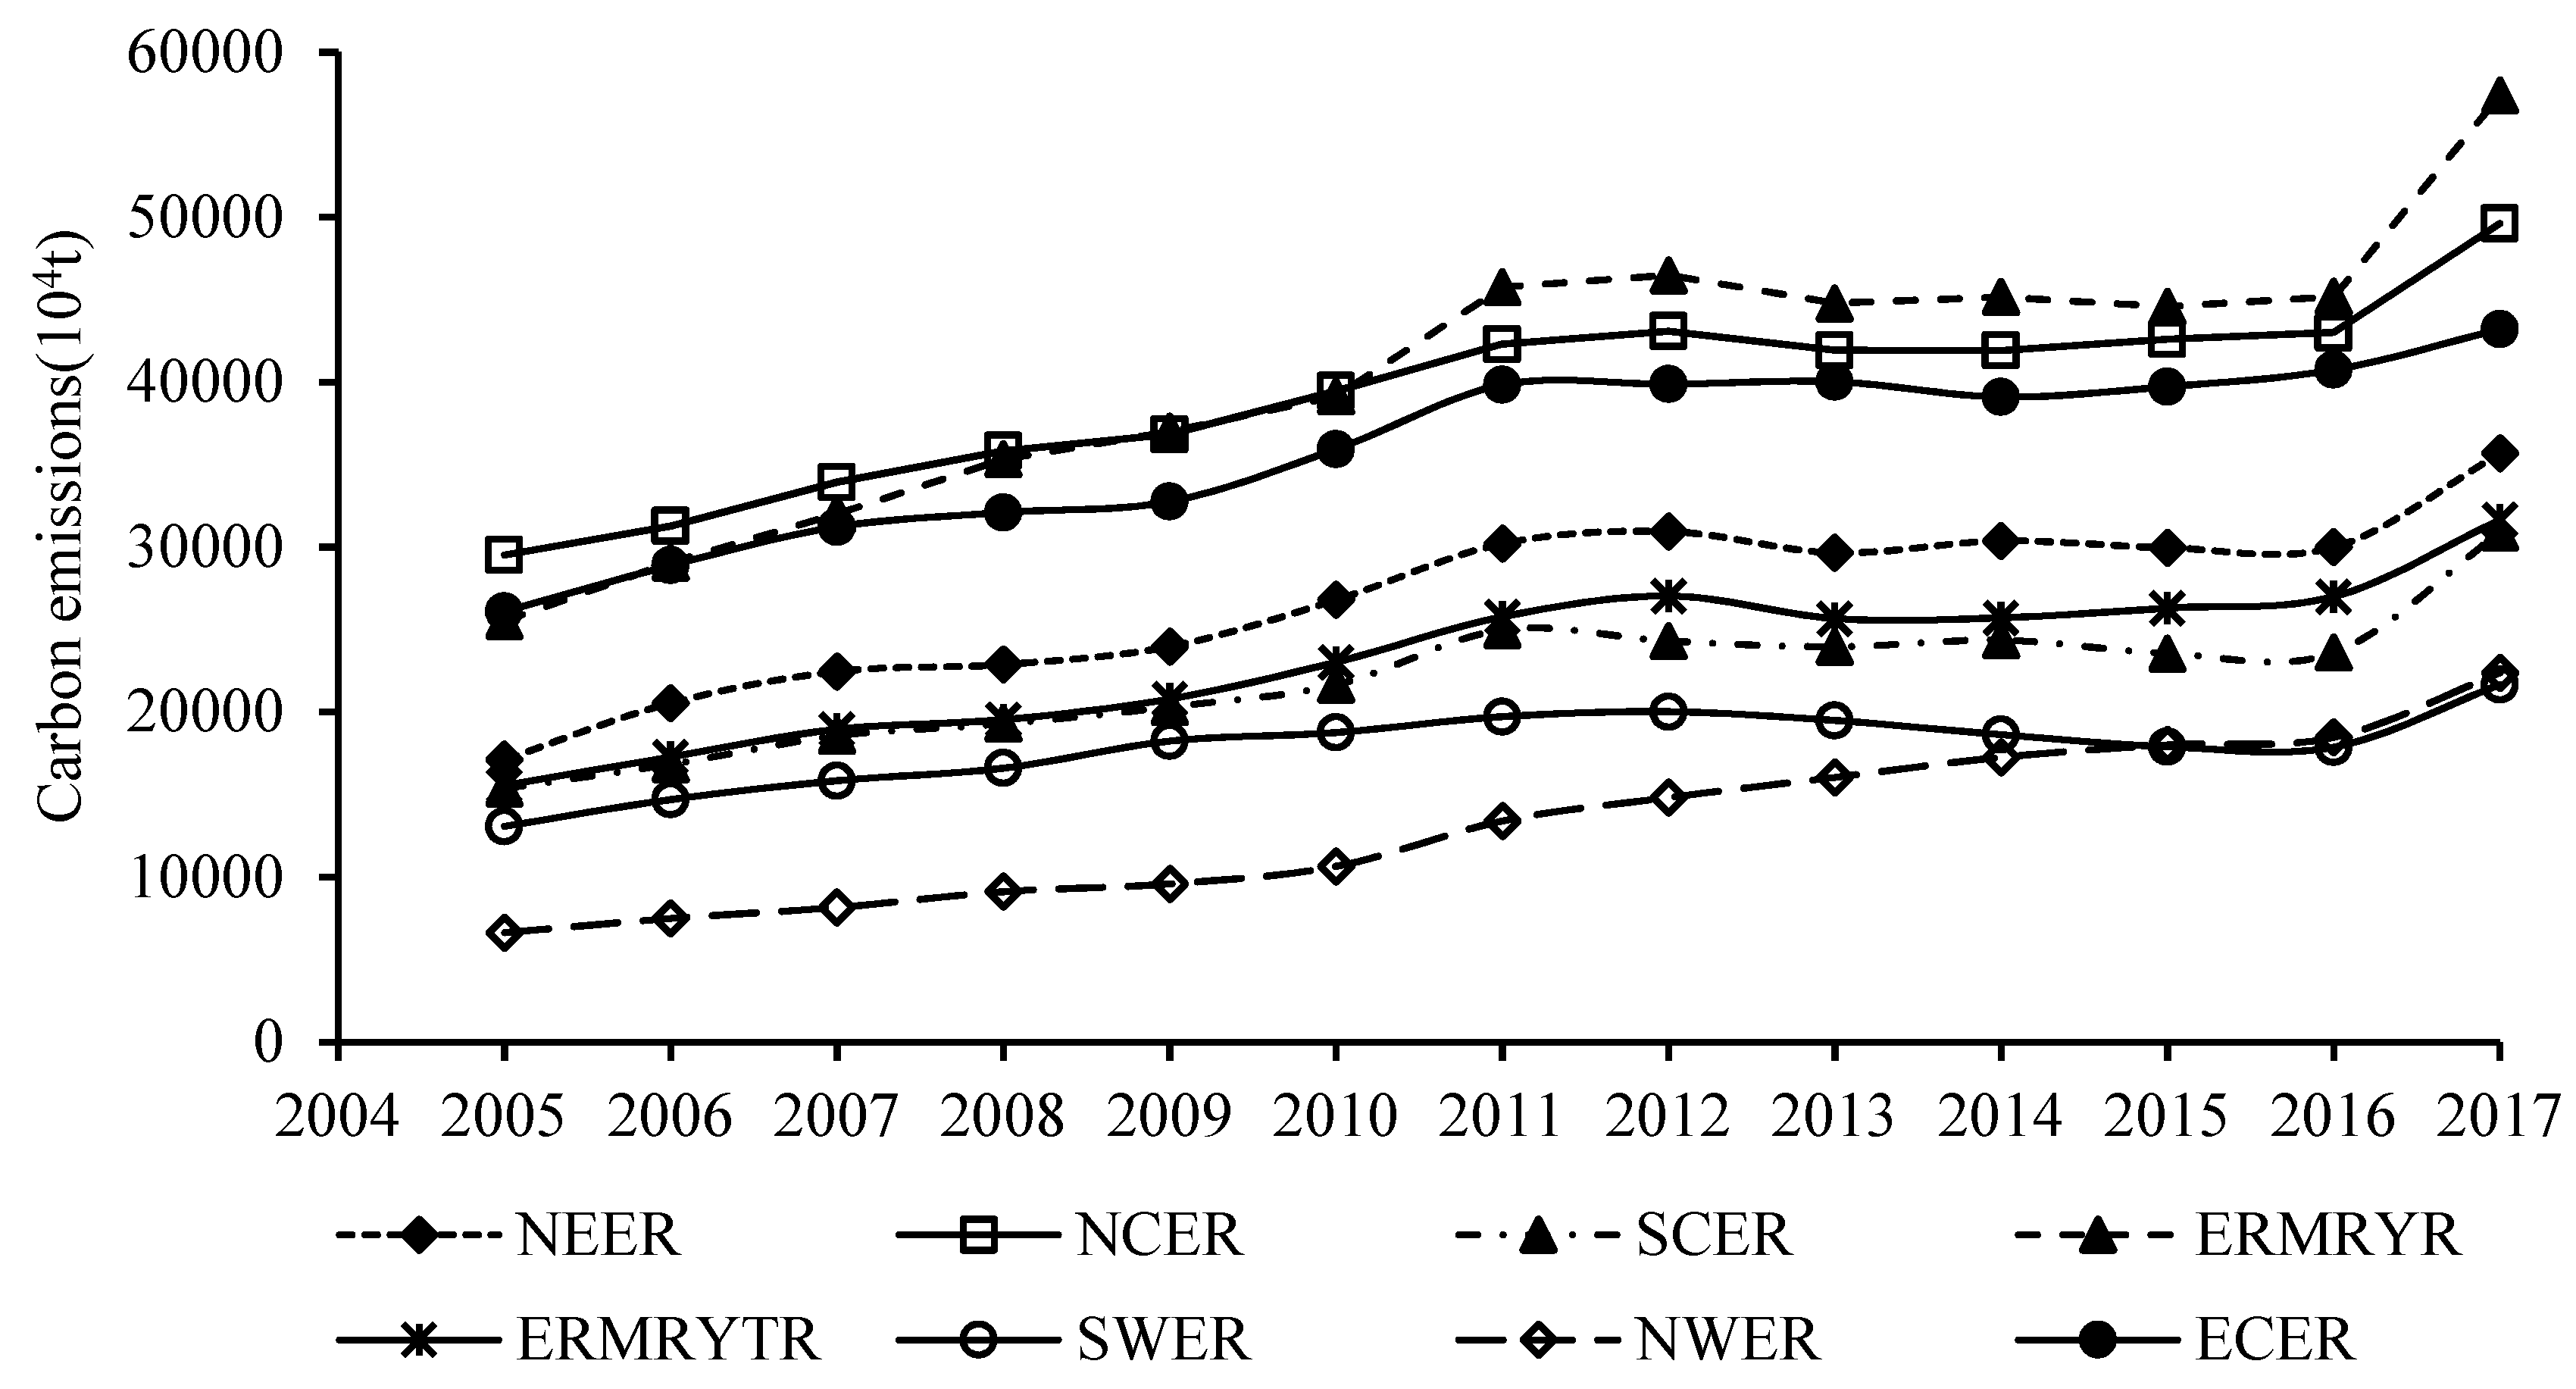
4.3. Characteristics of Carbon Emissions in China’s Eight Economic Regions
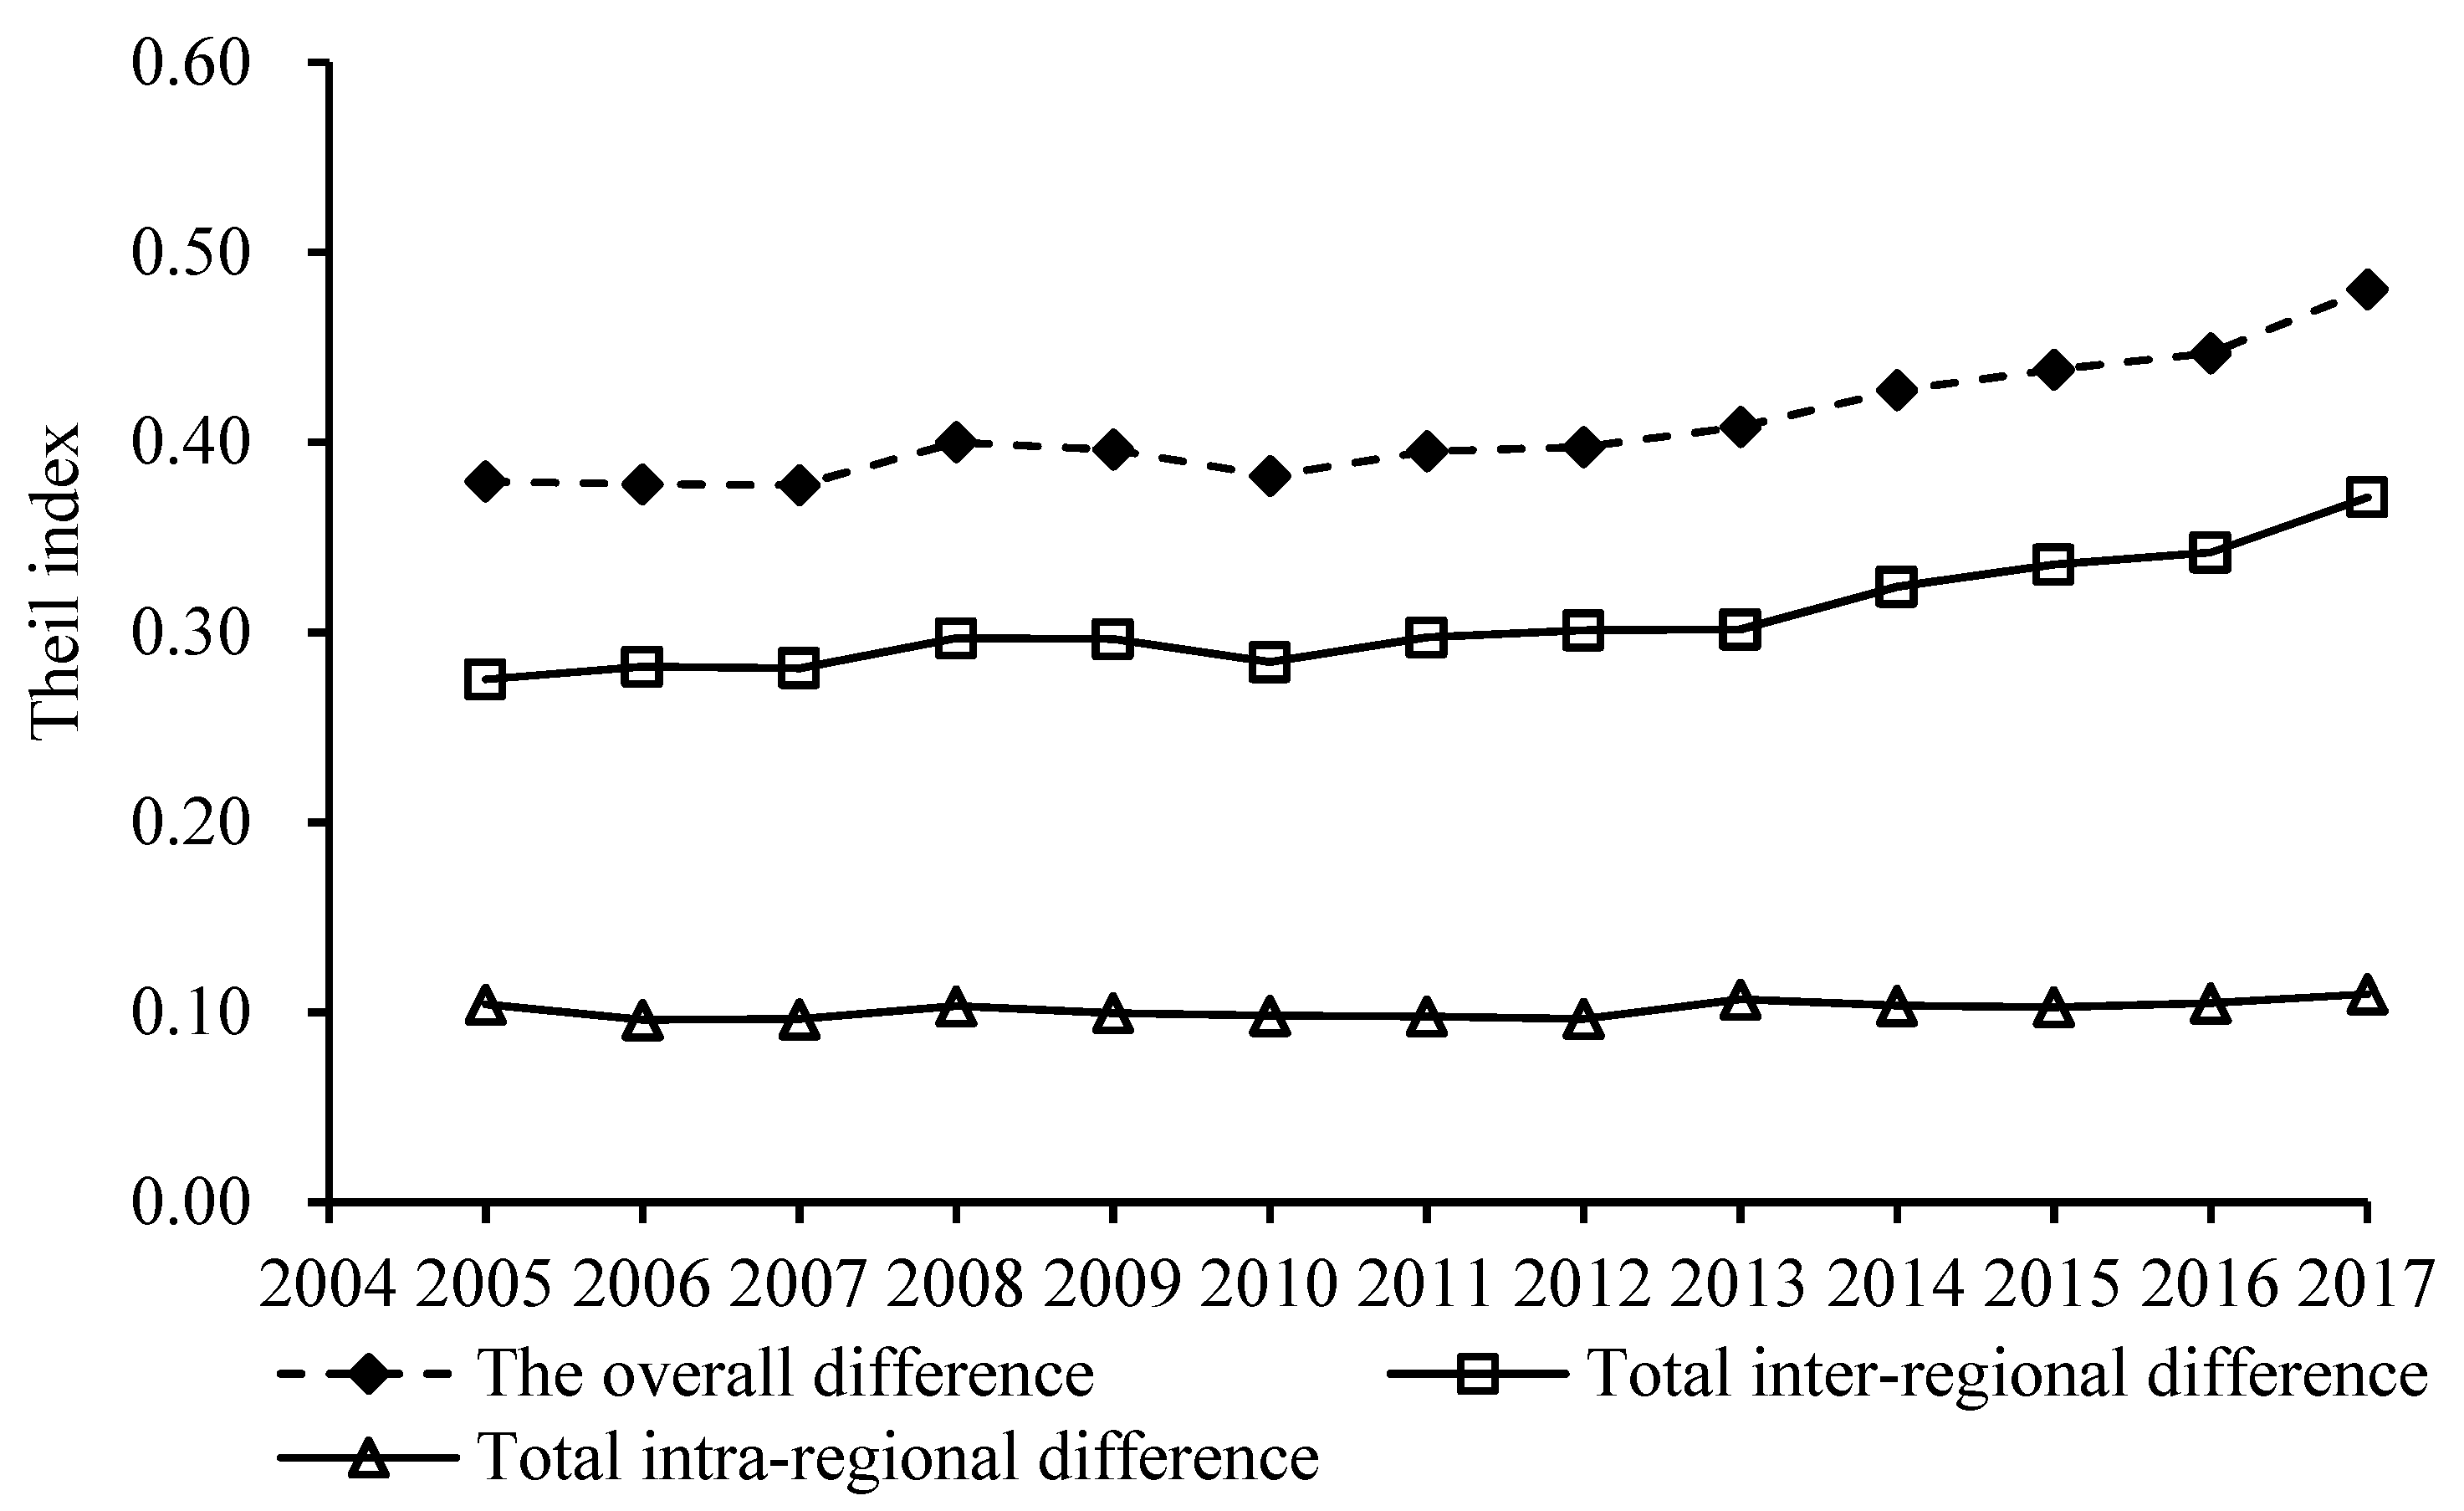
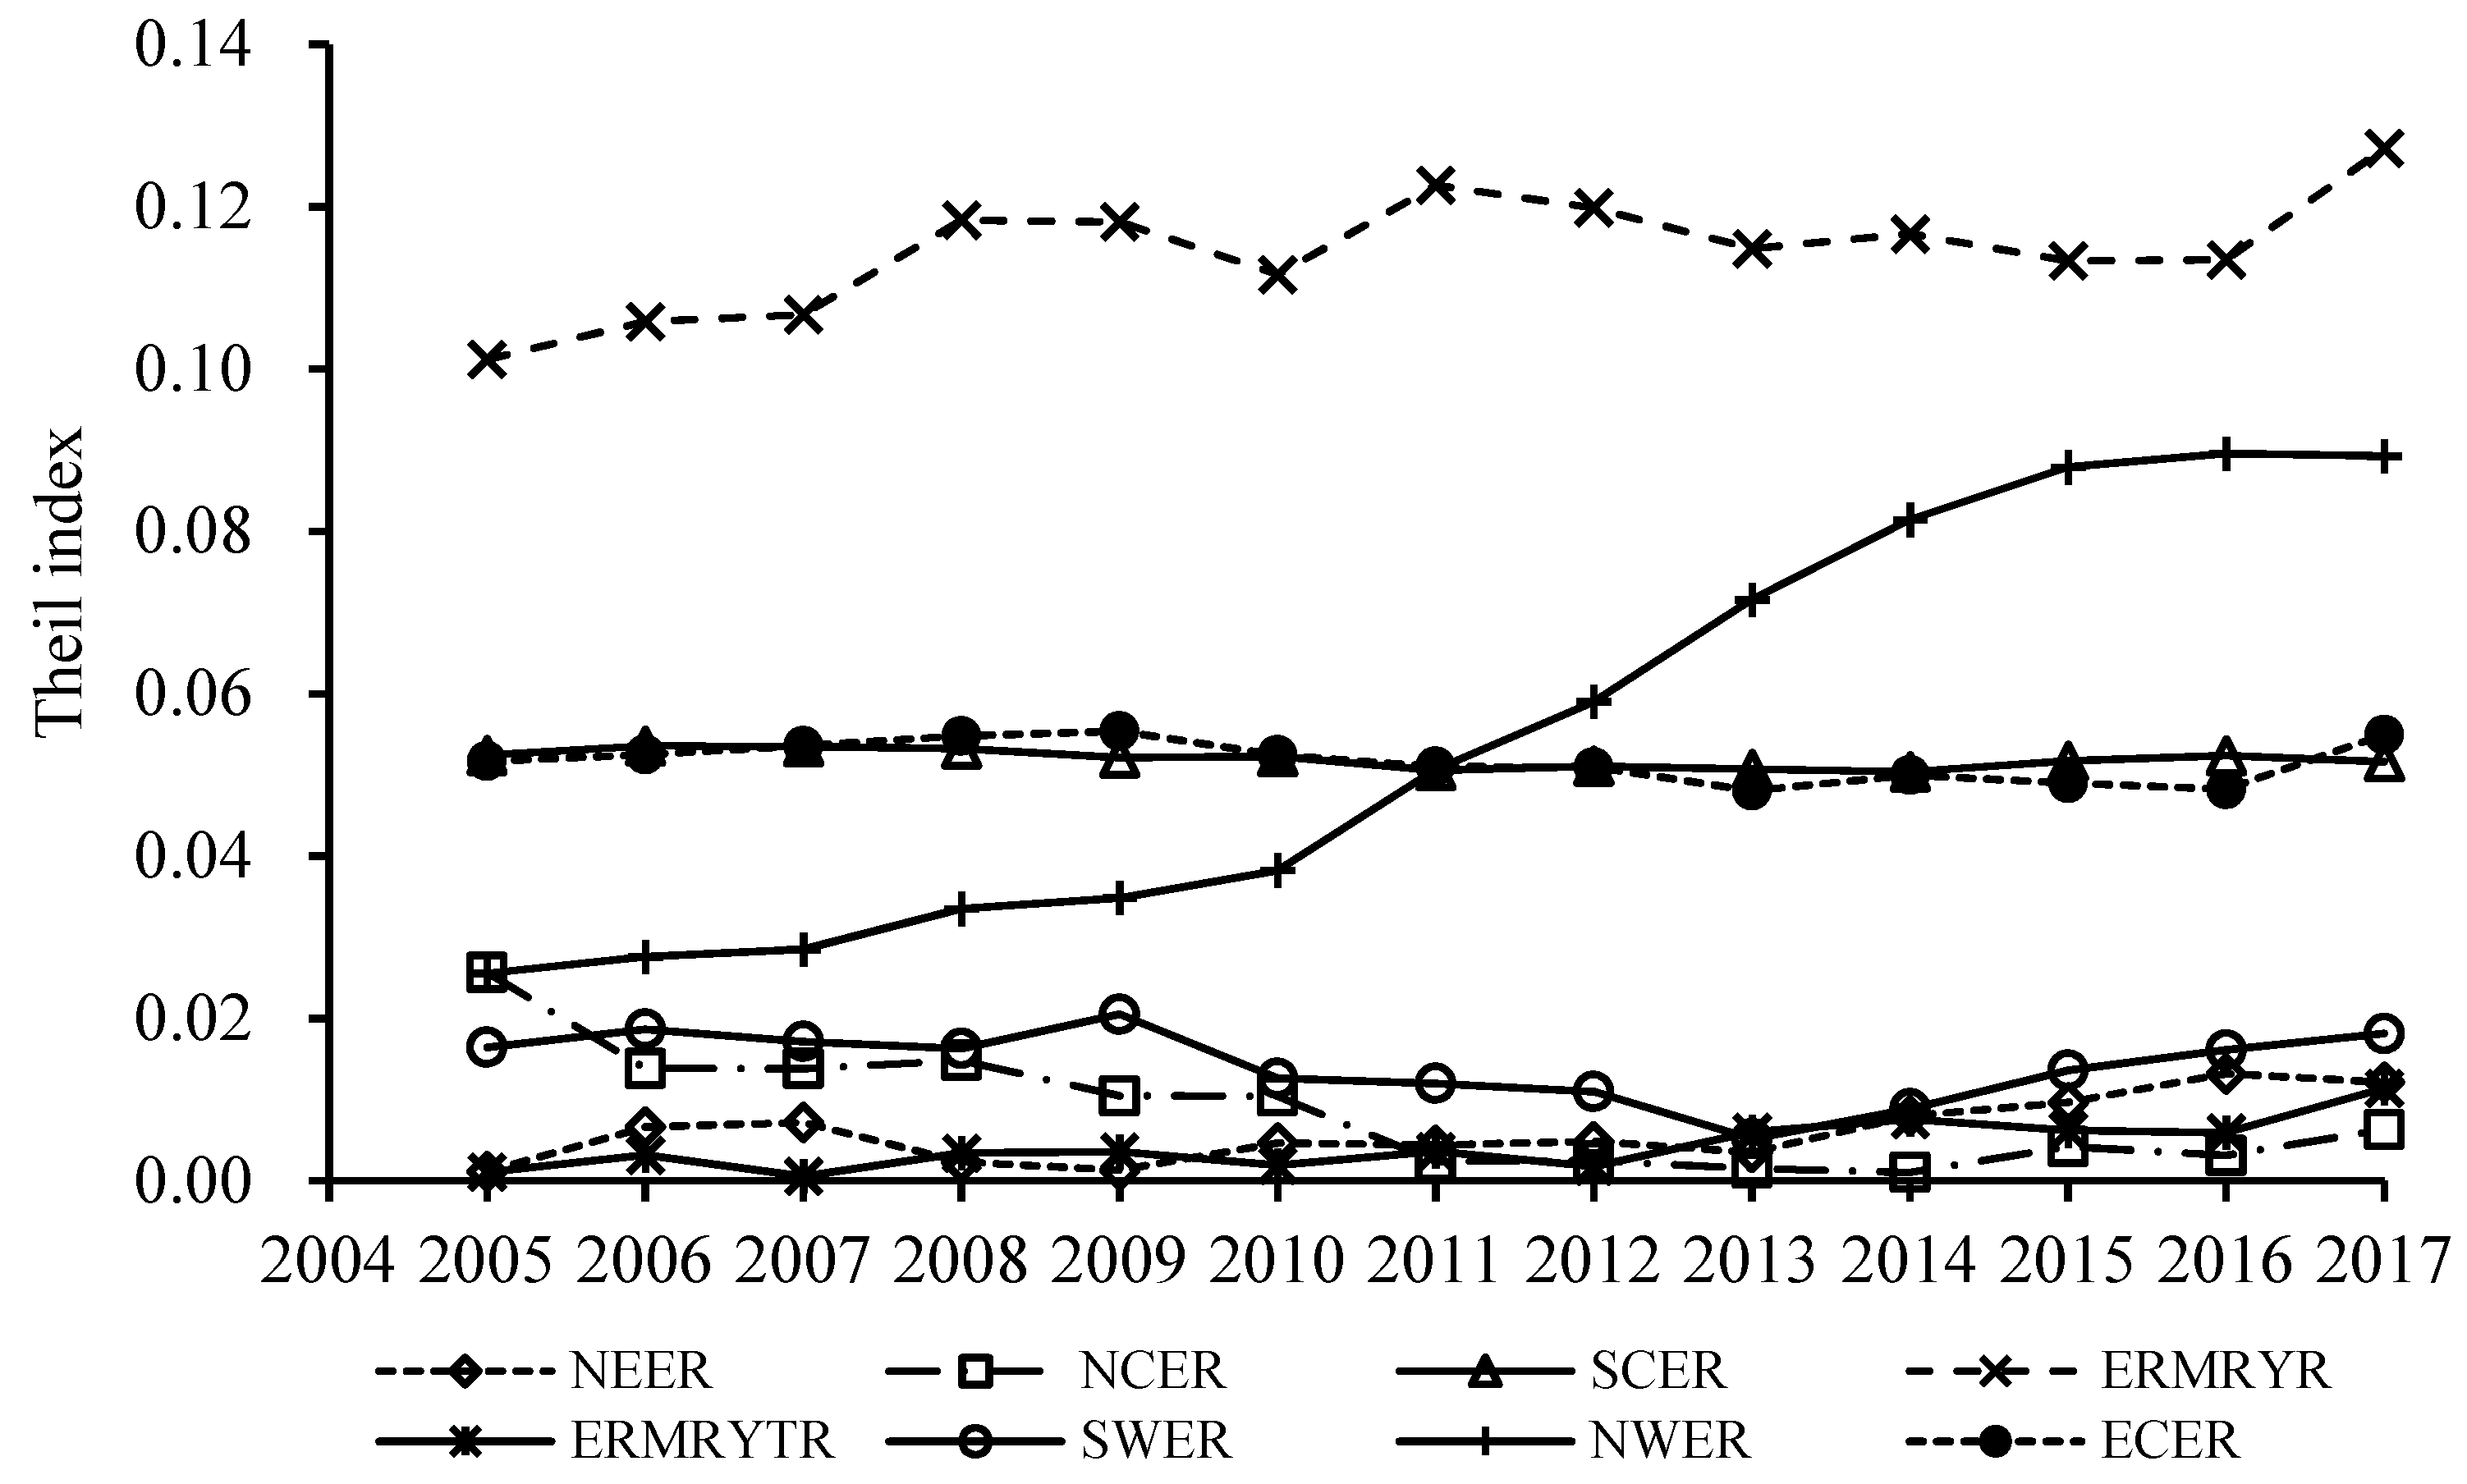
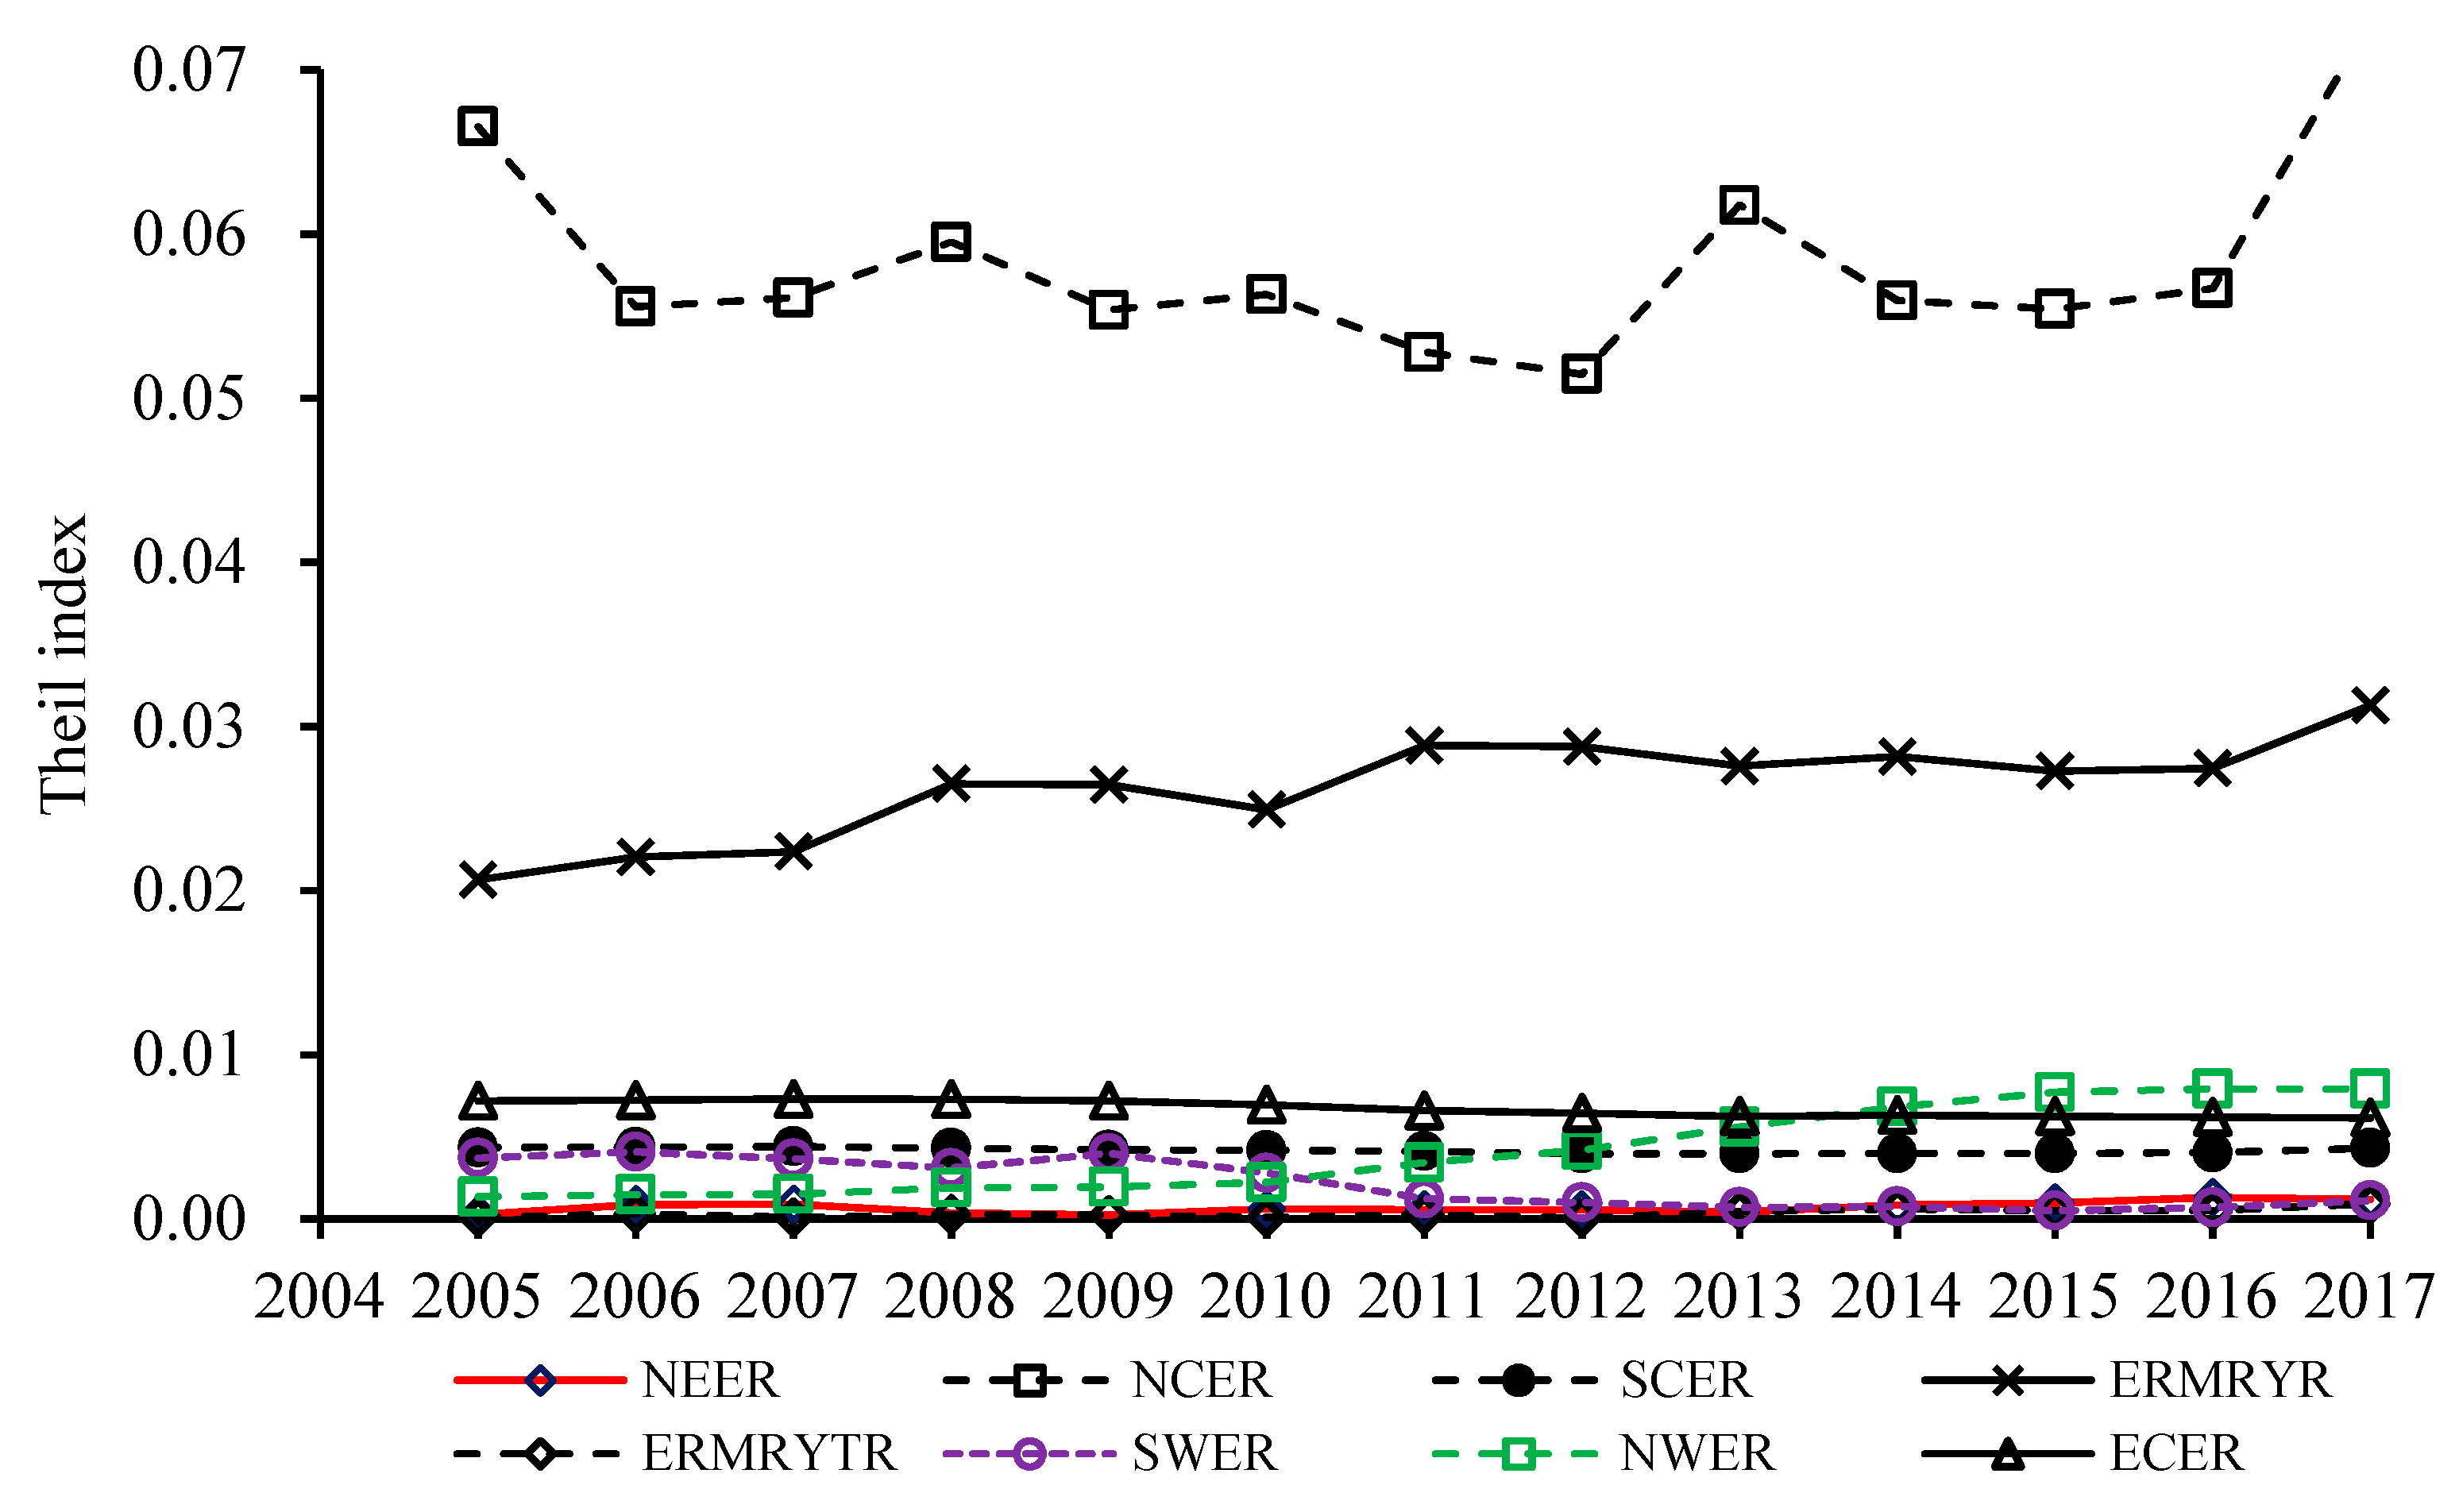
4.4. Regional Difference in Carbon Emissions and its Decomposition
4.5. Influencing Factors of Regional Differences in China’s Carbon Emissions
5. Conclusions and Policy Proposals
Author Contributions
Funding
Conflicts of Interest
References
- Tao, S.; Li, B.G.; Gasser, T.; Ciais, P.; Piao, S.L.; Balkanski, Y.; Hauglustaine, D.; Boisier, J.P.; Chen, Z.; Huang, M.T. The contribution of China’s emissions to global climate forcing. Nature 2016, 531, 357–361. [Google Scholar]
- Ye, B.; Jiang, J.J.; Sheng, L.C. Quantification and driving force analysis of provincial-level carbon emissions in China. Appl. Energy 2017, 198, 223–238. [Google Scholar] [CrossRef]
- National Development and Reform Commission of China (NDRC). Enhanced Actions on Climate Change: China’s Intended Nationally Determined Contributions; National Development and Reform Commission of China: Beijing, China, 2015. (In Chinese)
- Lai, L.; Huang, X.J.; Yang, H.; Julian, R.T. Carbon emissions from land-use change and management in China between 1990 and 2010. Sci. Adv. 2016, 2, e1601063. [Google Scholar] [CrossRef] [PubMed] [Green Version]
- Li, K.; Lin, B.Q. Economic growth model, structural transformation, and green productivity in China. Appl. Energy 2017, 187, 489–500. [Google Scholar] [CrossRef]
- Liu, Z.; Guan, D.B.; Moore, S.; Lee, H.; Su, J.; Zhang, Q. Climate policy: Steps to China’s carbon peak. Nature 2015, 522, 279–281. [Google Scholar] [CrossRef] [Green Version]
- Shan, Y.L.; Liu, J.H.; Liu, Z.; Xu, X.H.; Shao, S.; Wang, P.; Guan, D.B. New provincial CO2 emission inventories in China based on apparent energy consumption data and updated emission factors. Appl. Energy 2016, 184, 742–750. [Google Scholar] [CrossRef] [Green Version]
- Wang, J.; Yang, J. Regional carbon emission intensity disparities in China based on the decomposition method of Shapley value. Resour. Sci. 2014, 36, 557–566. (In Chinese) [Google Scholar]
- Chen, J.D.; Xu, C.; Cui, L.B.; Huang, S. Driving factors of CO2 emissions and inequality characteristics in China: A combined decomposition approach. Energy Econ. 2019, 78, 589–597. [Google Scholar] [CrossRef]
- Clarke-Sather, A.; Qu, J.S.; Wang, Q.; Zeng, J.J.; Li, Y. Carbon inequality at the sub-national scale: A case study of provincial-level inequality in CO2 emissions in China 1997–2007. Energy Policy 2011, 9, 5420–5428. [Google Scholar] [CrossRef]
- Yang, J.; Wang, J.; Zhang, Z.Y. Inter-provincial discrepancy and abatement target achievement in carbon emissions: A study on carbon Lorenz curve. Acta Sci. Circumstantiae 2012, 32, 2016–2023. (In Chinese) [Google Scholar]
- Cheng, Y.Q.; Wang, Z.Y.; Ye, X.Y. Spatiotemporal dynamics of carbon intensity from energy consumption in China. J. Geogr. Sci. 2014, 24, 631–650. [Google Scholar] [CrossRef] [Green Version]
- Liu, C.J.; Hu, W. Does foreign direct investment increase China’s carbon productivity? Empirical analysis based on the spatial panel Durbin model. World Econ. Stud. 2016, 1, 99–109. [Google Scholar]
- Yang, J.; Liu, H.J. Regional difference decomposition and influence factors of China’s carbon dioxide emissions. J. Quant. Tech. Econ. 2012, 5, 36–49. (In Chinese) [Google Scholar]
- Wang, F.; Wu, L.H.; Yang, C. Driving factors for growth of carbon dioxide emissions during economic development in China. Econ. Res. J. 2010, 2, 123–136. (In Chinese) [Google Scholar]
- Wang, M.; Feng, C. Decomposition of energy-related CO2 emissions in China: An empirical analysis based on provincial panel data of three sectors. Appl. Energy 2017, 190, 772–787. [Google Scholar] [CrossRef]
- Jiang, J.H. An evaluation and decomposition analysis of carbon emissions in China. Resour. Sci. 2011, 33, 597–604. (In Chinese) [Google Scholar]
- Zha, D.; Zhou, D.; Zhou, P. Driving forces of residential CO2 emissions in urban and rural China: An index decomposition analysis. Energy Policy 2010, 38, 3377–3383. [Google Scholar]
- Li, G.Z.; Li, Z.Z. Regional difference and influence factors of China’s carbon dioxide emissions. China Popul. Resour. Environ. 2010, 20, 22–27. (In Chinese) [Google Scholar]
- Xiao, M.Y.; Fang, Y.L. The impact of FDI on carbon emissions in the eastern region of China: An empirical analysis based on STIRPAT model. J. Cent. Univ. Financ. Econ. 2013, 7, 59–64. (In Chinese) [Google Scholar]
- Zhang, L.Q.; Li, R.F.; Chen, S.P.; Zu, Y.W.; Xu, X.W. Trend prediction and analysis of driving factors of carbon emissions from energy consumption during the period of 1995–2009 in Anhui province based on the STIRPAT model. Resour. Sci. 2012, 34, 316–327. (In Chinese) [Google Scholar]
- Wang, Y.; Yang, G.; Dong, Y.; Cheng, Y.; Shang, P.P. The scale, structure and influencing factors of total carbon emissions from households in 30 provinces of China: Based on the extended STIRPAT model. Energy 2018, 11, 1125. [Google Scholar] [CrossRef] [Green Version]
- Zhang, Y.; Zhang, L.Q.; Bao, T.T. Research on the influential factors of carbon emissions in the process of urbanization in Anhui province-based on STIRPAT model. Resour. Environ. Yangtze Basin 2014, 23, 512–517. (In Chinese) [Google Scholar]
- Zhou, X.; Zhang, M.; Zhou, M. A comparative study on decoupling relationship and influence factors between China’s regional economic development and industrial energy–related carbon emissions. J. Clean. Prod. 2017, 142, 783–800. [Google Scholar] [CrossRef]
- Jiang, J.; Ye, B.; Xie, D.; Tang, J. Provincial-level carbon emission drivers and emission reduction strategies in China: Combining multi-layer LMDI decomposition with hierarchical clustering. J. Clean. Prod. 2017, 169, 178–190. [Google Scholar] [CrossRef]
- Shen, L.; Wu, Y.; Lou, Y.; Zeng, D.; Shuai, C.; Song, X. What drives the carbon emission in the Chinese cities?—A case of pilot low carbon city of Beijing. J. Clean. Prod. 2018, 174, 343–354. [Google Scholar] [CrossRef]
- Liu, Z.X. Research on the relationship between energy consumption, economic growth and carbon emission in China. Coal Econ. Res. 2011, 4, 37–43. (In Chinese) [Google Scholar]
- Geng, Y.H.; Tian, M.Z.; Zhu, Q.; Zhang, J.J.; Peng, C.H. Quantification of provincial-level carbon emissions from energy consumption in China. Renew. Sustain. Energy Rev. 2011, 15, 3658–3668. [Google Scholar] [CrossRef]
- Ren, S.; Fu, X.; Chen, X.H. Regional variation of energy-related industrial CO2 emissions mitigation in China. China Econ. Rev. 2012, 4, 1134–1145. [Google Scholar] [CrossRef]
- Liu, Z.; Geng, Y.; Lindner, S.; Guan, D. Uncovering China’s greenhouse gas emission from regional and sectoral perspectives. Energy 2012, 45, 1059–1068. [Google Scholar] [CrossRef] [Green Version]
- Zhou, X.; Zhou, M.; Zhang, M. Contrastive analyses of the influence factors of interprovincial carbon emission induced by industry energy in China. Nat. Hazards 2016, 81, 1405–1433. [Google Scholar] [CrossRef]
- Zhang, X.F.; Han, X.; Zhang, Q.C. Regional difference and influence factors of carbon emissions: Empirical analysis based on partial least squares method. J. Ind. Technol. Econ. 2013, 7, 100–109. (In Chinese) [Google Scholar]
- Liu, Y.; Chen, Z.M.; Xiao, H.; Yang, W.; Liu, D.H.; Chen, B. Driving factors of carbon dioxide emissions in China: An empirical study using 2006–2010 provincial data. Front. Earth Sci. 2017, 11, 156–161. [Google Scholar] [CrossRef]
- Wang, H.; Chen, C.C.; Pan, T.; Liu, C.L.; Chen, L.; Sun, L. County scale characteristics of CO2 Emission’s spatial-temporal evolution in the Beijing-Tianjin-Hebei Metropolitan region. Environ. Sci. 2014, 35, 385–393. (In Chinese) [Google Scholar]
- Chen, Z.M.; Wu, S.M.; Ma, W.B. Driving forces of carbon dioxide emission for China’s cities: Empirical analysis based on extended STIRPAT Model. China Popul. Resour. Environ. 2018, 28, 45–54. (In Chinese) [Google Scholar]
- Sun, Y.H.; Zhong, W.Z.; Qing, D.R. Analysis on differences of carbon emission intensity of each province in China based on Theil index. Financ. Trade Res. 2012, 3, 1–7. (In Chinese) [Google Scholar]
- Deng, J.X.; Liu, X.; Wang, Z. Characteristics analysis and factor decomposition based on the regional difference changes in China’s CO2 emission. J. Nat. Resour. 2014, 29, 189–200. (In Chinese) [Google Scholar]
- Liu, H.G.; Fan, X.M. CO2 emissions transfer embedded in inter-regional trade in China. Acta Ecol. Sin. 2014, 343, 3016–3024. (In Chinese) [Google Scholar]
- Kang, Y.Q.; Zhao, T.; Yang, Y.Y. Environmental Kuznets curve for CO2 emissions in China: A spatial panel data approach. Ecol. Indic. 2016, 63, 231–239. [Google Scholar] [CrossRef]
- O’Mahony, T. Decomposition of Ireland´s carbon emissions from 1990 to 2010: An extended Kaya identity. Energy Policy 2013, 59, 573–581. [Google Scholar]
- Sun, W.; He, Y.; Chang, H. Regional characteristics of CO2 emissions from China’s power generation: Affinity propagation and refined Laspeyres decomposition. Int. J. Glob. Warm. 2017, 11, 38–66. [Google Scholar] [CrossRef]
- Mi, Z.; Zhang, Y.; Guan, D.; Shan, Y.; Liu, Z.; Cong, R.; Yuan, X.C.; Wei, Y.M. Consumption-based emission accounting for Chinese cities. Appl. Energy 2016, 184, 1073–1081. [Google Scholar] [CrossRef] [Green Version]
- Goh, T.; Ang, B.W. Tracking economy-wide energy efficiency using LMDI: Approach and practices. Energy Effic. 2019, 12, 829–847. [Google Scholar] [CrossRef]
- Wang, H.; Ang, B.W.; Su, B. Assessing drivers of economy-wide energy use and emissions: IDA versus SDA. Energy Policy 2017, 107, 585–599. [Google Scholar] [CrossRef]
- Wang, Q.; Wang, Y.; Zhou, P.; Wei, H. Whole process decomposition of energy related SO2 in Jiangsu Province, China. Appl. Energy 2017, 194, 679–687. [Google Scholar] [CrossRef]
- Wang, Z.; Yang, L. Delinking indicators on regional industry development and carbon emissions: Beijing-Tianjin-Hebei economic band case. Ecol. Indic. 2015, 48, 41–48. [Google Scholar] [CrossRef]
- Wang, S.; Fang, C.; Guan, X.; Pang, B.; Ma, H. Urbanization, energy consumption, and carbon dioxide emissions in China: A panel data analysis of China’s provinces. Appl. Energy 2014, 136, 738–749. [Google Scholar] [CrossRef]
- Wang, H.; Zhou, P. Assessing global CO2 emission inequality from consumption perspective: An index decomposition analysis. Ecol. Econ. 2018, 154, 257–271. [Google Scholar] [CrossRef]
- Ramakrishnan, R. A multi-factor efficiency perspective to the relationships among world GDP, energy consumption and carbon sioxide emissions. Technol. Forecast. Soc. Chang. 2006, 73, 483–494. [Google Scholar]
- Wold, H. Soft modeling by latent variables: The non-linear iterative partial least squares (NIPALS) approach. J. Appl. Probab. 1975, 12, 117–142. [Google Scholar] [CrossRef]
- Chong, I.G.; Jun, C.H. Performance of some variable selection methods when multicollinearity is present. Chemom. Intell. Lab. Syst. 2005, 78, 103–112. [Google Scholar] [CrossRef]
- Development Research Center of the State Council. Regional Policy and Coordinated Development 1995; Development Research Center of China State Council: Beijing, China, 1995. (In Chinese)
- IPCC. Intergovernmental Panel on Climate Change Guidelines for National Greenhouse Gas Inventories: Volume 2 Energy. Available online: http://www.ipcc-nggip.iges.or.jp/public/2006gl/vol2.html (accessed on 12 July 2018).
- National Bureau of Statistics of China (NBSC). Chinese Energy Statistics Yearbook; NBSC, Beijing, China Statistics, 2006–2018; NBSC: Beijing, China, 2006–2018. (In Chinese)
- National Bureau of Statistics of China (NBSC). Chinese Statistics Yearbook; NBSC, Beijing, China Statistics, 2006–2018; NBSC: Beijing, China, 2006–2018. (In Chinese)
- Guan, D.; Meng, J.; Reiner, D.M.; Zhang, N.; Shan, Y.L.; Mi, Z.F.; Shao, S.; Liu, Z. Structural decline in China’s CO2 emissions through transitions in industry and energy systems. Nat. Geosci. 2018, 11, 551–555. [Google Scholar] [CrossRef]
- Zhang, H.G.; Wang, C.J.; Wang, F. Examining the driving factors of energy related carbon emissions using the extended STIRPAT model based on IPAT identity in Xinjiang. Renew. Sustain. Energy Rev. 2017, 67, 51–61. [Google Scholar]
- Peng, J.M.; Wu, R.H. Decomposition of Pearl River Delta’s carbon emissions based on LMDI method. China Popul. Resour. Environ. 2012, 22, 69–74. (In Chinese) [Google Scholar]
- Chen, W.H.; Lei, Y.L. Analysis of the impact path on factors of China’s energy-related CO2 emissions: a path analysis with latent variables. Environ. Sci. Pollut. Res. 2017, 24, 5757–5772. [Google Scholar] [CrossRef]
- Wu, H.; Gu, S.Z.; Guan, X.L. Analysis on relationship between carbon emissions from fossil energy consumption and economic growth in China. J. Nat. Resour. 2013, 28, 381–390. (In Chinese) [Google Scholar]
- Liu, X.Z.; Gao, C.C.; Zhang, Y. Spatial dependence pattern of carbon emission intensity in China’s provinces and spatial heterogeneity of its influencing factors. Sci. Geogr. Sin. 2018, 38, 681–690. (In Chinese) [Google Scholar]


| Economic Regions | Acronyms for Regions | Provinces Included in the Region | Regional Characteristics |
|---|---|---|---|
| Northeast economic region | NEER | Heilongjiang, Liaoning, Jilin | Natural conditions and resource endowment are similar. At present, there are many common problems, such as resource exhaustion, industrial structure upgrading and so on. |
| Northern coastal economic region | NCER | Beijing, Tianjin, Hebei, Shandong | With superior geographical location, convenient transportation, advanced science, technology, education and culture, it has made remarkable achievements in opening up. |
| Eastern coastal economic region | ECER | Shanghai, Jiangsu, Zhejiang | Modernization started early, with close economic ties with foreign countries in history. It has taken the lead in many areas of reform and opening up. It has rich human capital and obvious development advantages. |
| Southern coastal economic region | SCER | Fujian, Guangdong, Hainan | Facing Hong Kong, Macao and Taiwan, overseas social resources are rich and the degree of opening up is high. |
| Economic region in the middle reaches of the Yellow River | ERMRYR | Shaanxi, Shanxi, Henan, Inner Mongolia | Natural resources, especially coal and natural gas resources, are rich. It has an important strategic position, lack of opening-up, and arduous task of structural adjustment. |
| Economic region in the middle reaches of the Yangtze River | ERMRYTR | Hubei, Hunan, Jiangxi, Anhui | The agricultural production conditions are good, the population is dense, the degree of opening to the external world is low, and the pressure of industrial transformation is great. |
| Southwest economic region | SWER | Yunnan, Guizhou, Sichuan, Chongqing, Guangxi | It is located in a remote area with poor land and a large number of poor people. It has good conditions for opening up to South Asia. |
| Northwest economic region | NWER | Gansu, Qinghai, Ningxia, Xinjiang, Tibet | The natural conditions are bad, the land is vast, and the population is sparse, the market is narrow and small, and there are certain conditions for opening to the surrounding areas. |
| Year | NEER | NCER | ECER | SCER | ERMRYR | ERMRYTR | SWER | NWER | ||
|---|---|---|---|---|---|---|---|---|---|---|
| 2005 | 0.42 | 9.33 | 18.79 | 19.04 | 36.76 | 0.39 | 5.98 | 9.29 | 72.55 | 27.45 |
| 0.26 | 63.89 | 12.21 | 4.18 | 19.83 | 0.07 | 3.56 | 1.29 | |||
| 2006 | 2.36 | 4.92 | 18.62 | 19.00 | 37.54 | 1.13 | 6.63 | 9.80 | 74.60 | 25.40 |
| 9.11 | 57.90 | 12.10 | 4.56 | 22.97 | 0.33 | 4.26 | 1.54 | |||
| 2007 | 2.56 | 4.92 | 19.07 | 19.03 | 37.96 | 0.21 | 6.11 | 10.14 | 74.47 | 25.53 |
| 0.93 | 58.23 | 7.57 | 4.57 | 23.21 | 0.11 | 3.80 | 1.57 | |||
| 2008 | 0.79 | 5.00 | 18.46 | 17.94 | 39.86 | 1.16 | 5.49 | 11.30 | 74.20 | 25.80 |
| 0.34 | 57.64 | 7.07 | 4.18 | 25.67 | 0.26 | 3.00 | 1.83 | |||
| 2009 | 0.45 | 3.53 | 18.69 | 17.58 | 39.85 | 1.21 | 6.92 | 11.76 | 74.84 | 25.16 |
| 0.24 | 55.57 | 7.23 | 4.42 | 26.55 | 0.24 | 4.01 | 1.96 | |||
| 2010 | 1.64 | 3.68 | 18.45 | 18.39 | 39.27 | 0.68 | 4.45 | 13.45 | 74.34 | 25.66 |
| 0.61 | 57.4 | 7.09 | 4.27 | 25.41 | 0.10 | 2.86 | 2.26 | |||
| 2011 | 1.48 | 0.80 | 17.17 | 17.00 | 41.24 | 1.23 | 4.04 | 17.05 | 75.24 | 24.76 |
| 0.58 | 53.96 | 6.75 | 4.21 | 29.47 | 0.27 | 1.27 | 3.51 | |||
| 2012 | 1.61 | 0.82 | 16.93 | 16.97 | 39.80 | 0.60 | 3.65 | 19.61 | 75.73 | 24.27 |
| 0.58 | 53.35 | 6.69 | 4.12 | 29.83 | 0.06 | 1.04 | 4.34 | |||
| 2013 | 1.17 | 0.51 | 15.94 | 16.82 | 38.08 | 2.00 | 1.72 | 23.75 | 73.85 | 26.15 |
| 0.38 | 57.86 | 5.86 | 3.72 | 28.84 | 0.42 | 0.67 | 5.25 | |||
| 2014 | 2.47 | 0.32 | 15.43 | 15.55 | 36.00 | 2.34 | 2.73 | 25.14 | 75.79 | 24.21 |
| 0.81 | 54.08 | 6.11 | 3.86 | 27.23 | 0.59 | 0.73 | 6.60 | |||
| 2015 | 2.88 | 1.26 | 14.59 | 15.41 | 33.76 | 1.85 | 4.06 | 25.78 | 76.58 | 23.42 |
| 0.95 | 54.00 | 6.09 | 3.89 | 26.58 | 0.50 | 0.48 | 7.51 | |||
| 2016 | 3.86 | 0.92 | 14.10 | 15.31 | 33.16 | 1.74 | 4.72 | 25.89 | 76.55 | 23.45 |
| 1.25 | 54.09 | 5.92 | 3.85 | 26.20 | 0.48 | 0.67 | 7.55 | |||
| 2017 | 3.28 | 1.70 | 14.81 | 13.92 | 34.27 | 3.07 | 4.89 | 24.06 | 77.20 | 22.80 |
| 1.24 | 76.04 | 6.41 | 4.50 | 32.61 | 0.96 | 1.17 | 8.25 |
| Explanatory Variable | lnP | lnA | (lnA)2 | lnT | lnE | lnS | lnU |
|---|---|---|---|---|---|---|---|
| VIF | 124.96 | 356.834 | 1643.34 | 26.30 | 6.11 | 74.86 | 1320.75 |
| Economic Region | Comp No. | R2X | R2X(cum) | R2Y | R2Y(cum) | Q2 | Q2(cum) | α |
|---|---|---|---|---|---|---|---|---|
| NEER | Comp 1 | 0.684 | 0.684 | 0.894 | 0.894 | 0.814 | 0.814 | 0.05 |
| Comp 2 | 0.171 | 0.855 | 0.047 | 0.941 | 0.131 | 0.839 | 0.05 | |
| NCER | Comp 1 | 0.969 | 0.969 | 0.840 | 0.840 | 0.781 | 0.781 | 0.05 |
| Comp 2 | 0.006 | 0.975 | 0.154 | 0.994 | 0.304 | 0.847 | 0.05 | |
| SCER | Comp 1 | 0.786 | 0.786 | 0.787 | 0.787 | 0.672 | 0.672 | 0.05 |
| Comp 2 | 0.144 | 0.930 | 0.100 | 0.887 | 0.177 | 0.730 | 0.05 | |
| Comp 3 | 0.063 | 0.994 | 0.096 | 0.983 | 0.839 | 0.956 | 0.05 | |
| ERMRYR | Comp 1 | 0.818 | 0.818 | 0.845 | 0.845 | 0.770 | 0.770 | 0.05 |
| Comp 2 | 0.123 | 0.941 | 0.069 | 0.914 | 0.209 | 0.818 | 0.05 | |
| ERMRYTR | Comp 1 | 0.830 | 0.830 | 0.877 | 0.877 | 0.831 | 0.831 | 0.05 |
| Comp 2 | 0.140 | 0.970 | 0.076 | 0.954 | 0.544 | 0.923 | 0.05 | |
| SWER | Comp 1 | 0.704 | 0.704 | 0.677 | 0.677 | 0.475 | 0.475 | 0.05 |
| Comp 2 | 0.207 | 0.911 | 0.174 | 0.852 | 0.364 | 0.666 | 0.05 | |
| Comp 3 | 0.069 | 0.981 | 0.091 | 0.943 | 0.554 | 0.851 | 0.05 | |
| NWER | Comp 1 | 0.657 | 0.657 | 0.921 | 0.921 | 0.896 | 0.896 | 0.05 |
| Comp 2 | 0.164 | 0.821 | 0.071 | 0.991 | 0.767 | 0.976 | 0.05 | |
| ECER | Comp 1 | 0.963 | 0.963 | 0.877 | 0.877 | 0.845 | 0.845 | 0.05 |
| Comp 2 | 0.029 | 0.992 | 0.099 | 0.976 | 0.680 | 0.950 | 0.05 |
| Economic Region | Explanatory Variable | ||||||
|---|---|---|---|---|---|---|---|
| lnP | lnA | (lnA)2 | lnT | lnU | lnS | lnE | |
| NEER | 0.257 | 0.410 | 0.369 | 1.317 | 0.583 | 0.022 | −0.112 |
| NCER | 0.809 | 0.762 | 0.008 | 0.791 | 0.456 | 0.751 | −0.437 |
| SCER | 0.607 | 0.392 | 0.263 | 0.447 | 0.382 | 0.272 | 0.212 |
| ERMRYR | 0.346 | 0.226 | 0.197 | −0.120 | 0.348 | 0.077 | −0.117 |
| ERMRYTR | 0.310 | 0.310 | 0.259 | −0.018 | 0.324 | 0.384 | 0.293 |
| SWER | 0.352 | 0.536 | 0.550 | 0.132 | 0.523 | 0.109 | 0.938 |
| NWER | 0.262 | 0.295 | 0.220 | 0.131 | 0.265 | 0.014 | −0.196 |
| ECER | 0.798 | 0.596 | 0.375 | 0.526 | −0.015 | 0.368 | 0.202 |
| Average value | 0.493(1) | 0.441(2) | 0.280(6) | 0.401*(3) | 0.363(4) | 0.250(7) | 0.310*(5) |
| Economic Region | Explanatory Variable | ||||||
|---|---|---|---|---|---|---|---|
| lnP | lnA | (lnA)2 | lnU | lnT | lnS | lnE | |
| NEER | 1.018(5) | 1.203(1) | 1.164(2) | 1.146(3) | 1.065(4) | 0.617(6) | 0.581(7) |
| NCER | 1.004(2) | 1.002(3) | 0.948(6) | 0.974(5) | 1.143(1) | 0.989(4) | 0.928(7) |
| SCER | 1.128(1) | 1.078(2) | 1.032(4) | 1.074(3) | 0.982(5) | 0.863(6) | 0.799(7) |
| ERMRYR | 1.056(3) | 1.085(2) | 1.009(4) | 1.133(1) | 0.962(5) | 0.836(6) | 0.760(7) |
| ERMRYTR | 1.001(3) | 1.078(1) | 0.989(5) | 1.072(2) | 0.992(4) | 0.947(7) | 0.953(6) |
| SWER | 1.309(1) | 1.044(2) | 0.878(6) | 1.007(3) | 0.816(7) | 0.890(5) | 0.993(4) |
| NWER | 1.229(3) | 1.253(1) | 1.181(4) | 1.230(2) | 0.539(6) | 0.815(5) | 0.241(7) |
| ECER | 1.142(1) | 0.984(3) | 0.956(6) | 1.020(2) | 0.968(5) | 0.903(7) | 0.969(4) |
| Average value | 1.111(1) | 1.091(2) | 1.020(4) | 1.082(3) | 0.936(5) | 0.855(6) | 0.803(7) |
© 2020 by the authors. Licensee MDPI, Basel, Switzerland. This article is an open access article distributed under the terms and conditions of the Creative Commons Attribution (CC BY) license (http://creativecommons.org/licenses/by/4.0/).
Share and Cite
Liu, X.; Yang, X.; Guo, R. Regional Differences in Fossil Energy-Related Carbon Emissions in China’s Eight Economic Regions: Based on the Theil Index and PLS-VIP Method. Sustainability 2020, 12, 2576. https://doi.org/10.3390/su12072576
Liu X, Yang X, Guo R. Regional Differences in Fossil Energy-Related Carbon Emissions in China’s Eight Economic Regions: Based on the Theil Index and PLS-VIP Method. Sustainability. 2020; 12(7):2576. https://doi.org/10.3390/su12072576
Chicago/Turabian StyleLiu, Xianzhao, Xu Yang, and Ruoxin Guo. 2020. "Regional Differences in Fossil Energy-Related Carbon Emissions in China’s Eight Economic Regions: Based on the Theil Index and PLS-VIP Method" Sustainability 12, no. 7: 2576. https://doi.org/10.3390/su12072576
APA StyleLiu, X., Yang, X., & Guo, R. (2020). Regional Differences in Fossil Energy-Related Carbon Emissions in China’s Eight Economic Regions: Based on the Theil Index and PLS-VIP Method. Sustainability, 12(7), 2576. https://doi.org/10.3390/su12072576