The Complex Pathway towards Farm-Level Sustainable Intensification: An Exploratory Network Analysis of Stakeholders’ Knowledge and Perception

Abstract
:1. Introduction
2. Materials and Methods
2.1. FCM Participatory Process
2.2. Group Mapping Exercise
2.3. Selection of Farm-Level SIA Indicators
- They were measurable at farm-/farm household-level;
- They were relevant to European agricultural production;
- They represent intensive and/or intensifying farms. The term intensifying refers to farms that may not be as intensive, but have a likelihood to intensify in order to contribute to food security, for example livestock or arable farms as opposed to wine-making or flower producing farms;
- They are identified in the literature as consistent and measurable across time;
- They equally represent the three main sustainability pillars (environmental, economic and social).
2.4. Exploratory Network Analysis
2.5. Map Aggregation
3. Results
3.1. Farmers’ Group FCM
3.2. Advisors’ Group FCM
3.3. Policy Makers’ Group FCM
3.4. Aggregate FCM
4. Discussion
4.1. Nodes of Group and Aggregate FCMs
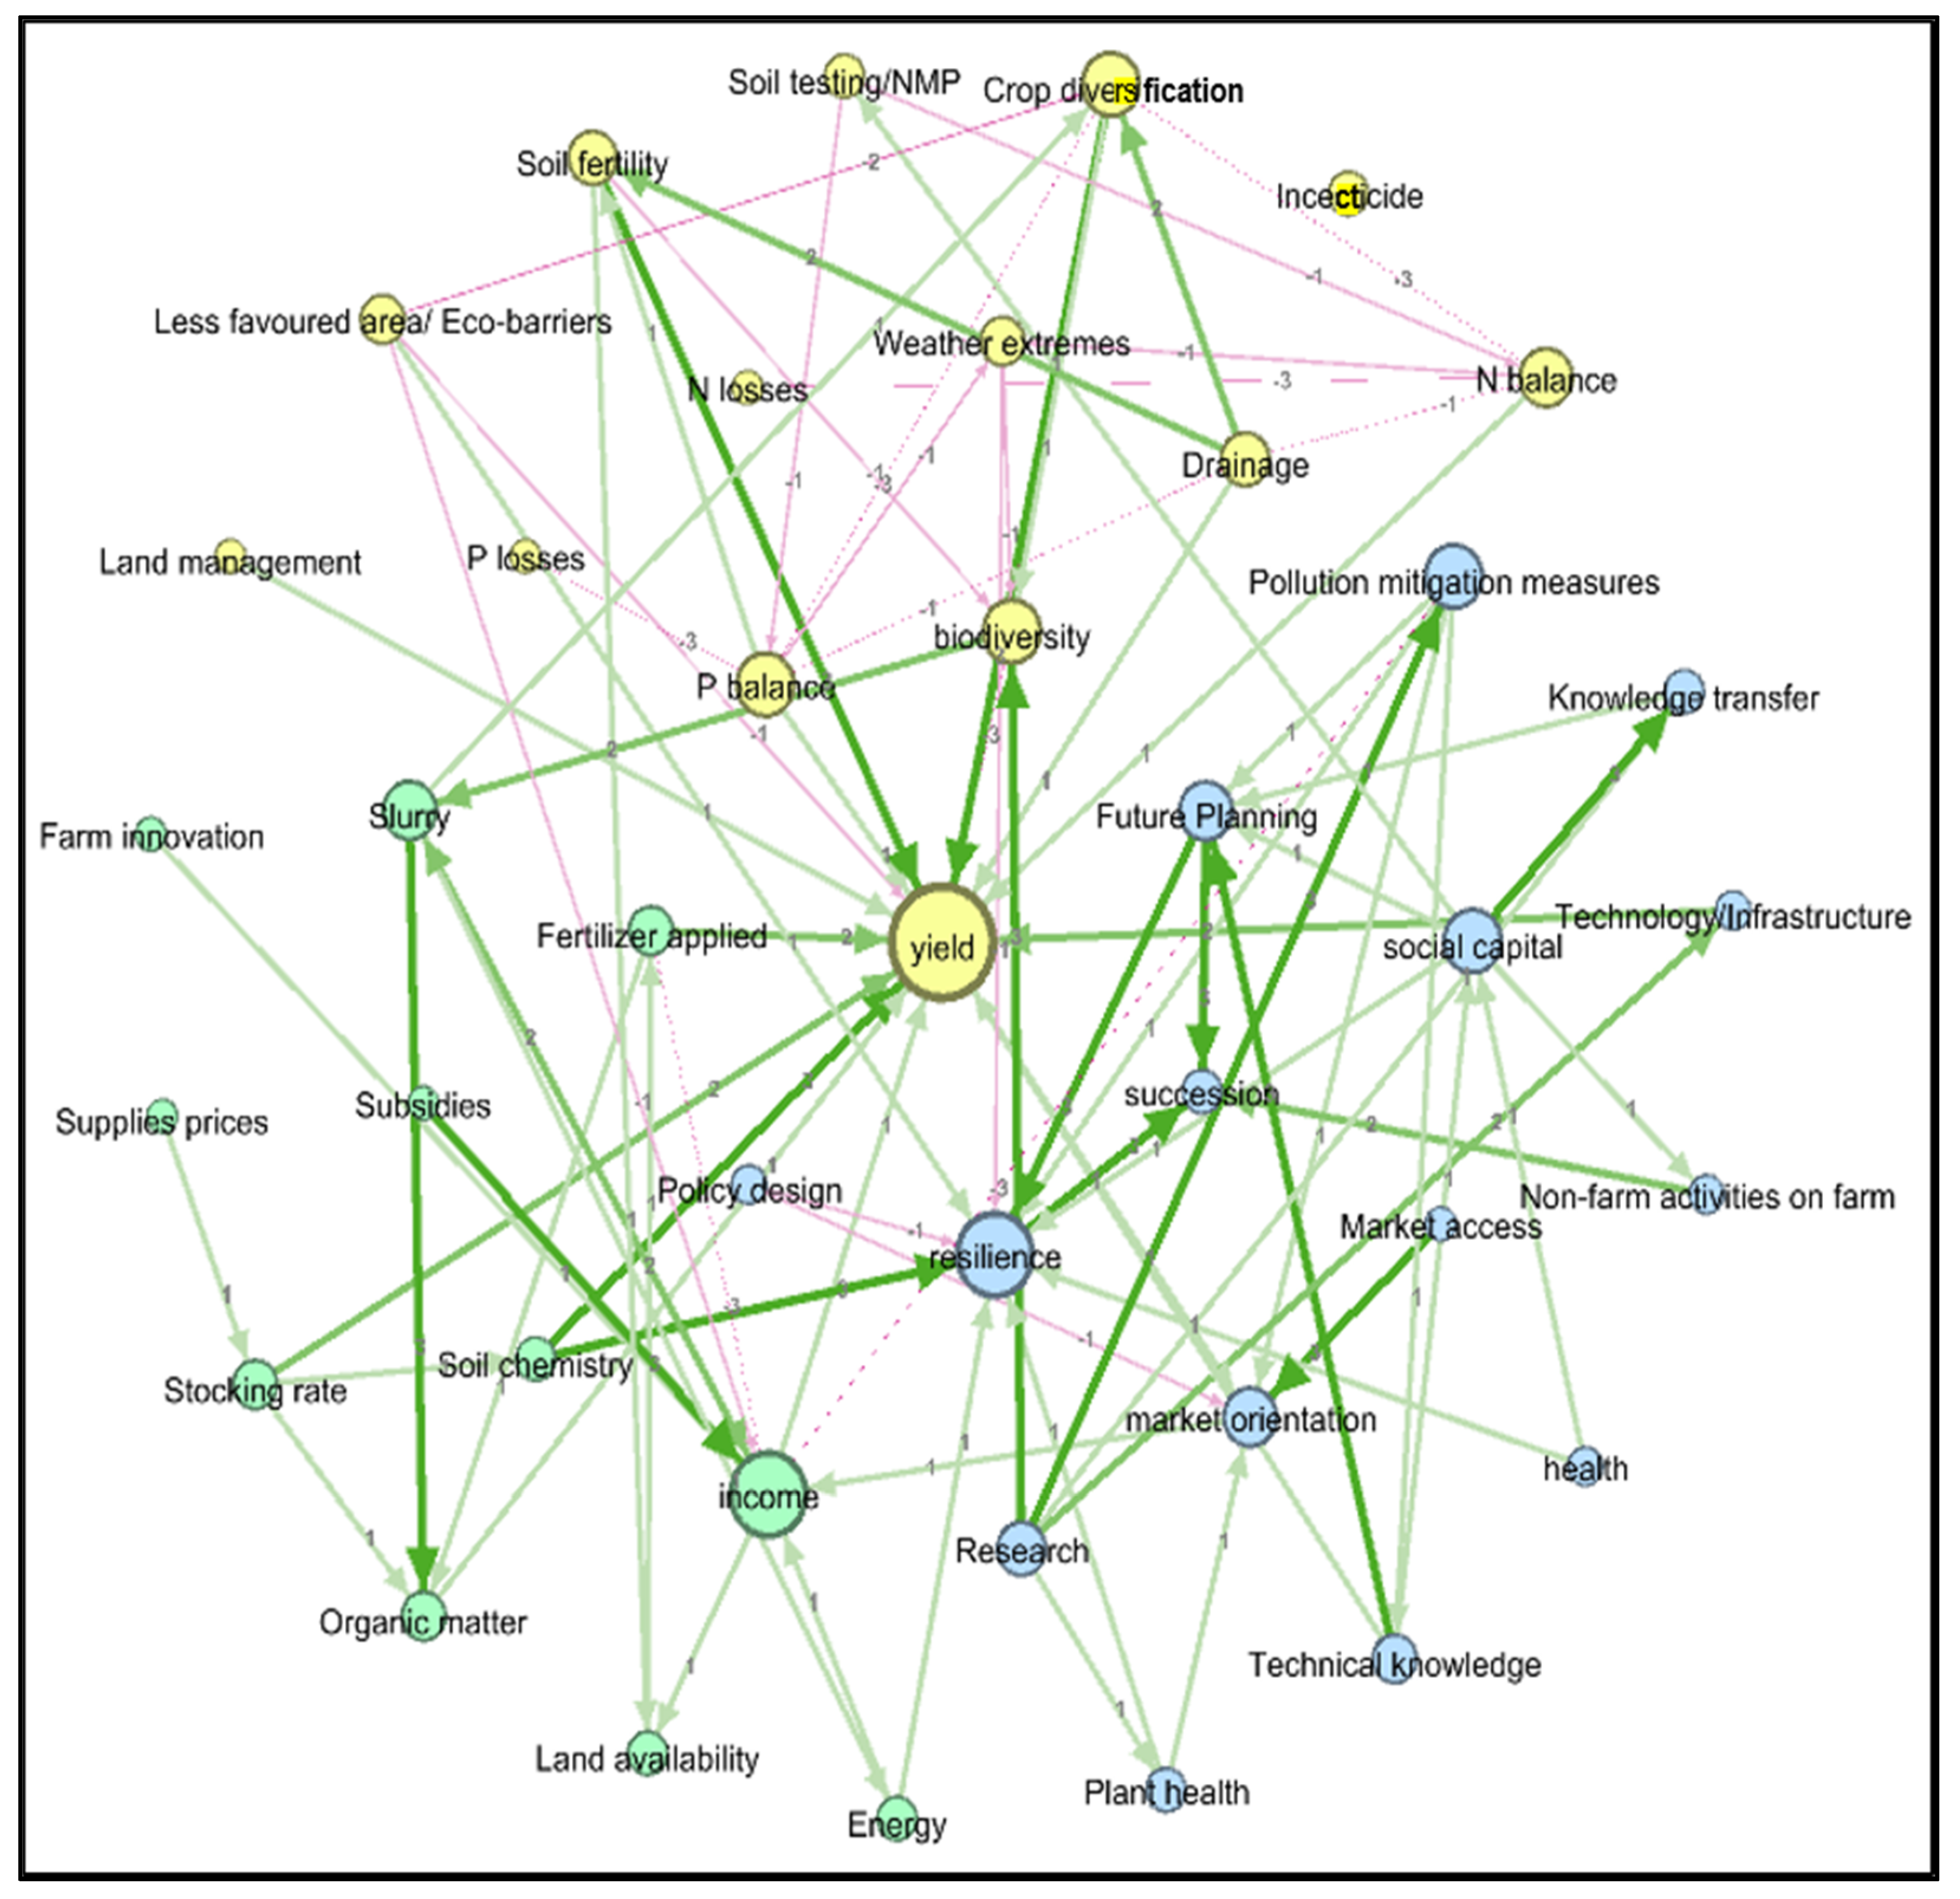
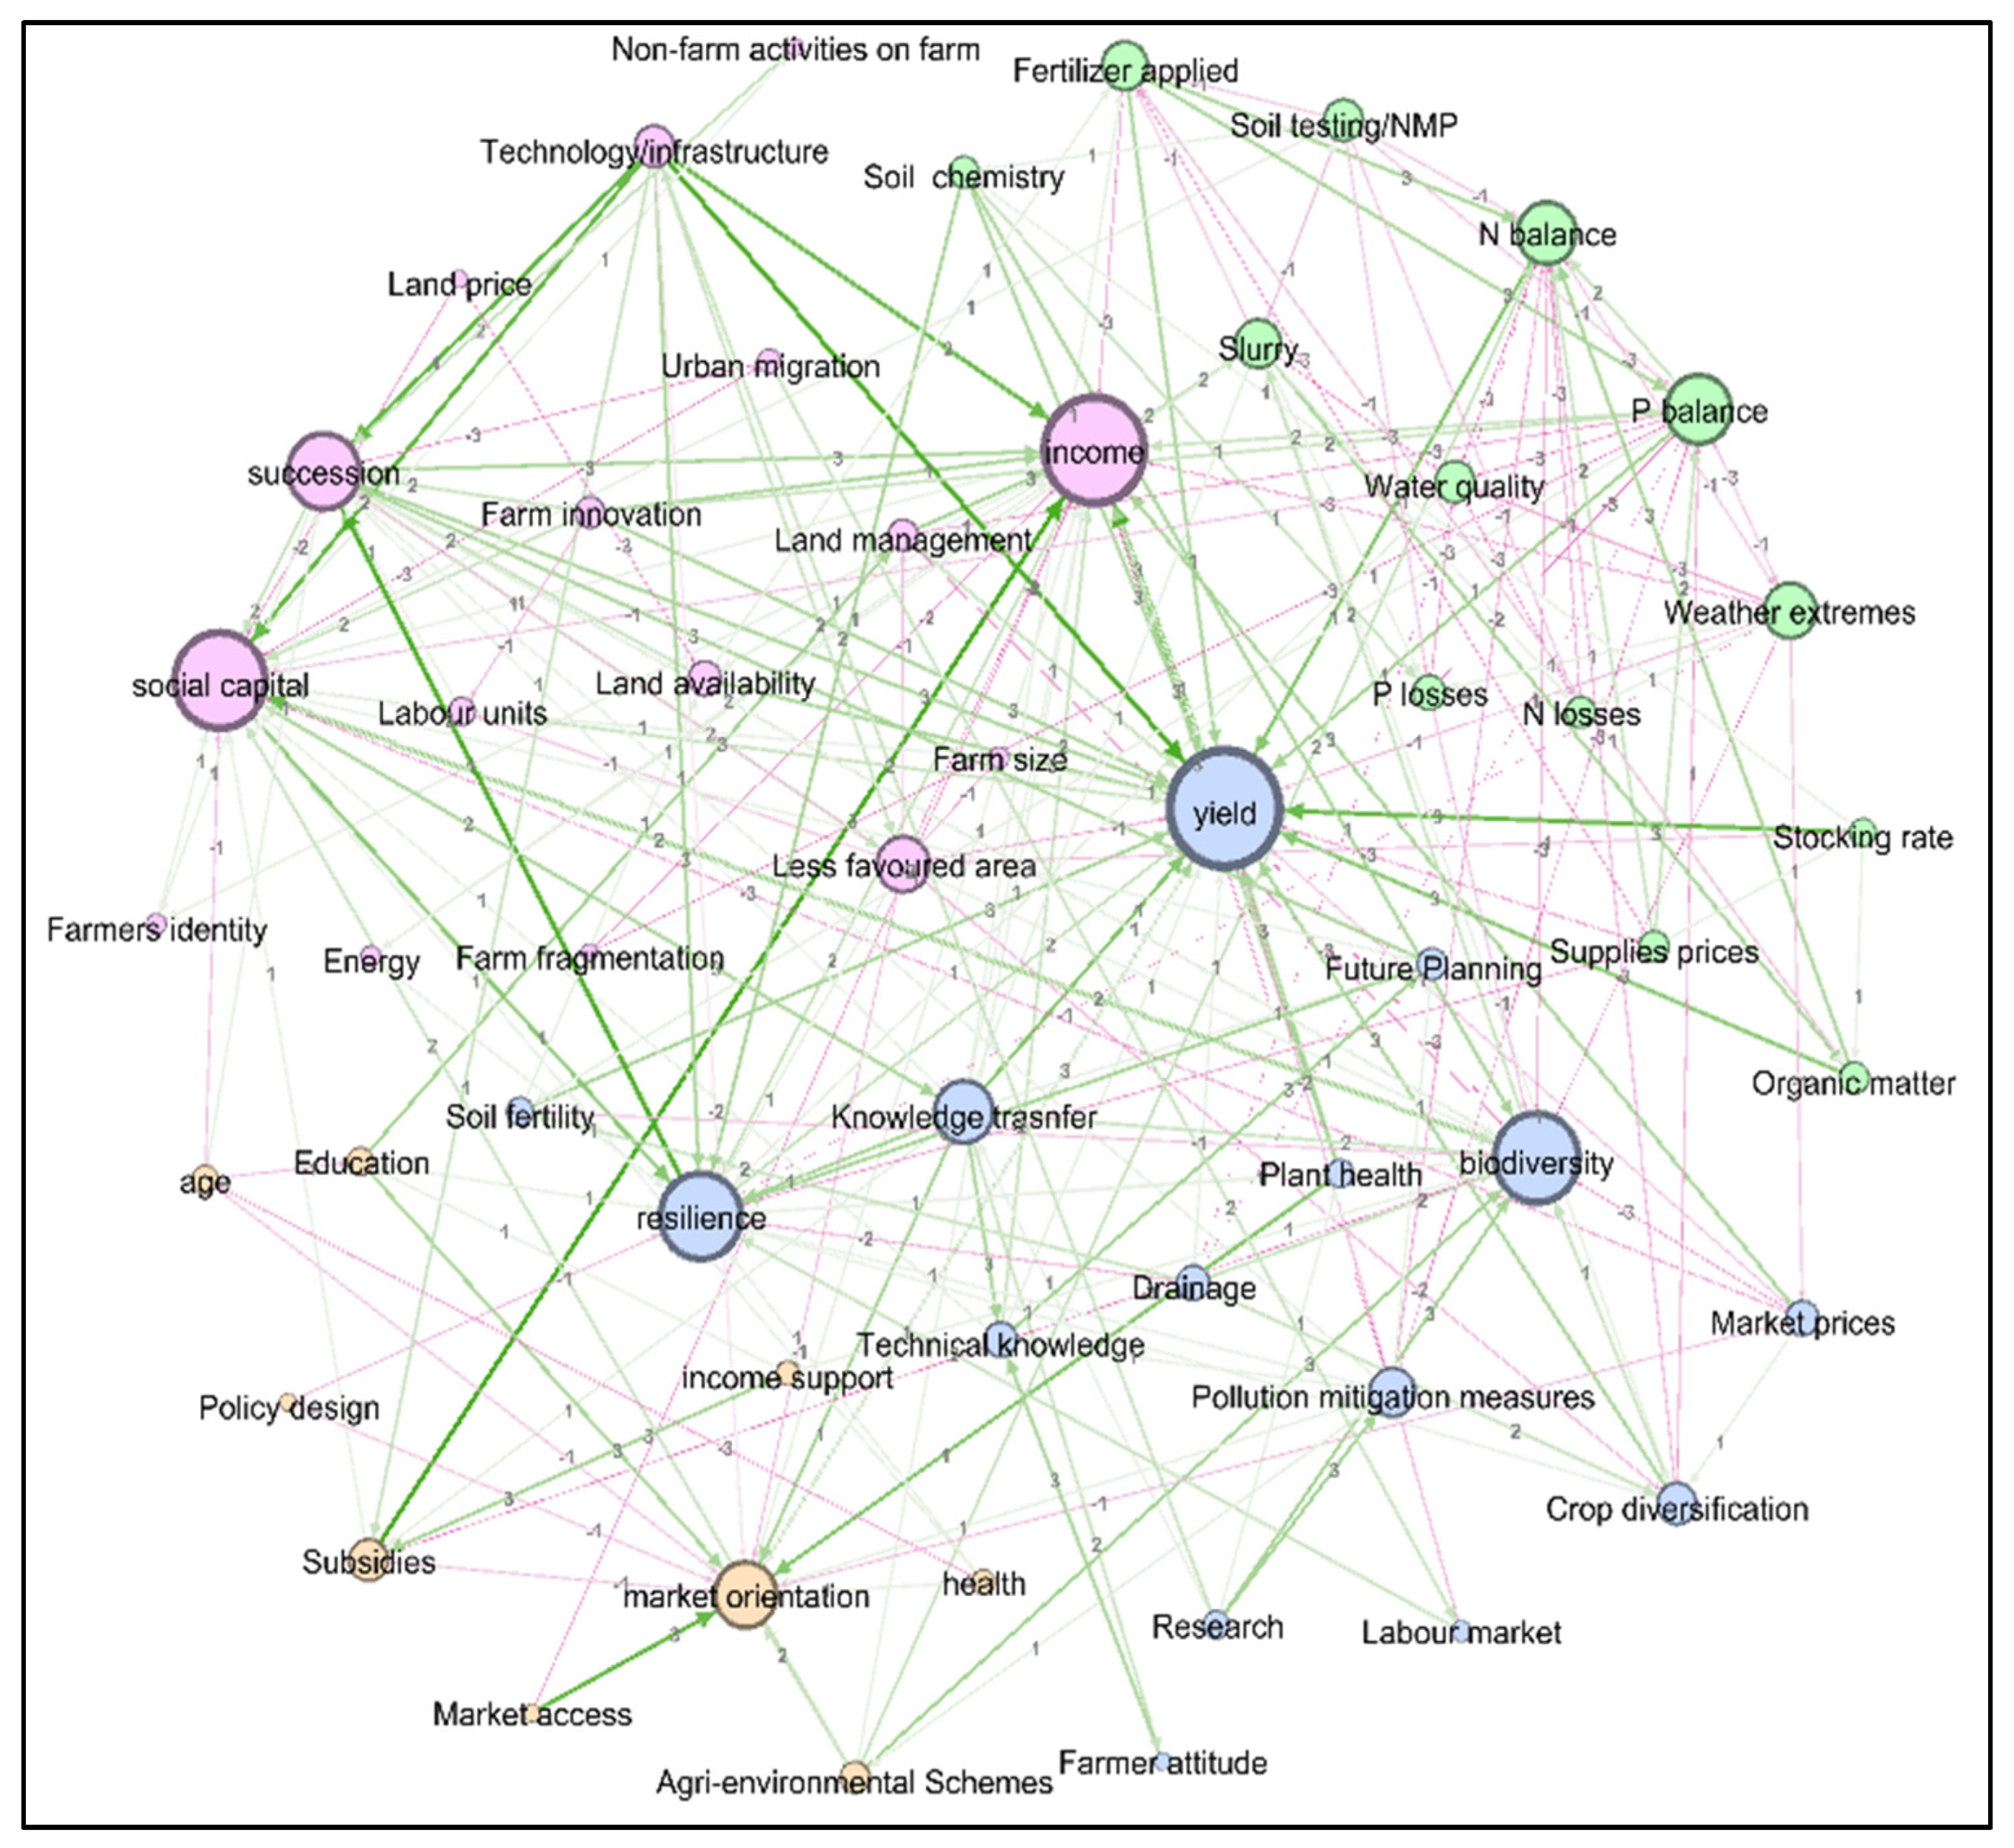
- “Yield” is the only predefined indicator that solely represents agricultural intensification. Increased yield generally results from intensification, with its primary purpose to increase farm output and farm income. Therefore, yield is considered more an outcome affected by management decisions rather than a contributor to the sustainable development of a farm system [53]. The FCMs produced during this study support this theory; in all FCMs, yield was a significant receiver and by far the most influenced component, but itself was a weak driver, affecting only the other two economic indicators (Figure 3, Figure 4, Figure 5 and Figure 6). This suggests that yield “stands above” the whole farm system, and can be considered a goal in its own right [54]. At the same time the high centrality of yield across all stakeholder groups indicates how important they all consider it for the farm (and SIA therein) and how it is interrelated to all components and elements in the SIA system.
- “Knowledge transfer” (KT) is a component common to all three stakeholder groups and one of the strongest influencers in the aggregate map. In the farmers’ map, KT directly affects all social indicators, two economic indicators and one environmental indicator (resilience, succession, social capital, yield, market orientation, biodiversity), while it indirectly links to income through yield (Figure 3). This link between KT and all three sustainability pillars (Table 1) is an acknowledgement of the perceived benefits of KT services by farmers. [55]. In the advisors’ map, KT is directly linked to the economic indicators and to subsidies. According to the advisors, this outcome reflects the view that advisors mainly act as administrators who deal with farm grant and subsidy applications and ensure the financial stability of farms [56]. However, with most farm subsidies promoting best-practice methods of production [57], it is not surprising that there is a strong indirect effect of KT on environmental indicators. For policy makers, KT did not feature as strongly in their FCM. The over-riding concern of policy makers is the development of policies and achieving stated objectives, thus they are not so concerned with the details of KT services and how those may influence farm management. As expected, in the aggregate map, knowledge transfer is a highly dominant component with a strong positive influence. This highlights the overall importance of KT for SIA at the farm level, which is confirmed in previous studies [33,56,58].
- “Water quality” is an ecosystem service that can be monitored and regulated at the farm level, primarily through the control of nutrient inputs [59]. Intensive agriculture is often thought to impose greater pressure on water quality [60]. However, less intensive production systems can pose a significant threat too, under certain biophysical and climate conditions [61]. Water quality is a dominant component of the advisors’ FCM, and although unique to this group, the weighted degree value of water quality is high enough to make it a dominant component in the aggregate map. Agricultural advisors play a key role in the dissemination and enforcement of regulations set out by the EU Water Framework Directive and thus recognise the importance of water quality in the SI of agricultural systems. Conversely, farmers do not consider water quality such an important aspect of SI, due possibly to the lack of a direct link between water quality and farm productivity [62].
- “Weather extremes” refer to uncontrollable weather events such as storms, flooding and drought, and are a common component of all the FCMs. Weather extremes are the main negative influencer in the aggregate map. According to the FCMs, weather extremes play an important role in the farm system, by influencing the decision-making process while being outside human control. An example of this is the requirement to import feed for livestock during periods of fodder shortage caused by storms or drought, which adds significantly to the annual feed bill. All stakeholder groups identified a negative influence of weather extremes on farm resilience (Figure 3, Figure 4, Figure 5 and Figure 6). The references to extreme weather in this study are likely to reflect the negative impact extreme weather events have on agricultural production [63,64]. Such extreme weather events are increasing in frequency due to climate change effects [65]. As weather extremes become more frequent [66], policies for SIA will need to include measures that increase resilience of farm systems to severe weather events, a fact that, as this study confirms, is recognized by all stakeholders.
- Improved “technology/infrastructure” has a positive influence on farm SIA according to the aggregate map and is strongly linked to all economic and social indicators. The link between technological and infrastructure development in rural areas, and the economic and social sustainability of farming enterprises is depicted in research [23,67,68]. Despite this, only the farmer group considered technology and infrastructure to be a dominant component that influences the farm system (Table 5). According to farmers, technology and infrastructure refers to various services in their locality, ranging from broadband access to health and financial services to rural life quality. The importance of technology and infrastructure perceived by farmers for farm SIA is supported by Buysse, Verspecht [69]. However, the influence of technology and infrastructure on SI appears to be underestimated by the other stakeholder groups. This contradiction was explained in further discussions with the facilitators: infrastructure is important to the farmers as individuals, but it is not always essential for a farm to survive. Therefore, although advisors and policy makers may recognize its importance to the farmers’ quality of life, they do not fully appreciate its importance for farm-level SIA.
4.2. Group Comparison
4.3. Method Evaluation
5. Conclusions
- (a)
- Stakeholders look at SIA only from their own perspective if there is no satisfactory interaction, resulting in a confusing system when their knowledge is combined. This calls for essential and meaningful knowledge exchange. The FCMs provide insight on which concepts and relationships are neglected in discussions, and identify what the sustainability debate should focus on to advance a common, broader and sustainable intensification goal.
- (b)
- Stakeholders’ knowledge and contributions to achieving SIA are fragmented. This creates the requirement for more integrated systems thinking approaches. Collective systems thinking would enable stakeholders to adjust their thinking to include nodes that, in principle, are not important to their group. The aggregation process allows perspective barriers to be overcome and creates common reference points. The central and important drivers and receivers are potential “starting points” for working towards bridging the gap between stakeholders’ views and guiding actions towards sustainable intensification.
- (c)
- The results of this study show the importance of involving the different stakeholders, bringing them together and creating the opportunity for open discussion and collective understanding. More importantly, the results indicate the need for in-depth incorporation of farmers’ understanding of farm-level SIA in discussions. This could help in bridging the gaps between policy design and implementation, and assist in achieving consensus between groups with conflicting interests on future approaches.
Author Contributions
Funding
Acknowledgments
Conflicts of Interest
References
- Alexandratos, N.; Bruinsma, J. World Agriculture towards 2030/2050: The 2012 Revision; ESA working paper No.12-03; FAO: Rome, Italy, 2012. [Google Scholar]
- Lambin, E.F.; Gibbs, H.K.; Ferreira, L.; Grau, R.; Mayaux, P.; Meyfroidt, P.; Morton, D.C.; Rudel, T.K.; Gasparri, I.; Munger, J. Estimating the world’s potentially available cropland using a bottom-up approach. Glob. Environ. Chang. 2013, 23, 892–901. [Google Scholar] [CrossRef]
- Henle, K.; Alard, D.; Clitherow, J.; Cobb, P.; Firbank, L.; Kull, T.; McCracken, D.; Moritz, R.F.A.; Niemelä, J.; Rebane, M.; et al. Identifying and managing the conflicts between agriculture and biodiversity conservation in Europe–A review. Agric. Ecosyst. Environ. 2008, 124, 60–71. [Google Scholar] [CrossRef]
- Steinmetz, Z.; Wollmann, C.; Schaefer, M.; Buchmann, C.; David, J.; Tröger, J.; Muñoz, K.; Frör, O.; Schaumann, G.E. Plastic mulching in agriculture. Trading short-term agronomic benefits for long-term soil degradation? Sci. Total Environ. 2016, 550, 690–705. [Google Scholar] [CrossRef] [PubMed]
- Chen, B.; Han, M.Y.; Peng, K.; Zhou, S.L.; Shao, L.; Wu, X.F.; Wei, W.D.; Liu, S.Y.; Li, Z.; Li, J.S.; et al. Global land-water nexus: Agricultural land and freshwater use embodied in worldwide supply chains. Sci. Total Environ. 2018, 613, 931–943. [Google Scholar] [CrossRef]
- Royal Society of London. Reaping the Benefits: Science and the Sustainable Intensification of Global Agriculture; Royal Society: London, UK, 2009; p. 72. [Google Scholar]
- Rigby, D.; Woodhouse, P.; Young, T.; Burton, M. Constructing a farm level indicator of sustainable agricultural practice. Ecol. Econ. 2001, 39, 463–478. [Google Scholar] [CrossRef]
- Sala, S.; Ciuffo, B.; Nijkamp, P. A systemic framework for sustainability assessment. Ecol. Econ. 2015, 119, 314–325. [Google Scholar] [CrossRef]
- European Commision. MAP—Monitoring Agri-Trade Policy; EEC: Brussels, Belgium, 2017. [Google Scholar]
- Serrano, A.; Guan, D.; Duarte, R.; Paavola, J. Virtual Water Flows in the EU27: A Consumption-based Approach. J. Ind. Ecol. 2016, 20, 547–558. [Google Scholar] [CrossRef] [Green Version]
- European Envormnental Agency. EU Animal Feed Imports and Land Dependency; EEC: Brussels, Belgium, 2017. [Google Scholar]
- Buckwell, A.; Uhre, A.N.A.; Williams, A.; Polakova, J.; BLum, W.E.H.; Schiefer, J.; Lair, G.K.; Heissenhuber, A.; Schiessl, P.; Cramer, C.; et al. Sustainable Intensification of European Agriculture; RISE Foundation: Brussels, Belgium, 2014. [Google Scholar]
- Schaller, L.; Targetti, S.; Villanueva, A.J.; Zasada, I.; Kantelhardt, J.; Arriaza, M.; Bal, T.; Fedrigotti, V.B.; Giray, F.H.; Häfner, K.; et al. Agricultural landscapes, ecosystem services and regional competitiveness—Assessing drivers and mechanisms in nine European case study areas. Land Use Policy 2018, 76, 735–745. [Google Scholar] [CrossRef]
- Areal, F.J.; Jones, P.J.; Mortimer, S.R.; Wilson, P. Measuring sustainable intensification: Combining composite indicators and efficiency analysis to account for positive externalities in cereal production. Land Use Policy 2018, 75, 314–326. [Google Scholar] [CrossRef] [Green Version]
- Dong, F.; Mitchell, P.D.; Colquhoun, J. Measuring farm sustainability using data envelope analysis with principal components: The case of Wisconsin cranberry. J. Environ. Manag. 2015, 147, 175–183. [Google Scholar] [CrossRef]
- Kelly, E.; Latruffe, L.; Desjeux, Y.; Ryan, M.; Uthes, S.; Diazabakana, A.; Dillon, E.; Finn, J. Sustainability indicators for improved assessment of the effects of agricultural policy across the EU: Is FADN the answer? Ecol. Indic. 2018, 89, 903–911. [Google Scholar] [CrossRef] [Green Version]
- De Oliveira Silva, R.; Barioni, L.G.; Hall, J.A.J.; Folegatti Matsuura, M.; Zanett Albertini, T.; Fernandes, F.A.; Moran, D. Increasing beef production could lower greenhouse gas emissions in Brazil if decoupled from deforestation. Nat. Clim. Chang. 2016, 6, 493. [Google Scholar] [CrossRef]
- Gadanakis, Y.; Bennett, R.; Park, J.; Areal, F.J. Evaluating the Sustainable Intensification of arable farms. J. Environ. Manag. 2015, 150, 288–298. [Google Scholar] [CrossRef] [PubMed] [Green Version]
- Barnes, A.P.; Thomson, S.G. Measuring progress towards sustainable intensification: How far can secondary data go? Ecol. Indic. 2014, 36, 213–220. [Google Scholar] [CrossRef]
- Lynch, J.; Skirvin, D.; Wilson, P.; Ramsden, S. Integrating the economic and environmental performance of agricultural systems: A demonstration using Farm Business Survey data and Farmscoper. Sci. Total Environ. 2018, 628, 938–946. [Google Scholar] [CrossRef] [PubMed]
- Micha, E.; Heanue, K.; Hyland, J.J.; Hennessy, T.; Dillon, E.J.; Buckley, C. Sustainability levels in Irish dairy farming: A farm typology according to sustainable performance indicators. Stud. Agric. Econ. 2017, 119, 62–69. [Google Scholar] [CrossRef] [Green Version]
- De Olde, E.M.; Sautier, M.; Whitehead, J. Comprehensiveness or implementation: Challenges in translating farm-level sustainability assessments into action for sustainable development. Ecol. Indic. 2018, 85, 1107–1112. [Google Scholar] [CrossRef]
- Micha, E.; Areal, F.J.; Tranter, R.B.; Bailey, A.P. Uptake of agri-environmental schemes in the Less-Favoured Areas of Greece: The role of corruption and farmers’ responses to the financial crisis. Land Use Policy 2015, 48, 144–157. [Google Scholar] [CrossRef]
- Daxini, A.; O’Donoghue, C.; Ryan, M.; Buckley, C.; Barnes, A.P.; Daly, K. Which factors influence farmers’ intentions to adopt nutrient management planning? J. Environ. Manag. 2018, 224, 350–360. [Google Scholar] [CrossRef]
- Areal, F.J.; Riesgo, L.; Gómez-Barbero, M.; Rodríguez-Cerezo, E. Consequences of a coexistence policy on the adoption of GMHT crops in the European Union. Food Policy 2012, 37, 401–411. [Google Scholar] [CrossRef]
- Liu, T.; Bruins, R.; Heberling, M. Factors Influencing Farmers’ Adoption of Best Management Practices: A Review and Synthesis. Sustainability 2018, 10, 432. [Google Scholar] [CrossRef] [PubMed] [Green Version]
- Blackstock, K.L.; Ingram, J.; Burton, R.; Brown, K.M.; Slee, B. Understanding and influencing behaviour change by farmers to improve water quality. Sci. Total Environ. 2010, 408, 5631–5638. [Google Scholar] [CrossRef] [PubMed]
- Burton, R.J.F. Reconceptualising the ‘behavioural approach’ in agricultural studies: A socio-psychological perspective. J. Rural Stud. 2004, 20, 359–371. [Google Scholar] [CrossRef]
- Rose, D.C.; Sutherland, W.J.; Barnes, A.P.; Borthwick, F.; Ffoulkes, C.; Hall, C.; Moorby, J.M.; Nicholas-Davies, P.; Twining, S.; Dicks, L.V. Integrated farm management for sustainable agriculture: Lessons for knowledge exchange and policy. Land Use Policy 2019, 81, 834–842. [Google Scholar] [CrossRef]
- Hoffman, M.; Lubell, M.; Hillis, V. Linking knowledge and action through mental models of sustainable agriculture. Proc. Natl. Acad. Sci. USA 2014, 111, 13016–13021. [Google Scholar] [CrossRef] [PubMed] [Green Version]
- Weltin, M.; Zasada, I.; Piorr, A.; Debolini, M.; Geniaux, G.; Moreno Perez, O.; Scherer, L.; Tudela Marco, L.; Schulp, C.J.E. Conceptualising fields of action for sustainable intensification—A systematic literature review and application to regional case studies. Agric. Ecosyst. Environ. 2018, 257, 68–80. [Google Scholar] [CrossRef]
- Levy, M.A.; Lubell, M.N.; McRoberts, N. The structure of mental models of sustainable agriculture. Nat. Sustain. 2018, 1, 413–420. [Google Scholar] [CrossRef]
- Micha, E.; Roberts, W.; Ryan, M.; O’Donoghue, C.; Daly, K. A participatory approach for comparing stakeholders’ evaluation of P loss mitigation options in a high ecological status river catchment. Environ. Sci. Policy 2018, 84, 41–51. [Google Scholar] [CrossRef]
- Kafetzis, A.; McRoberts, N.; Mouratiadou, I. Using Fuzzy Cognitive Maps to Support the Analysis of Stakeholders’ Views of Water Resource Use and Water Quality Policy. In Fuzzy Cognitive Maps: Advances in Theory, Methodologies, Tools and Applications, 1st ed.; Glykas, D.M., Ed.; Springer: Berlin/Heidelberg, Germany, 2010. [Google Scholar]
- Papageorgiou, E.; Kontogianni, A. Using Fuzzy Cognitive Mapping in Environmental Decision Making and Management: A Methodological Primer and an Application. Int. Perspect. Glob. Environ. Chang. 2012, 427–450. [Google Scholar] [CrossRef] [Green Version]
- Kosko, B. Fuzzy cognitive maps. Int. J. Man Mach. Stud. 1986, 24, 65–75. [Google Scholar] [CrossRef]
- Gray, S.A.; Zanre, E.; Gray, S.R.J. Fuzzy Cognitive Maps as Representations of Mental Models and Group Beliefs. In Fuzzy Cognitive Maps for Applied Sciences and Engineering: From Fundamentals to Extensions and Learning Algorithms; Papageorgiou, E.I., Ed.; Springer: Berlin/Heidelberg, Germany, 2014; pp. 29–48. [Google Scholar] [CrossRef]
- Fairweather, J. Farmer models of socio-ecologic systems: Application of causal mapping across multiple locations. Ecol. Model. 2010, 221, 555–562. [Google Scholar] [CrossRef]
- Kontogianni, A.D.; Papageorgiou, E.I.; Tourkolias, C. How do you perceive environmental change? Fuzzy Cognitive Mapping informing stakeholder analysis for environmental policy making and non-market valuation. Appl. Soft Comput. 2012, 12, 3725–3735. [Google Scholar] [CrossRef]
- Van Winsen, F.; de Mey, Y.; Lauwers, L.; Van Passel, S.; Vancauteren, M.; Wauters, E. Cognitive mapping: A method to elucidate and present farmers’ risk perception. Agric. Syst. 2013, 122, 42–52. [Google Scholar] [CrossRef]
- Vanwindekens, F.M.; Baret, P.V.; Stilmant, D. A new approach for comparing and categorizing farmers’ systems of practice based on cognitive mapping and graph theory indicators. Ecol. Model. 2014, 274, 1–11. [Google Scholar] [CrossRef]
- Henly-Shepard, S.; Gray, S.A.; Cox, L.J. The use of participatory modeling to promote social learning and facilitate community disaster planning. Environ. Sci. Policy 2015, 45, 109–122. [Google Scholar] [CrossRef]
- Christen, B.; Kjeldsen, C.; Dalgaard, T.; Martin-Ortega, J. Can fuzzy cognitive mapping help in agricultural policy design and communication? Land Use Policy 2015, 45, 64–75. [Google Scholar] [CrossRef] [Green Version]
- Fairweather, J.R.; Hunt, L.M. Can farmers map their farm system? Causal mapping and the sustainability of sheep/beef farms in New Zealand. Agric. Hum. Values 2011, 28, 55–66. [Google Scholar] [CrossRef]
- Mouratiadou, I.; Moran, D. Mapping public participation in the Water Framework Directive: A case study of the Pinios River Basin, Greece. Ecol. Econ. 2007, 62, 66–76. [Google Scholar] [CrossRef]
- Gray, S.A.; Gray, S.; De Kok, J.L.; Helfgott, A.E.R.; O’Dwyer, B.; Jordan, R.; Nyaki, A. Using fuzzy cognitive mapping as a participatory approach to analyze change, preferred states, and perceived resilience of social-ecological systems. Ecol. Soc. 2015, 20. [Google Scholar] [CrossRef]
- Lynch, J.; Donnellan, T.; Finn, J.A.; Dillon, E.; Ryan, M. Potential development of Irish agricultural sustainability indicators for current and future policy evaluation needs. J. Environ. Manag. 2019, 230, 434–445. [Google Scholar] [CrossRef]
- Smith, A.; Snapp, S.; Chikowo, R.; Thorne, P.; Bekunda, M.; Glover, J. Measuring sustainable intensification in smallholder agroecosystems: A review. Glob. Food Secur. 2017, 12, 127–138. [Google Scholar] [CrossRef] [Green Version]
- Latruffe, L.; Diazabakana, A.; Bockstaller, C.; Desjeux, Y.; Finn, J.; Kelly, E.; Ryan, M.; Uthes, S. Measurement of sustainability in agriculture: A review of indicators. Stud. Agric. Econ. 2016, 118, 123–130. [Google Scholar] [CrossRef]
- Özesmi, U.; Özesmi, S.L. Ecological models based on people’s knowledge: A multi-step fuzzy cognitive mapping approach. Ecol. Model. 2004, 176, 43–64. [Google Scholar] [CrossRef] [Green Version]
- Byung Sung, Y.; Jetter, A.J. Comparative analysis for Fuzzy Cognitive Mapping. In Proceedings of the 2016 Portland International Conference on Management of Engineering and Technology (PICMET), Honolulu, HI, USA, 4–8 September 2016; pp. 1897–1908. [Google Scholar]
- Gray, S.; Chan, A.; Clark, D.; Jordan, R. Modeling the integration of stakeholder knowledge in social–ecological decision-making: Benefits and limitations to knowledge diversity. Ecol. Model. 2012, 229, 88–96. [Google Scholar] [CrossRef]
- Vanlauwe, B.; Coyne, D.; Gockowski, J.; Hauser, S.; Huising, J.; Masso, C.; Nziguheba, G.; Schut, M.; Van Asten, P. Sustainable intensification and the African smallholder farmer. Curr. Opin. Environ. Sustain. 2014, 8, 15–22. [Google Scholar] [CrossRef]
- Firbank, L.G.; Attwood, S.; Eory, V.; Gadanakis, Y.; Lynch, J.M.; Sonnino, R.; Takahashi, T. Grand Challenges in Sustainable Intensification and Ecosystem Services. Front. Sustain. Food Syst. 2018, 2. [Google Scholar] [CrossRef] [Green Version]
- Prager, K.; Thomson, K. AKIS and Advisory Services in the Republic of Ireland Report for the AKIS Inventory (WP3) of the PRO AKIS Project; SAGE Publishing: Thousand Oaks, CA, USA, 2014; Available online: www.proakis.eu/publicationsandevents/pubs (accessed on 1 February 2020).
- Mahon, M.; Farrell, M.; McDonagh, J. Power, Positionality and the View from within: Agricultural Advisers’ Role in Implementing Participatory Extension Programmes in the Republic of Ireland. Sociol. Rural. 2010, 50, 104–120. [Google Scholar] [CrossRef]
- European Commision. The Common Agricultural Policy Explained; EEC: Brussels, Belgium, 2016. [Google Scholar]
- Toderi, M.; Powell, N.; Seddaiu, G.; Roggero, P.P.; Gibbon, D. Combining social learning with agro-ecological research practice for more effective management of nitrate pollution. Environ. Sci. Policy 2007, 10, 551–563. [Google Scholar] [CrossRef]
- Buckley, C.; Wall, D.P.; Moran, B.; O’Neill, S.; Murphy, P.N.C. Farm gate level nitrogen balance and use efficiency changes post implementation of the EU Nitrates Directive. Nutr. Cycl. Agroecosystems 2015, 104, 1–13. [Google Scholar] [CrossRef]
- White, B.; Moorkens, E.; Irvine, K.; Glasgow, G.; Chuanigh, E.N. Management strategies for the protection of high status water bodies under the Water Framework Directive. Biol. Environ. Proc. R. Ir. Acad. 2014, 114, 129–142. [Google Scholar] [CrossRef]
- Roberts, W.M.; Fealy, R.M.; Doody, D.G.; Jordan, P.; Daly, K. Estimating the effects of land use at different scales on high ecological status in Irish rivers. Sci. Total Environ. 2016, 572, 618–625. [Google Scholar] [CrossRef]
- Macgregor, C.J.; Warren, C.R. Adopting sustainable farm management practices within a Nitrate Vulnerable Zone in Scotland: The view from the farm. Agric. Ecosyst. Environ. 2006, 113, 108–119. [Google Scholar] [CrossRef]
- Sivakumar, M.V.K. Impacts of Natural Disasters in Agriculture, Rangeland and Forestry: An Overview. In Natural Disasters and Extreme Events in Agriculture: Impacts and Mitigation; Sivakumar, M.V.K., Motha, R.P., Das, H.P., Eds.; Springer: Berlin/Heidelberg, Germany, 2005; pp. 1–22. [Google Scholar] [CrossRef]
- Seitz, F.; Schmidt, M.; Shum, C.K. Signals of extreme weather conditions in Central Europe in GRACE 4-D hydrological mass variations. Earth Planet. Sci. Lett. 2008, 268, 165–170. [Google Scholar] [CrossRef]
- Coumou, D.; Rahmstorf, S. A decade of weather extremes. Nat. Clim. Chang. 2012, 2, 491. [Google Scholar] [CrossRef]
- Rahmstorf, S.; Coumou, D. Increase of extreme events in a warming world. Proc. Natl. Acad. Sci. USA 2011, 108, 17905–17909. [Google Scholar] [CrossRef] [Green Version]
- Carillo, F.; Carillo, M.R.; Venittelli, T.; Zazzaro, A. Aging and succession in Italian Farms. Int. Agric. Policy 2013, 1, 39–55. [Google Scholar]
- Van Vliet, J.; de Groot, H.L.F.; Rietveld, P.; Verburg, P.H. Manifestations and underlying drivers of agricultural land use change in Europe. Landsc. Urban Plan. 2015, 133, 24–36. [Google Scholar] [CrossRef]
- Buysse, J.; Verspecht, A.; Van Huylenbroeck, G. Assessing the impact of the EU Common Agricultural Policy pillar II support using micro-economic data. In Proceedings of the European Association of Agricultural Economists (EAAE). 122nd EAAE Seminar “Evidence-based Agricultural and Rural Policy Making: Methodological and Empirical Challenges of Policy Evaluation”, Ancona, Italy, 17–18 February 2011. [Google Scholar]
- Doody, D.G.; Augustenborg, C.A.; Withers, P.J.; Crosse, S. A systematic map protocol: What evidence exists to link agricultural practices with ecological impacts for Irish waterbodies? Environ. Evid. 2015, 4, 14. [Google Scholar] [CrossRef] [Green Version]
- Bjørkhaug, H.; Richards, C.A. Multifunctional agriculture in policy and practice? A comparative analysis of Norway and Australia. J. Rural Stud. 2008, 24, 98–111. [Google Scholar] [CrossRef]
- Petersen, B.; Snapp, S. What is sustainable intensification? Views from experts. Land Use Policy 2015, 46, 1–10. [Google Scholar] [CrossRef]
- Hyland, J.J.; Heanue, K.; McKillop, J.; Micha, E. Factors underlying farmers’ intentions to adopt best practices: The case of paddock based grazing systems. Agric. Syst. 2018, 162, 97–106. [Google Scholar] [CrossRef]
- Areal, F.J.; Riesgo, L. Farmers’ views on the future of olive farming in Andalusia, Spain. Land Use Policy 2014, 36, 543–553. [Google Scholar] [CrossRef]
- Zagata, L.; Sutherland, L.A. Deconstructing the ‘young farmer problem in Europe’: Towards a research agenda. J. Rural Stud. 2015, 38, 39–51. [Google Scholar] [CrossRef]
- Reed, M.S.; Kenter, J.; Bonn, A.; Broad, K.; Burt, T.P.; Fazey, I.R.; Fraser, E.D.G.; Hubacek, K.; Nainggolan, D.; Quinn, C.H.; et al. Participatory scenario development for environmental management: A methodological framework illustrated with experience from the UK uplands. J. Environ. Manag. 2013, 128, 345–362. [Google Scholar] [CrossRef] [PubMed] [Green Version]


| Pillar | Indicator | Metrics | Description |
|---|---|---|---|
| Economic | Yield | Kg/ha | Farm crops and/or animal products. |
| Farm income | € or €/ha | Farm household income coming from farm activities. | |
| Market orientation | % | The percentage of farm income that is coming from the market. | |
| Social | Resilience | Nominal | Probability of a farm household being resilient |
| Succession | Nominal | Probability of a farmer having identified a successor | |
| Social capital | Nominal | Probability of a farmer’s social well being | |
| Environmental | Nitrogen load | Kg/ha | Nitrogen inputs—N outputs |
| Phosphorus load | Kg/ha | Phosphorus inputs—Phosphorus outputs | |
| Biodiversity | % | The percentage of habitat/total farm area |
| Components’ Comparison | Numerical Expression | Definition | Characteristic of Component |
|---|---|---|---|
| Out-degree (OD) | The cumulative strength of connections with which a component influences other components | Driver | |
| Weighted out-degree (WOD) | The out-degree of a node pondered by the total weight of its outward edges | Influential/influencer | |
| In-degree (ID) | The cumulative strength of connections with which a component is influenced by other components | Receiver | |
| Weighted in-degree (WID) | The in-degree of a node pondered by the total weight of its inwards edges | Affected | |
| Degree of centrality (D) | The cumulative strength of connections a component has (in and out). | Central | |
| Weighted degree of centrality (WD) | The degree of centrality of a node pondered by the total weight of all its edges | Dominant |
| Metrics | Numerical Expression | Definition |
|---|---|---|
| Number of nodes | The number of components in the map | |
| Number of edges | The total number of linkages between components | |
| Density | = E/N (N − 1) | Indicates how densely nodes are connected. |
| Metric | Group | |||
|---|---|---|---|---|
| Farmers | Advisors | Policy | Aggregate map | |
| Number of nodes (N) | 30 | 35 | 39 | 53 |
| Number of edges | 84 | 96 | 85 | 233 |
| Density | 0.097 | 0.077 | 0.056 | 0.080 |
| Farmers’ Group | Advisors’ Group | Policy Group | Aggregate Map | |||||||||||||||||||||
|---|---|---|---|---|---|---|---|---|---|---|---|---|---|---|---|---|---|---|---|---|---|---|---|---|
| Components | ID | WID | OD | WOD | D | WD | ID | WID | OD | WOD | D | WD | ID | WID | OD | WOD | D | WD | ID | WID | OD | WOD | D | WD |
| Yield | 13 | 26 | 2 | 1 | 15 | 27 | 9 | 7 | 1 | 3 | 10 | 10 | 15 | 23 | 2 | −2 | 17 | 21 | 28 | 56 | 3 | 2 | 31 | 58 |
| Income | 16 | 16 | 0 | 0 | 16 | 16 | 3 | 7 | 3 | 4 | 6 | 11 | 8 | 1 | 3 | 4 | 11 | 5 | 22 | 24 | 6 | 8 | 28 | 32 |
| Market orientation | 5 | 10 | 1 | 3 | 6 | 13 | 8 | 0 | 0 | 0 | 8 | 0 | 5 | 5 | 1 | 1 | 6 | 6 | 14 | 15 | 2 | 4 | 16 | 19 |
| Resilience | 7 | 3 | 1 | 2 | 8 | 5 | 6 | 5 | 2 | 4 | 8 | 9 | 10 | 10 | 1 | 3 | 11 | 13 | 19 | 18 | 3 | 9 | 22 | 27 |
| Succession | 8 | 8 | 4 | 4 | 12 | 12 | 5 | 5 | 4 | 6 | 9 | 11 | 3 | 8 | 0 | 0 | 3 | 8 | 13 | 22 | 6 | 12 | 19 | 34 |
| Social capital | 7 | 9 | 2 | 6 | 9 | 15 | 7 | 4 | 0 | 0 | 7 | 4 | 2 | 2 | 5 | 7 | 7 | 9 | 17 | 14 | 8 | 11 | 25 | 25 |
| N balance | 6 | −1 | 2 | 0 | 8 | −1 | 3 | 7 | 1 | −3 | 4 | 4 | 4 | −10 | 2 | 0 | 6 | −10 | 11 | −4 | 4 | −3 | 15 | −7 |
| P balance | 7 | −10 | 3 | 6 | 10 | −4 | 2 | 4 | 1 | −3 | 3 | 1 | 4 | −10 | 3 | 1 | 7 | −9 | 11 | −16 | 6 | 4 | 17 | −12 |
| Biodiversity | 8 | 3 | 2 | 7 | 10 | 10 | 10 | −4 | 0 | 0 | 10 | −4 | 6 | −4 | 1 | 2 | 7 | −2 | 20 | −5 | 3 | 9 | 23 | 4 |
| Farmers’ identity | 2 | 2 | 1 | 1 | 3 | 3 | 2 | 2 | 1 | 1 | 3 | 3 | ||||||||||||
| Less favoured area | 0 | 0 | 1 | −3 | 1 | −3 | 2 | 4 | 8 | −6 | 10 | −2 | 0 | 0 | 4 | −3 | 4 | −3 | 2 | 4 | 11 | −12 | 13 | −8 |
| Subsidies | 4 | 7 | 5 | 3 | 9 | 10 | 0 | 0 | 1 | 3 | 1 | 3 | 4 | 7 | 5 | 6 | 9 | 13 | ||||||
| Technology/Infrastructure | 0 | 0 | 6 | 22 | 6 | 22 | 0 | 0 | 4 | 4 | 4 | 4 | 1 | 2 | 1 | 2 | 2 | 4 | 1 | 2 | 8 | 28 | 9 | 30 |
| Age | 0 | 0 | 5 | −5 | 5 | −5 | 0 | 0 | 5 | −5 | 5 | −5 | ||||||||||||
| Education | 2 | 0 | 3 | 7 | 5 | 7 | 2 | 0 | 3 | 7 | 5 | 7 | ||||||||||||
| Health | 1 | −3 | 1 | 1 | 2 | −2 | 0 | 0 | 2 | 2 | 2 | 2 | 1 | −3 | 3 | 3 | 4 | 0 | ||||||
| Income support | 1 | 3 | 3 | 5 | 4 | 8 | 1 | 3 | 3 | 5 | 4 | 8 | ||||||||||||
| Land management | 0 | 0 | 2 | 0 | 2 | 0 | 2 | 2 | 2 | −2 | 4 | 0 | 0 | 0 | 1 | 1 | 1 | 1 | 2 | 2 | 4 | −1 | 6 | 1 |
| Market prices | 0 | 0 | 3 | −3 | 3 | −3 | 1 | −1 | 3 | −1 | 4 | −2 | 6 | −4 | 7 | −5 | ||||||||
| Crop diversification | 1 | 1 | 4 | 4 | 5 | 5 | 3 | 1 | 4 | −2 | 7 | −1 | 4 | 2 | 5 | 2 | 9 | 4 | ||||||
| Weather extremes | 0 | 0 | 4 | −12 | 4 | −12 | 1 | −3 | 7 | −5 | 8 | −8 | 2 | −2 | 2 | −2 | 4 | −4 | 3 | −5 | 10 | −19 | 13 | −24 |
| P losses | 4 | 3 | 2 | −4 | 6 | −1 | 0 | 0 | 1 | −3 | 1 | −3 | 4 | 3 | 3 | −7 | 7 | −4 | ||||||
| N losses | 4 | −2 | 1 | −3 | 5 | −5 | 0 | 0 | 1 | −3 | 1 | −3 | 4 | −2 | 2 | −6 | 6 | −8 | ||||||
| Water quality | 6 | −16 | 3 | −3 | 9 | −19 | 6 | −16 | 3 | −3 | 9 | −19 | ||||||||||||
| Labour units | 3 | −1 | 2 | 2 | 5 | 1 | 3 | −1 | 2 | 2 | 5 | 1 | ||||||||||||
| Stocking rate | 1 | −1 | 1 | 3 | 2 | 2 | 1 | 1 | 3 | 4 | 4 | 5 | 2 | 0 | 3 | 7 | 5 | 7 | ||||||
| Farm size | 1 | −1 | 2 | 2 | 3 | 1 | 1 | −1 | 2 | 2 | 3 | 1 | ||||||||||||
| Fertilizer applied | 5 | −5 | 3 | 7 | 8 | 2 | 1 | 1 | 3 | 0 | 4 | 1 | 6 | −4 | 5 | 7 | 11 | 3 | ||||||
| Soil testing/NMP | 1 | 1 | 5 | −3 | 6 | −2 | 1 | 1 | 2 | −2 | 3 | −1 | 2 | 2 | 7 | −5 | 9 | −3 | ||||||
| Knowledge transfer | 0 | 0 | 8 | 17 | 8 | 17 | 0 | 0 | 7 | 7 | 7 | 7 | 2 | 4 | 1 | 1 | 3 | 5 | 2 | 4 | 13 | 25 | 15 | 29 |
| Slurry | 1 | −1 | 4 | −2 | 5 | −3 | 2 | 4 | 4 | 7 | 6 | 11 | 3 | 3 | 8 | 5 | 11 | 8 | ||||||
| Organic matter | 0 | 0 | 3 | 5 | 3 | 5 | 3 | 5 | 1 | 1 | 4 | 6 | 3 | 5 | 3 | 6 | 6 | 11 | ||||||
| Fertilizer price | 0 | 0 | 4 | −1 | 4 | −1 | 0 | 0 | 1 | −3 | 1 | −3 | 0 | 0 | 1 | 1 | 1 | 1 | 0 | 0 | 6 | −3 | 6 | −3 |
| Farm innovation | 0 | 0 | 5 | 11 | 5 | 11 | 0 | 0 | 1 | −1 | 1 | −1 | 0 | 0 | 1 | 1 | 1 | 1 | 0 | 0 | 6 | 11 | 6 | 11 |
| Energy | 1 | 1 | 2 | 2 | 3 | 3 | 1 | 1 | 2 | 2 | 3 | 3 | ||||||||||||
| Drainage | 0 | 0 | 4 | −4 | 4 | −4 | 0 | 0 | 5 | −1 | 5 | −1 | 0 | 0 | 7 | −5 | 7 | −5 | ||||||
| Non-farm activities on farm | 1 | 1 | 1 | 2 | 2 | 3 | 1 | 1 | 1 | 2 | 2 | 3 | ||||||||||||
| Policy design | 0 | 0 | 2 | −2 | 2 | −2 | 0 | 0 | 2 | −2 | 2 | −2 | ||||||||||||
| Market access | 0 | 0 | 2 | 0 | 2 | 0 | 0 | 0 | 1 | 3 | 1 | 3 | 0 | 0 | 2 | 3 | 2 | 3 | ||||||
| Future planning | 4 | 6 | 2 | 6 | 6 | 12 | 4 | 6 | 2 | 6 | 6 | 12 | ||||||||||||
| Research | 0 | 0 | 5 | 10 | 5 | 10 | 0 | 0 | 5 | 10 | 5 | 10 | ||||||||||||
| Regulations | 0 | 0 | 5 | −5 | 5 | −5 | 1 | 3 | 5 | −2 | 6 | 1 | 1 | 3 | 10 | −7 | 11 | −4 | ||||||
| Soil chemistry | 0 | 0 | 1 | 2 | 1 | 2 | 1 | 1 | 2 | 3 | 3 | 4 | 1 | 1 | 2 | 6 | 3 | 7 | 2 | 2 | 4 | 11 | 6 | 13 |
| Plant health | 0 | 0 | 3 | 9 | 3 | 9 | 1 | 1 | 2 | 2 | 3 | 3 | 1 | 1 | 4 | 11 | 5 | 12 | ||||||
| Farmer attitude | 1 | 2 | 1 | 3 | 2 | 5 | 1 | 2 | 1 | 3 | 2 | 5 | ||||||||||||
| Soil fertility | 2 | 3 | 3 | 3 | 5 | 6 | 2 | 3 | 3 | 3 | 5 | 6 | ||||||||||||
| Land availability | 1 | −3 | 3 | 6 | 4 | 3 | 1 | 2 | 1 | 1 | 2 | 3 | 3 | −1 | 4 | 7 | 7 | 6 | ||||||
| Urban migration | 1 | −3 | 3 | −4 | 4 | −7 | 1 | −3 | 3 | −4 | 4 | −7 | ||||||||||||
| Labour market | 1 | 2 | 2 | 0 | 3 | 2 | 1 | 2 | 2 | 0 | 3 | 2 | ||||||||||||
| Farm fragmentation | 0 | 0 | 2 | −5 | 2 | −5 | 0 | 0 | 2 | −5 | 2 | −5 | ||||||||||||
| Land price | 0 | 0 | 2 | −5 | 2 | −5 | 0 | 0 | 2 | −5 | 2 | −5 | ||||||||||||
| Technical knowledge | 2 | 6 | 1 | 2 | 3 | 8 | 1 | 1 | 3 | 5 | 4 | 6 | 3 | 7 | 4 | 7 | 7 | 14 | ||||||
| Agri-environmental schemes | 1 | 1 | 5 | 10 | 6 | 11 | 1 | 1 | 5 | 10 | 6 | 11 | ||||||||||||
© 2020 by the authors. Licensee MDPI, Basel, Switzerland. This article is an open access article distributed under the terms and conditions of the Creative Commons Attribution (CC BY) license (http://creativecommons.org/licenses/by/4.0/).
Share and Cite
Micha, E.; Fenton, O.; Daly, K.; Kakonyi, G.; Ezzati, G.; Moloney, T.; Thornton, S. The Complex Pathway towards Farm-Level Sustainable Intensification: An Exploratory Network Analysis of Stakeholders’ Knowledge and Perception. Sustainability 2020, 12, 2578. https://doi.org/10.3390/su12072578
Micha E, Fenton O, Daly K, Kakonyi G, Ezzati G, Moloney T, Thornton S. The Complex Pathway towards Farm-Level Sustainable Intensification: An Exploratory Network Analysis of Stakeholders’ Knowledge and Perception. Sustainability. 2020; 12(7):2578. https://doi.org/10.3390/su12072578
Chicago/Turabian StyleMicha, Evgenia, Owen Fenton, Karen Daly, Gabriella Kakonyi, Golnaz Ezzati, Thomas Moloney, and Steven Thornton. 2020. "The Complex Pathway towards Farm-Level Sustainable Intensification: An Exploratory Network Analysis of Stakeholders’ Knowledge and Perception" Sustainability 12, no. 7: 2578. https://doi.org/10.3390/su12072578
APA StyleMicha, E., Fenton, O., Daly, K., Kakonyi, G., Ezzati, G., Moloney, T., & Thornton, S. (2020). The Complex Pathway towards Farm-Level Sustainable Intensification: An Exploratory Network Analysis of Stakeholders’ Knowledge and Perception. Sustainability, 12(7), 2578. https://doi.org/10.3390/su12072578