Article

Techno-Economic Analysis of Electrocoagulation on Water Reclamation and Bacterial/Viral Indicator Reductions of a High-Strength Organic Wastewater—Anaerobic Digestion Effluent

1
Anaerobic Digestion Research and Education Center (ADREC), Michigan State University, 4090 College Rd, Lansing, MI 48910, USA
2
Department of Fisheries and Wildlife, Michigan State University, 480 Wilson Rd, East Lansing, MI 48824, USA
3
Drinking Water Investigation Unit, Division of Environmental Health, Michigan Department of Health and Human Services, 333 S. Grand Ave, Lansing, MI 48909, USA
4
Department of Chemistry and Biochemistry, University of Nevada, 4505 S Maryland Pkwy, Las Vegas, NV 89154, USA
5
Department of Biosystems and Agricultural Engineering, Michigan State University, 524 S. Shaw Ln, East Lansing, MI 48824, USA
*
Author to whom correspondence should be addressed.
Sustainability 2020, 12(7), 2697; https://doi.org/10.3390/su12072697
Submission received: 9 March 2020 / Revised: 24 March 2020 / Accepted: 26 March 2020 / Published: 30 March 2020
(This article belongs to the Special Issue Anaerobic Environmental Biotechnology and Sustainability)

Abstract

:
This study investigated the use of iron and aluminum and their combinations as electrodes to determine the technically sound and economically feasible electrochemical approach for the treatment of anaerobic digestion effluent. The results indicated that the use of iron as anode and cathode is the most suitable solution among different electrode combinations. The reduction of turbidity, total chemical oxygen demand, total phosphorus, total coliforms, Escherichia coli, Enterococci, and phages in the reclaimed water were 99%, 91%, 100%, 1.5 log, 1.7 log, 1.0 log, and 2.0 log, respectively. The economic assessment further concluded that the average treatment cost is $3 per 1000 L for a small-scale operation handling 3000 L wastewater/day. This study demonstrated that the electrocoagulation (EC) is a promising technique for the recovery and reclamation of water from anaerobic digestion effluent. Even though its energy consumption is higher and the nitrogen removal is insufficient compared to some conventional wastewater treatment technologies, there are several advantages of the EC treatment, such as short retention time, small footprint, no mixing, and gradual addition of coagulants. These features make EC technology applicable to be used alone or combined with other technologies for a wide range of wastewater treatment applications.

1. Introduction

Anaerobic digestion (AD) can be perceived as a pretreatment process to reclaim the water from concentrated organic waste streams. Regardless of the good performance of AD on carbon utilization for methane production and chemical oxygen demand reduction, the digestion effluent still contains relatively high amounts of solids (particulate organics and colloids) and dissolved organics (some nonbiodegradable compounds). Physical and chemical separation methods, such as coagulation, flocculation, sedimentation, activated carbon adsorption, filtration, and reverse osmosis, have been developed and implemented to treat anaerobic digestion effluents and achieve a water quality near to drinking water standards [1,2,3,4].
Electrocoagulation (EC) is an emerging technology for the removal of solid particles and other contaminants from high-strength wastewater (e.g., pulp and paper wastewater, animal wastes, leachate, and industrial wastewater) [5,6,7]. It has been studied by numerous research groups to remove metals [8,9], organic matters [10,11,12], nutrients [13], and microorganisms [14,15] from a variety of wastewaters. Compared to the conventional coagulation–flocculation process, EC has several advantages, such as in situ coagulant production induced by dissolving metal using electric current, combination of three processes (coagulation, flocculation, settling) in a single step, shorter reaction/retention time, and removal of small particles and color-causing compounds [9,10,16].
In an EC process, electricity is loaded on two metal electrodes (anode and cathode) in wastewater. The anodic metal (e.g., Fe, Al, and Mg) is dissolved and sacrificed, while the cathode reduces water molecules to hydrogen gas (H2) and hydroxyl (OH) ions.
Anode :   M e 0 ( s )   M e n + + n e
Cathode :   2 H 2 O + 2 e H 2 O ( g ) + 2 O H
Dissolved metal ions undergo complexation reactions with hydroxyl ions to form metal hydroxides (Fe(OH)2, Fe(OH)3, Mg(OH)2, Al(OH)3). The metal hydroxides with low solubility facilitate relieving repulsive forces between the colloids, destabilizing suspended solid particles, and forming flocs [17,18]. Correspondingly, solids in the wastewater are settled by gravitational force on the bottom of the reactor. Under ideal EC conditions, formation of flocs and their gravitational settling are expected to happen simultaneously. Meanwhile, the formation of H2 bubbles on the cathode brings in another solids removal mechanism—electroflotation (EF) to lift light solid particles to the surface and form a thick foam layer [19,20]. With the EC and EF, nutrients (P and N) are completely or partially removed as well during the process [9]. Fe and Al are the most commonly used metals for EC [21,22,23]. The same metal is typically applied for both anode and cathode in EC. It has also been reported that different metals were mixed to achieve combined EC and EF treatment [24].
This study investigated the effects of different electrode combinations of Fe and Al on the EC treatment of AD effluent and determined the preferred electrode configuration yielding maximum removal of solids and other contaminants (total chemical oxygen demand (tCOD) and total phosphorus (TP)). The selected electrode combination was then carried out to delineate dynamic changes of the EC treatment and determine the treatment time. The biological indicators (total coliforms, E. coli, Enterococcus, and coliphage) were monitored to conclude the effects of EC on potential pathogen reduction. A technoeconomic analysis was conducted based on an operation with a mass flow of 3000 L wastewater/day to conclude feasibility of small-scale application.

2. Materials and Methods

2.1. Feed

The AD effluent (digestate) was obtained from a pilot-scale anaerobic digestion unit (700 L effective volume, 20 days hydraulic retention time), which has been running since 2016 to treat a mixture of food waste and municipal sludge in the Anaerobic Digestion Research and Education Center (ADREC) at Michigan State University. The characteristics of the digestate are listed in Table 1.

2.2. Electrocoagulation (EC)

Different combinations of electrodes were tested so that the impacts of metal type used as anode or cathode on the removal of solids and other pollutants from the AD effluent can be assessed. The EC tests were run in 0.5 L batch reactors with two electrodes (Figure 1). Four electrode combinations (anode-cathode) of Fe–Fe, Al–Al, Al–Fe, and Fe–Al were tested. The total effective electrode surface area in a reactor was 210 cm2. The electrodes were placed 1 cm apart and connected in parallel mode to a DC power supplier (XPOWERTM) (Figure 1). The current was maintained at a constant of 2.0 A, while voltage was varied along with the process of the EC reaction. The reaction time was set at 10 min based on the formation of a transparent water layer in the middle of the reactor. Following EC, the flocs were allowed to grow bigger and settled for another 10 min. The energy consumption was recorded by a Kill A WattTM power monitor. The effects of different electrode combination on removal of turbidity, total chemical oxygen demand (tCOD), total phosphorus (TP), and total nitrogen (TN) were compared and evaluated.
In addition, the selected electrode combination from the CRD was used to further investigate the relationship between reaction time and treatment performance. The consumption of electrodes was recorded based on weight loss before and after the EC. The foam layer on the surface and solids at the bottom of the EC reactor were collected and weighed to calculate the water recovery of the EC process. Bacterial and viral indicators (e.g., total coliforms, E. coli, Enterococci, and somatic coliphage) were measured during the treatment to conclude the effects of EC on pathogen removal.

2.3. Technoeconomic Analysis

The experimental data were used to conduct the technoeconomic analysis on the treatment. The analysis was based on the configuration of a pilot-scale EC unit (60 L of the effective volume) (Figure 2a) and carried out for a distributed (small-scale) EC treatment system with a capacity of 3000 L high-strength wastewater per day. The distributed treatment system includes an EC reactor, effluent settling tank, and pneumatic sludge discharging pumps (Figure 2b). The wastewater is continuously fed to the EC reactor using the retention time obtained from the data from the previous experiment. The anodes in the EC reactor are equipped with brushes to periodically remove the flocs accumulated on the surface of the anodes. The EC-treated wastewater (supernatant) is overflowed to the effluent settling tank equipped with baffles to further settle the small particles in the treated wastewater. The sludge is pneumatically discharged from both the EC reactor and settling tank. The reclaimed water is collected from the top of the settling tank.
Mass and energy balance analyses were first carried out to determine the mass flow and energy demand of the treatment. The economic assessment was then fulfilled to determine the system viability. The capital expenditure (CapEx) and operational expenditure (OpEx) of the treatment system are two key parameters. The lifespan of the system was set at 20 years. The Modified Accelerated Cost Recovery System (MACRS) was used to calculate the annual depreciation of CapEx. In addition, an annual inflation of 3% was set for OpEx calculation according to the five-year average inflation rate in the U.S. The net cash flow considering depreciated CapEx, inflated OpEx, and the lifespan of the system was conducted to determine the treatment cost per liter wastewater. The annual depreciation rates are 0.100, 0.188, 0.144, 0.115, 0.092, 0.074, 0.066, 0.066, 0.065, 0.065, 0.033, and 0.033 (after 10 years), which are from MACRS. The inflation of the wastewater receiving charge was also set at 3%. A sensitivity analysis was carried out to elucidate the effects of total electricity demand and electrode consumption on the treatment cost. A total of 25% of their base values were used to show their impact on changes of the treatment cost.

2.4. Parameter Analysis

Total solids (TS) content was measured using the gravimetric method [25]. Total phosphorus (TP), total nitrogen (TN), and tCOD were measured using United States Environmental Protection Agency (USEPA)-approved HACHTM standard methods. The final concentration of solids was determined by turbidity measurements according to the USEPA standard method [26]. Turbidity measurements were made by using the HACH 2100Q Portable Turbidimeter. The pH of the solutions was measured via a HACH Pocket Pro pH meter. Conductivity was tested using an Orion Star A215 pH/conductivity meter (Thermo Scientific, Waltham, MA). Fecal indicator bacteria (Total coliforms, E. coli and Enterococcus) were enumerated using Colilert and Colilert Quanti-Tray®2000 (IDEXX Laboratories, Westbrook, ME, USA) for total coliform and E. coli, and Enterolert™ (IDEXX Laboratories, Westbrook, ME, USA) for Enterococcus. Generated concentrations were expressed in Most Probable-Number (MPN/100 ml) [27,28]. Phage analyses were made using a double agar layer modification of USEPA Method 1602 [29].

2.5. Statistical Analysis

ANOVA and Tukey pair-wise comparison were conducted on turbidity, TN, TP, and tCOD to identify significant differences among different electrode combinations. R (Version 3.2.4, the R foundation for Statistical Computing) was the software used to carry out the statistical analysis.

3. Results and Discussions

3.1. Effects of Metal Combinations on EC of AD Effluent

The anaerobic digestate was treated by EC using different combinations of Al and Fe electrodes. At the fixed current of 2 A, the change of electric potential for all combinations of electrodes (Fe–Fe, Al–Al, Al–Fe, and Fe–Al) followed the same pattern that started at 10 V and ended at 20 V during 10 minutes of the EC reaction. Correspondingly, they consumed the same amount of energy (6.5 Wh) to treat 500 mL AD effluent. The anode metal served as the coagulant metal, which dissolved in water via oxidation and formed mono/polyatomic hydroxide complexes [16]. The cathode reduced water to form H2 (g) and OH accompanied by dissolution and/or deposition of anodic metal [30]. Correspondingly, these reactions led to occurrence of coagulation, flocculation, and settling during the EC, which formed three distinct layers (liquid phase sandwiched between the foam layer at the top and solid layer at the bottom) in the reactor (Figure 1b). As the EC reaction continued, formation of flocs became visible, and the turbidity of liquid phase was significantly reduced (Figure 3). All electrode combinations after the two-step process (10 minutes EC followed by 10 minutes settling) demonstrated very good turbidity removal of more than 90% (Figure 3), though different electrode combinations also showed a significantly (P < 0.05) different EC performance from each other. Al–Fe combination had coagulation, flocculation, and settling simultaneously occur during the EC reaction. The following settling step had no significant (P > 0.05) improvement in turbidity removal of the reclaimed water (Figure 3). Meanwhile, the EC performance of three other electrode combinations (Fe–Fe, Fe–Al, and Al–Al) indicated that the settling step after EC is necessary to further remove turbidity (Figure 3).
Considering the effects of different metals used as anode and cathode on turbidity removal during treatment (both EC and settling), it was observed that there were no significant (P > 0.05) differences between Fe and Al once they served as the anode (Figure 4c). However, Fe as the cathode outperformed the Al cathode (Figure 4f). The reclaimed water after EC treatment with Fe–Fe and Al–Fe electrode combinations had a turbidity of 32.6 and 30.9 NTU, respectively, which were significantly (P < 0.05) lower than those from the treatment with Al–Al and Fe–Al electrode combinations (Table 2 and Figure 3). Meanwhile, the pH of the reclaimed water was greatly influenced by anode metal (i.e., Al) that released more hydroxyl ions in the water, which led to much higher pH (8.62 and 8.17) than those (7.46 and 7.82) using Fe as the anode (Table 2).
Different electrode combinations also influenced removal of other contaminants, especially those associated with the solid particles (e.g., tCOD and TP). All four combinations greatly reduced tCOD and TP in the reclaimed water during EC (Table 2). Among the combinations, Al–Fe showed a better performance on tCOD removal. The reclaimed water from the treatment of Al–Fe combination had a tCOD of 156.7 mg/L, which was much (P < 0.05) lower than that in the other three combinations (206.7, 313.3, and 256.7 mg/L for Fe–Fe, Al–Al, and Fe–Al, respectively). As for TP removal, Fe–Fe, Fe–Al, and Al–Fe combinations can reduce TP in the reclaimed water down to less than 1 mg PO4/L level, which were significantly (P < 0.05) lower than the treatment with the Al–Al combination (5.6 mg PO4/L) (Table 2). The analysis on the effects of individual metals as anode and cathode on tCOD and TP removal further concluded that Fe as cathode had a positive (P < 0.05) effect on tCOD removal, and Fe and Al used as either anode or cathode had no significant (P > 0.05) influence on TP removal (Figure 4a,b,d,e).
In addition, the amount of electrode metal consumed during EC treatment was also recorded (Table 2). The Al–Fe combination used the smallest amount of metals (0.25 g/L) to carry out the reaction, compared to 0.77, 0.34, and 0.70 g/L for the Fe–Fe, Al–Al, and Fe–Al combinations, respectively. The amount of metal consumed during EC reaction was confirmed using Faraday’s electrolysis equation as follows:
m = t I M F z
where m is the mass of electrode consumed (g), I is the current applied (A), t is time (second), M is the molecular weight of the metal (g/mol), F is Faraday’s constant (96485.33 C/mol), and z is the number of electrons transferred.
The calculations confirmed the consumption of 0.696 g Fe /L and 0.220 g Al/L during 10 min EC carried out powered by 2 A constant current, which are not significantly different from the weight loss measurements of the electrodes during the EC process.
According to the experimental results, it is apparent that Al–Fe is the best combination in terms of overall EC treatment performance and metal consumption. However, the use of aluminum has the disadvantage of increasing the residual concentration of Al3+ ions in water. It has been reported that Al3+ accumulation in drinking water is related with Alzheimer’s disease [31]. The maximum concentration of Al3+ in drinking water has been limited to less than 0.2 mg/L (Secondary Drinking Water Standards, USEPA). Therefore, aluminum use needs to be avoided. The Fe–Fe combination was the second best after the Al–Fe combination. There was no significant (P > 0.05) difference on removal of turbidity and TP between Fe–Fe and Al–Fe, but tCOD removal of Fe–Fe was lower (P < 0.05) than that of Al–Fe. Considering both environmental health and overall treatment performance, Fe–Fe was selected as the electrode combination for the rest of the study.

3.2. EC Treatment of Water Reclamation and Microorganism Removal

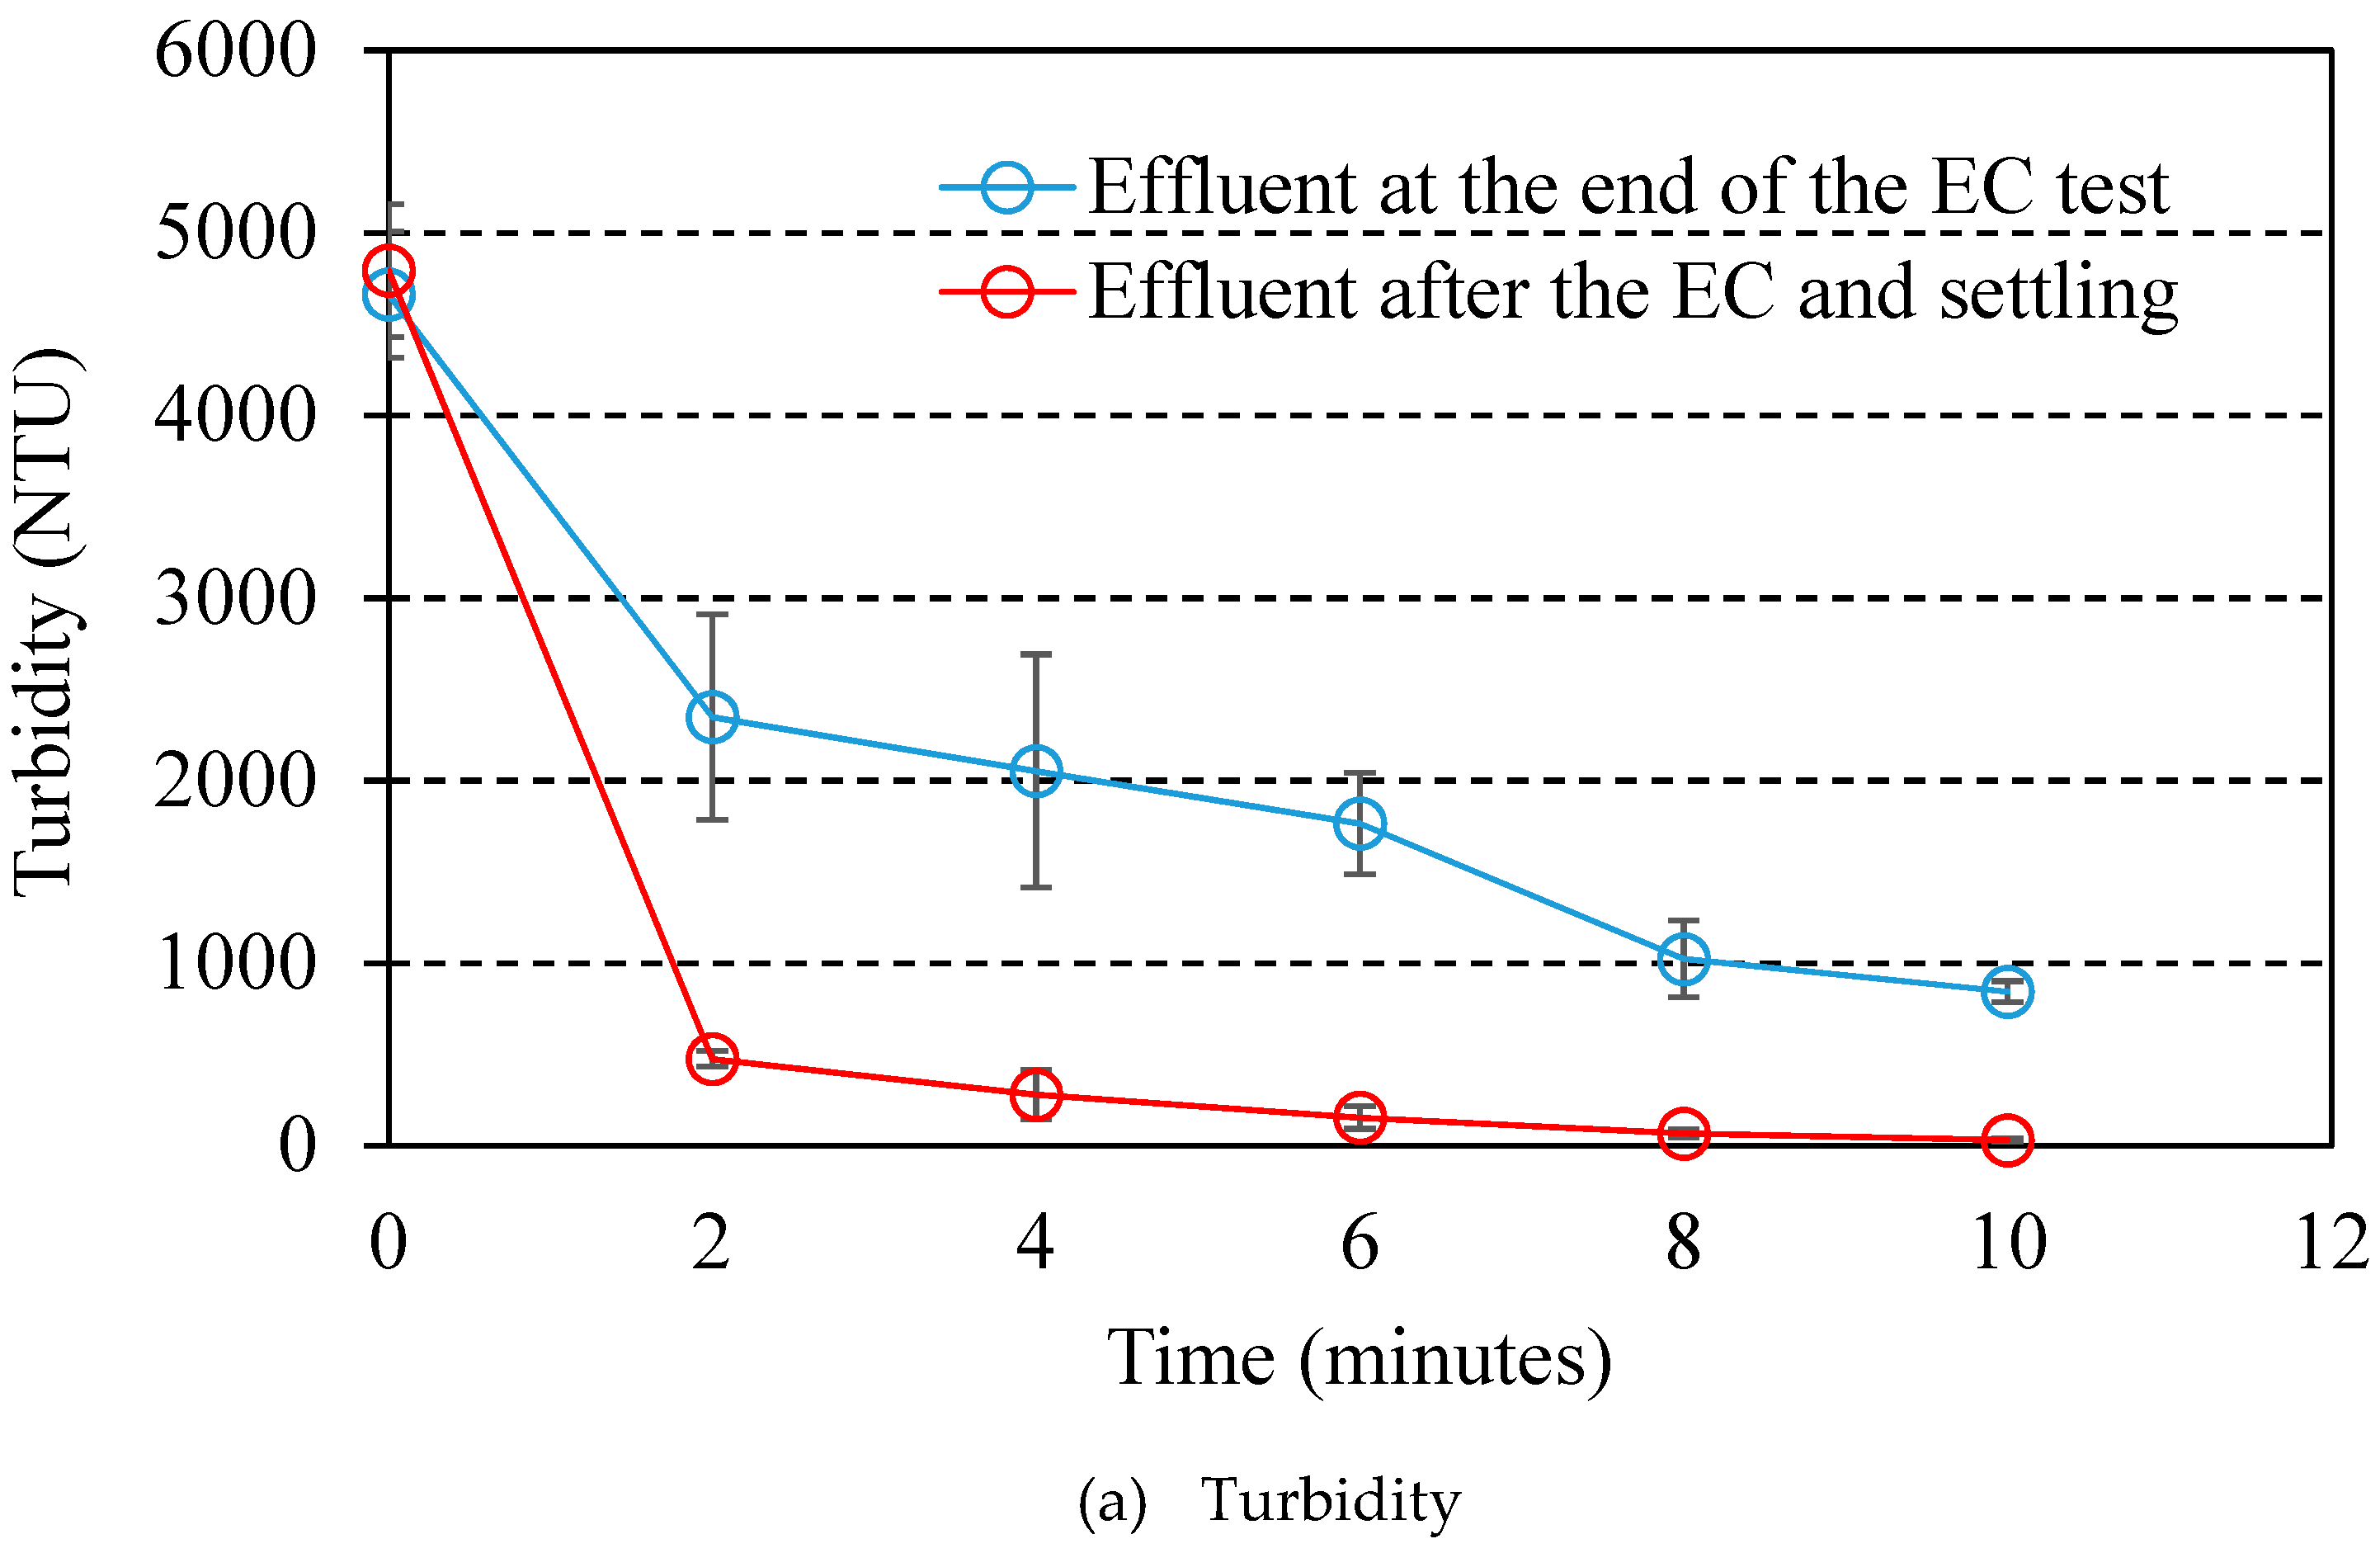
Electrocoagulation using the Fe–Fe electrode combination was studied to elucidate its effects on water quality of the reclaimed water during the treatment process. The results showed that turbidity was quickly removed by 90% in the first 2 minutes and then leveled off for the rest of the EC (Figure 5a). This phenomenon could be attributed to the characteristics of the AD effluent. The effluent contains big solid particles, cell flocs, and small suspended solids. Surface charge of the big solid particles and cell flocs with a small surface area is relatively less stable and much easier to be neutralized by a small amount of metal coagulants from the EC reaction [18]. This would be the reason the turbidity of the solution was quickly removed at the beginning of the EC. With the progress of removing big solid particles and cell flocs, small particles (with a much bigger surface area) in the solution demand more coagulants to form flocs and settle down, which took a longer time to be removed. Small suspended particles in the effluent also contributed to the dark color of the solution. As a result, with removing the small particles, the treated effluent started becoming clear. In addition, the settling step clearly demonstrated the benefit on removing the particles and significantly (P < 0.05) improved the quality of the reclaimed water. At the end of the EC treatment (with both EC and settling), 99.4% of the original turbidity had been removed. A reclaimed water was obtained with a turbidity of 32 NTU (Figure 5a).
Changes of tCOD, TN, and TP during the treatment process (after the settling) were measured as well (Figure 5b–d). Similar to the trend of turbidity changes, the tCOD and TP of the treated solution exponentially decreased. The tCOD and TP of the reclaimed water were 336.7 mg/L and 0.5 mg PO4/L, respectively. The corresponding removal of tCOD and TP was 99.2% and 99.8%. However, TN removal was insignificant during treatment (Figure 5d), which is similar to a previous study [9]. Nitrogen-based compounds in the effluent include ammonia, nitrate, and nitrite. Due to the strong electronegativity of nitrogen in these compounds, they are very hydrophilic. EC technology is not able to remove them. An electrooxidation process using boron doped diamond (BDD) electrodes was designed and applied to oxidize the nitrogen compounds and remove the TN in the reclaimed water (the results are presented in the Supplementary Materials).
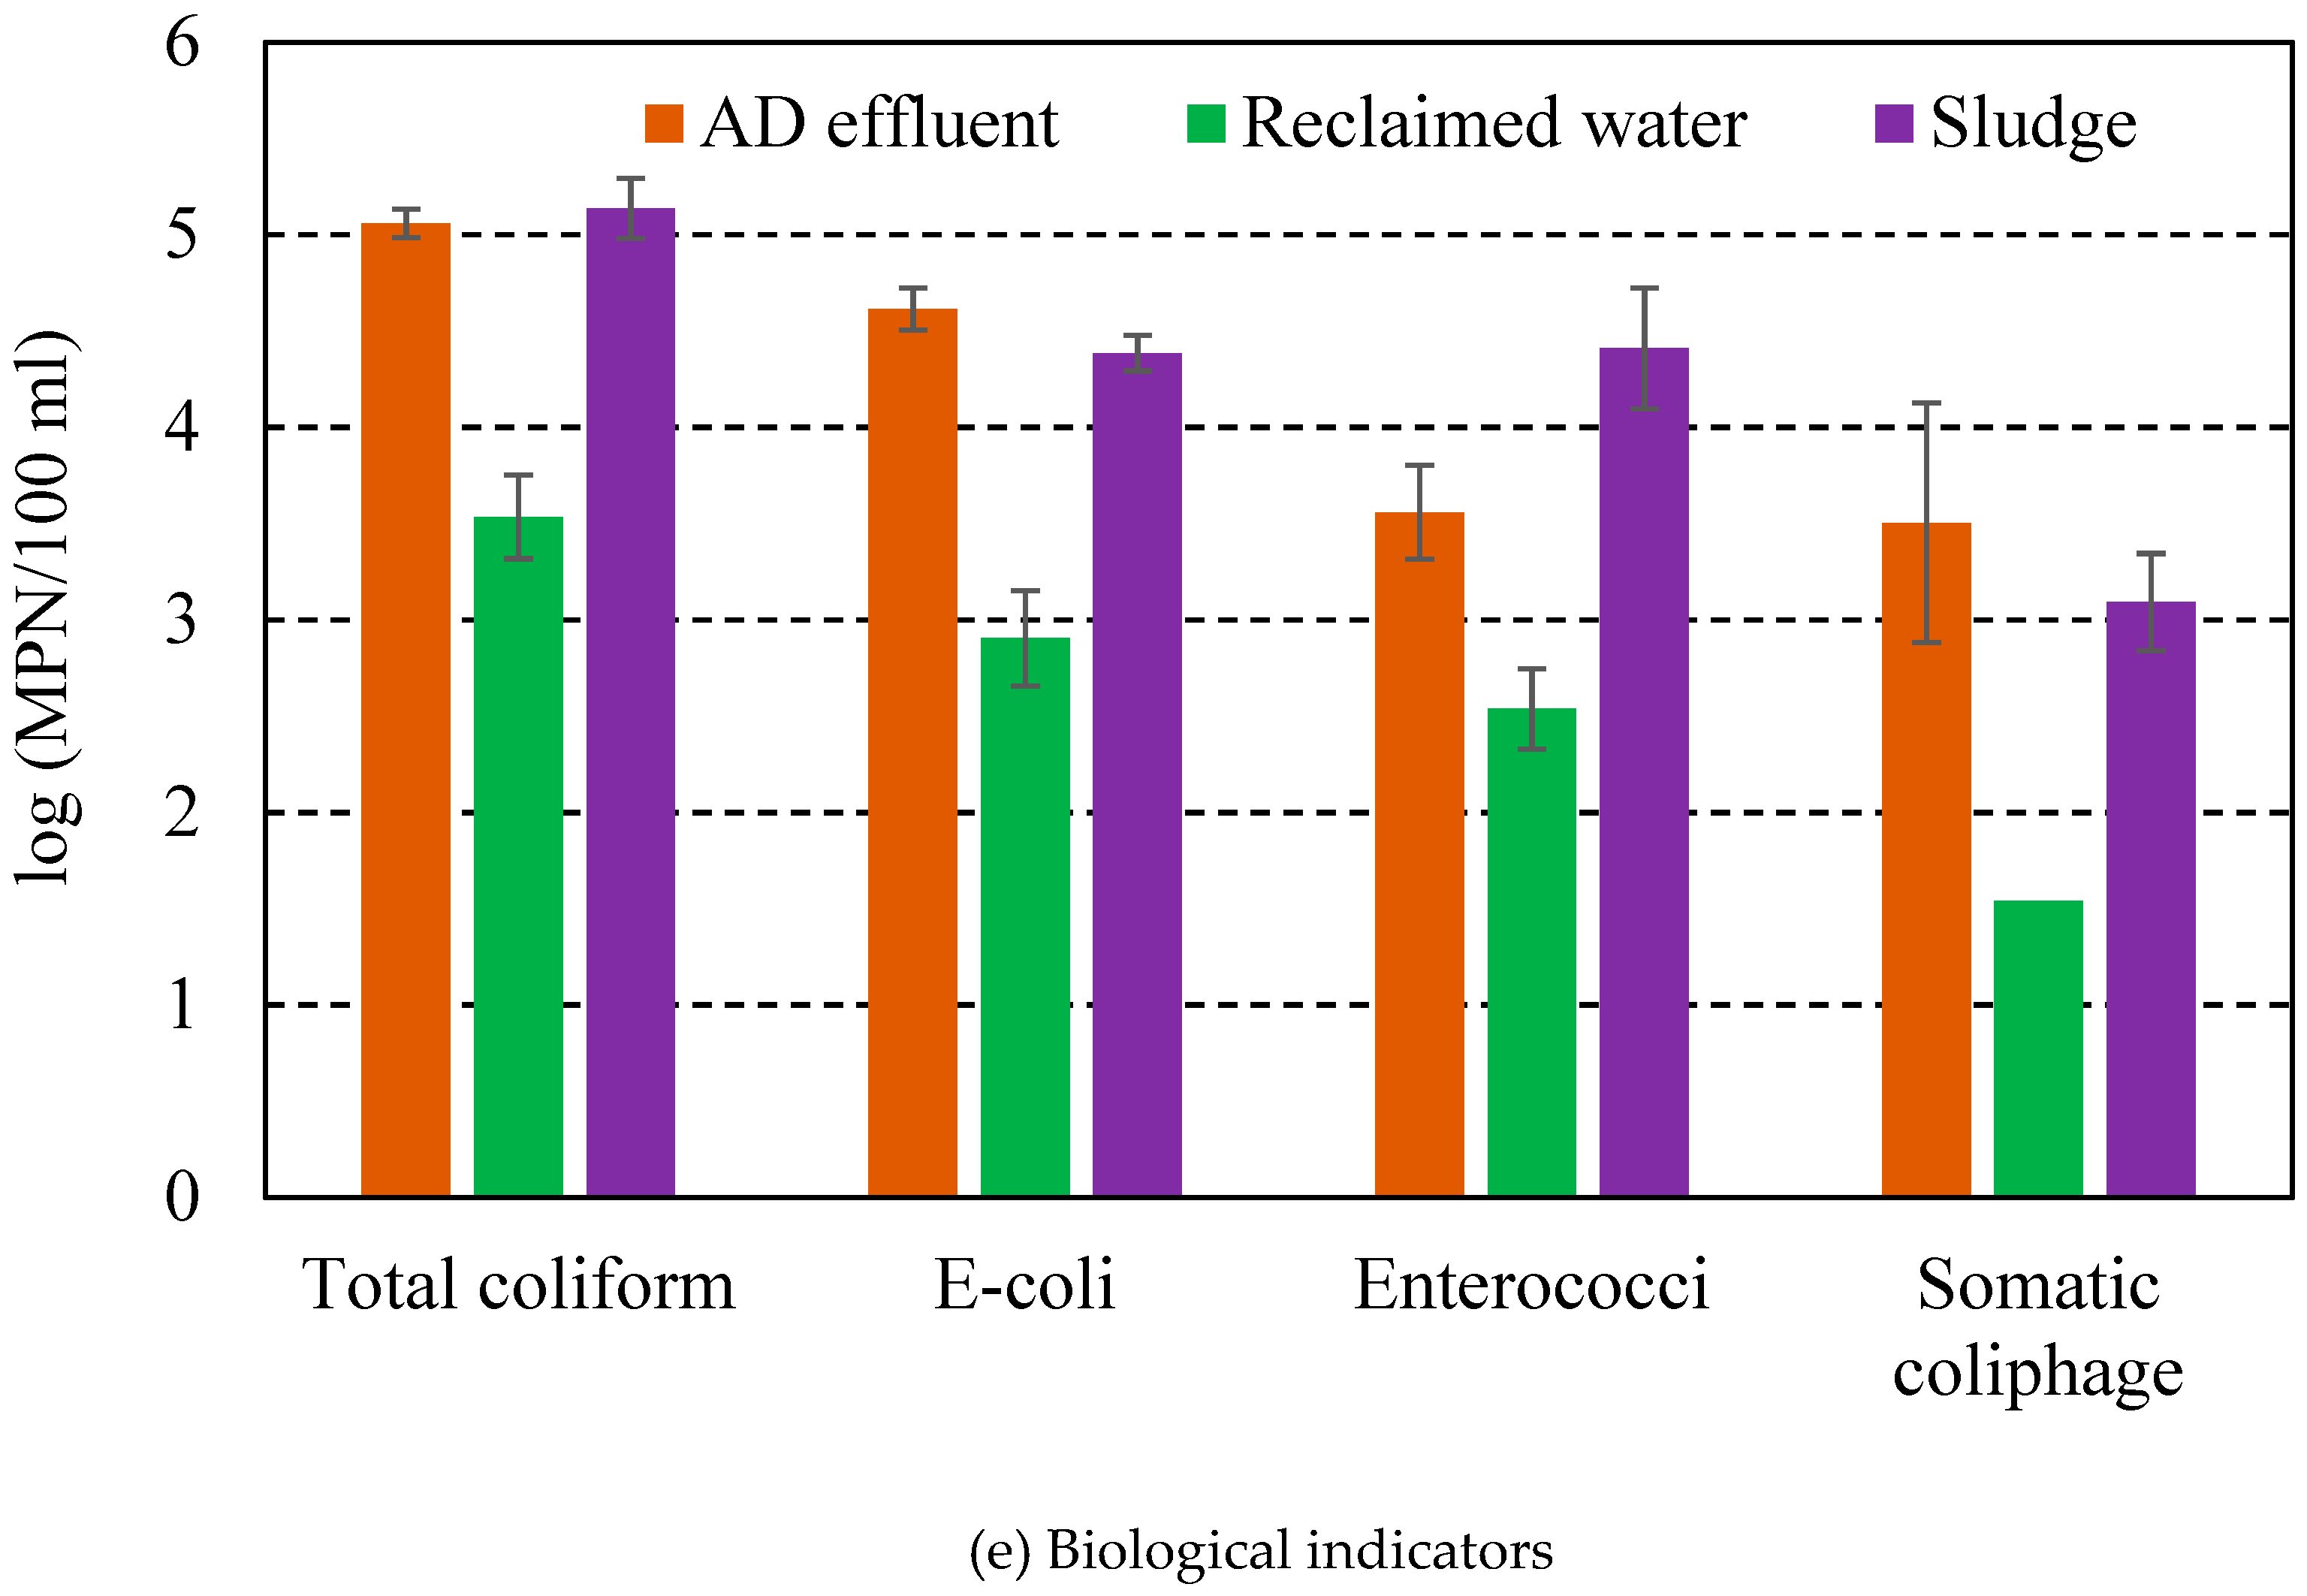
The microbial parameters also indicated that the EC treatment significantly (P < 0.05) removed total coliforms, E. coli, Enterococci, and somatic coliphage in the reclaimed water by 1.52 log, 1.71 log, 1.02 log, and 1.96 log, respectively (Figure 5e). It is apparent that reduction of the biological indicators is directly correlated with removal of solids and flocs. During EC, microbes were attached and embedded by solid particles and flocs and correspondingly removed by solids settling and floc flotation. This result demonstrated that EC could potentially facilitate removing pathogens during wastewater treatment. Evaluation of human virus and protozoan removal is warranted to examine final reclaimed water quality, which would dictate the type of reuse and the “fit for purpose” applications.
The experimental data also demonstrated that the treatment (10 minutes EC plus 10 minutes settling) had a relatively higher water recovery of 84% compared to another study by Liu et al., which reported 54.9% water recovery using two-stage EC [9]. There was 420 mL of the reclaimed water and 80 mL of the sludge yielded from 500 mL of the original AD effluent. Water recovery was used to carry out the mass balance in the following technoeconomic analysis.

3.3. Technoeconomic Analysis

3.3.1. Mass and Energy Balance

The mass and energy balance analysis of the studied EC and settling process were based on a volumetric flow of 3000 L/day AD effluent. The results obtained from the above experiments were used to carry out the analysis. Considering the operational time of 10 hours/day with 20% of extra time to prepare the reactor between batches, the unit needs to process 60 L AD effluent per batch (10 minutes).
With the water recovery of 84%, the mass balance concluded that the treatment consumed 2.3 kg/day of iron electrodes to reclaim 2520 L/day water with reduced nutrients and biological indicators and generate 480 L of the sludge with elevated nutrient contents of 10 g/L TN (40% of TS) and 3.0 g/L TP (12% of TS) (Figure 6). Compared to solid digestate directly from liquid–solid separation of anaerobic digestion effluent that usually contains TN of 3–14% TS and TP of 0.6–1.7% TS [32], the sludge from the EC has a much better nutrient profile. In addition, since the pH of the sludge is above 7, iron in the sludge is in the form of iron oxides that have a limited impact on soil quality, which alleviates the concern of high iron content in the sludge. These results clearly indicated that regarding chemical composition, sludge is a good fertilizer. However, high contents of bacterial and viral indicators in the sludge (Figure 5) require a post-treatment to remove pathogens in order to be able to extensively apply for a wide variety of crops, vegetables, and fruits.
The energy balance analysis further concluded the detailed energy consumption of the treatment process (Table 3). To treat 3000 L/day AD effluent, the total energy demand of the treatment was 40 kWh/day. The EC was the biggest electricity consumer demanding 39 kWh/day, followed by 0.02 kWh/day for the brushes to clean up the electrodes, and 1.3 kWh/day for the sludge pumps to discharge the EC sludge (Table 3). The corresponding unit energy consumption was 13.2 Wh/L. In comparison to the small-scale conventional active sludge (CAS) treatment process that uses approximately 0.45 Wh/L to treat the wastewater with a COD of 500 mg/L [32], the energy consumption per unit tCOD of the EC treatment (3.43 Wh/g tCOD) is 3.8 times higher than the conventional wastewater treatment of 0.9 Wh/g tCOD. However, considering the short retention time (10 minutes) of the EC reaction vs. 24 hours of CAS, the EC only needs 60 L of the effective reactor volume to treat 3000 L high-strength AD effluent per day, which is at least 144 times smaller than the aeration pond of the CAS process (the retention time of CAS could be much longer than 24 hours to treat the high-strength wastewater). The small footprint of the EC treatment, along with its capability of treating high-strength wastewater, provides a significant advantage of the technology to be adopted by a wide range of scales of different wastewater treatment applications in addition to anaerobic digestion.

3.3.2. Economic Assessment

Along with mass and energy balance analysis, economics is another critical factor that determines the commercial applicability of a technology. CapEx and OpEx of the EC treatment process were examined to conclude the cost of the treatment during the lifespan of the process. As presented in Table 4, the CapEx of the process implementation was $2010, consisting of $200 for the EC reactor vessel, $10 for the iron electrodes, $200 for the settling tank, $200 for the brushes with gearbox and motor, $1000 for the sludge discharging pumps with an air compressor, $100 for the timers, and $300 for pipelines and other miscellaneous items. The OpEx of the system ($2883) includes costs of energy, electrode replacement, and maintenance. The energy cost of $1884/year is for the electricity use of the EC. The cost for the electrode replacement is $499/year. The maintenance cost of $500 is for oil change and other check-up for the gearbox, pumps and motors.
The cash flow analysis indicated that with the operational conditions of the EC at 2 A for 10 minutes followed by the settling of 10 minutes, the average treatment cost in 20 years of its lifespan is $3 per 1000 L AD effluent. The treatment cost of each year was listed in Table 5 considering both inflation and depreciation. A sensitivity analysis was further carried out to delineate the impacts of three key parameters (retention time of the EC reaction, CapEx of the process, and lifespan of the treatment unit) on the average cost of treating the AD effluent (Table 6). The results elucidate that retention time of the EC reaction is the most sensitive one among three parameters. Shortening the retention time by 25% could reduce 16% of the average cost, changing from $3/1000 L to $2.52/1000 L. The other two parameters of CapEx and lifetime of the treatment unit are much less sensitive. With 25% change in their base values, the average costs were slightly reduced to $2.98/1000 L and $2.96/1000 L, respectively. The sensitivity analysis clearly indicated that optimization of the EC reaction is a key to further improve the economic performance of EC technology.
According to the sensitivity analysis as well as the kinetic data presented in Section 3.2, shortening the EC reaction time from 10 minutes to 8 minutes is feasible to significantly reduce the energy consumption with a minimum impact on the treatment performance. In addition, a continuous EC process could also improve the treatment performance and reduce energy consumption, which needs to be further studied.

4. Conclusions

This study demonstrated that EC technology is a highly efficient approach to remove turbidity, tCOD, phosphorous, and biological indicators from high-strength wastewater. The reduction of turbidity, total chemical oxygen demand, total phosphorus, total coliforms, E. coli, Enterococci, and phages in the reclaimed water were 99%, 91%, 100%, 1.5 log, 1.7 log, 1.0 log, and 2.0 log, respectively. The technoeconomic assessment concluded that a reactor with 60 L of the effective volume can treat 3000 L AD effluent per day, and the treatment cost is $9 per day. Although the EC treatment has many advantages, including short retention time, small footprint, no mixing requirement, and gradual addition (dissolving) of coagulants, the high energy consumption (3.43 Wh/g tCOD removal) and insufficient nitrogen removal (14%) are two main barriers to EC applications. Future studies are needed to focus on finding solutions to these issues.

Supplementary Materials

The following are available online at https://www.mdpi.com/2071-1050/12/7/2697/s1.

Author Contributions

S.U.-D.: Conceptualization, methodology, investigation, data curation, and writing the original draft. N.O.: Investigation and validation. R.I.: Methodology, investigation, data curation, and reviewing and editing. J.P.N.: Methodology, investigation, data curation, and reviewing and editing. C.A.R.: Conceptualization, methodology, investigation, data curation, and writing the original draft. J.B.R.: Conceptualization and reviewing and editing. W.L.: Conceptualization, methodology, data curation, writing the original draft, and reviewing and editing. All authors have read and agreed to the published version of the manuscript.

Funding

This study was financially supported by the U.S. Department of Defense Strategic Environmental Research and Development Program (Contract No.: W912HQ-12-C-0020) and the AgBioResearch at Michigan State University.

Acknowledgments

The authors would like to thank Mr. Yuan Zhong, Mr. Henry Frost, and Mr. Jack Blackhurst for preparing the AD effluent for this study.

Conflicts of Interest

The authors declare no conflict of interest.

References

  1. Dean, R.B. Process for water reclamation. Waste Manag. Res. 1991, 9, 425–430. [Google Scholar] [CrossRef] [PubMed]
  2. Tyagi, V.K.; Khan, A.A.; Kazmi, A.A.; Chopra, A.K. Enhancement of Coagulation Flocculation Process Using Anionic Polymer for the Post Treatment of UASB Reactor Effluent. Sep. Sci. Technol. 2010, 45, 626–634. [Google Scholar] [CrossRef]
  3. Guilayn, F.; Jimenez, J.; Rouez, M.; Crest, M.; Patureau, D. Digestate mechanical separation: Efficiency profiles based on anaerobic digestion feedstock and equipment choice. Bioresour. Technol. 2019, 274, 180–189. [Google Scholar] [CrossRef] [PubMed]
  4. Fuchs, W.; Drosg, B. Assessment of the state of the art of technologies for the processing of digestate residue from anaerobic digesters. Water Sci. Technol. 2013, 67, 1984–1993. [Google Scholar] [CrossRef] [Green Version]
  5. Jaafarzadeh, N.; Omidinasab, M.; Ghanbari, F. Combined electrocoagulation and UV-based sulfate radical oxidation processes for treatment of pulp and paper wastewater. Process Saf. Environ. Prot. 2016, 102, 462–472. [Google Scholar] [CrossRef]
  6. Papadopoulos, K.P.; Argyriou, R.; Economou, C.N.; Charalampous, N.; Dailianis, S.; Tatoulis, T.I.; Tekerlekopoulou, A.G.; Vayenas, D.V. Treatment of printing ink wastewater using electrocoagulation. J. Environ. Manag. 2019, 237, 442–448. [Google Scholar] [CrossRef]
  7. Changmai, M.; Pasawan, M.; Purkait, M.K. Treatment of oily wastewater from drilling site using electrocoagulation followed by microfiltration. Sep. Purif. Technol. 2019, 210, 463–472. [Google Scholar] [CrossRef]
  8. Heidmann, I.; Calmano, W. Removal of Ni, Cu and Cr from a galvanic wastewater in an electrocoagulation system with Fe-and Al-electrodes. Sep. Purif. Technol. 2010, 71, 308–314. [Google Scholar] [CrossRef]
  9. Liu, Z.; Stromberg, D.; Liu, X.; Liao, W.; Liu, Y. A new multiple-stage electrocoagulation process on anaerobic digestion effluent to simultaneously reclaim water and clean up biogas. J. Hazard. Mater. 2015, 285, 483–490. [Google Scholar] [CrossRef]
  10. Yetilmezsoy, K.; Ilhan, F.; Sapci-Zengin, Z.; Sakar, S.; Gonullu, M.T. Decolorization and COD reduction of UASB pretreated poultry manure wastewater by electrocoagulation process: A post-treatment study. J. Hazard. Mater. 2009, 162, 120–132. [Google Scholar] [CrossRef]
  11. Kobya, M.; Senturk, E.; Bayramoglu, M. Treatment of poultry slaughterhouse wastewaters by electrocoagulation. J. Hazard. Mater. 2006, 133, 172–176. [Google Scholar] [CrossRef] [PubMed]
  12. Ricordel, C.; Darchen, A.; Hadjiev, D. Electrocoagulation-electroflotation as a surface water treatment for industrial uses. Sep. Purif. Technol. 2010, 74, 342–347. [Google Scholar] [CrossRef]
  13. Emamjomeh, M.M.; Sivakumar, M. Review of pollutants removed by electrocoagulation and electrocoagulation/flotation processes. J. Environ. Manag. 2009, 90, 1663–1679. [Google Scholar] [CrossRef] [PubMed]
  14. Ghernaout, D.; Badis, A.; Kellil, A.; Ghernaout, B. Application of electrocoagulation in Escherichia coli culture and two surface waters. Desalination 2008, 219, 118–125. [Google Scholar] [CrossRef]
  15. Anfruns-Estrada, E.; Bruguera-Casamada, C.; Salvado, H.; Brillas, E.; Sires, I.; Araujo, R.M. Inactivation of microbiota from urban wastewater by single and sequential electrocoagulation and electro-Fenton treatments. Water Res. 2017, 126, 450–459. [Google Scholar] [CrossRef] [Green Version]
  16. Butler, E.; Hung, Y.-T.; Yeh, R.Y.-L.; Al Ahmad, M.S. Electrocoagulation in Wastewater Treatment. Water 2011, 3, 495–525. [Google Scholar] [CrossRef]
  17. Bratby, J. Coagulation and Flocculation in Water and Wastewater Treatment, 2nd ed.; IWA Publishing: London, UK, 2006; pp. 1–407. [Google Scholar]
  18. Crittenden, J.C.; Harza, B.M.W. Water Treatment: Principles and Design; Wiley: Hoboken, NJ, USA, 2005. [Google Scholar]
  19. Paulista, L.O.; Presumido, P.H.; Peruco Theodoro, J.D.; Novaes Pinheiro, A.L. Efficiency analysis of the electrocoagulation and electroflotation treatment of poultry slaughterhouse wastewater using aluminum and graphite anodes. Environ. Sci. Pollut. Res. 2018, 25, 19790–19800. [Google Scholar] [CrossRef]
  20. Djerroud, N.; Adjeroud, N.; Felkai-Haddache, L.; Hammoui, Y.; Remini, H.; Dahmoune, F.; Merzouk, B.; Madani, K. Enhanced electrocoagulation-electroflotation for turbidity removal by Opuntia ficus indica cladode mucilage. Water Environ. J. 2018, 32, 321–332. [Google Scholar] [CrossRef]
  21. Bassala, H.D.; Dedzo, G.K.; Bememba, C.B.N.; Seumo, P.M.T.; Dazie, J.D.; Nanseu-Njiki, C.P.; Ngameni, E. Investigation of the efficiency of a designed electrocoagulation reactor: Application for dairy effluent treatment. Process Saf. Environ. Prot. 2017, 111, 122–127. [Google Scholar] [CrossRef]
  22. Alimohammadi, M.; Askari, M.; Dehghani, M.H.; Dalvand, A.; Saeedi, R.; Yetilmezsoy, K.; Heibati, B.; McKay, G. Elimination of natural organic matter by electrocoagulation using bipolar and monopolar arrangements of iron and aluminum electrodes. Int. J. Environ. Sci. Technol. 2017, 14, 2125–2134. [Google Scholar] [CrossRef]
  23. Daniel, R.; Rao, P.A.V.S. An Efficient Removal of Arsenic from Industrial Effluents using Electro-coagulation as Clean Technology Option. Int. J. Environ. Res. 2012, 6, 711–718. [Google Scholar]
  24. Aoudj, S.; Khelifa, A.; Drouiche, N. Removal of fluoride, SDS, ammonia and turbidity from semiconductor wastewater by combined electrocoagulation-electroflotation. Chemosphere 2017, 180, 379–387. [Google Scholar] [CrossRef] [PubMed]
  25. Greenburg, A. Standard Methods for the Examination of Water and Wastewater, 16th ed.; American Public Health Asscociation: Washington, DC, USA, 1985. [Google Scholar]
  26. Clancy, J.L.; Bukhari, Z.; McCuin, R.M.; Matheson, Z.; Fricker, C.R. USEPA method 1622. Am. Water Work. Assoc. J. 1999, 91, 60–68. [Google Scholar] [CrossRef]
  27. ASTM: D6503-99, Standard Test Method for Enterococci in Water Using Enterolert; ASTM International: West Conshohocken, PA, USA, 2005.
  28. USEPA. Method 1602: Male-specific (F+) and Somatic Coliphage in Water by Single Agar Layer (SAL) Procedure; USEPA: Washington, DC, USA, 2001.
  29. Picard, T.; Cathalifaud-Feuillade, G.; Mazet, M.; Vandensteendam, C. Cathodic dissolution in the electrocoagulation process using aluminium electrodes. J. Environ. Monit. 2000, 2, 77–80. [Google Scholar] [CrossRef] [PubMed]
  30. Tomljenovic, L. Aluminum and Alzheimer’s Disease: After a Century of Controversy, Is there a Plausible Link? J. Alzheimers Dis. 2011, 23, 567–598. [Google Scholar] [CrossRef] [Green Version]
  31. Moeller, K.; Mueller, T. Effects of anaerobic digestion on digestate nutrient availability and crop growth: A review. Eng. Life Sci. 2012, 12, 242–257. [Google Scholar] [CrossRef]
  32. Guerrini, A.; Romano, G.; Indipendenza, A. Energy Efficiency Drivers in Wastewater Treatment Plants: A Double Bootstrap DEA Analysis. Sustainability 2017, 9, 1126. [Google Scholar] [CrossRef] [Green Version]
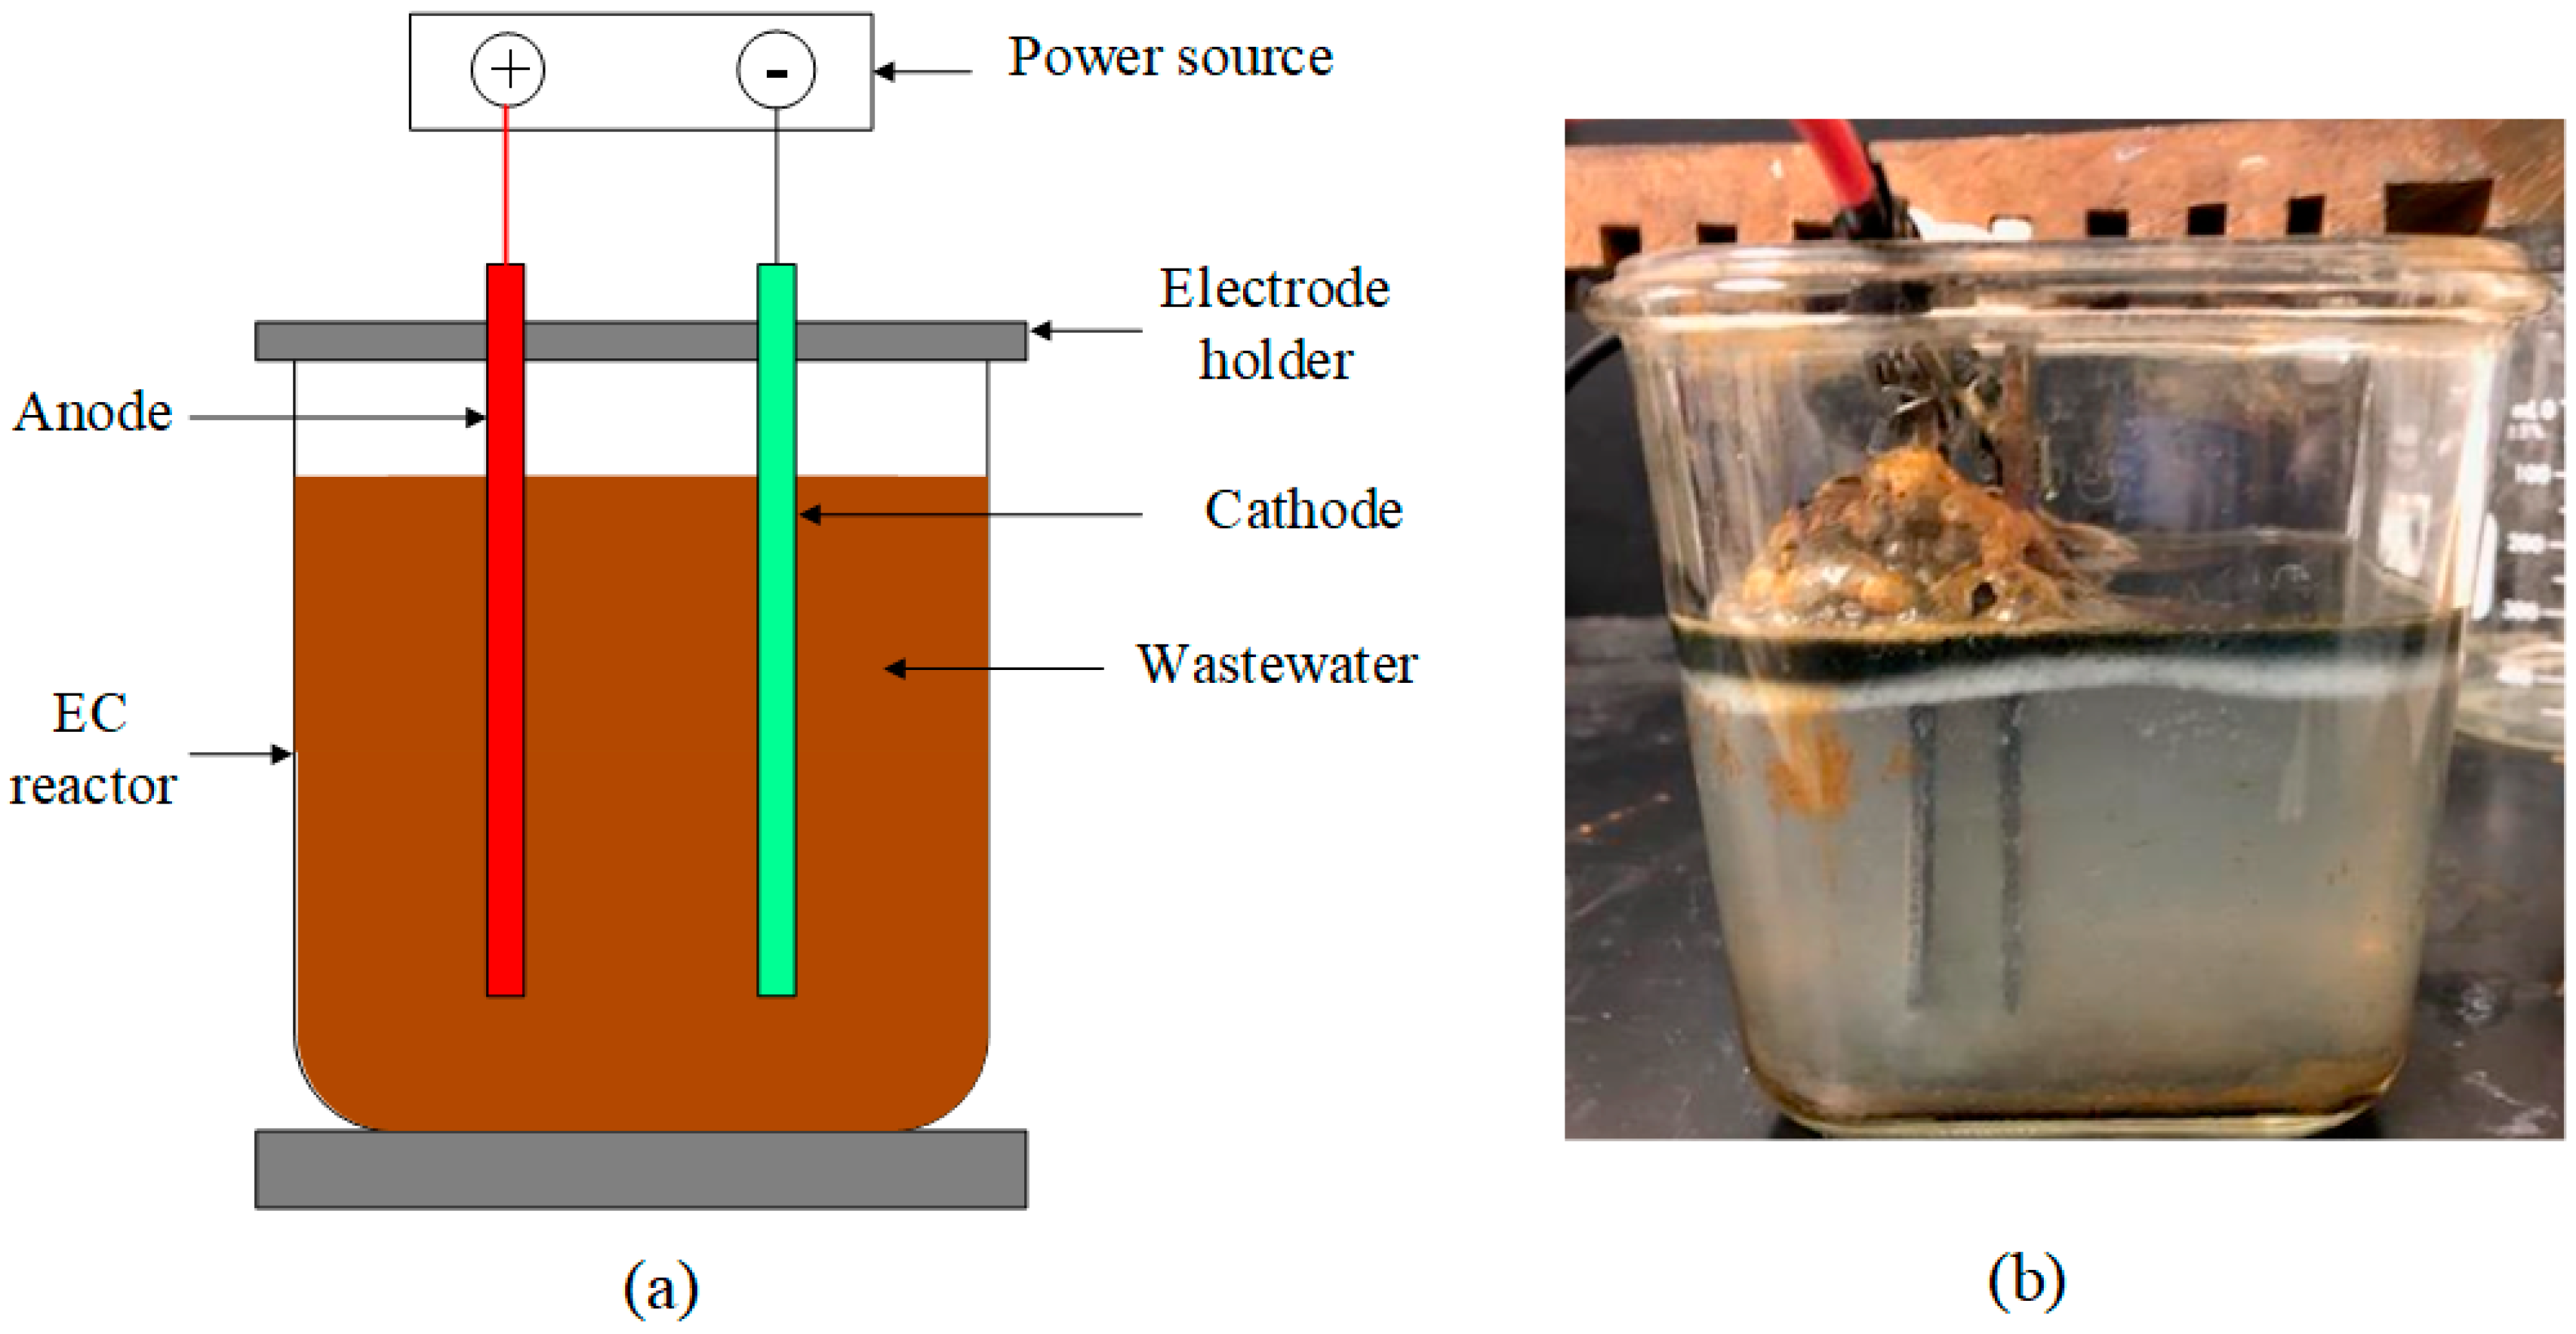
Figure 1. The bench-scale electrocoagulation (EC) reactor. (a). Reactor configuration; (b). The testing bench-scale EC reactor.
Sustainability 12 02697 g001
Figure 2. The EC treatment system. (a). 60 L pilot-scale EC unit; (b). The diagram of the EC treatment system *. *: the inclining baffles in the setting tank is to facilitate the gravity settling of small particles in the EC-treated wastewater.
Sustainability 12 02697 g002
Figure 3. The turbidity in liquid phase at the end of EC and after 10 min gravitational settling *. The tests were run 3 times, and results are the average of three tests. Error bars indicate standard deviation from the average value. *: The picture on the top right side was the reclaimed water after 10 min settling from different electrode combinations with the comparison of the original anaerobic digestion (AD) effluent.
Sustainability 12 02697 g003
Figure 4. Effects of different electrodes on the EC performance of total chemical oxygen demand (tCOD), total phosphorus (TP) as PO4, and turbidity removal. (a). Anode on tCOD; (b). Anode on PO4; (c). Anode on turbidity; (d). Cathode on tCOD; (e). Cathode on PO4; (f). Cathode on turbidity.
Sustainability 12 02697 g004
Figure 5. EC treatment of the AD effluent *. tCOD, total nitrogen (TN), and TP values were for the samples of the reclaimed water after the settling step. *: The error bars are standard deviations of the three tests.
Sustainability 12 02697 g005aSustainability 12 02697 g005bSustainability 12 02697 g005c
Figure 6. Mass balance of the EC system using Fe–Fe electrodes *. *: The TN and TP in the sludge were calculated based on mass balance.
Sustainability 12 02697 g006
Table 1. Characteristics of the anaerobic digester effluent *.
ParametersValue
pH7–8
sCOD (mg/L) 2243.3 ± 220.5
tCOD (mg/L)3853.3 ± 587.1
TAN (mg N/L)690 ± 30
TN (mg N/L)5246.7 ± 450.1
PO4-P (mg P/L)28.7 ± 1.56
TP (mg P/L)487.6 ± 17.4
Turbidity (NTU)4663.3 ± 345.3
TS (g/L)3.39 ± 0.27
Conductivity (mS/cm)6.83 ± 0.06
*The results are reported as the average of three measurements ± standard deviation.
Table 2. The treatment performance of different electrode combinations after EC and settling *.
Electrode Combination (Anode-cathode)pHTurbidity (NTU)tCOD (mg/L)TP (mg PO4/L)Anode consumed (g/L)Cathode consumed (g/L)
Fe-Fe7.4632.6 ± 6.8206.7 ± 34.00.85 ± 0.040.72 ± 0.040.05 ± 0.08
Al-Al8.62284 ± 164313.3 ± 89.65.6 ± 3.20.26 ± 0.020.08 ± 0.01
Fe-Al7.82287.3 ± 116.4256.7 ± 34.00.1 ± 0.10.70 ± 0.030
Al-Fe8.1730.9 ± 11.6156.7 ± 5.800.25 ± 0.030
*The results are reported as the average of three measurements ± standard deviation except for pH values.
Table 3. Energy balance.
Unit OperationsElectricity Demand (Wh/day)
Electrocoagulation a39,000
Brushing electrodes b19
Sludge pumps c1312
Total energy demand40,331
a: The electricity consumption of the electrocoagulation is 13 Wh/L wastewater. b: Brushes are operated 96 minutes per day (1 minute per 10 minutes operational time). The size of the motor is 12 V. The electricity consumption of the brushing operation is 19 Wh. c: The sludge pumps ran 96 minutes per day (1 minute per 10 minutes operational time). The size of the air compressor for the displacement pumps is 0.82 kW. The electricity consumption of the sludge pumping is 1312 Wh.
Table 4. Economic analysis.
UnitUnit DescriptionCost ($)
Capital expenditure (CapEx) a
EC reactor vessel160 L effective volume, PVC material$200
Iron electrodes b104200 cm2 surface area each with a thickness of 0.5 cm and the mass of 1.7 kg each$10
Brushes with gearbox and motor2Nylon brush with 50 rpm high torque turbine worm gear box with 12 V DC motor$200
Settling tank with baffles160 L effective volume, PVC material$200
Sludge discharging pumps with an air compressor212 L/min diaphragm pump with 0.82 kw 16 L air compressor$1000
Timers2Controlling feeding and discharging$100
Pipelines and other miscellaneous items1PVC pipes, fittings and valves$300
Total CapEx cost $2010
Operational expenditure (OpEx)c
Energy cost d $1884/year
Electrode replacement e $499/year
Maintenance f $500/year
Total OpEx cost $2883/year
a. The costs were obtained from suppliers to build a similar unit at the MSU Anaerobic Digestion Research and Education Center (ADREC). b. The market price of iron steel sheet is $600/metric ton in 2018. c. The values in the OpEx are all current values. d. The price of electricity is $0.13 according to the data from the Energy Information Administration (EIA) in 2018. e. The electrodes are replaced once 80% of them are consumed. The daily iron electrode consumption is 2.28 kg/day. The market price of iron steel sheet is $600/metric ton in 2017. f. The cost of the maintenance includes oil change and other check-ups for gearbox, pumps, and motor.
Table 5. Treatment cost during the life of the EC process.
YearTreatment Cost ($/1000 L AD Effluent)YearTreatment Cost ($/1000 L AD Effluent)
12.72113.01
22.77123.04
32.79133.06
42.82143.09
52.84153.12
62.87163.15
72.90173.18
82.92183.22
92.95193.25
102.98203.28
Table 6. Sensitivity analysis of key parameters on the average cost of treating the AD effluent a.
ItemKey ParameterValuesCorresponding Average Cost to Treat the AD Effluent ($/1000 L)Change on the Average Cost to Treat the AD Effluent (%)
Base ValueSensitivity Range
EC reactionRetention time (min)107.5–12.53± 16
EC processCapEx ($)20101508–25133± 0.7
Lifespan of the process2015-253± 1.4
a. All values are adjusted by ±25% of their base values.