Article

Carbon Balance under Organic Amendments in the Wheat-Maize Cropping Systems of Sloppy Upland Soil

1
Key Laboratory of Mountain Surface Processes and Ecological Regulation, Institute of Mountain Hazards and Environment, Chinese Academy of Sciences, Chengdu 610041, China
2
International College, University of Chinese Academy of Sciences, Beijing 100049, China
3
Institute Superior of Agronomy and Veterinary of Faranah (ISAV/F), Faranah 131, Guinea
4
School of Forestry, Environment and Geographical Sciences, College of Agriculture and Environmental Sciences, Makerere University, P.O. Box 7062, Kampala, Uganda
*
Authors to whom correspondence should be addressed.
Sustainability 2020, 12(7), 2747; https://doi.org/10.3390/su12072747
Submission received: 14 January 2020 / Revised: 25 March 2020 / Accepted: 26 March 2020 / Published: 31 March 2020

Abstract

:
With an increasing interest in closing the nutrient loop in agroecosystems, organic amendments are highly recommended as a reliable resource for soil nutrient recycling. However, from a carbon sequestration perspective, not much has been reported on the contribution of different organic amendments to soil organic carbon (SOC), crop carbon (C) uptake, and soil carbon dioxide (CO2) emissions in wheat-maize cropping systems of sloppy upland soil. To fill the knowledge gap, a two-year lysimeter-field plots experiment was conducted in a sloppy upland purplish soil under wheat-maize cropping systems. The experiments were arranged in a complete random block design with five treatment plots, namely; fresh pig slurry as organic manure (OM), crop residues (CR), conventional mineral fertilizers (NPK) as the control, organic manure plus mineral fertilizers (OMNPK), and crop residues plus mineral fertilizers (CRNPK). Our results showed the leaf photosynthesis rate was not significantly increased by organic amendment application treatments compared to NPK treatment, and was within a range of 4.8 to 45.3 µmol m−2 s−1 for the wheat season and −20.1 to 40.4 µmol m−2 s−1 for the maize season across the five treatments and the measured growth stages. The soil CO2 emissions for the maize season (in the range of 203 to 362 g C m−2) were higher than for the wheat season (in the range of 118 to 252 g C m−2) on average across the different experimental treatments over the two-year experiment. The organic amendment application increased annual cumulative CO2 emissions from 30% to 51% compared to NPK treatment. Over the two years, the average crop C uptake ranged from 174 to 378 g C m−2 and from 287 to 488 g C m−2 for the wheat and maize seasons, respectively, and the organic amendment application increased the crop C uptake by 4% to 23% compared to NPK treatment. In the organic amendment treatments, the C balance ranged from −160 to 460 g C m−2 and from −301 to 334 g C m−2 for the wheat and the maize seasons, respectively, which were greater than those in the NPK treatment. Overall, the present study results suggest incorporation of organic amendments could be an effective strategy for increasing C sequestration and sustaining crop productivity in sloppy upland soil.

1. Introduction

Worldwide, a billion tons of organic amendments are incorporated into agricultural soils to recycle nutrients and increase soil organic carbon (SOC) stocks [1,2,3]. The direct application of organic manure to cropland has been reported to increase SOC and supply essential plants nutrients such as carbon(C), nitrogen (N), phosphorus (P), and sulfur (S), which in turn lead to improved agricultural productivity [3,4,5,6]. Previous studies have reported that addition of organic manure contributed to a 16% increase in soil CO2 emissions in a fluvo-aquic soil [7]. Moreover, the application of organic manure and mineral fertilizers were reported to increase the CO2 emissions in red soil from 10,565 kg C ha−1 yr−1 in the control to 28,663 kg C ha−1 yr−1 in wheat-maize rotation systems [8]. In contrast, other studies have reported a significant reduction of CO2 emissions of wheat-maize in croplands with organic manure application [2,9].
Apart from manure, China also produces large quantities of crop residues (about 630 million tons) each year [10]. Of these total crop residues, about 23% are used as forage, while 77% are still burned in open fields and lead to CO2 emissions in the atmosphere [2,10,11]. As a way to reduce the apparent air pollution from open-field crop residue burning, many researchers have expressed interest in utilizing these materials for nutrient recycling in Chinese soils [9,11,12]. Although crop residues can supply nutrients in smaller portions, they can be favorable soil amendments for the long-term supply of crop nutrients [2]. However, there is concern that over-application of organic manure in crop production could potentially elevate greenhouses gas emissions [7,8,13].
Purplish soil is classified as a Pup-Orthic Entisol in the Chinese Soil Taxonomic system and Eutric Regosol in the FAO Soil Classification [14]. In China, purplish soil covers an area equivalent to 160,000 Km2 in the upper Yangtze River, and accounts for 68% of the total croplands in Sichuan Province and 7% of the total China national croplands areas [15,16]. Purplish soils are characterized by low soil carbon content and poor drought resistance [17,18,19], and for this reason they often require constant external fertilization [20]. For years, purplish soils have been fertilized based on industrially made fossil fertilizers, leading to nutrient losses via leaching, thus contributing to water and environmental pollution [21,22]. Nowadays, more research has been conducted aimed at reducing the use of mineral fertilizers while favoring application of agricultural crop residues and animal manure [23,24]. Moreover, purplish soil is low in organic carbon, which affects its productivity and, therefore, efforts geared towards increasing purplish soil organic carbon may have benefits, not only for productivity improvement, but also for soil carbon sequestration as well as CO2 emission reduction [20,25].
However, care needs to be taken when utilizing crop residues and animal manure to avoid excessive CO2 emissions, as has already been reported [7,8,26]. The argument for potential negative impact may be attributed to the type of materials or their mixture, thus, there is need for further research to discover the optimum scenarios to lessen soil CO2 emissions. Besides SOC and CO2 emissions, it has been reported that organic amendment application can increase leaf photosynthesis [27,28]. Leaf photosynthesis and CO2 emissions are directly correlated, indicating that an increase in leaf photosynthesis also results into an increase in substrate supply to belowground, which in turn increases soil CO2 emissions [7].
In the literature, only a few studies have focused on the effect of applying different agricultural by-products on the upland C balance. More importantly, the mechanisms that regulate carbon storage and recycling from organic material amendments, or in combination with mineral fertilizers, are not well documented. To fill the gaps, this study set up field experiments to investigate upland C balance under wheat-maize cropping systems in purplish soil. This study attempted to address some unresolved questions; (i) whether there would be significant effects of organic amendments on leaf photosynthesis, crop C uptake, and soil CO2 emissions, (ii) how the wheat-maize and annual upland C balance vary under different types of organic amendments, and (iii) what the significant contributions of C components from organic amendments to upland C balance. Based on these research questions, we hypothesized that (1) the application of organic amendments under wheat-maize rotation could result in higher crop C uptake and, consequently, higher soil CO2 emission than mineral fertilizers due to increased photosynthesis, and (2) mineral fertilizer application could have less C balance and soil CO2 emissions due to the lack of C substrate inputs in upland soil. The objective of this study was to analyze the effects of different organic amendments on C balance in sloppy upland soil.

2. Materials and Methods

2.1. Experimental Site

The field experiments were conducted at Yanting Agro-Ecological Station of Purplish Soil (31°16′ N, 105°28′ E, and 420 m altitude, Southwest China), which is a research station that belongs to Chinese Ecosystem Research Network (CERN) in Sichuan province. The experimental site has a moderate subtropical monsoon climate, with an annual average air temperature of 17.3 °C and annual precipitation of 824 mm [22]. The monthly precipitation and monthly mean air temperatures during the wheat and maize growing seasons of 2016–2018 were collected from a nearby meteorological station (100 m from the experimental site). The soil was classified as Eutric Regosols in the FAO Soil Taxonomy and Pup-Orthic-Entisols in the Chinese Soil Taxonomy [14,19]. The soil has a clay loam texture, a pH (H2O: Soil of 2.5:1w/w) of 8.22, a bulk density of 1.330 kg m−3, an organic C of 8.75 g kg−1, and a total N of 0.62 g kg−1 [16].

2.2. Experimental Design and Setup

This research was conducted on a long-term experiment platform that started in 2002. This study utilized a complete random block design consisting of five (5) treatments and three replicates under wheat-maize cropping systems in lysimeter plots (Size: 8 × 4 m2, slope: 6.5°). The treatments were; (1) conventional mineral fertilizers (NPK) as a control, (2) fresh pig slurry as organic manure at N application rate equivalent to mineral N in NPK (OM), (3) only crop residues at N equivalent to 20% of applied N in treatment of NPK (CR), (4) fresh pig slurry at N equivalent to 40% mineral N plus 60% mineral N at total N rate equivalent within NPK treatment (OMNPK), and (5) crop residues at 20% equivalent plus 80% mineral N at total N same as in the NPK treatment (CRNPK). All treatments, except for the CR treatment, received a yearly amount of N (280 kg N ha−1), split into 130 kg N ha−1 in the wheat season and 150 kg N ha−1 in the maize season. The mineral N fertilizers applied was urea (NH2)2CO, while the required P (90 kg P2O5 ha−1) and K (36 kg K2O ha−1) were supplied via application of calcium superphosphate and potassium chloride as basal fertilization for both wheat and maize seasons. The applied fresh pig manure slurry had a total nitrogen of 15–16 mg kg−1, total carbon of 350 and 338 mg kg−1, and an average C: N ratio of 22, respectively, during the two seasons. The crop residues used were wheat and maize residues and had a total nitrogen of 5.6 and 9.2 mg kg−1, total carbon of 429.1 and 415.3 mg kg−1, and a C: N ratio of 76.6 and 45.1, respectively, during the two seasons. The long-term experiment provided stable soil conditions for evaluating soil carbon sequestration and was done over two years, during 2016–2018.
Prior to use, residues were cut into small pieces < 5 cm in length and incorporated into the CR and CRNPK treatment plots before the planting of wheat and maize. Chemical fertilizers, manure, and residues were uniformly incorporated into the soil to a depth of 10 cm before sowing. The wheat was sowed in early November and harvested in late May, while the maize was planted in early June and harvested in early October for each year

2.3. Soil Sampling and Measurements

Soil samples were taken from each experimental plot during each gas sampling event for determination of soil ammonia nitrogen (NH4+-N) content, soil nitrate nitrogen (NO3-N) content, and soil dissolved organic carbon (DOC) content. Soil samples were randomly taken from three selected points to a depth of 15 cm using a small flat-bladed stainless steel shovel. After sampling, soil samples were immediately sealed in plastic bags and stored at 4 °C until analysis. During laboratory analysis, soil samples (5 ± 0.5 g) were extracted with 25 mL of 0.5 M K2SO4 solution, and the supernatant were filtered through 0.45 µm membranes. Thereafter, NH4+-N, NO3-N, and DOC in the filtrate was analyzed with an autonalyzer-AA3 (Bran + Luebbe, Norderstedt, Germany).

2.4. Leaf Photosynthesis Measurement

Leaf photosynthesis (Pn), expressed as µmol m−2 s−1, was measured at three growth stages, namely; the elongation stage, the heading stage, and the grain filling stage. These stages were selected because maximum vegetative growth and canopy development are achieved during these stages [29]. The Pn was measured in the morning using a portable open flow gas exchange system (LI-6400XT Photosynthesis system, LI-COR Inc., United States), from the top and middle position of three leaves selected from each sampled plant for each plot. The two positions (top and middle) were chosen in order to ascertain the area of high concentration of active physiological processes [30]. Prior to the measurements, the leaves were acclimatized in a chamber with a reference CO2 concentration fixed at 400 µmol CO2 mol−1 air.

2.5. Soil CO2 Emissions Measurements

Soil CO2 emissions were measured from early November, 2016 to late October, 2017 using a static opaque chamber gas chromatography technique [22,31,32]. Before planting, a stainless steel chamber-base collar (0.50 × 0.50 m) was permanently inserted into the soil to a depth of 10 cm in each plot. The collars were kept in place over the entire measurement period. An insulating material was used to cover the chambers in order to avoid undesired temperature changes. During the first week after organic amendment application, soil CO2 fluxes were measured daily, whilst in the second week of experiments the CO2 fluxes measurements were made every two days. After the second week, the subsequent sampling frequency was changed to twice weekly, and this was maintained throughout the measurement period.
Every morning, between 9:00 am and 11:00 am, the gas samples were taken from the gas collection chambers at regular intervals of 7 min using 50 mL plastic syringes that were fitted to the chambers via Teflon tubes. The collected gas samples were immediately analyzed for their CO2 concentration using a gas chromatograph (GC) (HP 5890II, Hewlett-Packard, California, USA). The full GC configurations for analyzing CO2 gas are reported elsewhere [33]. At each gas sampling interval, both chamber temperature and soil temperature (0–5 cm) were measured using a manual thermocouple thermometer (JM624, Tianjin Jinming Instrument Co. Ltd., Tianjin, China). Meanwhile, the soil moisture (0–5 cm), was measured using a portable frequency domain reflector probe (RDS Technology Co. Ltd, Nanjing, Jiangsu, China).

2.6. Field Crop Productivity Measurements

Crop biomass and yield were measured in triplicates from all the treatment plots in the selected harvest area of 0.25 m2 for wheat, and 1 m2 for maize. The total biomass samples were separated into grains, shoots, and roots. The grains, shoots, and roots were oven dried at 70 °C for 48 hours for the determination of dry weight equivalent and afterward were ground to pass through a 0.5 mm sieve for carbon contents analysis, using an elemental analyzer (Model, Vario El/micro cube, Germany).

2.7. Data Analysis

Soil moisture was expressed as water-filled pore space (WFPS), which was calculated using Equation (1):
WFPS = SWC   ( % ) BD 1 BD 2.65 100
where SWC is the soil volumetric water content, BD is the soil bulk density, and 2.65 g cm−3 is the theoretical particle density.
Soil CO2 emissions were calculated following Equation (2) [34].
F = ρ V P 100 273 d C A P o ( 273 + T ) d t 60
where F is the soil CO2 emissions (mg m−2 hr−1), ρ is the density of CO2 under standard atmospheric condition (mg m−3), V is the volume of the static chamber (cm3), A is the area of the static chamber (cm2), P is the atmospheric pressure in the static chamber (Pa), Po is the atmospheric pressure under standard atmospheric condition (1.013×10⁵ Pa), T is the atmospheric temperature (°C), and dC/dt is the change in CO2 concentration.
Cumulative soil CO2 emissions were calculated, as shown in Equation (3) [34].
C = Σ ( F i + 1 + F i ) 2 ( t i + 1 t i ) 24
where C is the cumulative soil CO2 fluxes expressed as (g C m−2 yr−1), while F is the soil CO2 emissions (mg m−2 hr−1), i is the sampling numbers, and t is the day after planting.
The crop C uptake was calculated based on the sum of harvested grain yield and shoot and root biomass yield, which was then multiplied by their respective carbon content in percent, as shown in Equation (4) [20,35].
Crop   C   uptake = Grain C ( % ) ( G r a i n ) + S h o o t C ( % ) ( S h o o t ) + R o o t C   ( % ) ( R o o t )
The upland C balance was calculated as shown in Equation (5) [36].
Upland   C   balance = C i n p u t s C e x p o r t s
where Cinputs = Fmanure + root C uptake (for OM and NPK treatments) and Cinputs = Fcrop residues + shoot C uptake + root C uptake (for CR treatments), Cexports = grain C uptake + shoot C uptake + soil CO2 emissions + sediment C loss + DOC loss fluxes (for the OM and NPK treatments), and Cexports = grain C uptake + soil CO2 emissions + sediment C loss + DOC loss fluxes (for CR treatments).
Analysis of variance (one-way ANOVA) was used to test the effects of different treatments on leaf photosynthesis rate at three growths stages, seasonal crop productivity, seasonal and annual C balance components in IBM SPSS Statistics 21.0 (IBM, Inc., USA). Data are reported as mean and standard error of the mean (±SE). Significant differences in the means of estimated parameters among treatments were verified by the least significant difference test (LSD), at 95% confidence level (p < 0.05). The relationships between crop C uptakes, leaf photosynthesis, and shoot and root biomasses were evaluated using a linear regression. The data graphics were drawn using Sigma plot software (version 12.5, Systat, Inc, USA).

3. Results

3.1. Climate Conditions

The monthly precipitation and air temperature during the wheat and maize growing periods are shown in Figure 1. The annual precipitation from 2016, 2017, and 2018 were 885.5 mm, 622.7 mm, and 730.5 mm, respectively, of which 66% occurred during the maize season with a higher mean monthly precipitation of 160.8 mm in July and the lower of 11.6 mm in January (Figure 1a). The monthly mean air temperature over the two years was in the range of 5.7 to 21.3 °C for the wheat season and 16.2 to 27.4 °C for the maize season (Figure 1b). The mean annual precipitation and mean annual air temperature were comparable to the long-term average of the experimental site.

3.2. Soil Temperature and Soil Water-Filled Pore Space

The seasonal dynamics in the mean soil temperature and mean soil water-filled pore space (WFPS) of the top soil (0-15 cm) across the five treatments are presented in Figure 2. The mean soil temperature (5 cm depth) ranged from 6.4 to 21.3 °C for the wheat season and 17.9 to 29.3 °C for the maize season in 2016/2017, and from 3.7 to 21.5 °C for the wheat season and 17.5 to 28.0 °C for the maize season in 2017/2018 across the five treatments (Figure 2a). Similarly, the mean WFPS ranged from 20.0% to 60.5% for the wheat season and 14.1% to 85.6% for the maize season in 2016/2017, and from 15.5% to 65.5% for the wheat season and 13.3% to 62.8% for the maize season in 2017/2018 (Figure 2b). The average seasonal and annual soil temperature and mean soil WFPS are shown in Table S1.

3.3. Soil Ammonia Nitrogen, Nitrate Nitrogen and Dissolved Organic Carbon

The average seasonal and annual variations in soil ammonia nitrogen (NH4+-N) content, soil nitrate nitrogen (NO3-N) content, and soil dissolved organic carbon (DOC) of top soil (0–15 cm) across the five treatments for the wheat and the maize seasons over the two-year experiment are presented in Table 1.
The average soil NH4+-N content ranged from 1.7 to 2.8 mg N kg−1 in the wheat season, from 1.7 to 2.0 mg N kg−1 in the maize season, and from 1.8 to 2.4 mg N kg−1 annually for the five treatments. The highest NH4+-N content was observed in the NPK treatment in the wheat season and after OM amendment in the maize season (Table 1). The average soil NO3-N content ranged from 8.9 to 47.8 mg N kg−1 for the wheat season, while it ranged from 11.3 to 25.8 mg N kg−1 for the maize season. Conversely, the annual soil NO3-N content ranged from 10.0 to 27.1 mg N kg−1 for the five treatments. The highest value of NO3-N content was observed in NPK treatment for the wheat season and in OM treatment for the maize season (Table 1). The average soil DOC content ranged from 81.6 to 99.1 mg C kg−1 in the wheat season, from 76.3 to 99.1 mg C kg−1 for the maize season, and 79.4 to 99. 1 mg C kg−1 annually for the five treatments. The CRNPK treatment showed the highest soil DOC content, both in the wheat and the maize seasons (Table 1, Figure S3).

3.4. Change in Leaf Photosynthesis Rate

Figure 3 shows the changes in leaf photosynthesis rate (Pn) at the elongation stage, heading stage, and grain filling stage of the wheat and the maize seasons in the period 2016-2017. The Pn values for the wheat season at the elongation stage were 25.0 µmol m−2 s−1 for OM, 28.9 for NPK, and 24.8 for OMNPK, which were not significantly different from each other (p > 0.05), but significantly greater than CR and CRNPK treatments (p < 0.05). By contrast, the Pn for CR treatment in the wheat season at the heading stage and grain filling stage were 38.4 µmol m−2 s−1 and 45.3 µmol m−2 s−1, respectively, which was significantly higher than other treatments (p < 0.05) (Figure 3a).
Conversely, the Pn values for the maize season at the elongation stage were in the range of 30.4 to 35.3 µmol m−2 s−1 and showed no significant difference between the five treatments (p > 0.05). However, the Pn values for the maize season at the heading stage were 37.4 µmol m−2 s−1 for OM, 35.6 µmol m−2 s−1 for CR, 35.6 µmol m−2 s−1 for NPK, 37.3 µmol m−2 s−1 for OMNPK, and 40.4 µmol m−2 s−1 for CRNPK. The Pn for CRNPK was significantly higher than CR and NPK treatments but did not significantly differ from the OM and OMNPK treatments. There was a decline in Pn in the maize season at the grain filling stage, with negative values and no significant difference observed between the five treatments (p > 0.05) (Figure 3b).

3.5. Change in Crop Productivity

Seasonal grain yields and yield of shoot and root biomass over the two-year experiment are shown in Figure 4. The wheat grain yields ranged from 129 to 314 g m−2 for the five treatments. The wheat grain yields for the OM and OMNPK treatments were significantly higher compared to the other treatments in 2016/2017 (Figure 4a). While an increase in wheat grain yields was observed in 2017/2018, which was in the range of 180 to 463 g·m−2, OM treatment showed significantly higher wheat grain yields compared to the other treatments (p < 0.05) (Figure 4d). The wheat shoot biomass ranged from 288 to 574 g·m−2. The wheat shoot biomass for the NPK, OM, OMNPK, and CRNPK treatments showed no significant difference from each other (p > 0.05) in 2016/2017 (Figure 4b). However, a decrease in the wheat shoot biomass was observed in 2017/2018 and was in the range of 159 to 337 g m-2, with the OM treatment significantly greater than the other treatments (p < 0.05) (Figure 4e). The wheat root biomass ranged from 31 to 75 g m-2 and showed no significant difference between the OM, NPK, OMNPK, and CRNPK treatments in 2016/2017 (Figure 4c), while the wheat root biomass in 2017/2018 was in the range of 43 to 86 g m-2, and the OM, OMNPK, and CRNPK treatments were significantly greater compared to the NPK treatment (p < 0.05) (Figure 4f).
On the other hand, the maize grain yields were in the range of 192 to 489 g m−2. The maize grain yields from the NPK, OMNPK, and CRNPK treatments were not significantly different from each other (p > 0.05), but were significantly higher compared to the OM treatment in 2016/2017 (p < 0.05) (Figure 4a). By contrast, the maize grain yields were in the range of 398 to 578 g m−2, with no significant difference among the OM, NPK, OMNPK, and CRNPK treatments in the 2017/2018 period (Figure 4d). The maize shoot biomass was in the range of 344 to 655 g m−2 and showed no significant difference between the NPK, OM, OMNPK, and CRNPK treatments (p > 0.05) in 2016/2017 (Figure 4b). On the other hand, the maize shoot biomass ranged from 308 to 466 g m−2, with no significant difference in yields from the OM, NPK, and CRNPK treatments in 2017/2018 (Figure 4e). Furthermore, the maize root biomass ranged from 44 to 115 g m−2, while root biomass from the OM and CRNPK treatments were significantly higher compared to root biomass from the NPK treatment in 2016/2017 (Figure 4c). By contrast, the maize root biomass of the OM treatment was significantly higher compared to the other treatments in 2017/2018 (Figure 4f).

3.6. Carbon Fluxes

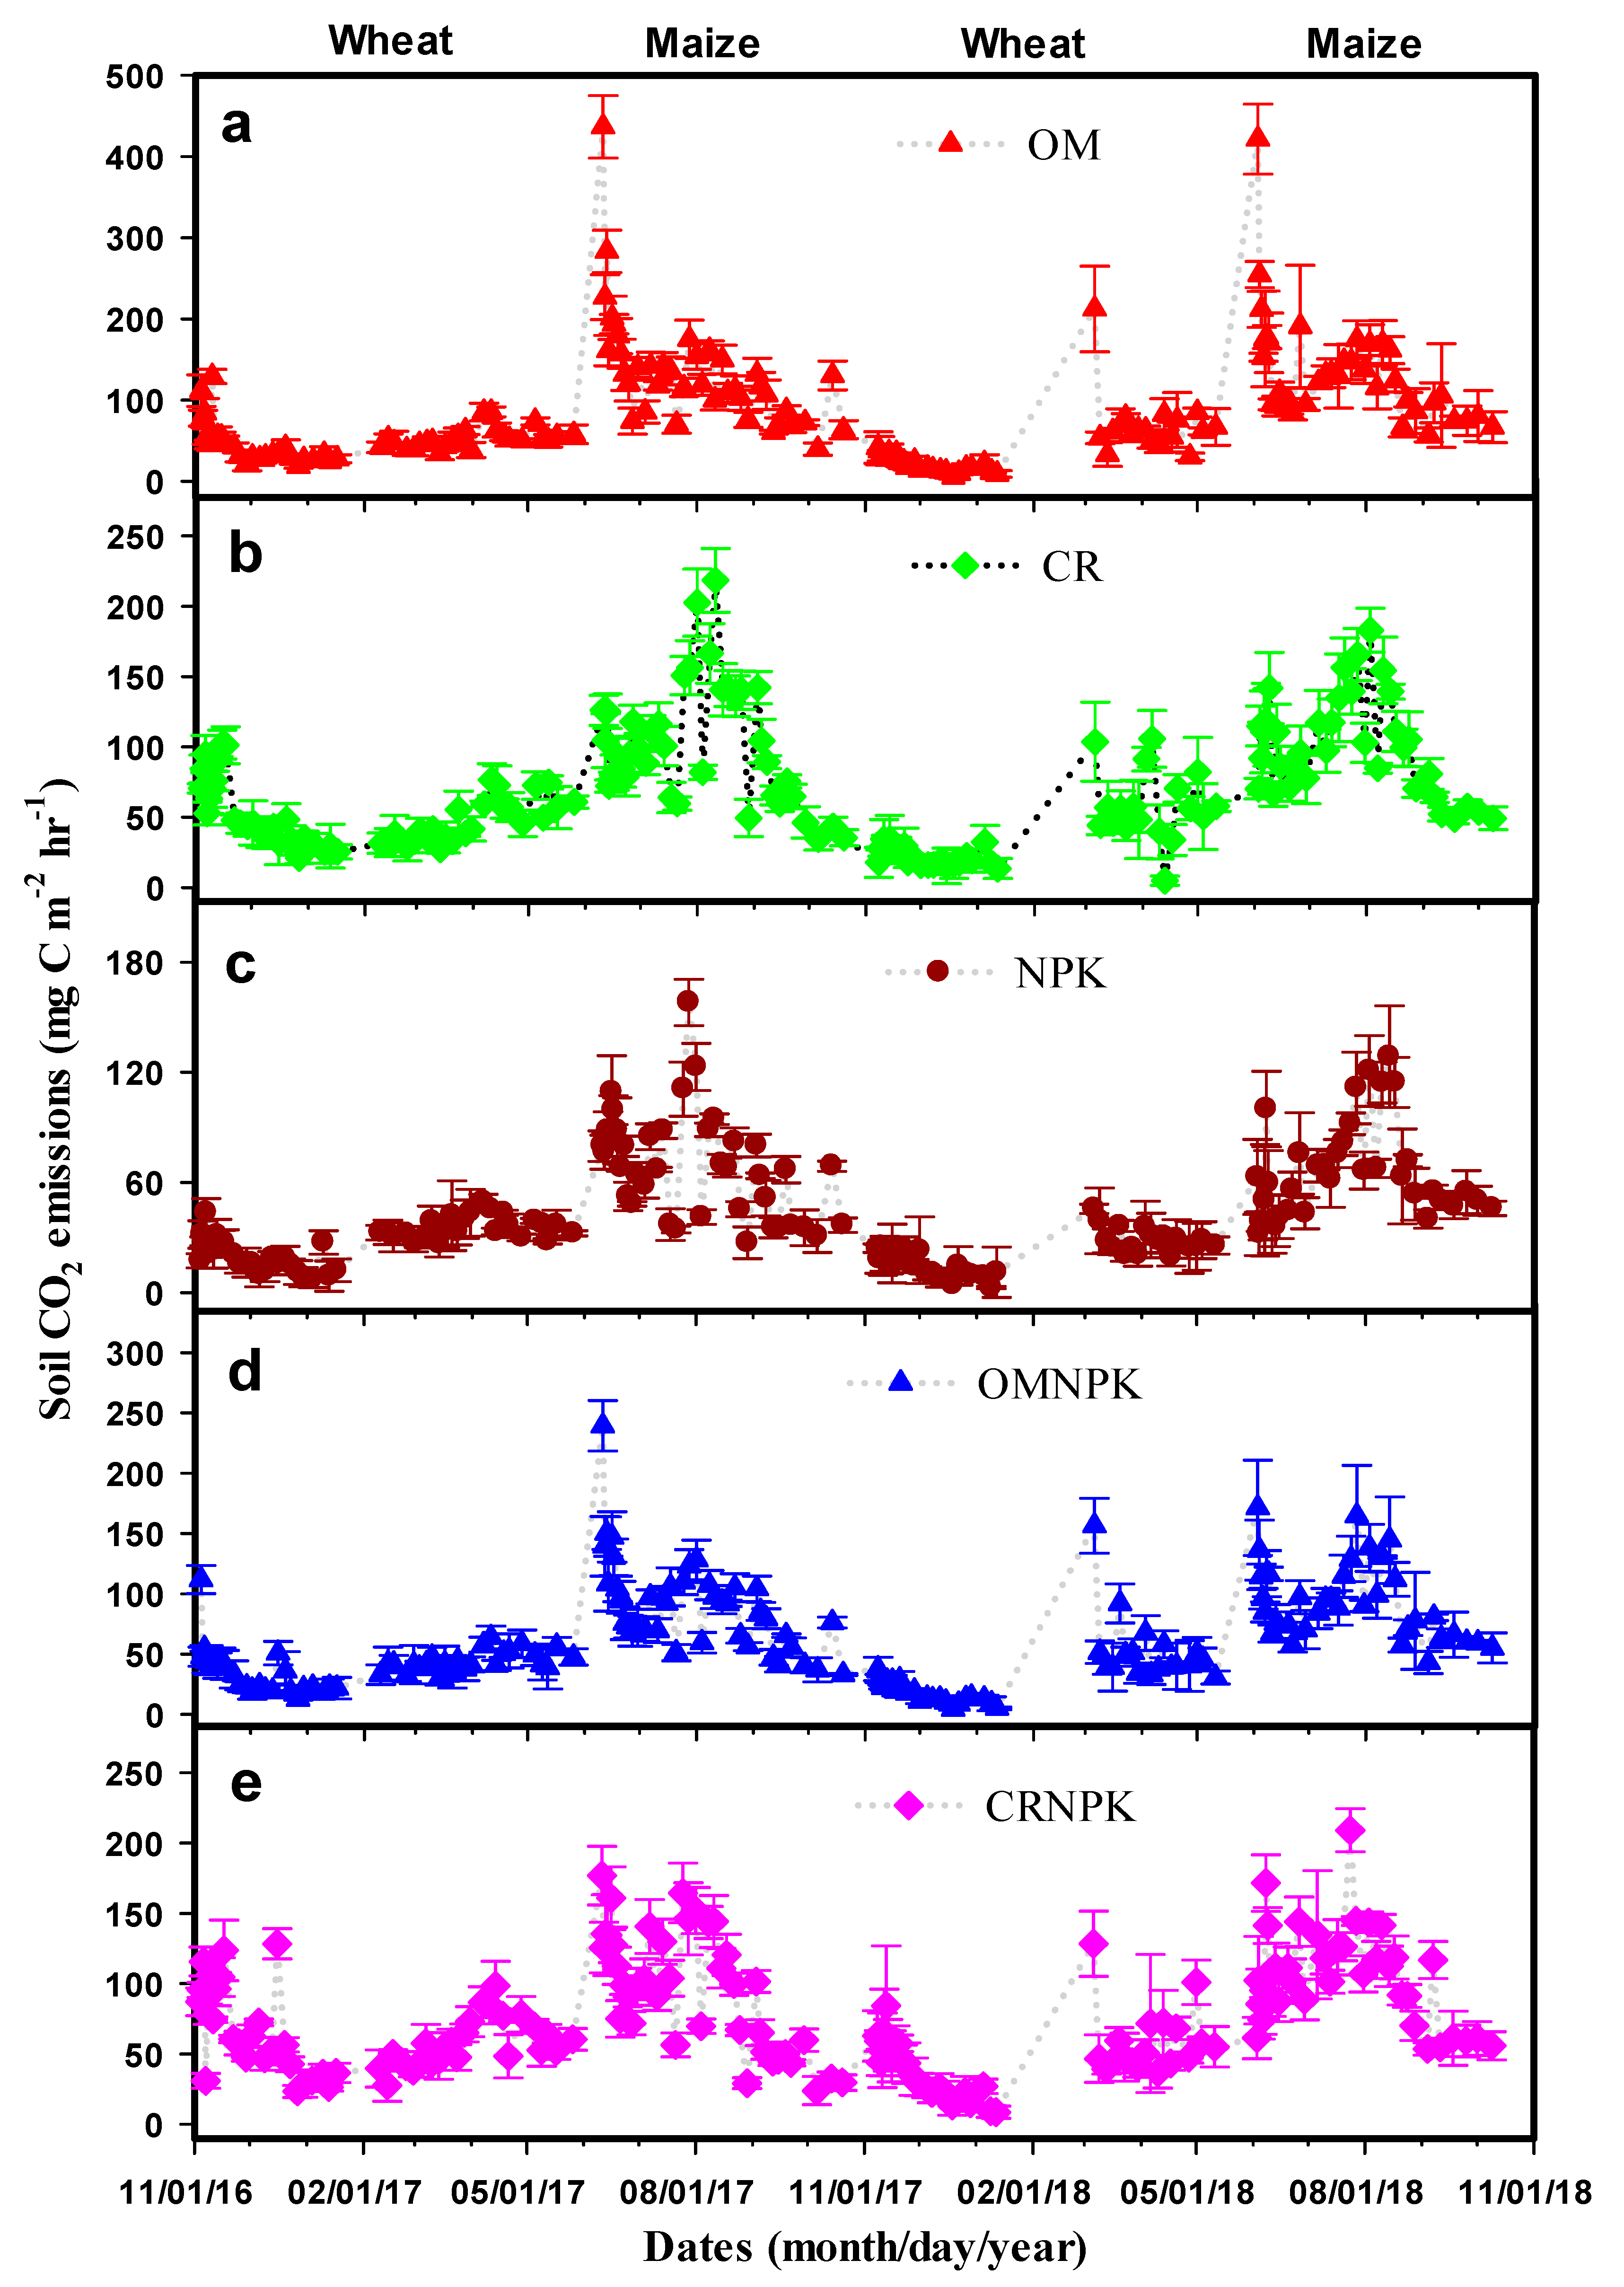
3.6.1. Seasonal Variation of Soil CO2 Emissions

Soil CO2 emissions showed a decreasing trend in the wheat season and an increasing trend in the maize season for the five treatments over the two-year experiment (Figure 5). During the wheat season, the soil CO2 emissions ranged from 18.6 to 129.1 mg C m-2 hr-1 in 2016/2017 and 4.5 to 212.3 mg C m−2 hr−1 in 2017/2018 for OM (Figure 5a), from 21.0 to 101.7 mg C m−2 hr−1 in 2016/2017 and 5.0 to 105.8 mg C m−2 hr−1 in 2017/2018 for CR (Figure 5b), from 7.5 to 49.6 mg C m−2 hr−1 in 2016/2017 and 2.8 to 45.7 mg C m−2 hr−1 in 2017/2018 for NPK (Figure 5c), from 12.5 to 111.8 mg C m−2 hr−1 in 2016/2017 and 4.4 to 156.4 mg C m−2 hr−1 in 2017/2018 for OMNPK (Figure 5d), and from 23.4 to 128.2 mg C m−2 hr−1 in 2016/2017 and 8.6 to 128.4 mg C m−2 hr−1 in 2017/2018 for CRNPK (Figure 5e).
Furthermore, during the maize season, the soil CO2 emissions ranged from 39.5 to 436.6 mg C m−2 hr−1 in 2016/2017 and 57.1 to 421.5 mg C m−2 hr−1 in 2017/2018 for OM (Figure 5a), from 34.5 to 218.4 mg C m−2 hr−1 in 2016/2017 and 48.7 to 183.0 mg C m−2 hr−1 in 2017/2018 for CR (Figure 5b), from 27.1 to 158.1 mg C m−2 hr−1 in 2016/2017 and 32.1 to 128.5 mg C m−2 hr−1 in 2017/2018 for NPK (Figure 5c), from 32.9 to 239.2 mg C m−2 hr−1 in 2016/2017 and 42.9 to 171.3 mg C m−2 hr−1 in 2017/2018 for OMNPK (Figure 5d), and from 23.9 to 176.8 mg C m−2 hr−1 in 2016/2017, and 53.5 to 209.0 mg C m−2 hr−1 in 2017/2018 for CRNPK (Figure 5e). The highest peaks of soil CO2 emissions were observed in the OM treatment in both the wheat and the maize seasons.
There were significant differences in the seasonal and annual cumulative soil CO2 emissions among the five treatments (p < 0.05), as shown in Table 2. Across the five treatments, the seasonal cumulative soil CO2 emissions ranged from 134 to 280 g C m−2 for the wheat season and from 204 to 363 g C m−2 for the maize season in 2016/2017, while the seasonal cumulative soil CO2 emissions ranged from 102 to 257 g C m−2 for the wheat season and from 203 to 361 g C m−2 for the maize season in 2017/2018. Conversely, the annual cumulative soil CO2 emissions in the 2016/2017 period was in the range of 362 to 678 g C m−2, whilst in 2017/2018, the range was 337 to 739 g C m−2 (Table 2).

3.6.2. Seasonal Crop C Uptakes

The results of crop C uptake are summarized in Table 2. The crop C uptake across the five treatments was in the range of 187 to 389 g C m−2 for the wheat season and 239 to 525 g C m−2 for the maize season in 2016/2017, while in 2017/2018, the crop C uptake ranged from 162 to 368 g C m−2 for the wheat season and from 334 to 508 g C m−2 for the maize season. There were significant differences (p < 0.05) in the crop C uptake in the maize season compared to the wheat season for both years. The annual crop C uptake ranged from 426 to 873 g C m−2 in 2016/2017 and from 496 to 876 g C m−2 in 2017/2018 (Table 2). The seasonal and annual grain C uptake, shoot C uptake, and root C uptake over the two-year experiment are shown in Table S2 (Supplementary Materials), while the carbon contents (%) of grain and shoot and root biomass of the wheat and the maize for the five treatments over the two-year experiment is shown in Table S3 (Supplementary Materials).

3.6.3. Sediment C Loss and Soil Dissolved Organic Carbon Loss Fluxes

There was no sediment C loss in the wheat season, while in the maize season, sediment C loss ranged from 13.8 to 30.7 g C m−2 in 2017 and from 19.6 to 74.6 g C m−2 in 2018. During the maize season, a significant difference (p < 0.05) in sediment C loss was observed among the five treatments, as shown in Table 2. Furthermore, dissolved organic carbon (DOC) loss fluxes were only observed in 2016/2017 and ranged from 0.15 to 21 g C m−2 in 2016/2017 and from 0.26 to 0.27 g C m−2 during the maize season in 2017/2018. The DOC loss fluxes showed no significant difference between the five treatments (p > 0.05) in both periods from 2016–2018 (Table 2). The sediment C loss showed significant difference between the five treatments (p < 0.05) (Table 2). The sediment C content (%) and soil sediment loss over the two-year experiment are shown in Table S4 (Supplementary Materials).

3.6.4. Seasonal and Annual C Balance

The seasonal and annual C balance and the C balance components are shown in Table 3. From Table 3, the C balance for the wheat season were 460 g C m−2 for OM, 1 g C m−2 for CR, −226 g C m−2 for NPK, 26 g C m−2 for OMNPK, and −160 g C m−2 for CRNPK, while in the maize season, the C balance was 334 g C m−2 for OM, −152 g C m−2 for CR, −482 g C m−2 for NPK, 72 g C m−2 for OMNPK, and −301 g C m−2 for CRNPK. The C balance observed for the OM treatment was significantly higher compared to the other treatments (p < 0.05) (Table 3). Conversely, the annual C balances were significantly different from each other (p < 0.05) across the five treatments and were in the range of −683 to 687 g C m−2. Notably, the C balance was positive for the OM, CR, and CRNPK treatments and negative for the NPK and OMNPK treatments, both in the wheat and the maize seasons. The C balance for OM and CRNPK were significantly higher compared to the NPK and OMNPK treatments (p < 0.05) (Table 3).
Generally, across the five treatments, the average organic amendments (Famendments) contribution to C balance accounted for 32% in the wheat season, 28% in the maize season, and 29% annually, while the mean soil CO2 emission contribution to C balance accounted for 27%, both in the wheat and the maize seasons, and 28% annually, (Figure 6). On average, the crop C uptake contributed to 41% of the C balance, both in the wheat and the maize seasons, and about 41% to the annual C balance (Figure 6). Furthermore, sediment C loss accounted for 7%, while DOC loss fluxes resulted in the lowest contribution to C balance (Figure 6). Overall, the results showed that Famendments, crop C uptake (grain C uptake and shoot C uptake), and soil CO2 emissions were the major contributors to the C balance.

3.7. Relationships between Crop C Uptake and C Components and Crop Productivity

Pearson correlation was performed to understand the factors influencing crop C uptake and soil CO2 emissions. From the analysis output, the crop C uptake, grain C uptake, shoot C uptake, root C uptake, and dissolved organic carbon loss fluxes were positively correlated in both the wheat and the maize seasons (Table 4). By contrast, crop C uptake, soil CO2 emissions, and sediment C loss were not significantly correlated (p > 0.05) (Table 4). Interestingly, significant positive correlations were observed between the crop C uptake, the grain yields, and the shoot and the root biomass in both the wheat and the maize seasons (p < 0.0001) (Figure 7).

4. Discussion

4.1. Changes in Leaf Photosynthesis and Crop C Uptake under Organic Amendments

Our results showed that leaf photosynthesis rate (Pn) varied from 4.8 to 45.3 µmol m−2 s−1 for the wheat season, and from −20.1 to 40.4 µmol m−2 s−1 for the maize season across the five treatments and the three growth stages. Our findings on Pn are corroborated by other studies, which reported similar ranges [37] under wheat-maize rotation systems, but higher than that of 33.12 μmol m−2 s−1 reported by [38]. Consistent with the finding of [38], the Pn during the maize season at the grain filling stage declined (Figure 3). Interestingly, the average Pn was higher for maize (C4 plant) than for wheat (C3 plant) at the elongation stage and the heading stage (Figure 3). This trend could be explained based on a previous report by [39]. The higher Pn values of the maize could be attributed to rapid canopy development following the rapid crop growth rates over the entire growing season, as suggested by [39]. It then follows that the observed decrease in Pn could be attributed to a reduction in the number of chloroplasts and grana that limits leaf photosynthetic activity [40,41].
Our results further indicated that organic amendments, compared to NPK, did not improve the Pn and this is in agreement with the study reported by [42]. By contrast, previous studies have demonstrated that organic fertilizer application increased Pn in soybean crops, as reported by [40,41]. The reduced Pn in the NPK treatment could be attributed to excess vegetative growth as a result of rapid fertilization, which caused a weak irradiance incident to the leaf due to shading from vigorous leaf development [43,44]. On the other hand, the difference in Pn between the wheat and the maize seasons across the five treatments at different growth stages might be due to the genotypic variations in structural and biochemical characteristics, and the inhibition of photosynthesis resulting from the difference in sink size and capacity [45,46]. This finding is corroborated by [47], who concluded that an increase in Pn did not result in an increase in crop yield.
Similarly, the high Pn did not lead to an increase in crop productivity due to the sink limitation and limited enhancement of metabolism levels that could regulate the biomass production, as demonstrated by [48].
The significant differences in crop C uptake between the organic amendment treatments combined with mineral NPK and sole NPK were observed, suggesting that higher N mineralization and utilization could be a plausible reason for the increase in biomass production [2,8,49]. Previous studies reported that organic amendments (only) without mineral fertilizer led to low biomass and crop yield compared to applying conventional fertilizers [50,51]. In this study, it is suggested that the combination of organic amendments and mineral fertilizers could be the best practice for increasing wheat-maize grain yield compared to only NPK [13]. Over the two-year experiment, the average crop C uptake varied from 174 to 378 g C m−2 (mean: 298 g C m−2) across the five treatments in the wheat season (Table 2). The observed crop C uptake in our study was lower than the 410 g C m−2 reported by [38], and the 630 g C m−2 reported by [52], but higher than the 272 g C m−2 reported by [53]. During the maize season, crop C uptake ranged from 287 to 488 g C m−2 (mean: 429 g C m−2) across the five treatments (Table 2), and was higher than the 328 g C m−2 reported by [53]. The annual crop C uptake was in the range of 461 to 853 g C m−2 yr−1 (mean: 727 g C m−2 yr−1) across the five treatments, and was lower than 780 to 805 g C m−2 yr−1 reported by [38] on average basis. In addition, significant linear relationships were observed between crop C uptake and grain yields and shoot and root biomass in both the wheat and maize seasons (Figure 7), thus indicating that the above-mentioned parameters play a main regulatory role in crop C uptake [38]. By contrast, crop C uptake was negatively correlated with leaf photosynthesis (Pn) in the wheat season, but positively correlated with leaf photosynthesis in the maize season (Figure S1 in Supplementary Materials). These results indicate that the increase in the Pn led to an increase in crop C uptake during the maize growing season. Our findings suggests that, under organic amendments, grain yields, shoot biomass, and root biomass were more important in regulating crop C uptake than the other factors.

4.2. Effects of Organic Amendments on Soil CO2 Emissions

The soil CO2 emissions is influenced by organic amendment application and some environmental factors [7,8]. Consistent with the report of [38], average cumulative soil CO2 emissions over the two-year experiment were significantly lower during the wheat season, ranging from 118 to 252 g C m−2, and higher during the maize season, ranging from 203 to 362 g C m−2 for the five treatments, and differed significantly from each other (Table 2). Results from this study demonstrated that organic amendments abate CO2 emissions during the wheat and the maize seasons. Furthermore, annual cumulative CO2 emissions in this study were in the same range, with annual cumulative CO2 emissions of 188, 346, and 556 g C m−2 yr−1 for NPK and 228, 401, and 617 g C m−2 yr−1 for OM, respectively, as those reported after long-term mineral and organic fertilization of fluvo-aquic soil by [7]. Even though the annual mean CO2 emissions in this study were lower than the reported value in North China Plain [37], they were still in line with [8], who reported that the annual cumulative CO2 emissions for mineral fertilizers (NPK) varied from 390.1 to 491.8 g C m−2 yr−1 and from 471.7 to 1187.7 g C m−2 yr−1 for combined pig manure and mineral fertilizer (OMNPK) in a long-term experiment under wheat-maize cropping systems in China. The relatively slight difference between these results could be attributed to the difference in nitrogen application rate and soil properties, because soil properties have been found to affect soil CO2 emissions [54,55].
Stepwise multiple linear regressions showed that soil temperature, soil water-filled pore space (WFPS) (Figure S2 in Supplementary Materials), and soil substrates of NH4+-N, NO3-N, and DOC content influenced soil CO2 emissions during the wheat season (p < 0.0001) (Figure S3 in Supplementary Materials), while, during the maize season, only soil temperature and soil substrates of NO3-N, and DOC content were the most influential factors of the soil CO2 emissions across the five treatments (p < 0.0001) (Figure S3). Our study found that, compared with NPK treatment, the organic amendment treatments contributed to an increase of average soil CO2 emissions by 37% to 53% in the wheat season and by 22% to 44% in the maize season over the two-year experiment (Table 3). The observed trend could be attributed to the increased SOC, which, upon mineralization and rhizosphere respiration, results in an increase in CO2 emissions [7,55]. Moreover, increased photosynthate allocation to the roots can increase exudates, which can be used as a carbon source for the soil microbes to stimulate root respiration [56,57]. These results suggested that organic material (C substrate) incorporation in upland soil could be more important in regulating soil CO2 emissions than the soil microclimate [41,58,59].

4.3. Influence of Organic Amendments on C Balance

Significant differences were observed in C balance between organic amendment treatments across the wheat and maize seasons, and annually (Table 3). Our results were in lines with those of −460 to 765 g C m−2 yr−1 reported by [38], and −293 to 730 g C m−2 yr−1 reported by several previous studies [52,60,61]. Furthermore, our results showed that upland C balance of NPK and OMNPK treatments acted as significant carbon sinks, while the treatments OM, CR, and CRNPK (p < 0.05) acted as strong carbon sources, indicating that organic amendments possess a high carbon sequestration potential [2]. Comparatively for all treatments studied, our results showed that organic manure (OM) and crop residues (CR and CRNPK) inputs were the most promising measures for sequestering carbon in upland soil. The negative C balance for NPK and OMNPK treatments that was observed in this study could be attributed to the lower C inputs and soil CO2 emissions, because, for those treatments, only root biomass was considered as a C source and all shoot biomass was removed from the field plots experiment. For reliable C balance estimation, soil C stocks are needed to calculate the inputs and outputs under field condition, as suggested by [36]. According to the study by [62], about 30% to 50% of the background soil organic carbon is lost from Chinese agricultural soils, due to the lack of proper soil management. Our study has provided promising results to mitigate the above situation, whereby the organic amendments that were applied, on average, contributed to a C balance of about 32% and 28% in the wheat and the maize seasons for the five treatments (Figure 6). The annual grain C uptake, shoot C uptake, and soil CO2 emission contribution to the annual C balance were, on average, about 17%, 20%, and 28%, respectively, across the five treatments (Figure 6). Among the organic amendments, the CRNPK treatment could be the best option for mitigating soil CO2 emissions, while maintaining higher crop productivity. Based on our findings, organic material C inputs to upland soil can be useful for estimating the organic amendment effects on agro-ecosystems C cycling and could have significant sustainability implication for Chinese intensive wheat-maize cropping systems [2,3,22].

5. Conclusions

The organic amendment treatments had significant influence on leaf photosynthesis, crop C uptake, and soil CO2 emissions, but marginal effects on wheat-maize crop productivity. Except for the incorporation of crop residues only, organic amendment application could sustain crop productivity as compared to the control (NPK). The organic amendments showed higher soil CO2 emissions compared to the NPK treatment, which confirmed our hypothesis that organic amendments could result in higher crop C uptake and soil CO2 emissions compared to mineral fertilizers. Nonetheless, our results showed that partially substituting mineral fertilizers with long-term organic amendments of upland purplish soil has the potential to improve crop productivity by increasing soil organic carbon crop C uptake, and thus promoting carbon sequestration. Overall, the findings implied that C inputs, grain C uptake, shoot C uptake, and soil CO2 emissions were the main contributors to the C balance of upland soil.

Supplementary Materials

The following are available online at https://www.mdpi.com/2071-1050/12/7/2747/s1, Table S1: Average seasonal and annual variations of soil CO2 emissions, soil temperature, and soil water-filled pore space for the five treatments over the two-year experiment of 2016–2018; Table S2: Average seasonal and annual grain C uptake, shoot C uptake, and root C uptake for the five treatments over the two-year experiment of 2016–2018; Table S3: Carbon content of grain, shoot biomass, and root biomass, both in the wheat and the maize seasons, for the five treatments over the two-year experiment of 2016–2018; Table S4: Mean sediment C content and sediment loss for the five treatments over the two-year experiment of 2016–2018; Figure S1: Relationships between crop C uptake and leaf photosynthesis rate in the wheat and the maize seasons in 2016–2017 across the five treatments; Figure S2: Relationships between the wheat and the maize season’s soil CO2 emissions and soil temperature (a–b), and soil CO2 emissions and soil water-filled pore space (WFPS) (c–d) across the five treatments over the two-year experiment of 2016–2018; Figure S3: Relationships between the wheat and the maize season soil CO2 emissions and soil NH4+-N (a–b), soil CO2 emissions and soil NO3-N (c–d), and soil CO2 emissions and soil DOC (e–f) across the five treatments over the two-year experiment of 2016–2018; Figure S4: Annual discharges of runoff water from the overland flow and the interflow from the five treatments over the two-year experiment of 2016–2018.

Author Contributions

Conceptualization, H.B. and M.Z.; data curation, H.B.; formal analysis, H.B. and M.Z.; funding acquisition, B.Z.; methodology, H.B., R.X., S.T.R., and Z.D.; supervision, M.Z. and B.Z.; writing—original draft, H.B; writing—review and editing, H.B., S.K., M.Z., Z.D., and B.Z. All authors have read and agreed to the published version of the manuscript.

Funding

This research was funded by Major Science and Technology Program for Water Pollution Control and Treatment (Grant No. 2017ZX07101001) and the National Key R&D Program (grant No. 2017YFD0200105).

Acknowledgments

The authors would like to acknowledge the CAS-TWAS President’s Fellowship for international Ph.D. students. The authors greatly appreciated the constructive comments from anonymous reviewer’s, which helped improve this manuscript.

Conflicts of Interest

The authors declare no conflict of interest.

References

  1. Thangarajan, R.; Bolan, N.S.; Tian, G.; Naidu, R.; Kunhikrishnan, A. Role of organic amendment application on greenhouse gas emission from soil. Sci. Total Environ. 2013, 465, 72–96. [Google Scholar] [CrossRef] [PubMed]
  2. Liu, C.; Lu, M.; Cui, J.; Li, B.; Fang, C. Effects of straw carbon input on carbon dynamics in agricultural soils: A meta-analysis. Glob. Chang. Biol. 2014, 20, 1366–1381. [Google Scholar] [CrossRef]
  3. Zhou, M.; Zhu, B.; Wang, S.; Zhu, X.; Vereecken, H.; Brüggemann, N. Stimulation of N2O emission by manure application to agricultural soils may largely offset carbon benefits: A global meta-analysis. Glob. Chang. Biol. 2017, 23, 4068–4083. [Google Scholar] [CrossRef] [PubMed]
  4. Laird, D.A.; Chappell, M.A.; Martens, D.A.; Wershaw, R.L.; Thompson, M. Distinguishing black carbon from biogenic humic substances in soil clay fractions. Geoderma 2008, 143, 115–122. [Google Scholar] [CrossRef]
  5. Pagliari, P.H.; Laboski, C.A. Investigation of the inorganic and organic phosphorus forms in animal manure. J. Environ. Qual. 2012, 41, 901–910. [Google Scholar] [CrossRef] [PubMed]
  6. He, Z.Q.; Pagliari, P.H.; Waldrip, H.M. Applied and environmental chemistry of animal manure: A review. Pedosphere 2016, 26, 779–816. [Google Scholar] [CrossRef]
  7. Ding, W.; Meng, L.; Yin, Y.; Cai, Z.; Zheng, X. CO2 emission in an intensively cultivated loam as affected by long-term application of organic manure and nitrogen fertilizer. Soil Biol. Biochem. 2007, 39, 669–679. [Google Scholar] [CrossRef]
  8. Zhai, L.M.; Liu, H.B.; Zhang, J.Z.; Huang, J.; Wang, B.R. Long-term application of organic manure and mineral fertilizer on N2O and CO2 emissions in a red soil from cultivated maize-wheat rotation in China. Agric. Sci. China 2011, 10, 1748–1757. [Google Scholar] [CrossRef]
  9. Huang, T.; Yang, H.; Huang, C.; Ju, X. Effect of fertilizer N rates and straw management on yield-scaled nitrous oxide emissions in a maize-wheat double cropping system. Field Crop Res. 2017, 204, 1–11. [Google Scholar] [CrossRef]
  10. Liu, H.; Jiang, G.; Zhuang, H.; Wang, K. Distribution, utilization structure and potential of biomass resources in rural China: With special references of crop residues. Renew. Sustain. Energy Rev. 2008, 12, 1402–1418. [Google Scholar] [CrossRef]
  11. Zhang, G.; Wang, X.; Zhao, H.; Sun, B.; Lu, F.; Hu, L. Extension of residue retention increases net greenhouse gas mitigation in China’s croplands. J. Clean. Prod. 2017, 165, 1–12. [Google Scholar] [CrossRef]
  12. Zheng, Y.; Li, Z.; Feng, S.; Lucas, M.; Wu, G.; Li, Y.; Li, C.; Jiang, G. Biomass energy utilization in rural areas may contribute to alleviating energy crisis and global warming: A case study in a typical agro-village of Shandong, China. Renew. Sustain. Energy Rev. 2010, 14, 3132–3139. [Google Scholar] [CrossRef]
  13. Sarma, B.; Borkotoki, B.; Narzari, R.; Kataki, R.; Gogoi, N. Organic amendments: Effect on carbon mineralization and crop productivity in acidic soil. J. Clean. Prod. 2017, 152, 157–166. [Google Scholar] [CrossRef]
  14. Gong, Z. Chinese Soil Taxonomy; Science Press: Beijing, China, 2001. [Google Scholar]
  15. Li, Z.; Tang, S.; Zhang, X.; He, Y. Purple Soil in China (1); Science Press: Beijing, China, 1991. (In Chinese) [Google Scholar]
  16. Zhu, B.; Wang, T.; Kuang, F.; Luo, Z.; Tang, J.; Xu, T. Measurements of nitrate leaching from a hillslope cropland in the Central Sichuan Basin, China. Soil Sci. Soc. Am. J. 2009, 73, 1419–1426. [Google Scholar] [CrossRef]
  17. He, X.; Bao, Y.; Nan, H.; Xiong, D.; Wang, L.; Liu, Y.; Zhao, J. Tillage pedogenesis of purple soils in southwestern China. J. Mt. Sci. 2009, 6, 205–210. [Google Scholar] [CrossRef]
  18. Hua, K.; Zhu, B.; Wang, X. Dissolved organic carbon loss fluxes through runoff and sediment on sloping upland of purple soil in the Sichuan Basin. Nutr. Cycl. Agroecosyst. 2014, 98, 125–135. [Google Scholar] [CrossRef]
  19. Zhu, B.; Wang, Z.; Zhang, X. Phosphorus fractions and release potential of ditch sediments from different land uses in a small catchment of the upper Yangtze River. J. Soils Sedim. 2012, 12, 278–290. [Google Scholar] [CrossRef]
  20. Wang, J.; Zhu, B.; Zhang, J.; Müller, C.; Cai, Z. Mechanisms of soil N dynamics following long-term application of organic fertilizers to subtropical rain-fed purple soil in China. Soil Biol. Biochem. 2015, 91, 222–231. [Google Scholar] [CrossRef]
  21. Wang, T.; Zhu, B. Nitrate loss via overland flow and interflow from a sloped farmland in the hilly area of purple soil, China. Nutr. Cycl. Agroecosyst. 2011, 90, 309–319. [Google Scholar] [CrossRef]
  22. Zhou, M.; Zhu, B.; Brüggemann, N.; Bergmann, J.; Wang, Y.; Butterbach-Bahl, K. N2O and CH4 emissions, and NO3- leaching on a crop-yield basis from a subtropical rain-fed wheat-maize rotation in response to different types of nitrogen fertilizer. Ecosystems 2014, 17, 286–301. [Google Scholar] [CrossRef]
  23. Edmeades, D.C. The long-term effects of manures and fertilisers on soil productivity and quality: A review. Nutr. Cycl. Agroecosyst. 2003, 66, 165–180. [Google Scholar] [CrossRef]
  24. Knudsen, M.T.; Meyer-Aurich, A.; Olesen, J.E.; Chirinda, N.; Hermansen, J.E. Carbon footprints of crops from organic and conventional arable crop rotations-using a life cycle assessment approach. J. Clean. Prod. 2014, 64, 609–618. [Google Scholar] [CrossRef]
  25. Meisterling, K.; Samaras, C.; Schweizer, V. Decisions to reduce greenhouse gases from agriculture and product transport: LCA case study of organic and conventional wheat. J. Clean. Prod. 2009, 17, 222–230. [Google Scholar] [CrossRef]
  26. Wang, W.; Liao, Y.; Wen, X.; Guo, Q. Dynamics of CO2 fluxes and environmental responses in the rain-fed winter wheat ecosystem of the Loess Plateau, China. Sci. Total Environ. 2013, 461, 10–18. [Google Scholar] [CrossRef] [Green Version]
  27. Liu, X.; Herbert, S.; Jin, J.; Zhang, Q.; Wang, G. Responses of photosynthetic rates and yield/quality of main crops to irrigation and manure application in the black soil area of Northeast China. Plant Soil 2004, 261, 55–60. [Google Scholar] [CrossRef]
  28. Lone, P.; Khan, N. The effects of rate and timing of N fertilizer on growth, photosynthesis, N accumulation and yield of mustard (Brassica juncea) subjected to defoliation. Environ. Exp. Bot. 2007, 60, 318–323. [Google Scholar] [CrossRef]
  29. Edet, M.A.; Tijani-Eniola, H.; Lagoke, S.; Tarawali, G. Relationship of cassava growth parameters with yield, yield related components and harvest time in Ibadan, Southwestern Nigeria. J. Nat. Sci. Res. 2015, 5, 87–93. [Google Scholar]
  30. Escobar-Gutiérrez, A.J.; Combe, L. Senescence in field-grown maize: From flowering to harvest. Field Crop. Res. 2012, 134, 47–58. [Google Scholar] [CrossRef]
  31. Eggleston, S.; Buendia, L.; Miwa, K.; Ngara, T.; Tanabe, K. IPCC Guidelines for National Greenhouse Gas Inventories; Institute for Global Environmental Strategies Hayama: Kanoyama Town, Japan, 2006; Volume 5. [Google Scholar]
  32. Zheng, X.; Mei, B.; Wang, Y.; Xie, B.; Wang, Y.; Dong, H.; Xu, H.; Chen, G.; Cai, Z.; Yue, J. Quantification of N2O fluxes from soil-plant systems may be biased by the applied gas chromatograph methodology. Plant Soil 2008, 311, 211–234. [Google Scholar] [CrossRef]
  33. Wang, Y.S.; Wang, Y.H. Quick measurement of CH4, CO2 and N2O emissions from a short-plant ecosystem. Adv. Atmos. Sci. 2003, 20, 842–844. [Google Scholar]
  34. Meng, L.; Cai, Z.C.; Ding, W.X. Carbon contents in soils and crops as affected by long-term fertilization. Acta Pedol. Sin. 2005, 42, 776. [Google Scholar]
  35. Jans, W.W.; Jacobs, C.M.; Kruijt, B.; Elbers, J.A.; Barendse, S.; Moors, E.J. Carbon exchange of a maize (Zea mays L.) crop: Influence of phenology. Agric. Ecosyst. Environ. 2010, 139, 316–324. [Google Scholar] [CrossRef]
  36. Schipper, L.A.; Parfitt, R.L.; Fraser, S.; Littler, R.A.; Baisden, W.T.; Ross, C. Soil order and grazing management effects on changes in soil C and N in New Zealand pastures. Agric. Ecosyst. Environ. 2014, 184, 67–75. [Google Scholar] [CrossRef]
  37. Tong, X.; Li, J.; Yu, Q.; Lin, Z. Biophysical controls on light response of net CO2 exchange in a winter wheat field in the North China Plain. PLoS ONE 2014, 9, e89469. [Google Scholar] [CrossRef]
  38. Song, J.; Hui, Y.; Yu, C.; Zhang, Q.; Zhou, Y.; Li, Y.; Liu, X.; Zhu, L.; Hui, D.; Wan, S. Carbon balance under four double-season cropping systems in North China Plain. Plant Soil 2017, 421, 319–336. [Google Scholar] [CrossRef]
  39. Hollinger, S.E.; Bernacchi, C.J.; Meyers, T.P. Carbon budget of mature no-till ecosystem in North Central Region of the United States. Agric. For. Meteorol. 2005, 130, 59–69. [Google Scholar] [CrossRef]
  40. Antonietta, M.; Fanello, D.D.; Acciaresi, H.; Guiamet, J.J. Senescence and yield responses to plant density in stay green and earlier-senescing maize hybrids from Argentina. Field Crop. Res. 2014, 155, 111–119. [Google Scholar] [CrossRef]
  41. Ren, B.; Liu, W.; Zhang, J.; Dong, S.; Liu, P.; Zhao, B. Effects of plant density on the photosynthetic and chloroplast characteristics of maize under high-yielding conditions. Sci. Nat. 2017, 104, 12. [Google Scholar] [CrossRef]
  42. Jiang, D.; Dai, T.; Jing, Q.; Cao, W.; Zhou, Q.; Zhao, H.; Fan, X. Effects of long-term fertilization on leaf photosynthetic characteristics and grain yield in winter wheat. Photosynthetica 2004, 42, 439–446. [Google Scholar] [CrossRef]
  43. Cechin, I.; Fumis, T.F. Effect of nitrogen supply on growth and photosynthesis of sunflower plants grown in the greenhouse. Plant Sci. 2004, 166, 1379–1385. [Google Scholar] [CrossRef]
  44. Marchiori, P.E.; Machado, E.C.; Ribeiro, R.V. Photosynthetic limitations imposed by self-shading in field-grown sugarcane varieties. Field Crop. Res. 2014, 155, 30–37. [Google Scholar] [CrossRef]
  45. Rosenthal, D.M.; Slattery, R.A.; Miller, R.E.; Grennan, A.K.; Cavagnaro, T.R.; Fauquet, C.M.; Gleadow, R.M.; Ort, D.R. Cassava about-FACE: Greater than expected yield stimulation of cassava (Manihot esculenta) by future CO2 levels. Glob. Chang. Biol. 2012, 18, 2661–2675. [Google Scholar] [CrossRef]
  46. Brienen, R.J.; Phillips, O.L.; Feldpausch, T.R.; Gloor, E.; Baker, T.R.; Lloyd, J.; Lopez-Gonzalez, G.; Monteagudo-Mendoza, A.; Malhi, Y.; Lewis, S.L. Long-term decline of the Amazon carbon sink. Nature 2015, 519, 344–348. [Google Scholar] [CrossRef] [Green Version]
  47. Long, S.P.; ZHU, X.G.; Naidu, S.L.; Ort, D.R. Can improvement in photosynthesis increase crop yields? Plant Cell Environ. 2006, 29, 315–330. [Google Scholar] [CrossRef]
  48. Rossi, M.; Bermudez, L.; Carrari, F. Crop yield: Challenges from a metabolic perspective. Curr. Opin. Plant Biol. 2015, 25, 79–89. [Google Scholar] [CrossRef]
  49. Huang, S.; Peng, X.; Huang, Q.; Zhang, W. Soil aggregation and organic carbon fractions affected by long-term fertilization in a red soil of subtropical China. Geoderma 2010, 154, 364–369. [Google Scholar] [CrossRef]
  50. Mäder, P.; Fliessbach, A.; Dubois, D.; Gunst, L.; Fried, P.; Niggli, U. Soil fertility and biodiversity in organic farming. Science 2002, 296, 1694–1697. [Google Scholar] [CrossRef] [Green Version]
  51. Seufert, V.; Ramankutty, N.; Foley, J.A. Comparing the yields of organic and conventional agriculture. Nature 2012, 485, 229–232. [Google Scholar] [CrossRef]
  52. Moureaux, C.; Debacq, A.; Hoyaux, J.; Suleau, M.; Tourneur, D.; Vancutsem, F.; Bodson, B.; Aubinet, M. Carbon balance assessment of a Belgian winter wheat crop (Triticum aestivum L.). Glob. Chang. Biol. 2008, 14, 1353–1366. [Google Scholar] [CrossRef]
  53. Tariyal, K. Total Carbon Stock in Agricultural System Having Crop Rotation in Tarai Region of Northern India. Octa J. Environ. Res. 2014, 2, 127–138. [Google Scholar]
  54. La Scala, N., Jr.; Marques, J., Jr.; Pereira, G.; Corá, J. Carbon dioxide emission related to chemical properties of a tropical bare soil. Soil Biol. Biochem. 2000, 32, 1469–1473. [Google Scholar] [CrossRef]
  55. Al-Kaisi, M.M.; Kruse, M.L.; Sawyer, J.E. Effect of nitrogen fertilizer application on growing season soil carbon dioxide emission in a corn-soybean rotation. J. Environ. Qual. 2008, 37, 325–332. [Google Scholar] [CrossRef]
  56. Yuste, C.J.; Baldocchi, D.; Gershenson, A.; Goldstein, A.; Misson, L.; Wong, S. Microbial soil respiration and its dependency on carbon inputs, soil temperature and moisture. Glob. Chang. Biol. 2007, 13, 2018–2035. [Google Scholar] [CrossRef] [Green Version]
  57. Kaiser, C.; Kilburn, M.R.; Clode, P.L.; Fuchslueger, L.; Koranda, M.; Cliff, J.B.; Solaiman, Z.M.; Murphy, D.V. Exploring the transfer of recent plant photosynthates to soil microbes: Mycorrhizal pathway vs. direct root exudation. New Phytol. 2015, 205, 1537–1551. [Google Scholar] [CrossRef]
  58. Moyano, F.E.; Kutsch, W.L.; Rebmann, C. Soil respiration fluxes in relation to photosynthetic activity in broad-leaf and needle-leaf forest stands. Agric. For. Meteorol. 2008, 148, 135–143. [Google Scholar] [CrossRef]
  59. Zhou, Z.; Jiang, L.; Du, E.; Hu, H.; Li, Y.; Chen, D.; Fang, J. Temperature and substrate availability regulate soil respiration in the tropical mountain rainforests, Hainan Island, China. J. Plant Ecol. 2013, 6, 325–334. [Google Scholar] [CrossRef] [Green Version]
  60. Béziat, P.; Ceschia, E.; Dedieu, G. Carbon balance of a three crop succession over two croplands sites in South West France. Agric. For. Meteorol. 2009, 149, 1628–1645. [Google Scholar] [CrossRef] [Green Version]
  61. Osborne, B.; Saunders, M.; Walmsley, D.; Jones, M.; Smith, P. Key questions and uncertainties associated with the assessment of the cropland greenhouse gas balance. Agric. Ecosyst. Environ. 2010, 139, 293–301. [Google Scholar] [CrossRef]
  62. Lal, R. Offsetting China’s CO2 emissions by soil carbon sequestration. Clim. Chang. 2004, 65, 263–275. [Google Scholar] [CrossRef]
Figure 1. Monthly precipitation (mm) (a) and monthly mean air temperature (°C) (b) over the two-year experiment from 2016–2018.
Sustainability 12 02747 g001
Figure 2. Dynamic changes of mean soil temperature (a) and mean soil water filled pore space (WFPS) (b) of top soil (0–15 cm) for the five treatments during the wheat and maize growing seasons from November, 2016 to October, 2018.
Sustainability 12 02747 g002
Figure 3. Changes in seasonal leaf photosynthesis rate (Pn) at the elongation stage, heading stage, and grain filling stage of the wheat season (a) and the maize season (b) for the five treatments in the period 2016–2017. The vertical bars indicate the standard errors of spatial replicates (n = 3). The vertical bars with different lower case letters are significantly different (least significant difference test, p < 0.05) and vertical bars followed by the same lower case letters are not significantly different (least significant difference test, p > 0.05). Pig slurry as organic manure (OM), crop residues (CR), mineral fertilizers (NPK), combined organic manure with mineral fertilizers (OMNPK), and combined crop residues with mineral fertilizers (CRNPK).
Sustainability 12 02747 g003
Figure 4. The wheat and the maize seasons grain yields in 2016–2017 (a) and in 2017–2018 (d), shoot biomass in 2016–2017 (b) and in 2017-2018 (e), and root biomass in 2016–2017 (c) and in 2017–2018 (f) for the five treatments over the two-year experiments from 2016–2018. The vertical bars indicate the standard errors of spatial replicates (n = 3). The vertical bars with different lower case letters are significantly different (least significant difference test, p < 0.05) and vertical bars followed by the same lower case letters are not significantly different (least significant difference test, p > 0.05). Pig slurry as organic manure (OM), crop residues (CR), mineral fertilizers (NPK), combined organic manure with mineral fertilizers (OMNPK), and combined crop residues with mineral fertilizers (CRNPK).
Sustainability 12 02747 g004
Figure 5. Seasonal variations in soil CO2 emissions of the wheat and the maize seasons for OM (a), CR (b), NPK (c), OMNPK (d), and CRNPK (e) during growing seasons from November, 2016 to October, 2018. The vertical bars indicate the standard errors of spatial replicates (n = 3). Pig slurry as organic manure (OM), crop residues (CR), mineral fertilizers (NPK), combined organic manure with mineral fertilizers (OMNPK), and combined crop residues with mineral fertilizers (CRNPK).
Sustainability 12 02747 g005
Figure 6. Contribution of C balance components of the wheat season, maize season, and annually to C balance for the five treatments over the two-year experiment of 2016–2018. Dissolved organic carbon (DOC), Pig slurry as organic manure (OM), crop residues (CR), mineral fertilizers (NPK), combined organic manure with mineral fertilizers (OMNPK), and combined crop residues with mineral fertilizers (CRNPK).
Sustainability 12 02747 g006
Figure 7. Relationships between crop C uptake and the wheat and maize season grain yields (a,b), crop C uptake and the wheat and the maize season shoot biomass (c,d), and crop C uptake and the wheat and the maize season root biomass (e,f) for the five treatments (n = 30).
Sustainability 12 02747 g007
Table 1. Average seasonal and annual variations in soil ammonia nitrogen (NH4+-N), nitrate nitrogen (NO3--N), and dissolved organic carbon (DOC) content for the five treatments over the two-year experiment from 2016–2018.
ParametersTreatmentsWheat SeasonMaize SeasonAnnual
MaxMinMean±SECV (%)MaxMinMean± SECV (%)MaxMinMean± SECV (%)
NH4+-N
(mg N kg−1)
OM11.450.392.200.2786.056.010.382.150.2162.1811.450.372.180.1876.03
CR5.220.271.710.1558.933.900.451.820.1342.985.290.231.770.1054.46
NPK11.590.662.830.3175.873.620.101.660.1245.6511.590.102.280.1977.31
OMNPK10.710.662.430.2879.293.700.161.830.1444.5710.710.162.170.1876.41
CRNPK11.010.862.690.3077.044.500.362.010.1544.1511.010.362.390.1971.49
NO3-N
(mg N kg−1)
OM74.512.4525.912.7772.9789.443.0625.823.3480.30100.171.7325.762.2179.38
CR21.381.178.910.7253.5022.851.8011.310.7843.2526.240.979.960.5752.10
NPK131.358.1547.815.1474.5451.351.4612.801.5173.18131.351.4632.003.49101.00
OMNPK101.232.2232.633.1969.4674.033.4920.432.3571.25101.232.2227.092.1975.34
CRNPK87.972.1334.803.3470.2053.062.5915.891.4657.1787.971.7926.182.2580.39
DOC
(mg C kg−1)
OM150.8767.1695.882.7619.75143.3756.8096.783.2820.77170.8656.8096.382.2021.07
CR130.0638.0081.603.1626.43113.1443.9183.382.5319.15130.3833.2282.442.1023.66
NPK130.5548.0181.842.8523.85103.0737.4776.322.6121.33130.5532.8179.352.0123.41
OMNPK145.2249.4192.223.0522.76127.1851.2989.593.0120.76145.6844.9291.072.1822.21
CRNPK158.4061.1599.063.1021.48132.8152.4899.072.6116.33159.3649.3099.092.1119.70
NH4+-N: soil ammonia nitrogen, NO3-N: soil nitrate nitrogen, DOC: soil dissolved organic carbon, Max: maximum, Min: minimum, Mean: average, SE: standard error, CV: coefficient of variation.
Table 2. Seasonal and annual cumulative carbon dioxide (CO2, g C ha−1) emissions, crop C uptake (g C m−2), sediment C loss (g C m−2), and dissolved organic carbon (DOC, g C m−2) for the five treatments over the two-year experiment from 2016–2018.
YearTreatmentsWheat SeasonMaize SeasonAnnual
Soil CO2 EmissionCrop C UptakeDOC loss FluxesSoil CO2 EmissionCrop C UptakeSediment C LossDOC Loss FluxesSoil CO2 EmissionCrop C UptakeSediment C LossDOC Loss Fluxes
2016–2017
OM223 ± 19.82ab389 ± 35.26a0.02 ± 0.00a363 ± 23.15a441 ± 38.12a24.00 ± 1.84ab0.19 ± 0.05a678 ± 45.82a830 ± 58.52a24.00 ± 1.84ab0.21 ± 0.05a
CR224 ± 19.72ab187 ± 8.65b0.01 ± 0.00a304 ± 32.01ab239 ± 15.19b13.79 ± 3.45b0.21 ± 0.02a563 ± 12.74ab426 ± 12.57b13.79 ± 3.45b0.22 ± 0.02a
NPK134 ± 12.80c328 ± 17.07a0.02 ± 0.01a204 ± 19.96c486 ± 32.19a30.72 ± 6.04a0.16 ± 0.02a362 ± 38.89c814 ± 46.44a30.72 ± 6.04a0.18 ± 0.02a
OMNPK183 ± 7.29bc374 ± 5.51a0.01 ± 0.01a252 ± 12.21bc479 ± 19.06a25.17 ± 3.44ab0.17 ± 0.02a487 ± 16.26b853 ± 14.43a25.17 ± 3.44ab0.18 ± 0.02a
CRNPK280 ± 21.71a349 ± 13.62a0.01 ± 0.01a270 ± 13.20bc525 ± 19.91a21.57 ± 0.19b0.15 ± 0.06a602 ± 28.31ab873 ± 14.19a21.57 ± 0.19b0.17 ± 0.07a
2017–2018
OM257 ± 23.47a368 ± 5.55a0361 ± 7.10a508 ± 33.17a74.63 ± 16.16a0.26 ± 0.02a739 ± 24.77a876 ± 35.09a74.63 ± 16.16a0.26 ± 0.02a
CR199 ± 15.27b162 ± 6.94d0294 ± 24.15b334 ± 30.09b19.62 ± 1.35b0.27 ± 0.03a527 ± 38.26b496 ± 28.06c19.62 ± 1.35b0.27 ± 0.03a
NPK102 ± 7.80c254 ± 6.98c0203 ± 11.82c391 ± 33.71ab71.04 ± 18.04a0.27 ± 0.04a337 ± 25.78c645 ± 40.63b71.04 ± 18.04a0.27 ± 0.04a
OMNPK193 ± 19.86b288 ± 12.99b0268 ± 8.84b435 ± 6.17ab70.37 ± 13.90a0.27 ± 0.07a512 ± 32.22b723 ± 14.57b70.37 ± 13.90a0.27 ± 0.07a
CRNPK225 ± 14.26ab284 ± 10.12b0309 ± 11.62b451 ± 43.13ab36.55 ± 13.82ab0.26 ± 0.04a565 ± 25.50b735 ± 48.48b36.55 ± 13.82ab0.26 ± 0.04a
Mean (2016–2018)
OM240 ± 17.77a378 ± 19.35a0.011 ± 0.00a362 ± 8.03a475 ± 25.25a49.31 ± 6.92a0.23 ± 0.01a708 ± 25.95a853 ± 43.82a49.31 ± 6.92a0.24 ± 0.01a
CR212 ± 11.33ab174 ± 4.18d0.007 ± 0.00a299 ± 5.12b287 ± 15.96b16.70 ± 2.53b0.24 ± 0.03a545 ± 14.05bc461 ± 15.14c16.70 ± 2.53b0.25 ± 0.03a
NPK118 ± 10.29c291 ± 7.67c0.010 ± 0.00a203 ± 14.92d439 ± 20.03a50.88 ± 8.90a0.21 ± 0.03a350 ± 31.71d729 ± 25.65b50.88 ± 8.90a0.22 ± 0.03a
OMNPK188 ± 6.96b331 ± 9.85b0.006 ± 0.00a260 ± 9.78c457 ± 7.84a47.77 ± 10.93a0.22 ± 0.03a499 ± 17.10c788 ± 3.33ab47.77 ± 10.93a0.22 ± 0.03a
CRNPK252 ± 17.59a316 ± 4.33bc0.006 ± 0.00a290 ± 6.57bc488 ± 21.71a29.06 ± 7.60ab0.20 ± 0.05a583 ± 23.27b804 ± 18.88ab29.06 ± 7.60ab0.21 ± 0.05a
Mean ± SE: Means in columns followed by different lower case letters are significantly different (least significant difference test, p < 0.05) and means followed by the same lower case letters are not significantly different (least significant difference test, p > 0.05). Pig slurry as organic manure (OM), crop residues (CR), mineral fertilizers (NPK), combined organic manure with mineral fertilizers (OMNPK), and combined crop residues with mineral fertilizers (CRNPK).
Table 3. Seasonal and annual carbon balance for the five treatments over the two-year experiment from 2016–2018.
TreatmentsC Balance Components (g C m−2)
F AmendmentsGrain C UptakeShoot C UptakeRoot C UptakeSoil CO2 EmissionsSediment C LossDOC Loss FluxesC Balance
Wheat season
OM819153 ± 2.52a192 ± 17.04a34 ± 3.28a240 ± 17.77a00.011 ± 0.00a460 ± 12.82a
CR26064 ± 3.46d93 ± 3.67c17 ± 1.20c212 ± 11.33ab00.007 ± 0.00a1 ± 7.94b
NPK0128 ± 5.69c142 ± 4.41b20 ± 1.45bc118 ± 10.29c00.010 ± 0.00a-226 ± 15.73d
OMNPK328141 ± 2.33b164 ± 12.99ab27 ± 2.19ab188 ± 6.96b00.006 ± 0.00a26 ± 4.93b
CRNPK189126 ± 1.53c162 ± 5.55ab29 ± 2.52a252 ± 17.59a00.006 ± 0.00a-160 ± 17.70c
Maize season
OM883188 ± 12.20a237 ± 14.59a50 ± 1.15a362 ± 8.03a49.31 ± 6.92a0.23 ± 0.01a334 ± 20.68a
CR268127 ± 2.96b136 ± 11.00b23 ± 0.58d299 ± 5.12b16.70 ± 2.53b0.24 ± 0.03a-152 ± 10.53c
NPK0202 ± 17.99a208 ± 14.11a28 ± 2.96c203 ± 14.92d50.88 ± 8.90a0.21 ± 0.03a-428 ± 39.35e
OMNPK553205 ± 4.16a220 ± 5.09a32 ± 1.73c260 ± 9.78c47.77 ± 10.93a0.22 ± 0.03a72 ± 16.45b
CRNPK195217 ± 5.41a232 ± 14.78a39 ± 0.58b290 ± 6.57bc29.06 ± 7.60ab0.20 ± 0.05a-301 ± 6.14d
Annual
OM1702341 ± 12.57a429 ± 28.62a84 ± 4.18a708 ± 25.95a49.31 ± 6.92a0.24 ± 0.01a687 ± 32.84a
CR528191 ± 3.53b230 ± 13.32c40 ± 1.76d545 ± 14.05bc16.70 ± 2.53b0.25 ± 0.03a-186 ± 9.96c
NPK0331 ± 21.67a350 ± 16.02b48 ± 3.84d350 ± 31.71d50.88 ± 8.90a0.22 ± 0.03a-683 ± 61.37e
OMNPK881346 ± 6.39a384 ± 8.17ab58 ± 0.88c499 ± 17.10c47.77 ± 10.93a0.22 ± 0.03a47 ± 23.77b
CRNPK384343 ± 6.64a393 ± 9.74ab68 ± 3.38b583 ± 23.27b29.06 ± 7.60ab0.21 ± 0.05a-503 ± 11.56d
Mean ± SE: Means in columns followed by different lower case letters are significantly different (least significant difference test, p < 0.05) and means followed by the same lower case letters are not significantly different (least significant difference test, p > 0.05). Pig slurry as organic manure (OM), crop residues (CR), mineral fertilizers (NPK), combined organic manure with mineral fertilizers (OMNPK), and combined crop residues with mineral fertilizers (CRNPK).
Table 4. Pearson correlation coefficient of C components in the wheat and the maize seasons for the five treatments during the two-year experiment of 2016–2018 (n = 30).
C Balance ComponentsCrop C UptakeGrain C UptakeShoot C UptakeRoot C UptakeSoil CO2 EmissionSediment C LossDOC Loss Fluxes
Wheat season
Crop C uptake (g C m−2)1
Grain uptake (g m−2)0.88***1
Shoot uptake (g C m−2)0.36 *−0.09ns1
Root uptake (g C m−2)0.66 ***0.68 ***0.07ns1
Soil CO2 emission (g C m−2)0.01ns−0.05ns0.21ns0.39 *1
Maize season
Crop C uptake (g C m−2)1
Grain uptake (g m−2)0.90 ***1
Shoot uptake (g C m−2)0.42 *0.06ns1
Root uptake (g C m−2)0.62 ***0.45 **0.37 *1
Soil CO2 emission (g C m−2)−0.12ns−0.16ns−0.08ns0.50 **1
Sediment C loss (g C m−2)0.24ns0.36 *−0.45 *0.02ns0.06ns1
DOC loss fluxes (g C m−2)0.61 ***0.68 ***−0.196ns0.31ns−0.03ns0.51 **1
DOC: dissolved organic carbon, ns: not significant, * Significant at p < 0.05, ** Significant at p < 0.01, *** Significant at p < 0.001.

