Article

China’s Carbon Pricing Based on Heterogeneous Tail Distribution

1
School of Management, Hefei University of Technology, Heifei 230001, China
2
Key Laboratory of Process Optimization and Intelligent Decision-making, Hefei University of Technology, Ministry of Education, Anhui 230009, China
3
School of Economics and Management, Anhui Jianzhu University, Hefei 230601, China
4
Education and Literacy Department, Govt. of Sindh, Hyderabad 70060, Pakistan
*
Authors to whom correspondence should be addressed.
Sustainability 2020, 12(7), 2754; https://doi.org/10.3390/su12072754
Submission received: 4 March 2020 / Revised: 24 March 2020 / Accepted: 25 March 2020 / Published: 1 April 2020

Abstract

:
To address climate change, the carbon emission trading scheme has become one of the main measures to achieve emission reduction goals. One of the core problems in constructing the carbon emissions trading market is determining carbon emissions trading prices. The scientific nature of carbon emissions pricing determines the effectiveness of market regulation. Research on the influencing factors and heterogeneous tail distribution of carbon prices can increase the accuracy of carbon pricing, which is particularly important for the development of the carbon emissions trading market. The current studies have some limitations and lack heterogeneous tail description. We employ the arbitrage pricing theory-standardized standard asymmetric exponential power distribution model to analyze China’s regional carbon emissions trading price and use a genetic algorithm to solve linear programming. The results confirm the theoretical results and efficiency of the proposed algorithm. First, the new model can capture the skewness, fat-tailed distribution, and asymmetric effects of China’s regional carbon emissions trading price. Second, the macroeconomy, similar products, energy price, and exchange rate influence the carbon price fluctuation; investors’ behavior plays an important role in the heterogeneous tail distribution of carbon price. The findings provide references for the government to take appropriate measures to promote carbon emission reduction and improve the effectiveness of China’s carbon market. Therefore, our findings can help enhance emission reduction and achieve sustainable development of a low-carbon environment.

1. Introduction

Climate change is induced in part by carbon dioxide emissions. Mitigation of carbon dioxide (CO2) emissions has become an urgent environmental goal. The Paris Agreement was adopted in 2015. The Paris Agreement is the first international climate agreement that extends mitigation obligations to all countries. The low-carbon economy became a top agenda for many countries after the Paris meeting. Accordingly, about 100 parties, accounting for 58% of global greenhouse gas (GHG) emission, have already implemented some policy measures to decrease CO2 emissions. The emission trading scheme has become the most effective emission reduction method. More and more countries and regions have turned to the cap-and-trade scheme to control carbon emissions.
China is the largest GHG emissions producer and energy consumer in the world. Hence, reducing China’s GHG emissions is important for the world. To reduce carbon emissions, China has gradually established regional carbon markets. By the end of 2014, Shenzhen, Beijing, Shanghai, and other regional emissions trading markets had been implemented. At the Paris climate conference, China announced its nationally determined contributions. To achieve the mitigation target, China launched the national carbon emissions trading system. Since the power generation industry contributes 40% of the carbon emissions, China launched the national carbon emissions trading system only in the power generation industry in 2017.
The development of China’s carbon market can improve low-carbon economic progress. One of the core problems with developing a carbon emissions trading market is carbon emissions trading pricing. Carbon pricing has become a promising research area. Carbon pricing is important for both policymakers and market participants. Increasing the accuracy of carbon pricing can attract more investors to the trading market, which would, in turn, motivate policymakers to improve the market mechanism. COVID-19 has brought huge fluctuations to the financial market, having an important impact on China’s carbon price, especially in its heterogeneous tail distribution, increasing the challenge of accurately pricing carbon. Therefore, we propose a new method to increase prediction precision for China’s carbon pricing. The findings can accelerate the establishment of a unified national carbon market, contributing to the effective control and gradual reduction of China’s carbon emissions and promote green, low-carbon, and sustainable development.
The remaining paper is organized as follows: Section 2 briefly reviews the literature on carbon pricing. Section 3 constructs a suitable model for China’s carbon emissions pricing, which not only identifies the driver of carbon prices, but also analyzes its heterogeneous tail distribution. Section 4 contains the analysis of an empirical application and a related discussion. Section 5 summarizes the study.

2. Literature Review

In early carbon pricing studies, scholars discussed carbon pricing using theory analyses. Studies focused on general equilibrium or the equilibrium point of carbon trading derived by game theory [1]. However, theory analysis primarily depends on the assumption of a complete market hypothesis, which is not as meaningful for investors in the secondary market. The establishment of a carbon emission trading market provided trading price data. Scholars can study carbon pricing through empirical analyses. Many scholars paid attention to three aspects: carbon pricing based on historical carbon price data, influencing factors, and heterogeneous distribution.

2.1. Carbon Pricing based on Historical Carbon Price Data

Early studies largely focused on carbon pricing based on the price’s fluctuating nature. Scholars used a single model to examine carbon pricing, such as generalized autoregressive conditional heteroscedasticity (GARCH), exponential generalized autoregressive conditional heteroskedasticity (E-GARCH), and Grey–Markov [2] models. A single prediction model cannot accurately characterize the nonlinear and multifrequency features of carbon price. Thus, scholars began using multifrequency models to price carbon emissions trading rights based on the theory of price decomposition, such as empirical mode decomposition [3]. The empirical results show that the multifrequency combination model has higher pricing precision.

2.2. Factors Influencing Carbon Price

With the development of China’s carbon emission trading market, the data on carbon prices have rapidly increased both in quantity and complexity. Extensive time-series data allow us to explore the dynamic relationship between the carbon market and other markets. Hence, scholars analyzed the factors driving carbon prices to improve the accuracy of carbon pricing. Various studies showed that carbon markets are closely associated with other markets. Carbon price fluctuation is mainly driven by the supply and demand of carbon emission rights. On the supply side, policy adjustment and the price fluctuations of similar products are the main influencing factors. Demand is mainly related to energy prices and the macroeconomy. As a whole, these studies mainly focused on five aspects: macroeconomy, similar products, energy price, exchange rate, and policy adjustment and information disclosure.
(1)
Macroeconomy: The smooth and robust expansion of the macroeconomy has an obvious impact on the carbon emissions trading market. Carbon prices fluctuate considerably with the macroeconomy [4]. The increasing macroeconomy, especially the development of industrial economy, helps to increase the price of carbon emissions trading rights [5]. Conversely, carbon price falls substantially when the macroeconomy slows [6]. Stock prices, as an important indicator of macroeconomic situations, show a positive correlation with carbon prices [7].
(2)
Similar products: Carbon prices in different regions have the same properties and show a strong correlation; thus, they can interfere with one another [8]. As a participant in clean development mechanism (CDM) projects, China’s regional carbon emissions trading price is also affected by international carbon price mechanisms, such as the certification emission reduction (CER) and the European Union Allowance (EUA).
(3)
Energy price: Fossil fuel combustion is key human activity affecting GHG emissions [9]. An increase in fossil energy prices increases carbon trading prices [10]. Coal consumption is the largest source of carbon dioxide emissions, which determines the demand for carbon emission quotas and is regarded as the most important determinant of carbon pricing. Oil price plays a leading role in the trend of energy price changes; so, the impact of oil price on the carbon pricing is also important.
(4)
Exchange rate: As a participant in CDM projects, China faces an exchange rate volatility risk [11]. The most common settlement currency in international carbon trading is the Euro; thus, any changes in the exchange rate directly affect the carbon price.
(5)
Policy adjustment and information disclosure: Politics affects climate change policy, further influencing carbon trading prices. Policies can affect carbon prices, mainly due to, besides the commodity property, carbon markets having obvious political properties [12]. The carbon emissions trading market directly reflects mutual coordination between the government and the market regulations [13]. Government regulation plays a primary role because the carbon market system is not perfect in its early stages; therefore, policy adjustment and information disclosure are fundamental causes of carbon price fluctuations. Policy changes by the government weakly positively impact carbon prices. For example, the announcement of the national quota allocation plan has had a significant positive effect on the carbon price income, indicating a long-lasting pre-event effect [14].

2.3. Heterogeneous Distribution of Carbon Price

Carbon pricing mechanisms concern carbon market price drivers and the characteristics of carbon prices. The distribution of finance asset is always non-normal [15]. Empirical research uncovered some features of asset price returns, such as skewness and the kurtosis phenomenon [15]. It also has complex characteristics in carbon price. There are four characteristics of carbon price returns in the probability density distribution of carbon price returns distribution. First, the probability distribution is asymmetric, biased, and skewed [16]. Second, its heavy-tailed tendency, that is, the possibility of extreme events, is often greater than that under a normal distribution [17]. Third, the peak of the kurtosis is often greater than three. Fourth, an asymmetric effect exists [18] wherein an asymmetry between the left and right tail of the carbon price yields. When quantifying these features, previous studies only used t-distribution or generalized error distribution to characterize the fat tail, which cannot describe the asymmetric effect.
By reviewing of the relevant literature that focused on carbon pricing, we found that: (1) studies largely did not consider the heterogeneous tail distribution; studies mainly focused on international carbon price, and only a few considered China’s carbon price with no economic explanation and (2) studies about China’s carbon pricing have not provided an economic explanation of influencing factors and largely did not consider the heterogeneous tail distribution. This motivated us to model the heterogeneous tail distribution and influence factors using the arbitrage pricing theory and standardized standard asymmetric exponential power distribution (APT-SSAEPD) model.
The basic carbon pricing mechanism is affected by complex factors compared with other financial commodities. To address this, Benz suggested using factor pricing models to price carbon emissions trading rights [19]. In modern financial asset pricing, arbitrage pricing theory (APT) is the main reference model. APT is useful for analyzing influencing factors in a financial time series. Although many challenges remain in applying traditional pricing methods to carbon emissions trading rights, the APT naturally extends to multivariate financial time series.
As the previous research showed, carbon price has a heterogeneous tail distribution. We cannot use normal distribution to describe the distribution characteristics of carbon pricing. The probability of a fat tail is higher than the normal hypothesis in carbon price. If we do not consider the heterogeneous tail distribution, the accuracy of carbon pricing would be impacted, which would lead investors in the carbon market to a wrong decision. Therefore, we used standardized standard asymmetric exponential power distribution (SSAEPD) to describe the heterogeneous tail distribution of carbon price.
To capture heterogeneous tails, Zhu and Zinde-Walsh extended the skewed exponential power distribution to a fully asymmetric exponential power distribution, where heavy-tailedness may be asymmetric with different tail exponents on different sides of the distribution [20]. Hence, we used SSAEPD to describe carbon price characteristics, especially the heterogeneous tail distribution. To find the global optimum solution, we chose a genetic algorithm to solve the linear programming problem rather than the interior point method [21].
We constructed an arbitrage pricing theory-standardized standard asymmetric exponential power distribution-genetic algorithm (APT-SSAEPD-GA) model to increase the accuracy in carbon pricing. Accordingly, we contributed to the literature in three ways. First, we focused on carbon pricing of China’s carbon emissions trading market. China’s carbon emissions trading market is immature. Therefore, carbon pricing in China should be studied in depth. Second, to incorporate the skew, fat tail, and asymmetric effects, we assigned the SSAEPD to the residual of carbon price in the carbon pricing model (APT-SSAEPD-GA). SSAEPD can capture the heterogeneous tail distribution of China’s carbon price. Third, with the APT-SSAEPD-GA step, we identified the factors influencing carbon price and found that macroeconomic operation and microeconomic behavior influence carbon price fluctuation. Then, we discussed reasonable economic explanations for these issues. Figure 1 illustrates the framework of this study.
Finally, we aimed to answer the following two research questions:
(1)
Is the new APT-SSAEPD-GA model more accurate for China’s carbon pricing?
(2)
What causes China’s carbon price to have fat and heterogeneous tails?
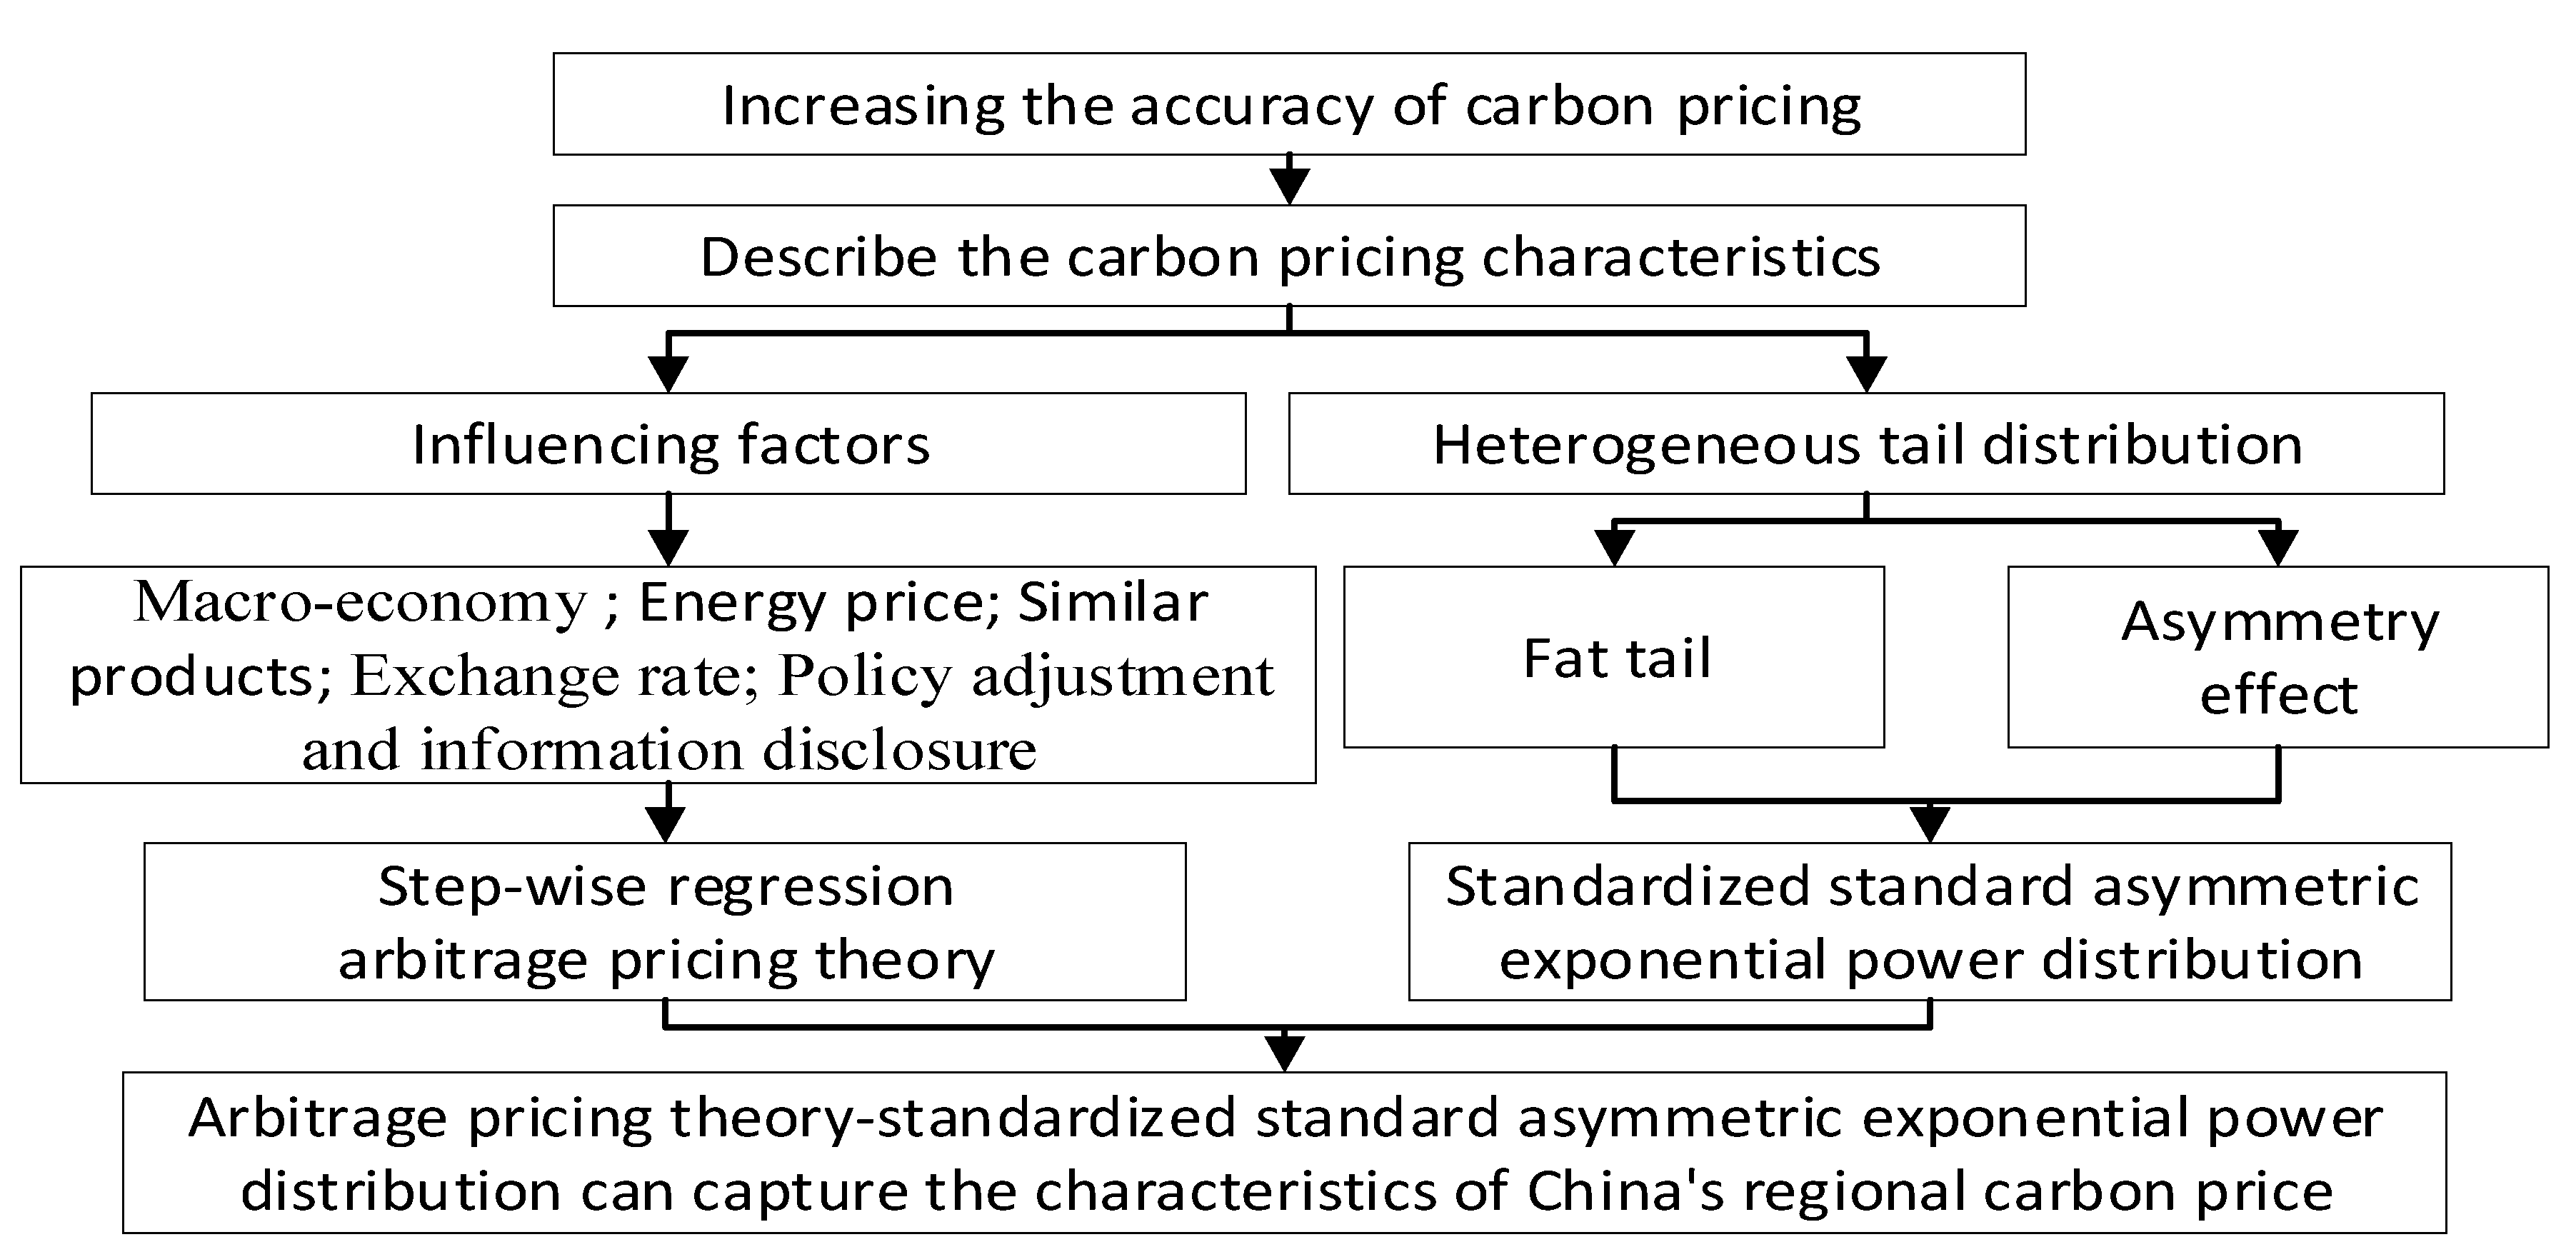
3. Methodology

We constructed the APT-SSAEPD-GA model for pricing China’s regional carbon emissions trading rights. APT is an appropriate choice because it is the main reference model in modern financial asset pricing. In addition, SSAEPD was chosen to describe the heterogeneous tail distribution of carbon prices, such as the fat tail and asymmetric effect. Finally, the genetic algorithm was used to solve the linear programming problem.

3.1. Construction of Arbitrage Pricing Theory-Standardized Standard Asymmetric Exponential Power Distribution Model

China’s regional carbon emission trading market is a market economic system. The Chinese government has never used policy intervention in the regional carbon emission trading market. China’s carbon emissions trading market is a cap-and-trade market. The government’s job is to set the initial carbon emissions quota and then provide a trading platform for enterprises with gaps in quota and reduction costs. Although some government involvement is required in the carbon emissions trading market, the sellers and buyers can trade as they prefer without government interference. Therefore, we thought that an APT analysis was suitable for this study.
Based on the literature review, the expected return on China’s carbon pricing can be modelled as a linear function of macroeconomic operations, microeconomic behavior, and policy changes, where sensitivity to changes in each factor is represented by a factor-specific coefficient. APT is based on the assumption that any asset’s price can be expressed as a linear combination of some common factors. The model-derived rate of China’s carbon price return is used to price its carbon emissions trading rights; the carbon price should equal to the expected end-of-period discounted price at the rate implied by the model. If the price diverges, arbitrage should be used to realign it.
Guided by APT, we constructed a multifactor model to examine the return on China’s carbon price. The most widely used model is:
r t = β 1 + β 2 X + ε t ε t ~ N ( u , σ 2 )
where rt represents the carbon emissions trading price-earnings ratio of time t, which is   Ln ( P t P t 1 ) ; X represents the factors influencing the carbon emission trading market returns of time t; εt is a residual that follows normal distribution; β1 and β2 are coefficient parameters in the regression model; and T is the sample size (t = 1, 2, …, T).
The real data in China’s carbon emission trading market often fail to meet normal distribution hypotheses. The distribution of the carbon price return usually presents skewness and fat tails. Hence, we calculated the asymmetry and fat tail of the carbon price return with the asymmetric exponential power distribution (AEPD) in [20] and the APT. The APT-SSAEPD model has the following form:
r t = β 1 + β 2 X + η z t z t ~ SSAEPD ( a , p 1 , p 2 , 0 , 1 )
where Zt is the residual error that follows the SSAEPD.
The next section outlines how the SSAEPD model was constructed.

3.1.1. Asymmetric Exponential Power Distribution

From Equation (2), we know that the error series (εt) of the carbon pricing model equals rt − β1 and β2X. Suppose y equals εt. If the time error series y~AEPD(β), its density is:
f A E P D ( y | β ) = { ( α α * ) 1 σ K E P ( p 1 ) exp ( 1 p 1 | y u 2 α * σ | p 1 )       i f   y u ( 1 α 1 α * ) 1 σ K E P ( p 2 ) exp ( 1 p 2 | y u 2 ( 1 α * ) σ | p 2 )   i f   y u
where u R is the location of the carbon price’s error series (y), σ > 0 is the scale parameter of the carbon prices’ error series (y), p1 > 0 is the left tail parameter of the carbon prices’ error series (Y), p2 > 0 is the right tail parameter of the carbon prices’ error series (y), and α ∈ (0,1) is the skewness parameter of the carbon prices’ error series (y).
α * = α K E P ( p 1 ) α K E P ( p 1 ) + ( 1 α ) K E P ( p 2 )
K E P ( p ) = 1 2 p 1 / p τ ( 1 + 1 / p )
The parameter α* in the AEPD density provides the scale adjustments for the left and right parts of the density to ensure continuity of the density under changes in shape parameters (α, p1, and p2). KEP (p) is a normalizing constant. If p is small, the AEPD becomes more heavy tailed and leptokurtic, that is, the carbon price has a heavy tail and kurtosis distribution. If α   = 0.5, it becomes an exponential power distribution. If α = 0.5 and p1 = p2 = 1, it becomes a Laplace distribution. If α = 0.5 and p1 = p2 = 2, it is a normal distribution.

3.1.2. Standard Asymmetric Exponential Power Distribution (SAEPD)

To standardize the error series (y) of the carbon price, we define a new variable x. Suppose   x = y u σ or y = u + then, the Jacobian matrix is d y d x = σ . We denote X~standard AEPD(β), β = (α, p1, p2, u = 0, σ = 1). The density of the standard AEPD random variable x is:
f A E P ( x | β ) = { ( α α * ) 1 σ K E P ( p 1 ) exp ( 1 p 1 | x 2 α * σ | p 1 )       i f   x 0 ( 1 α 1 α * ) 1 σ K E P ( p 2 ) exp ( 1 p 2 | x 2 ( 1 α * ) σ | p 2 )     i f   x > 0
The mean of the standard AEPD random variable x is E(x). Then,
E x = 1 α K E P ( p 1 ) + ( 1 α ) K E P ( p 2 ) [ ( 1 α ) 2 p 2 τ ( 2 / p 2 ) τ 2 ( 1 / p 2 ) α 2 p 1 τ ( 2 / p 1 ) τ 2 ( 1 / p 1 ) ] .
The variance of the standard AEPD random variable x is Var(x). Then,
Var ( x ) = { ( 1 α ) 3 p 2 2 τ ( 3 / p 2 ) τ 3 ( 1 / p 2 ) + α 3 p 1 2 τ ( 3 / p 1 ) τ 3 ( 1 / p 1 ) [ 1 α 2 p 2 τ ( 2 / p 2 ) τ 2 ( 1 / p 2 ) α 2 p 1 τ ( 2 / p 1 ) τ 2 ( 1 / p 1 ) ] 2 } ( α K E P ( p 1 ) + ( 1 α ) K E P ( p 2 ) ) 2

3.1.3. Standardized Standard Asymmetric Exponential Power Distribution

Let us assume that X~standard SAEPD(β). We define a new variable   z   = x E ( x ) V a r ( x ) . Therefore, the mean of the standardized SAEPD random variable X is E(x).
E ( z ) = E ( x E ( x ) a r ( x ) ) = E ( x ) E ( x ) V a r ( x ) = 0
The variance of the SSAEPD random variable x is Var(x).
Var ( z ) = Var ( x E ( x ) V a r ( x ) ) = V a r ( x ) V a r ( x ) = 1
Assume E(x) = ω and Var(x) = δ2 for simplicity. x = E ( x ) + z V a r ( x ) = ω + z δ . Then, the Jacobian matrix is d x d z = V a r ( x ) = δ .
Therefore, the probability density function of z is:
f A E P ( z | β ) = { δ ( α α * ) K E P ( p 1 ) exp ( 1 p 1 | ω + z δ 2 α * σ | p 1 )         i f   z ω δ δ ( 1 α 1 α * ) K E P ( p 2 ) exp ( 1 p 2 | ω + z δ 2 ( 1 α * ) σ | p 2 )   i f   z > ω δ
If α = 0.2, p1 = 2 and p2 = 2, the probability density function (PDF) of z is reduced to:
{ N o r m a l ( 0 , 1 )   i f   z ω δ N o r m a l ( 0 , 1 )   i f   z > ω δ
Let us denote z~standard AEPD(0,1) or z~SAEPD(β), β = (α, p1, p2, u = 0, σ = 1), with E(z) = 0 and Var(z) = 1.

3.2. Linear Programming Algorithm Selection and Optimization

For the given value of the parameters, we estimate the parameters of the APT-SSAEPD model using a quasi-maximum likelihood method. The likelihood function is:
L ( { r t r f t , r m t r f t } t = 1 T ; θ ) = t = 1 T { δ σ ( α α * ) K ( p 1 ) exp ( 1 p 1 | ω + δ z t 2 α * | p 1 ) , z t ω δ δ σ ( 1 α 1 α * ) K ( p 2 ) exp ( 1 p 2 | ω + δ z t 2 ( 1 α * ) | p 2 ) , z t > ω δ
z t = r t β 1 β 2 X σ
To achieve the global optimum, we use a genetic algorithm rather than an interior-point algorithm, which is different from Zhu and Li’s method [21]. The interior point method cannot assure comprehensive convergence or easily generate local optimal solutions, whereas the genetic algorithm is a random searching global optimization algorithm.

4. Results

We analyzed the influencing factors and heterogeneous tail distribution of the carbon price. This section begins with data analysis and follows with selection of influencing factors, which were used to verify the hypothesis. Based on the empirical results, we provide some discussion.

4.1. Data

China’s regional carbon emissions trading market is a cap-and-trade market. The transactions under voluntary emissions reduction, which involve carbon exchanges, are relatively small and largely for image building. That is, voluntary emissions reductions are based on social responsibility and personal awareness. Although the technical conditions are available, the demand is limited due to lack of incentives to limit the total amount. Hence, we do not discuss the voluntary aspect here.
As a vanguard of economic reform, Shenzhen has a wealth of experience in the implementation and management of carbon market transactions, leading the construction and development of China’s carbon market. The Shenzhen carbon emission exchange was China’s first regional carbon emissions market; it is also the first carbon quota trading market in a developing country. It has become the largest carbon trading market in China since its official launch on June 18, 2013. We selected the Shenzhen carbon emissions trading market as our sample because it has the highest degree of marketization and the largest number of transactions. The market trades in seven products: Shenzhen allowance 2013 (SZA 2013), Shenzhen allowance 2014 (SZA 2014), Shenzhen allowance 2015 (SZA 2015), Shenzhen allowance 2016 (SZA 2016), Shenzhen allowance 2017 (SZA 2017), Shenzhen allowance 2018 (SZA 2018), and Shenzhen allowance 2019 (SZA 2019). The sample period ranges from June 2013 to March 18, 2020. As the Shenzhen allowance 2019 began on October 24, 2019, the daily carbon price data sample was too small. Shenzhen allowance 2018 began in July 2018. To obtain more sample data, we chose the daily carbon price data from July 4, 2018 to March 18, 2020. In total, we obtained 411 records.
We calculate the data and list the descriptive statistics in Table 1. Table 1 shows that carbon trading price returns have slight skewness and a large excess kurtosis, which reflects the asymmetric and fat-tail characteristics. The p value of the Jarque–Bera test for each carbon price return is zero. Hence, we concluded that all asset returns do not follow a normal distribution at the 1% significance level.

4.2. Selection of Influencing Factors

We did not consider policy changes because the sample period covers only 1 year; therefore, we ignored the influence of policy changes. As previously stated, China’s regional carbon price is influenced by the macroeconomy, similar products, energy price, and exchange rate. Therefore, we selected the international macroeconomic and domestic macroeconomic indices to represent macroeconomy development. The Standard and Poor’s 500 Composite Stock Price Index (S&P 500) and China Securities Index 300 (CSI300) represent international and domestic macroeconomic trends, respectively. As previously mentioned, because China is a participant in CDM projects, its regional carbon emissions trading price is affected by the international carbon price. Hence, we chose the CER and the EUA as similar products of China’s carbon price. As the currency of settlement in international carbon trading is mainly the Euro, changes in the exchange rate directly affect the carbon price. The Euro area market has considerably gained in importance in world financial markets. Therefore, we chose the Euro against the Chinese Yuan exchange rate as the factor influencing the financial market. Table 2 lists the influencing factors chosen.
The most important problem in the APT model is screening the factors; thus, we used a stepwise regression analysis to discuss the influencing factors. By the stepwise regression analysis, we determined the main factors influencing the carbon price (Table 3) to use in the APT models.
The stepwise regression showed that SZA 2015, SZA 2017, SZA 2013, Fujian carbon price, CSI 300, Tianjin carbon price, Euro against Chinese Yuan, Shanghai carbon price, and coal price affected the price of SZA 2018 at the 10% significance level. Therefore, we chose these indices as the influencing factors of carbon price in the next empirical analysis.

4.3. Estimation Results

4.3.1. Parameters Estimation of China’s Carbon Pricing

We estimated the parameters in the new APT-SSAEPD-GA model. Table 4 reports the estimation results. For comparison, we also estimated the arbitrage pricing theory-normal (APT-Normal) and arbitrage pricing theory-standardized standard asymmetric exponential power distribution-interior point (APT-SSAEPD-IP). Table 4 lists the estimation results for the APT-Normal, APT-SSAEPD-IP, and APT-SSAEPD-GA models. The empirical results showed that the APT-SSAEPD models can capture skewness and the asymmetric fat tail.
Table 4 shows that the Akaike information criterion (AIC) and Schwarz criterion (SC) values of APT-SSAEPD-GA model are lower than that of the APT-Normal and APT-SSAEPD-IP models. Therefore, the APT-SSAEPD-GA is more suitable for carbon pricing in China.
The parameters of the APT-SSAEPD-GA and APT-SSAEPD-IP are not consistent with the parameters of APT-Normal, indicating that the APT-SSAEPD describes the asymmetric fat tail and skewness. The estimation of skewness parameter α is approximately 0.5, that is, skewness is not an obvious characteristic. For the APT-SSAEPD-GA and APT-SSAEPD-IP models, the fat-tail tendency is strong in both series as the tail parameters (p1 and p2) of all innovations are obviously lower than two; therefore, the fat tail is obvious in China’s carbon trading emissions price. p1 and p2 are not equal, which indicates an asymmetric effect in the fat tail. Overall, the APT-SSAEPD-GA and APT-SSAEPD-IP have better data applicability than APT-Normal.

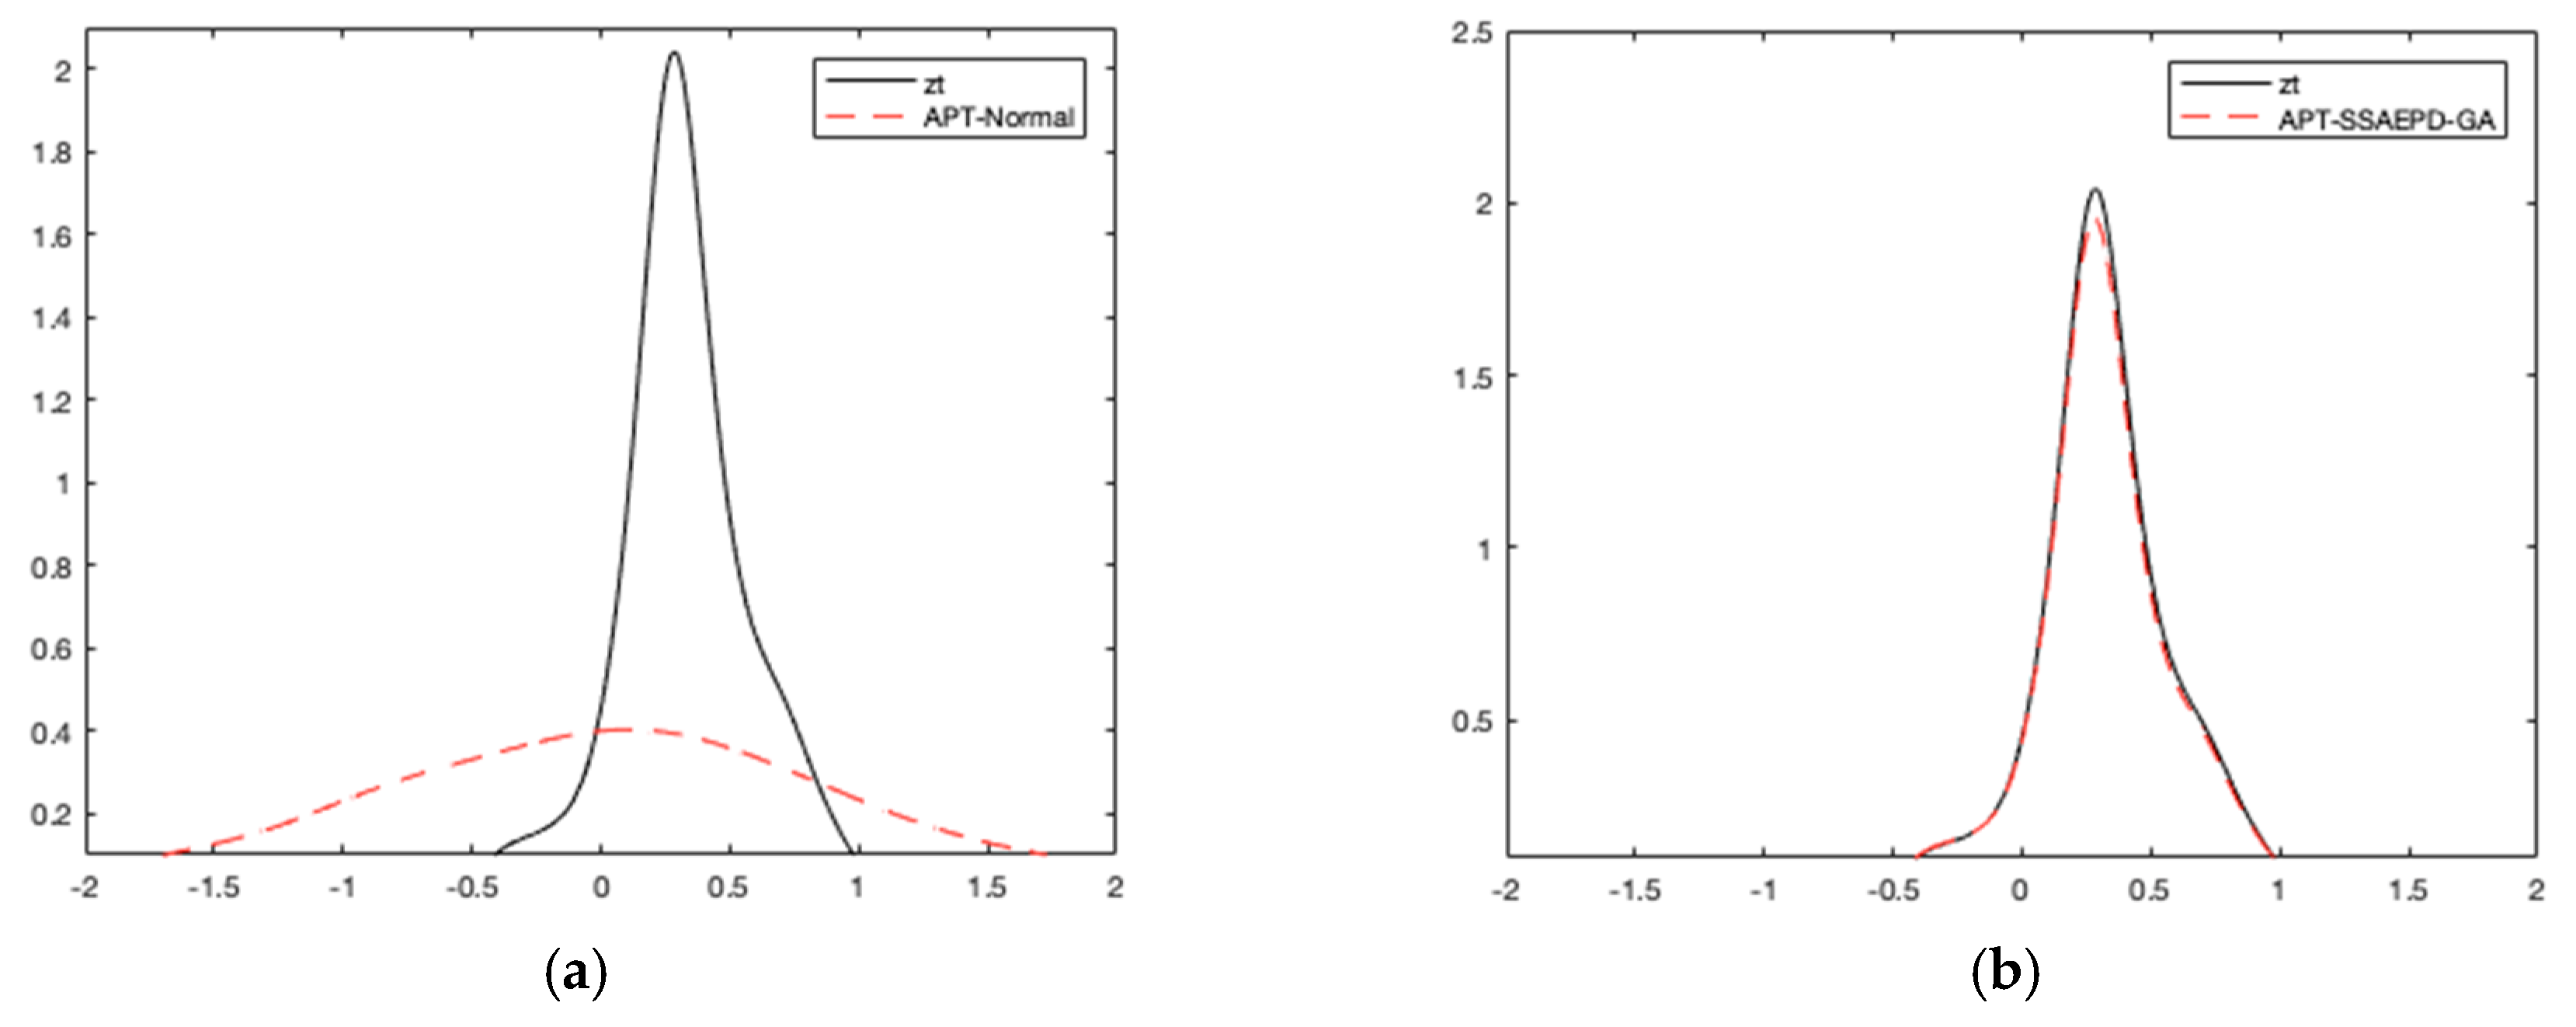
4.3.2. Residual Comparison of China’s Carbon Pricing

The test results for residuals show that the error terms of carbon price follow the SSAEPD distribution, and the APT-SSAEPD-GA and APT-SSAEPD-IP models are adequate for China’s regional carbon price. However, the APT-Normal is inadequate, as most of its residuals do not follow normal distribution.
First, we applied the Kolmogorov–Smirnov (K–S) test to check the residuals in both models. For the APT-SSAEPD-GA and APT-SSAEPD-IP models, the K–S test accepted the null hypothesis at the 5% significance level, whereas the null hypothesis of APT-Normal was rejected. As expected, the SSAEPD provides a better fit than the normal distribution.
Second, we applied the likelihood ratio test to run normality tests. The results showed that the null hypotheses for skewness and tail parameters were rejected, confirming that both samples are asymmetric and have fat tails. Hence, we concluded that there is non-normality in the sample data.
Lastly, the results showed that the residuals are more likely distributed such as in the SSAEPD model. We thus drew conclusions from the PDF of the residuals. We found that these curves are very close to each other. However, we observed significant differences between the PDF of the residuals and that of the normal (0, 1).
We plot the residuals of the APT-Normal and APT-SSAEPD-GA in Figure 2a,b. In Figure 2, the difference between the PDFs of the real residuals and the APT-SSAEPD-GA is smaller, and these curves are very close to each other, unlike the APT-Normal. Therefore, we concluded that the APT-SSAEPD-GA closely fits the data.
We plot the residuals of the APT-SSAEPD-IP and APT-SSAEPD-GA in Figure 3a,b. Figure 3 shows that we captured the asymmetry tail more accurately using a genetic algorithm than an interior point algorithm.
The complete information transmission network of carbon emission trading market considers the investors in the carbon market as a psychological group. When the market is calm, investors’ concerns are quite scattered and their emotions are stable, and they seem like an objective group. However, once the market is strongly stimulated by an event such as major good or bad news, the investors’ concerns are immediately focused, and their emotions are quite excited. At this time, investors become a psychological group. The investors in the psychological group adopt the approach of “buying the winners,” which makes the price more unstable, thus making the distribution characteristics of carbon price heterogeneous, which is the fat-tail and asymmetric characteristics we observe in the carbon market.

4.4. Robustness Test

To test the robustness of the new model, we chose the Hubei carbon price as a sample. Using a stepwise regression analysis, we found the main factors influencing the carbon price. The main factors were SZA 2015, SZA 2014, Guangdong carbon price, SZA 2013, CER, Euro against Chinese Yuan, SZA 2017, and EUA. Table 5 provides the estimated results. The APT-SSAEPD-GA can capture the influencing factors and heterogeneous tail distribution of the Hubei carbon price.

4.5. Discussion

The empirical results showed that macroeconomy, similar products, energy price, and finance market all affect carbon price fluctuation. The carbon emissions trading price has a heterogeneous tail distribution due to the effect of factors such as market mechanism and heterogeneous events.

4.5.1. Influencing Factors and Carbon Price Mechanism

We discuss all the driving factors that can affect the carbon price fluctuation.

Macroeconomy

The parameter estimates (Table 4) show that the CSI 300 parameter is greater than zero. This means that macroeconomic growth drives the carbon price [22]. If growth is high in the macroeconomy, companies will quickly ramp up production. Increased production will then heighten the demand for power and industrial development, which, in turn, increase carbon emissions. The greater the emissions, the higher the demand for carbon emissions trading rights; therefore, carbon prices will rise. Conversely, economic downturns diminish carbon emissions, making it easier to implement emissions reduction targets efficiently and thus reduce the demand for carbon quotas. Therefore, macroeconomy is the main factor influencing carbon price.

Similar Products

The parameter estimates in Table 4 show that the SZA 2015, SZA 2017, and SZA 2013 parameters are greater than zero. The price fluctuations in carbon emissions in the same region could spread easily from one to another. The parameter estimates in Table 5 show that the CER and EUA parameters are greater than zero, which means international carbon price fluctuation also impacts China’s carbon price. As China is the largest supplier of CDM projects in the international carbon market, CER, which is also a substitute for China’s carbon emissions trading rights, affects its regional carbon emissions trading prices.

Energy Price

The parameter estimates in Table 4 and Table 5 show that the coal parameter is less than zero, indicating that higher energy prices lead to lower carbon prices. The energy price is closely related to the cost of production price. The volatility of energy prices will change the demand conversion of different energies. Different energies have different carbon emissions, thus forming an inner transmission mechanism between the energy market and the carbon emissions trading market. Therefore, changes in carbon prices have a close relationship with energy price fluctuations [23].

Exchange Rate

The parameter estimates in Table 4 and Table 5 show that the Euro against Chinese Yuan parameter is less than zero. As a participant in clean development mechanism projects, China faces an exchange rate volatility risk. The most common settlement currency in international carbon trading is the Euro, so changes in the exchange rate directly affect the carbon price.

4.5.2. Heterogeneous Tail Distribution

The complexity of the carbon emissions trading market yields a non-normal distribution of China’s carbon price return. We discuss two characteristics of carbon price distribution in this section: non-normal and heterogeneous tail distribution.

Non-normal Distribution of Carbon Price Return

The carbon market is not a simple, linear system; it results from anthropogenic global climate and temperature changes, a feature that other financial markets do not have. The correlation between the carbon price along with the effect of carbon emissions reduction and the evolution of the carbon market mechanism increases the complexity of the carbon financial market. The dynamic dependence between various products of the carbon market, as well as other markets such as stocks and energy, also implies a non-normal distribution of the carbon emissions trading price. In addition, the carbon trading price experiences massive fluctuations due to the emergence of information piles that cause a non-normal carbon trading price.

Heterogeneous Tail Distribution of Carbon Price Return

Rational behavior is generally interpreted as the pursuit of self-interest maximization. However, investors appear risk averse to small losses, but indifferent to a low chance of a large loss. This violates economic rationality as conventionally understood.
First, according to behavioral finance, investors in the financial market are limited rational, and they cannot fully follow the optimization principle when they are trading on the carbon market. Investors’ information processing is nonlinear, and the current price cannot immediately reflect this information. The cumulative effect of information increases the price volatility, causing a fat-tail phenomenon.
Second, carbon price behavior is asymmetric, where the long-term bearish probability is greater than the long-term bullish probability. Given complex decision problems, investors in the carbon financial market often have cognitive biases due to their limited cognitive ability. According to prospect theory, the sensitivities to losses and gains differ, producing an asymmetric carbon emissions trading price. The deviation of investors’ expectation on price causes the “uying the winners” activity. The investors’ behavior is the fundamental reason for the fat-tail distribution of carbon price.

5. Conclusions

5.1. Conclusions

In the context of addressing climate change, the carbon emission trading scheme has become one of the main measures used to achieve emission reduction goals. One of the core problems in building carbon emissions trading markets is carbon pricing. The science and rationale of carbon emissions pricing determine the effect of the market function. The characteristics of the carbon market turn any carbon pricing mechanism into a complex affair. Therefore, examining the driving factors and characteristics of China’s carbon price can help improve carbon pricing, which has both practical and theoretical significance.
We thus used an empirical analysis with quantitative models to improve our understanding of carbon price formation mechanisms. We used the APT-SSAEPD-GA model to describe an asymmetric tail distribution and the influencing factors of China’s carbon price. This method improves carbon pricing accuracy and the effectiveness of China’s carbon market, further reducing emissions and achieving the sustainable development of a low-carbon environment.
Our empirical results showed that: (1) the influencing factors followed by the description of the heterogeneous tail could improve the accuracy of carbon pricing. APT-SSAEPD models could be used to price assets that have heterogeneous tail distributions and key drivers. The fit was better than that of APT-Normal, and the estimates of the SSAEPD parameters can capture the fat-tail and asymmetric effects in the data. (2) Investors’ behavior plays an important role in the heterogeneous tail distribution of carbon price. The sensitivities to losses and gains differ, and the “buying the winners” activity is the main reason for the heterogeneous tail distribution of carbon price.

5.2. Policy Implications

The international carbon emissions trading market and China’s emissions trading market have to be coordinated. The operational processes in China’s carbon market should maintain the stability of the regional quotas and the international carbon quotas. Therefore, the market could avoid impacts from violent fluctuations in the latter on the former. In constructing a national carbon market, managers can control a trial batch of certified emissions reduction projects, maintain stability in certification and emission reductions, and avoid the indirect effect of frequent international market changes on the operation of a carbon market.
The management system and principles should be perfected to guarantee the stability of the market operational mechanism. The complexity of the carbon financial market and the investor preferences impart an asymmetric fat-tailed distribution to China’s carbon price. The fat-tailed distribution shows that the probability of extreme events is greater than that of normal distribution. Thus, under the condition of heavy-tailed distributions, managing risks in the carbon emissions trading market is more important, especially the tail risk. Therefore, the market mechanism must be further improved, investors should be guided, and a stable policy environment should be created to reduce the carbon market risk. Hence, the government should ensure strong risk management and better market discipline through transparency. Policymakers can establish a unified trading platform, improve trading rules, and disclose information publicly. Policymakers also need to improve the investment environment by creating consistent and stable long-term policies that will give confidence to the investors. As such, a fully exertive market would realize the function of fair price discovery.
Investors’ psychological and behavioral reactions should be considered in China’s carbon pricing and risk management. The carbon price shows a peak and heavy-tailed phenomenon and cluster effects, with individuals showing evident nonsymmetric reaction to good and bad news. The asymmetry of carbon price shocks indicates that market mechanisms in emerging markets are not yet sound; it also shows the uninformed approach of the traders to investments. Thus, investors’ behavior impacts carbon price. In this case, we should consider investors’ behavior in China’s carbon pricing and risk management.

5.3. Future Studies and Limitation

Future studies that could extend our work include, but are not limited to, the following. First, as shown, the APT-SSAEPD-GA model can characterize China’s regional carbon price. From the perspective of risk management, the risk of extreme events is higher than under the normal distribution because of the fat tail; thus, future studies could apply the SSAEPD to risk management (e.g., calculating value at risk). This method also can be extended to the international carbon emissions trading market. Second, as the heterogeneous tail distribution is shown by China’s carbon price, we know that some influencing factor has not been considered, such as investors’ psychology and behavior; thus, future studies could consider investors’ behavior in carbon pricing. Third, with the spread of COVID-19, the global finance market has crashed sharply; thus, we can apply SSAEPD to discuss the impact of special events on financial markets.
The research method in this study is valid only when its conditions are satisfied. One of the important conditions is that observation data are sufficient. In the emerging markets, if the sample data are inadequate, it is difficult to calculate the real numerical value, and the parameter may not reveal the actual value.

Author Contributions

Conceptualization, X.Y. and C.Z.; methodology, X.Y. and Y.Y.; model code analysis, P.Y. and X.Y.; formal analysis Y.W. and X.Y.; writing–original draft preparation, X.Y. and Z.A.W.; writing–review and editing, X.Y. and C.Z.; supervision, C.Z. All authors have read and agreed to the published version of the manuscript.

Funding

This research was funded by the National Natural Science Foundation of China Nos. 71971071 and 71373065.

Acknowledgments

The authors thank the editors and reviewers for their attention and concern.

Conflicts of Interest

The authors declare no conflicts of interest.

References

  1. Nie, L.; Wang, W.J. Study on the game price game of carbon emission in China. Price Theory Pract. 2014, 5, 38–40. [Google Scholar]
  2. Zhang, C.; Yang, X. China’s regional carbon price forecasting based on Grey-Markov model. Stat. Decis. 2016, 9, 92–95. [Google Scholar]
  3. Zhu, B.; Wang, P.; Wei, Y. Multi scale analysis on the influence factors of carbon price based on EMD. Econ. Perspect. 2012, 6, 92–97. [Google Scholar]
  4. Hintermann, B.; Peterson, S.; Rickels, W. Price and Market Behavior in Phase II of the EU ETS: A Review of the Literature. Rev. Environ. Econ. Policy 2014, 110, 1381–1394. [Google Scholar]
  5. Hai, X.H. Research on Carbon Dioxide Price of EU ETS based on MSVAR. J. Financ. Econ. Theory 2017, 6, 37–46. [Google Scholar]
  6. Christiansen, A.C.; Arvanitakis, A.; Tangen, K.; Hasselknippe, H. Price determinants in the EU emissions trading scheme. Clim. Policy 2005, 5, 15–30. [Google Scholar] [CrossRef]
  7. Lutz, B.J.; Pigorsch, U.; Rotfuß, W. Nonlinearity in cap-and-trade systems: The EUA price and its fundamentals. Energy Econ. 2013, 40, 222–232. [Google Scholar] [CrossRef] [Green Version]
  8. Mansanet-Bataller, M.; Chevallier, J.; Hervé-Mignucci, M.; Alberola, E. EUA and sCER phase II price drivers: Unveiling the reasons for the existence of the EUA–sCER spread. Energy Policy 2011, 39, 1056–1069. [Google Scholar] [CrossRef] [Green Version]
  9. Zhang, Y.; Wang, K.; Wei, Y.; Liu, L. International Carbon Market and Its Impacts on CO2 Emission Abatement. In Energy Economics: CO2 Emissions in China; Springer: Berlin/Heidelberg, Germany, 2011; pp. 231–299. [Google Scholar]
  10. Hammoudeh, S.; Nguyen, D.K.; Sousa, R.M. What explains the short-term dynamics of the prices of CO2 emissions? Energy Econ. 2014, 46, 122–135. [Google Scholar] [CrossRef]
  11. Zhang, C.; Yang, Y.; Zhang, T. The Integrated Measurement about Carbon Finance Market Risk of Commercial Banks Based on Copula Model. Chin. J. Manag. Sci. 2015, 23, 61–69. [Google Scholar]
  12. Zhang, Y.J.; Huang, Y.S. The multi-frequency correlation between EUA and sCER futures prices: Evidence from the EMD approach. Fractal 2015, 23, 1–18. [Google Scholar] [CrossRef]
  13. Zhang, Y.J. Research on carbon emission trading mechanisms: Current status and future possibilities. Int. J. Glob. Energy Issues 2016, 39, 89–107. [Google Scholar] [CrossRef]
  14. Jia, J.J.; Xu, J.H.; Fan, Y. Impact of Pivotal Announcement Event on Carbon Price in European Union Emission Trading Scheme. Bull. Chin. Acad. Sci. 2018, 32, 1347–1355. [Google Scholar]
  15. Tzang, S.W.; Wang, C.W.; Yu, M.T. Systematic risk and volatility skew. Int. Rev. Econ. Financ. 2016, 43, 72–87. [Google Scholar] [CrossRef]
  16. Sanin, M.E.; Violante, F.; Mansanet-Bataller, M. Understanding volatility dynamics in the EU-ETS market. Energy Policy 2015, 82, 21–331. [Google Scholar]
  17. Montagnoli, A.; Vries, F.P.D. Carbon trading thickness and market efficiency. Energy Econ. 2010, 32, 1331–1336. [Google Scholar] [CrossRef]
  18. Dutta, A. Modeling and Forecasting the Volatility of Carbon Emission Market: The Role of Outliers, Time-varying Jumps and Oil Price Risk. J. Clean Prod. 2017, 172, 2773–2781. [Google Scholar] [CrossRef]
  19. Benz, E.A.; Trück, S. Modeling the Price Dynamics of Co2 Emission Allowances. Energy Econ. 2009, 31, 4–15. [Google Scholar] [CrossRef]
  20. Zhu, D.; Zinde-Walsh, V. Properties and estimation of asymmetric exponential power distribution. J. Econ. 2007, 148, 86–99. [Google Scholar] [CrossRef] [Green Version]
  21. Zhu, J.Y.; Li, L.L. Analysis of the CDS Correlation Based on a New VAR-GARCH Model with SSAEPD Margins. China Financ. Rev. Int. Conf. 2015, 26, 37–62. [Google Scholar]
  22. Tong, X.; Li, X.; Tong, L.; Jiang, X. Spatial spillover and the influencing factors relating to provincial carbon emissions in china based on the spatial panel data model. Sustainability 2018, 10, 4739. [Google Scholar] [CrossRef] [Green Version]
  23. Liu, Y.; Xiao, H.W.; Zikhali, P.; Lv, Y.K. Carbon Emissions in China: A Spatial Econometric Analysis, at the Regional Level. Sustainability 2014, 6, 6005–6023. [Google Scholar] [CrossRef] [Green Version]
Figure 1. Framework of China’s carbon pricing.
Sustainability 12 02754 g001
Figure 2. Probability density functions (PDFs) of (a) arbitrage pricing theory-normal (APT-Normal) and (b) arbitrage pricing theory-standardized standard asymmetric exponential power distribution-genetic algorithm (APT-SSAEPD-GA) residuals.
Sustainability 12 02754 g002
Figure 3. PDFs of (a) arbitrage pricing theory-standardized standard asymmetric exponential power distribution-interior point (APT-SSAEPD-IP) and (b) APT-SSAEPD-GA residuals.
Sustainability 12 02754 g003
Table 1. Descriptive statistics of China’s carbon price returns.
Shenzhen Allowance 2013 (SZA 2013)Shenzhen Allowance 2014 (SZA 2014)Shenzhen Allowance 2015 (SZA 2015)Shenzhen Allowance 2016 (SZA 2016)Shenzhen Allowance 2017 (SZA 2017)Shenzhen Allowance 2018 (SZA 2018)
Mean−0.0023−0.0020−0.0020−0.0025−0.0022−0.0024
Maximum0.25980.09610.19060.09650.09620.1280
Minimum−0.1056−0.1061−0.1762−0.2100−0.3157−0.1379
SD0.03740.052970.05460.07640.06380.0478
Skewness0.5017−0.2068−0.1738−0.1261−0.5702−0.2759
Kurtosis13.73093.58953.81571.81984.34314.5366
Jarque–Bera1989.20808.881513.461924.94253.166745.6535
Probability0.000.010.000.000.000.00
Table 2. Factors influencing China’s regional carbon price.
FactorsIndex
International economic developmentStandard and Poor’s 500 Composite Stock Price Index (S&P 500)
Domestic economic developmentChina Securities Index 300 (CSI300)
Similar productCertification emission reduction (CER)
European Union allowance (EUA)
SZA 2013
SZA 2014
SZA 2015
SZA 2016
SZA 2017
Fujian carbon price
Tianjin carbon price
Beijing carbon price
Hubei carbon price
Guangdong carbon price
Shanghai carbon price
Chongqing carbon price
Shenzhen carbon price
Energy priceCoal price
Oil price
Exchange rateEuro against Chinese Yuan
Table 3. Stepwise regression analysis of China’s carbon price.
Influencing FactorCoefficient
SZA 20150.1512 ***
SZA 20170.1091 ***
SZA 20130.1732 ***
Fujian carbon price−0.1151 ***
CSI 3000.4012 **
Tianjin carbon price0.3073 **
Euro against Chinese Yuan−0.7108 *
Shanghai carbon price−0.0448 *
Coal−0.2922 *
Note: *,**, and *** indicate significance at the 10%, 5%, and 1% levels, respectively.
Table 4. Estimates for the models.
FactorsArbitrage Pricing Theory-Normal (APT-Normal)Arbitrage Pricing Theory-Standardized Standard Asymmetric Exponential Power Distribution-Interior Point (APT-SSAEPD-IP)Arbitrage Pricing Theory-Standardized Standard Asymmetric Exponential Power Distribution-Genetic Algorithm (APT-SSAEPD-GA)
SZA 20150.15030.17000.1967
SZA 20170.10770.10580.3584
SZA 20130.17050.99350.9991
Fujian carbon price−0.1167−0.1913−0.2101
CSI 3000.40350.69800.7631
Tianjin carbon price0.31570.31590.4098
Euro against Chinese Yuan−0.7096−1.0300−1.1124
Shanghai carbon price−0.0453−0.0423−0.0710
Coal−0.3318−0.4470−0.5212
α0.50.64480.7009
p120.79750.9792
p220.26220.2912
Akaike information criterion (AIC)−3.3165−4.9775−5.7251
Schwarz criterion (SC)−3.2187−4.9678−5.7153
Note: α: skewness parameter; p1 and p2: tail parameters.
Table 5. Robustness test for arbitrage price theory-standardized standard asymmetric exponential power distribution models.
FactorsAPT-NormalAPT-SSAEPD-IPAPT-SSAEPD-GA
SZA 2015−0.0897−0.3709−0.4903
SZA 20140.06660.0904−0.1507
Guangdong carbon price0.09480.20330.2180
SZA 2013−0.0539−0.1521−0.1713
CER0.05970.08730.0967
Euro against Chinese Yuan−0.4215−0.7017−0.8144
SZA 20170.02120.04060.0637
EUA0.03740.1549−0.2501
α0.50.41900.4225
p120.47600.4761
p221.15371.2842
AIC−3.9132−4.0214−4.9468
SC−3.8252−4.0116−4.9371
Note: α: skewness parameter; p1 and p2: tail parameters.

