Article

Spatio-Temporal Nonstationary Effects of Impact Factors on Industrial Land Price in Industrializing Cities of China

1
School of Public Administration, China University of Geosciences (CUG), Wuhan 430074, China
2
The Key Laboratory of the Ministry of Natural Resources for Legal Evaluation Engineering, Wuhan 430074, China
3
Department of Geography and Center for Environmental Sciences and Engineering, University of Connecticut, Mansfield, CT 06269, USA
*
Author to whom correspondence should be addressed.
Sustainability 2020, 12(7), 2792; https://doi.org/10.3390/su12072792
Submission received: 20 January 2020 / Revised: 11 March 2020 / Accepted: 12 March 2020 / Published: 1 April 2020
(This article belongs to the Section Economic and Business Aspects of Sustainability)

Abstract

:
Industrialization has brought about great differences in industrial development and land use demand among different regions and cities, especially in rapidly industrializing countries with a vast territory. In those areas, implementing local-specific policies on industrial land price is of great significance to improve industrial land use efficiency and facilitate the sustainable development of regional economy. Based on the land pricing monition files of 105 industrializing cities, geographically weighted regression (GWR) was applied to detect the spatial variation of the industrial land price and its main impact factors (for example, tax, leased land, population, and location quotient index) in China in 2009, 2011 and 2014. The results show that the relationships were generally spatio-temporally nonstationary. More specifically, while the effect of tax on industrial land price was significantly positive and spatially stable all over China in 2009, the effect varied spatially in the two later studied years, weakened in North and East China and strengthened in South China. The effect of leased land on industrial land price was generally negative; it was very weak in 2009 and 2011 but became negatively strong in most studied cities in 2014, except for a few cities in Middle China. Population had a significant positive effect on industrial land price in the cities of East and Northeast China. For the three studied years, the location quotient index always had negative effect in Bohai Economic Rim and positive effect in Yangtze River Delta Economic Zone, and the negative effect strengthened with time. Meanwhile, the underlying reasons behind the relationships were further analyzed, showing that the spatio-temporal changes of industrial land price are closely correlated with the population mobility, industrial agglomeration, government intervention and economic situation.

1. Introduction

With the rapid development of industrialization, numerous industrial districts were established in cities and even in some towns, which is quite common in developing countries like China [1,2,3,4]. During the process of pursuing economic growth, industrialization has been bonded with the policies of local governments tightly [5,6]. The local governments lowered industrial land prices to an abnormal level to attract investment, which caused excessive occupation of cultivated land and inefficient use of industrial land [1,7,8]. As a result, a large amount of industrial land has been leased over the past 40 years, and the demand for industrial land has been going up constantly [9,10,11,12]. This phenomenon has promoted the development of social economy, but it also had a far-reaching impact on the sustainable land use, and even caused environmental chaos [13,14,15,16,17].
Industrial land is one of the most basic production factors in the development of an industrial economy [1,6,10]. The industrial land price, as an important piece of information and the criterion of value during the process of land market operation, is closely related to regional land use policies [18]. In China, there are two types of land ownership: state ownership and collective ownership. All land in the People’s Republic of China belongs to the state; corporate entities and individuals are not permitted to own land, although they may own the property above the land. Compared to other countries, government intervention in China’s land market became stronger over the past few years under the state-owned urban land system [9,15,19]. In the year of 2002, the Department of Landing and Resources of China released the Bidding Auction Listing Transferring State-owned Landing Usage Rights Regulations, which straightly outlined that land used for the purpose of business, tourism, entertainment and commercial dwelling houses, etc. must be leased by bidding, auction or listing. Nonetheless, the local government, a market actor, often makes rules that facilitate exchange [2,10,15]. For example, some local governments frequently leased industrial land at a low price through agreements to boost higher fiscal revenue [8]. Here agreement refers to the contract on land use rights between intending land users and governments. With a purpose to optimize the resource allocation, in 2006, National Bottom Price Standard for Industrial Land Transfer in China was released, which stipulated that industrial land must be leased by bidding, auction or listing, and, moreover, the transaction price should not be lower than the minimum price formulated by various local implementation rules in different cities. Under this system, market forces, which play an increasingly important role in industrial land leasing, motivated the formation of the land prices gradient in some economically developed areas [20]. Meanwhile, owing to the lack of strict supervision over policy implementation and the fierce competition in economic development among local governments, unbalanced land supply led to an unscientific industrial structure [9,16]. In this context, supply-side structural reform was firstly proposed by the Chinese government in 2015, hoping to make the supply system more suitable to the change in the demand structure by improving supply efficiency.
The heterogeneities of regional economic growth and land market development have emerged in East China, Middle China and West China, which has resulted in different levels of industrial development and the demand for industrial development land in the future. During the rapid industrialization, although tremendous efforts have been made in industrial land management, unified policy of central government cannot adjust specific measures to local conditions [10,20,21]. Therefore, the implementation of local-specific policies about industrial land price is of great significance to improve land use efficiency and boost the development of the regional economy [3,22]. As the basis for policy-making, it is critical to have the knowledge of the spatio-temporal connections of industrial land price in different cities and effects of driving forces [23,24,25].
Studies on industrial land price and their impact factors can be dated back to 1990s. A common finding is that location is a basic impact factor for industrial land price. Kowalski and Paraskevopoulos [23] pointed out that the transportation accessibility may affect industrial land price by more than 50%. Atteberry and Rutherford [18] described the relationships between economic variables (i.e., monetary base, New York Stock Exchange industrial) and industrial real estate prices. Lockwood and Rutherford [24] stated that many local market characteristics can affect the values of industrial buildings, by taking the example of the Dallas/Fort Worth area case during 1987 to 1991, where the most significant factors include employment rate, national income and consumer price. Saz-Salazar and García-Menéndez [26] found that location plays an important role in industrial land price, including the distances to highway, city business district and the capital of the province. Many studies addressed that industrial land price varied with market factors. Other impact factors have been explored as well; for example, lots zoned for industrial use [27], land value [4], industrial agglomeration [6], environmental pollution [28], source of land supply [26] and strategy made for foreign investment [8]. Existing research has noticed that the price of industrial land is affected by itself and the external macro-environment. However, the industrial land leasing price is significantly impacted by the action of neighboring cities [9]. Few efforts have been made to model and explain regional changes in industrial land price from a local perspective.
The geographically weighted regression (GWR) model provides a quantitative explanation method for revealing the spatio-temporal nonstationary relationships between a spatial variable and its predictors [29], which can be very helpful in making local-specific policies for industrial land management [30,31,32]. Recently, the GWR model has been extensively employed in different fields for investigating local effects instead of global effects of impact factors. Compared with the other universal spatial data approaches, like regression kriging, OLS (ordinary least squares) regression, or cokriging, the GWR model showed its advantages in improving the mapping feature or finding out local spatial variation [16,25,33,34,35,36,37,38]. In this study, GWR was employed to study the spatial variability of industrial land price and its relationships with the main impact factors in the major cities of China, which may provide valuable insights into the spatio-temporal variation mechanism of industrial land price and serve the policy making on scientific industry development in China.
The purpose of this paper is to detect the spatio-temporal connections of industrial land price and its main impact factors with the GWR model, so that we can better characterize the spatio-temporal variation of industrial land price in the main cities of China, analyze related local impact factors and their influencing mechanisms, optimize the local specific policies of industrial land use, and boost the development of the regional economy. The paper is organized as follows: Section 2 introduces the data sources, the GWR method and the selection of impact factors. The results of varying effects exerted by the major impact factors upon industrial land price are analyzed in Section 3. Section 4 discusses China’s industrial land market. Finally, the conclusions and limitations of this study are given in Section 5.

2. Materials and Methods

2.1. Research Program

An analytical framework was designed to detect the spatio-temporal nonstationary of the main factors affecting industrial land price. The main methods and procedure adopted in this frame mainly included industrial land prices differences, optimizing impact factors, spatio-temporal non-stationary effect and reasons analysis. First, the spatio-temporal differences of industrial land prices in 105 monitored cities in China were analyzed. The spatial differences in industrial land prices were discussed from 2001 to 2014 and the three specific years 2009, 2011 and 2014. The temporal differences in industrial land prices were explored from the eastern, middle, western and northeastern regions, as well as different metropolitan areas. Second, based on previous explorations, four factors—population, local quotient index, tax and leased land—were selected from urban size, accessibility, economic condition and social condition, respectively. Again, the GWR model was employed to reveal the spatio-temporal non-stationary relationship between impact factors and industrial land prices in 105 industrializing cities of China. Then, the estimating variation maps of regression coefficients and significant tests were generated using the GIS-based evaluation results to analyze the local effect differences of impact factors on land prices. Finally, considering the reality of China, this study reveals the cause of formation and differences in industrial land prices in 105 monitoring cities from the perspectives of population mobility, industrial agglomeration, land supply plan and local tax growth.

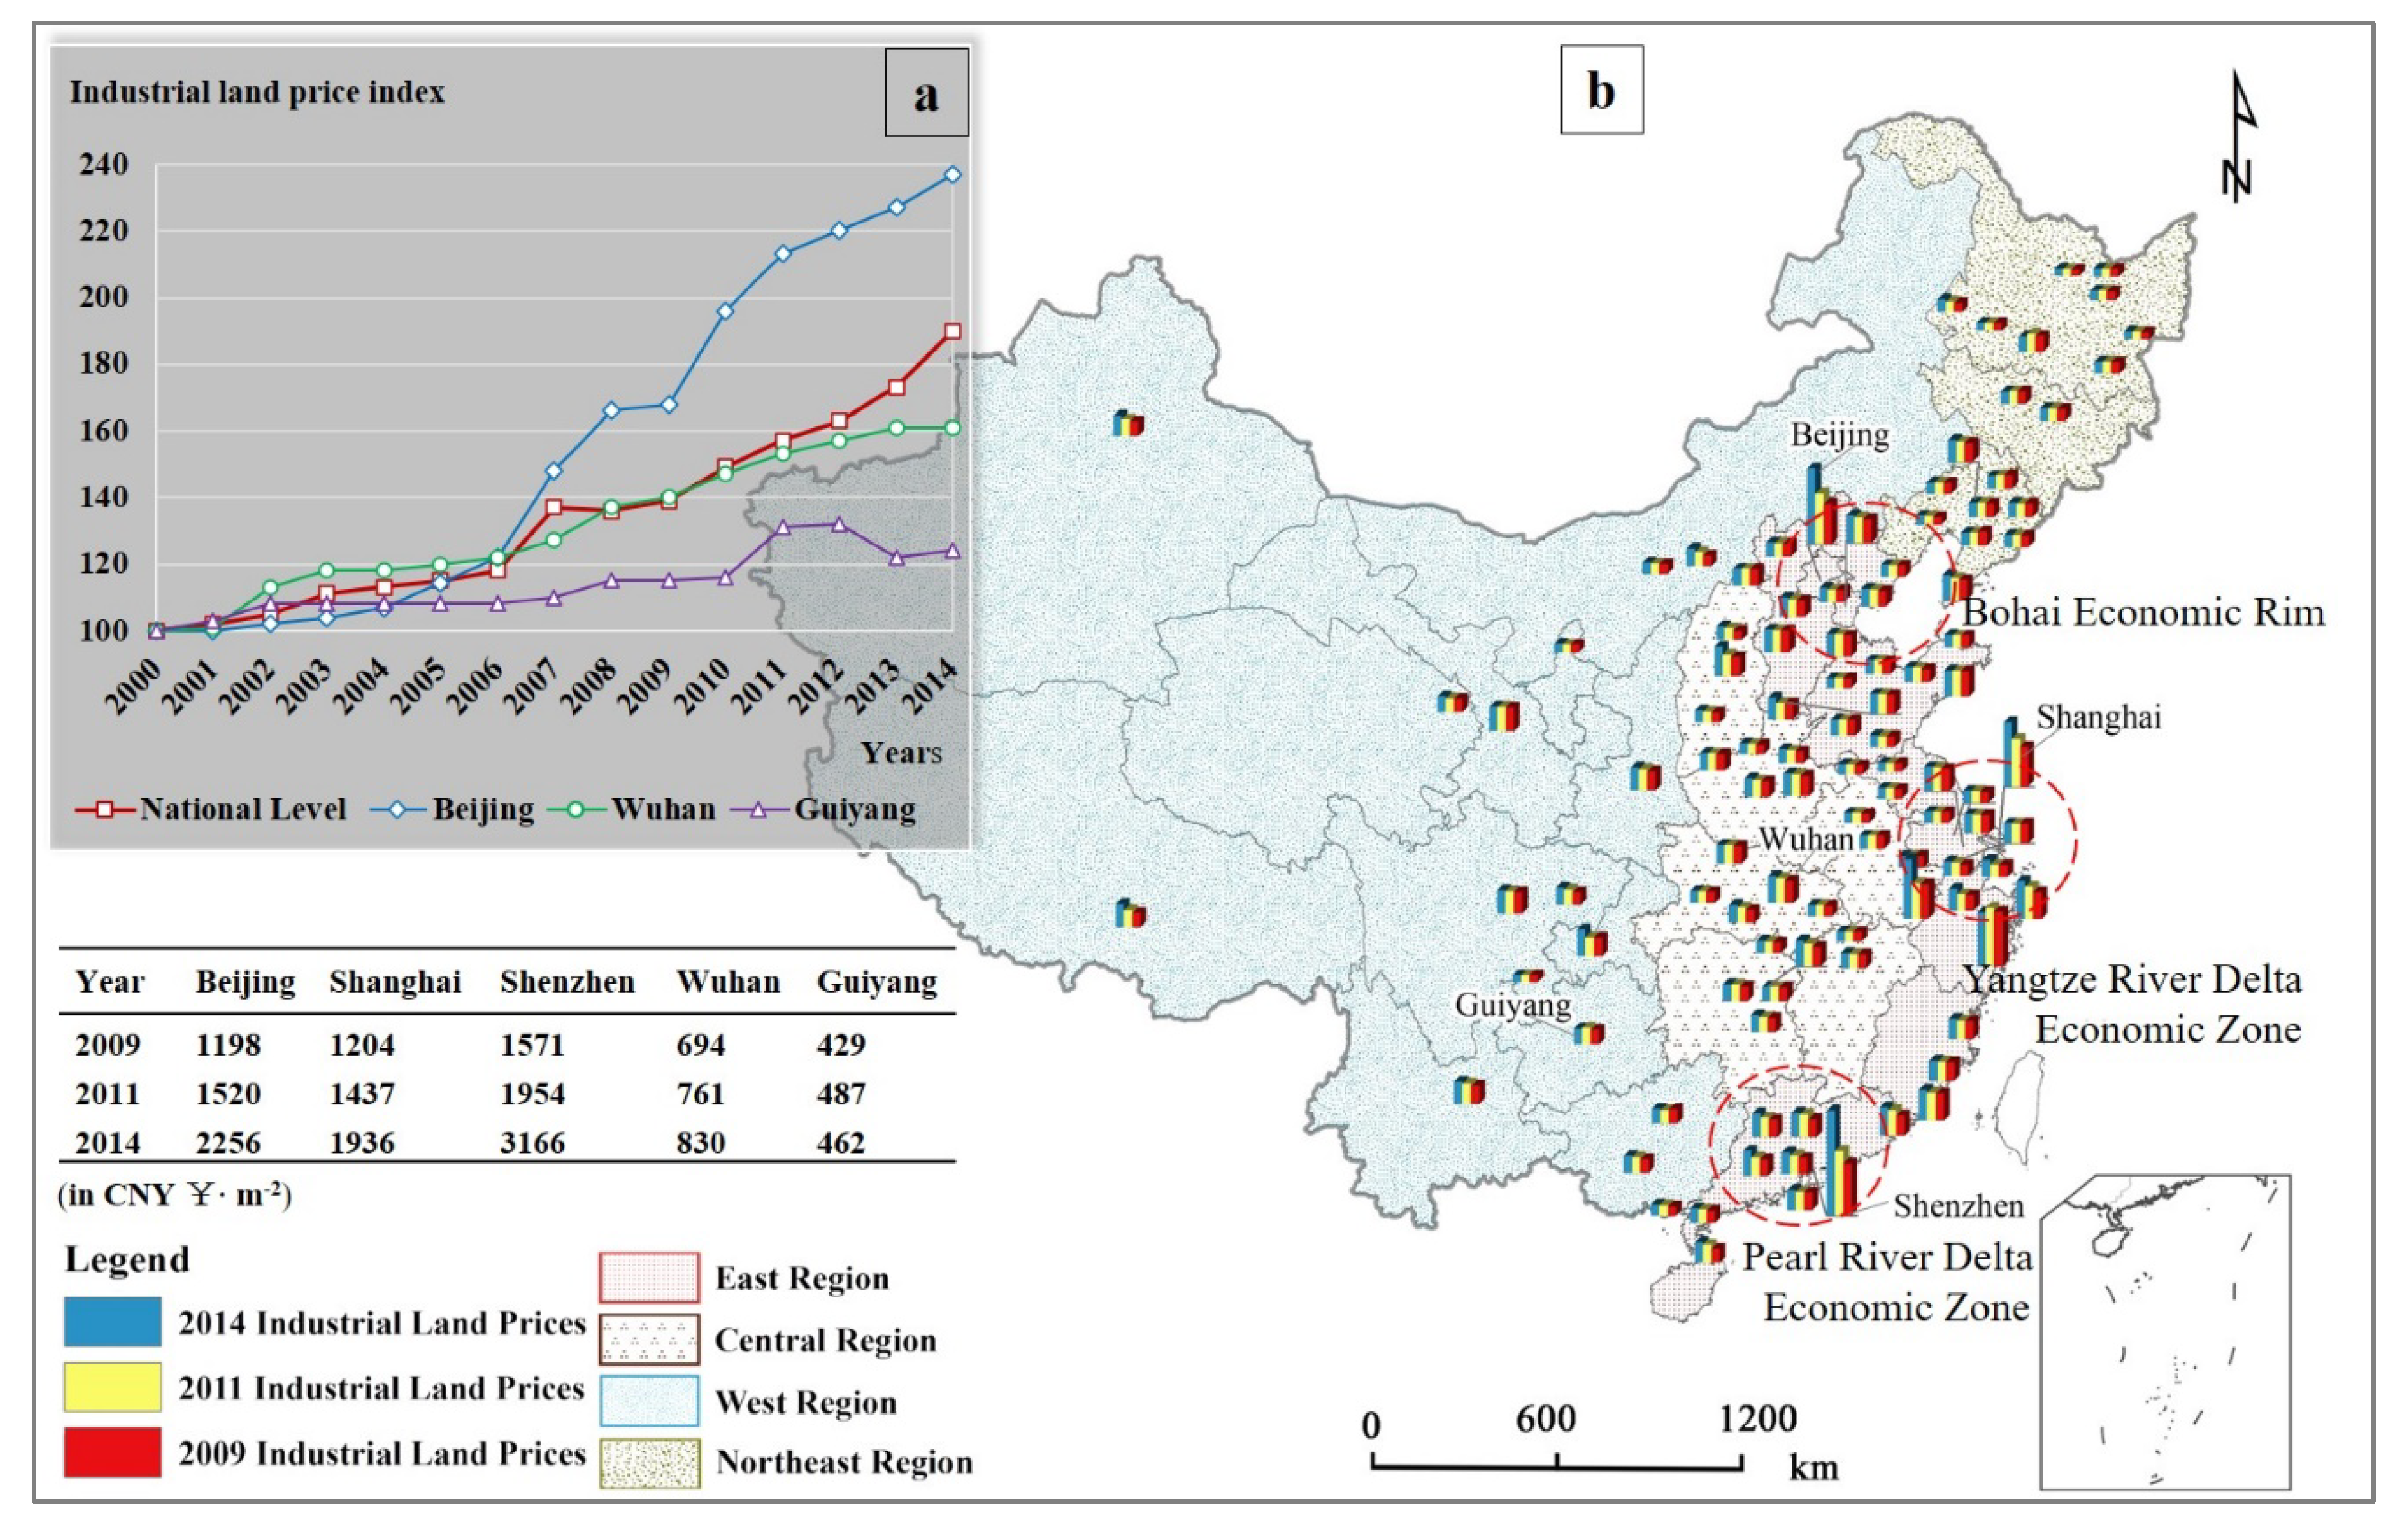
2.2. Industrial Land Price

China Urban Land Price Dynamic Monitoring System [39], the land price information provider, was established in 2000, with a coverage of 46 cities. With the purpose of observing, presenting and measuring city landing price, this system combines the functions of collecting statistics with the land pricing monition grades, processing the statistics and generating a set of landing indices. The land types being monitored contain commercial land, residential land and industrial land. The monition outcomes were stated yearly and quarterly for geographic aggregations at levels of nation, province, and special economic zones.
The China Urban Land Price Dynamic Monitoring System has enlarged its coverage to 105 industrializing cities since 2008 step by step. A large number of monitoring sample sites were set up in different land value regions of different cities by provincial land management departments. It is not hard to find that the samples distribute evenly in the study areas, in which monitored cities include eastern fast-growing cities (e.g., Beijing, Shanghai, and Shenzhen), middle medium-growing cities (e.g., Wuhan, Changsha, and Zhengzhou) and western slow-growing cities (e.g., Guiyang, Tibet and Urumchi). This is the first reason that why these data were selected. Second, after the implementation of National Bottom Price Standard for Industrial Land Transfer in 2006, the industrial land leasing converted from agreement between government and developers to bidding, auction or listing. As a result, the industrial land system is more dependent on the market, and the price of industrial land is more volatile. (Figure 1a). Third, by exploring the changes in impact factors and their effects in different periods, it is possible to find the essential characteristics of industrial land price. It is apparent that China’s economic growth has been facing huge challenges since the global financial crisis in 2008. After that, the Chinese government implemented a variety of strategies to promote industrial transition, hoping to resist the economic decline and rescue the shrinking export market. Therefore, the urban industrial land prices in 2009, 2011 and 2014 were used as dependent variables in quantitative analysis. The differences in industrial land price in the studied years are reported in Figure 1b. It is found from the Figure 1b that the price level of the first-tier cities represented by Shenzhen, Guangzhou, Shanghai and Beijing far exceeds that of other cities. Places of the Pearl River Delta Economic Zone, Yangtze River Delta Economic Zone and the Bohai Economic Rim led the rise nationwide. The imbalance between the eastern, middle and western regions has been increasing.

2.3. Impact Factors

Industrial land price is the result of the interaction of multiple factors and a long-term capitalization process. Previous studies have explored the relationship between land price and population and found that urban population is an important impact factor for land price [40,41]. It is widely acknowledged that the land demand will be expanded by the urban population growth, and the land price will be driven up accordingly under limited land supply. Due to the uneven development in China, the spatial difference in population distribution in China is closely related with the urban development level and the formation of the industrial land price gradient [3,22]. At the same time, based on the reality of China, one of the main methods for local governments to promote industrial agglomeration is to set up industrial districts [42]. Under certain supply conditions, the production cost can be reduced by interactive collaboration among industries, which will result in differential rent in different cities and cause fluctuation of industrial land price in a competitive environment [6,40,43]. In addition, tax revenue belongs to the group of the most significant indexes to weigh economic achievements of one place. While property tax can provide a steady stream of revenue for local government. In China, industrial value-added tax is not a one-time income and it is actually a stable source of revenue for local government if an enterprise settles down and operates regularly [44]. Also, the relevant research selected the land area supplied by government to measure the government intervention [26]. In the process of attracting foreign capital through land supply regulation, the advantages of economically developed areas outweigh that of the underdeveloped areas in land price competition, because the former can provide more financial subsidies or lower land price for investment projects [7,44]. Consequently, it is not difficult to find that population, economic development, industrial agglomeration and administrative decisions all will be capitalized in sales prices [45].
Based on land rent theory and location concept, taking the circumstance of land market in China and accessible statistics into consideration, typical impact factors, including population, location quotient index, tax, and leased land were selected to explain their changing spatio-temporal influences upon industry land price. The detail information and statistical description of factors are summarized in Table 1. The data of these factors (as independent variables for GWR analysis) were obtained from two available databases: data for population, tax, and location quotient index from China City Statistical Yearbooks [46], and data for leased land from China Land and Resources Statistical Yearbooks [47]. All the statistics of the impact factors were gathered in the unit of municipal district in the research. In order to check whether there exists multicollinearity or not, the variance inflation factors (VIF) of the impact factors were calculated. Table 1 shows that the multicollinearity issue is not a problem because all of the VIF values are smaller than 3.0, much lower than the cut-off value of 8.

2.4. Geographically Weighted Regression Model

Geographically weighted regression (GWR), the development of conventional linear regression (ordinary least squares, OLS), enables the dependent variables and independent variables to vary spatially [29]. A general version of the GWR model could be presented as:
y j = β 0 ( u j , v j ) + i = 1 p β i ( u j , v j ) x i j + ε j
where y j refers to the dependent variant; u j and v j are the geographical coordinates at place self-reliant variant x i at location j, respectively; and ε j is the error term.
The valuator of native coefficients is gained from the following expression:
β ^ ( u j , v j ) = [ X T W ( u j , v j ) X ] 1 X T W ( u j , v j ) Y
where β ^ ( u j , v j ) denotes the estimator of the location-specific parameter; X refers to one statistics pattern of self-reliant variants; Y refers to the statistics vector of dependent variables; and W ( u j , v j ) represents the native weights pattern that functions to guarantee that findings nearby the specific point weight heavier.
Within the research, the following adaption bi-square feature was adopted to estimate weight:
w i j = [ 1 ( d i j d max ( q ) 2 ) ] 2 if   d i j d max ( q ) ,   otherwise   w i j = 0
where w i j is the weight of observation j for location i , d i j is the Euclidean separation of observation i and j, and the maximum distance between any point i and its q neighbors is represented by d max .
Corrected Akaike information criteria (AICc, Equation (4)) was applied in this study to determine the adaptive bandwidth, and 105 surrounding data points were finally used for calibrating the GWR model at each location.
A I C c = 2 n log e ( σ ^ ) + n log e ( 2 π ) + [ n + t r ( S ) n 2 t r ( S ) ]
In Equation (4), n represents the total number of sample, σ ^ expresses the estimated standard deviation of error term, and t r ( S ) is the trace of the hat matrix S of GWR.

2.5. Model Fitting and Residual Spatial Autocorrelation

Previous research found that the GWR model can solve the problems of autocorrelated error terms in global OLS model [34]. In order to assess whether the residual spatial autocorrelation exists or not, the autocorrelation analysis was done in this study. Moran’s I statistic is generally applied index for spatial auto-connection, which is defined as
I = n i 1 n j 1 n w i j i 1 n j 1 n w i j ( y i y ¯ ) ( y j y ¯ ) i 1 n ( y i y ¯ ) 2
In Equation (5), n represents the total number of observations; y i and y j denote the geographically weighted regression residuals at locations i and j ; y ¯ refers to the mean of the residuals; and w i j refers to the element of spatial weight matrix.

3. Results

3.1. Evaluation of GWR Models

Table 2 presents the Moran’s I, AICc, and regulated R2 created by the three GWR patterns with the statistics of 2009, 2011 and 2014. The Moran’s I values show that the GWR remaining for 2009, 2011 and 2014 have extremely weak spatial autocorrelation (−0.02, −0.02 and 0.00, respectively). This means that there exists no clear extreme forecast or inadequate forecast on the results assessment of the GWR model. In addition, higher regulated R2 and lower AICc show that the GWR performed much better than the OLS model did in explaining spatio-temporally varying relationships in the three studied years. Therefore, the GWR was capable of addressing the issue of industrial land price change. Table 3 demonstrates the coefficient estimations of GWR patterns, containing one method of spatial change within the connections of industrial land price and explanation variants—the Inter-Quartile Scope of the coefficient estimations. The outcomes of “DIFF of Criterion” examinations (for example, DIFF < 2, Nakaya, 2014) show that three elements are greatly expected to be local.

3.2. Spatio-Temporal Varying Effects of Major Impact Factors

Ordinary kriging was used to interpolate the regression coefficients of tax, leased land, population and location quotient index. The results of interpolation in 2009, 2011, and 2014 are shown in Figure 2, Figure 3, Figure 4 and Figure 5. The local coefficients obtained from GWR models show that the native connections of the industrial land price and the four explanation variants are significantly spatio-temporally non-stationary. This means that the connections between the industry land price and the main impact factors are local specific. In addition, the significance of local parameter estimates in GWR was tested (Figure 6, Figure 7, Figure 8 and Figure 9) to avoid excessive false discoveries [38].

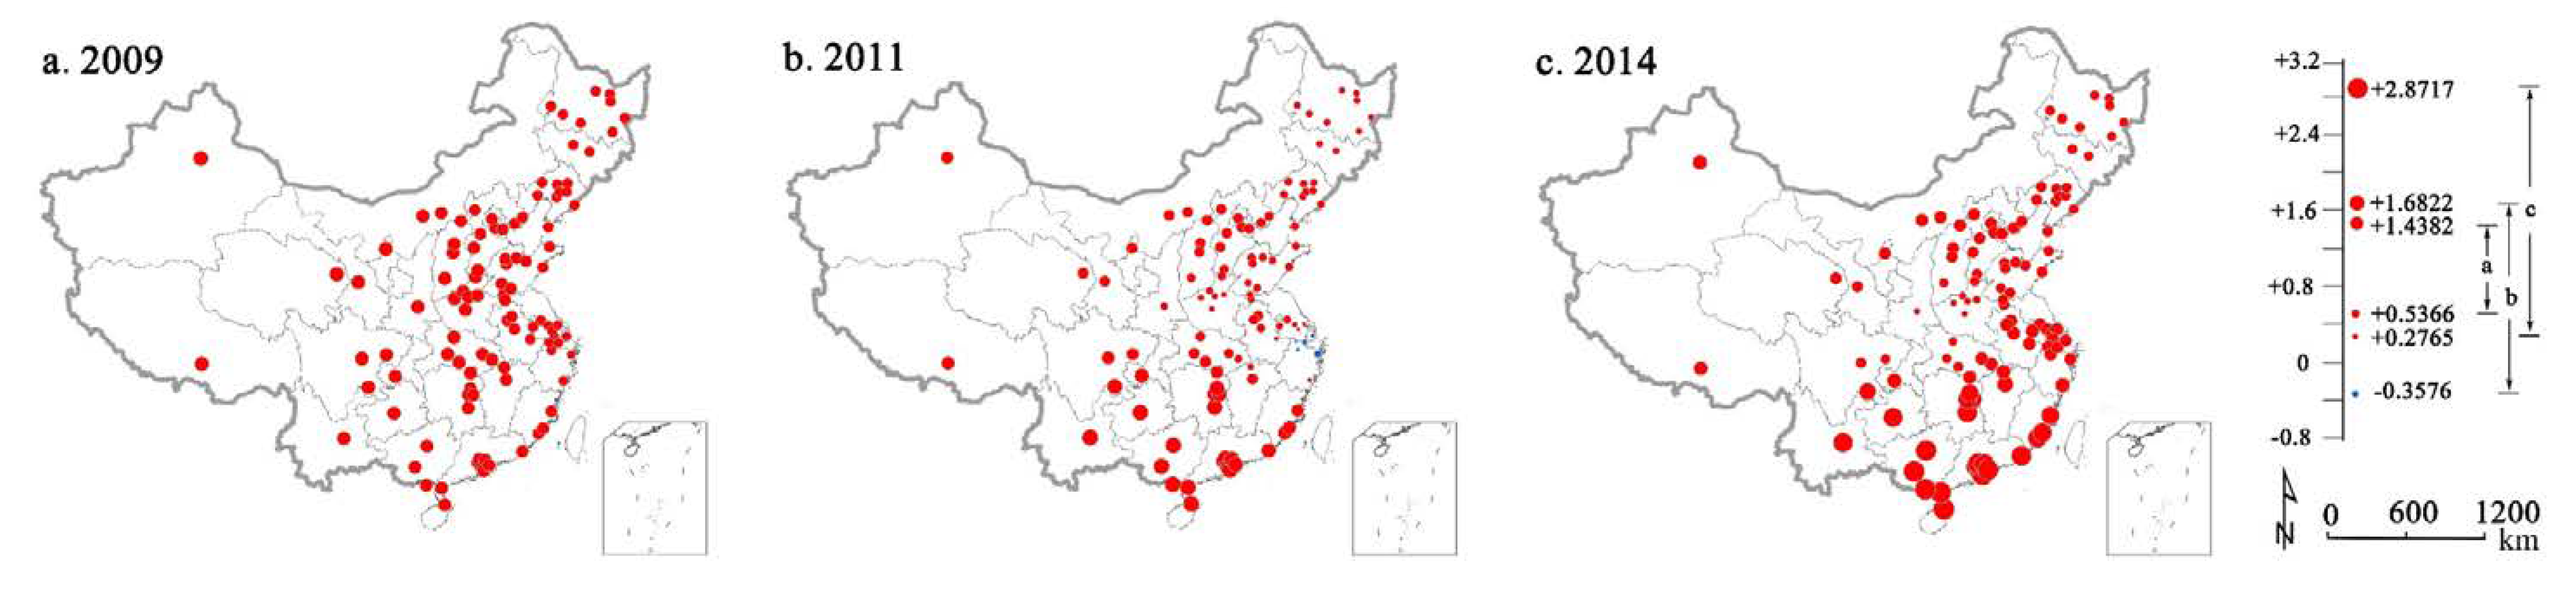
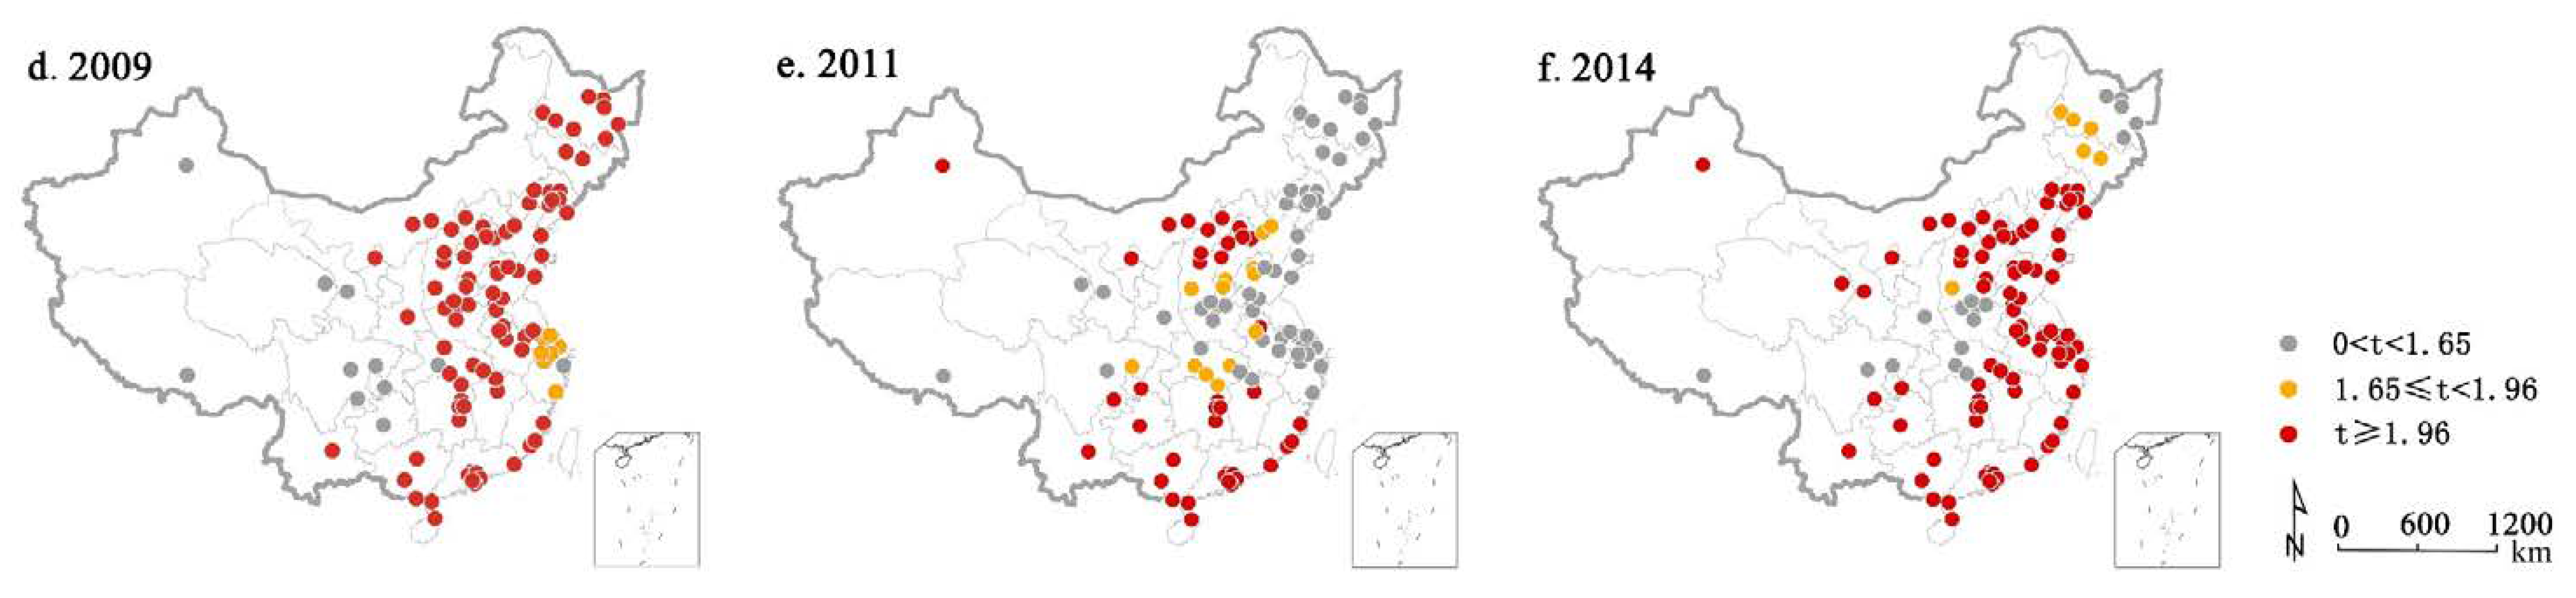
3.2.1. Relationship between Industrial Land Price and Tax

The spatial alterations for regression parameters of the duty variant for discrepant years are displayed in Figure 2. In 2009, tax had a significant positive effect on industrial land price and the effects all over the country were relatively homogenous, with the coefficient values ranging from 0.5366 to 1.4382. In 2011, the local coefficients ranged from −0.3576 to 1.6822, showing obvious spatial nonstationarity, with high values mainly occurring in South China, low values mainly in North China, and a few negative values in the Yangtze River Delta Economic Zone (see the major economic zones of China in Figure 1). In 2014, industrial land price in all the cities was strongly positively affected by tax, with tax’s coefficients ranging from 0.2765 to 2.8717, but the positive effect is much stronger in South China than that in North China. In general, a significant positive relationship existed between industrial land price and tax for all three years, and the magnitude increased from North to South in 2011 and 2014. The latter phenomenon might be caused by the regional difference in China’s economic development. First, the increase in tax made contributions to the development of industrial land price because the development of urban economic results in higher tax and higher land price. However, such a relationship became spatially unstable later, as shown by the data of 2011. The reason for this problem may be that local governments took different actions in South China and North China to attract investments. In addition, when the confidence levels for the t-values are considered, most of the correlations are significant (Figure 6) (significant at α = 0.05 level).

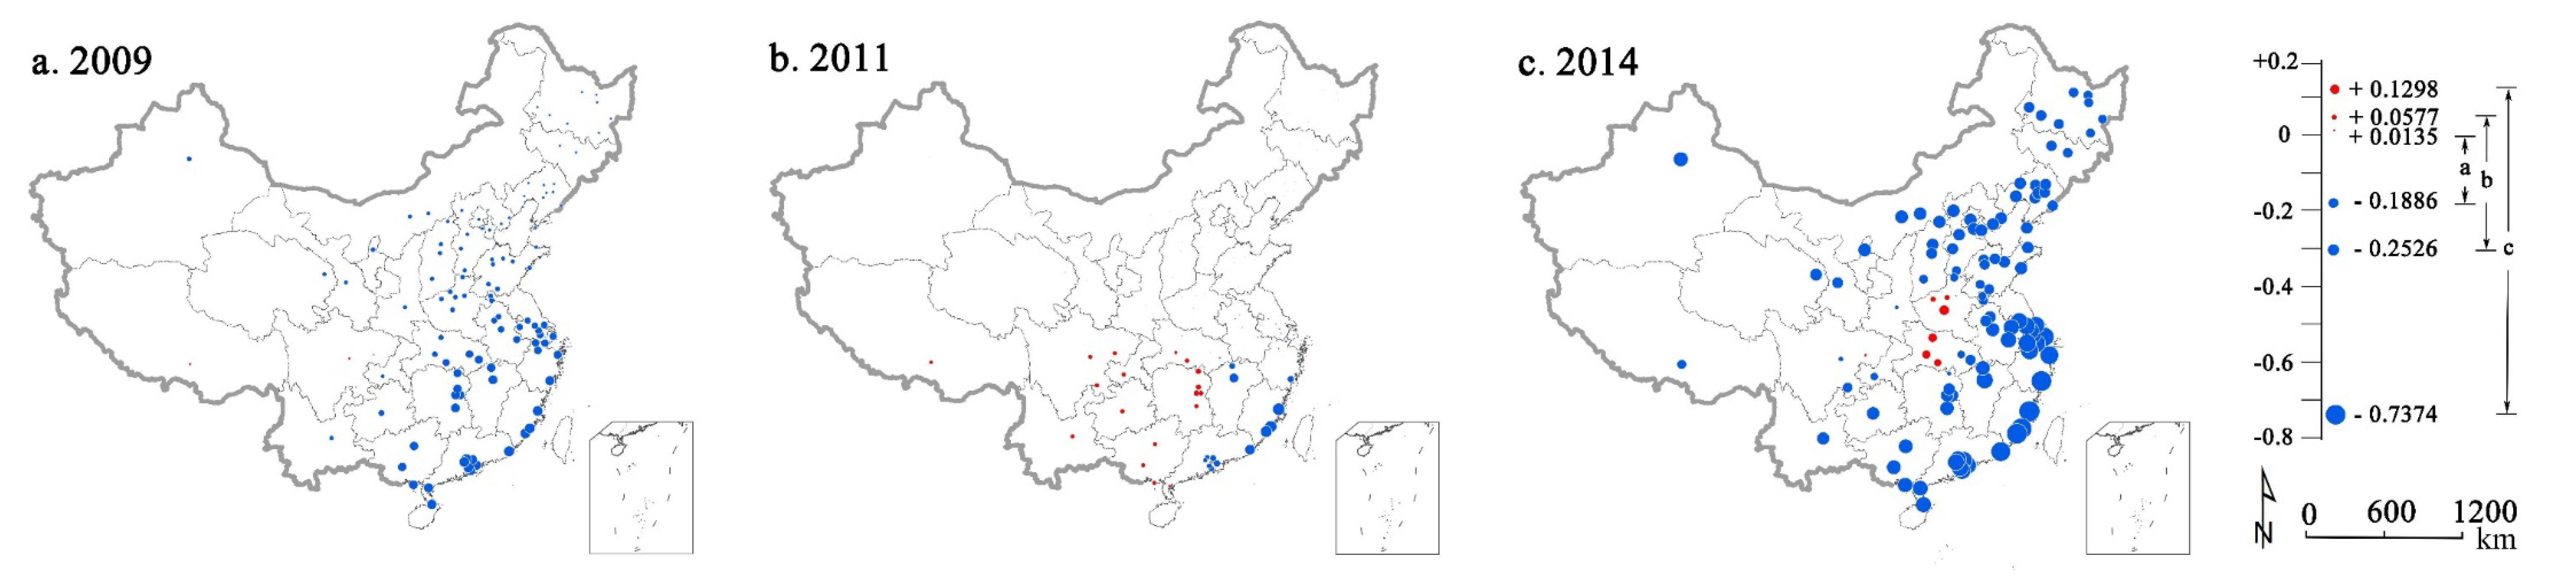
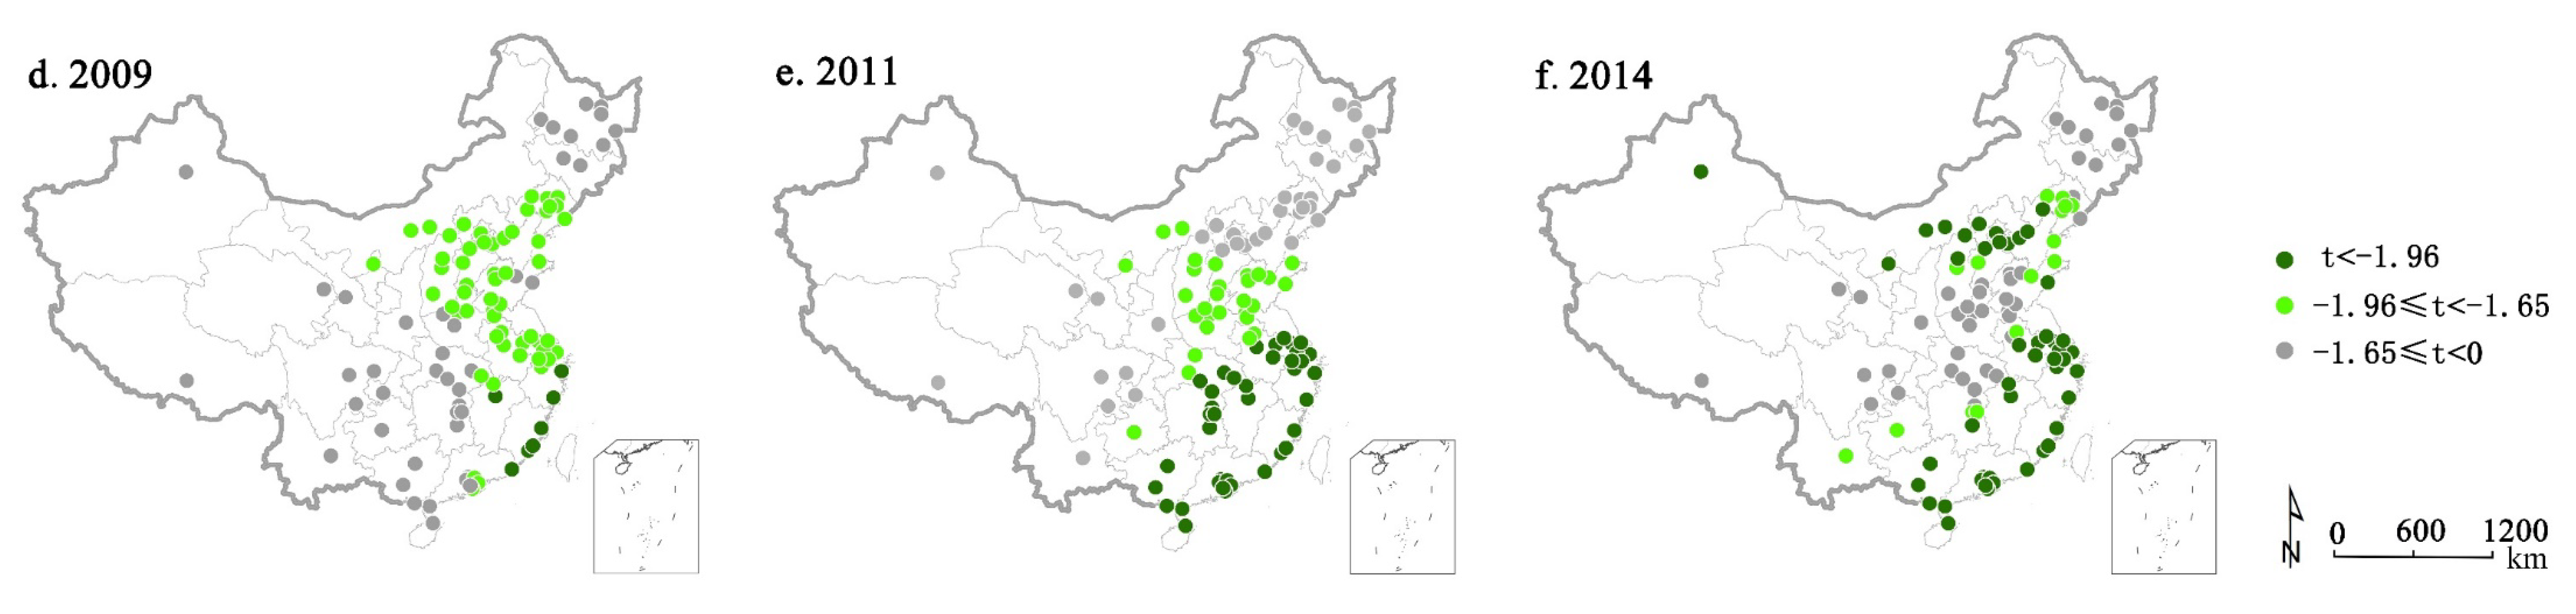
3.2.2. Relationship between Industrial Land Price and Leased Land

Both the positive and negative GWR coefficients between industrial land price and leased land were identified spatially (Figure 3). In 2009, negative correlation was observed in most cities with GWR coefficients ranging between −0.1186 to 0.0135, which implied that increasing leased land could result in land devaluing, especially in South China. In 2011, the number of cities with the negative effects of leased land on industrial land price declined, and in North China, leased land had little contribution to industrial land price (the coefficients are even invisible in North China in Figure 3b), In 2014, industrial land price in most cities received significant negative effects from leased land, except for those in a few cities in Middle China, and large negative coefficient values appeared in southeastern coastal places, particularly within the Pearl River Delta Economic Zone and Yangtze River Delta Economic Zone. The localized coefficients, shown in Figure 7, are significant in most areas. In general, in most cities of China, industrial land and leased land show negative relationship in studied years. Apparently, industrial land leasing has become a common phenomenon to attract investments for urban industry development in China under current economic situation. In the Midwest cities, the lower the industrial land prices are, the higher industrial land sales will be. However, in the cities with scarce land, the distribution of industrial land prices is subject to Marxist grade-rent theory, such as Beijing, Guangzhou, and Shanghai, with high industrial land price but little industrial land to sold.

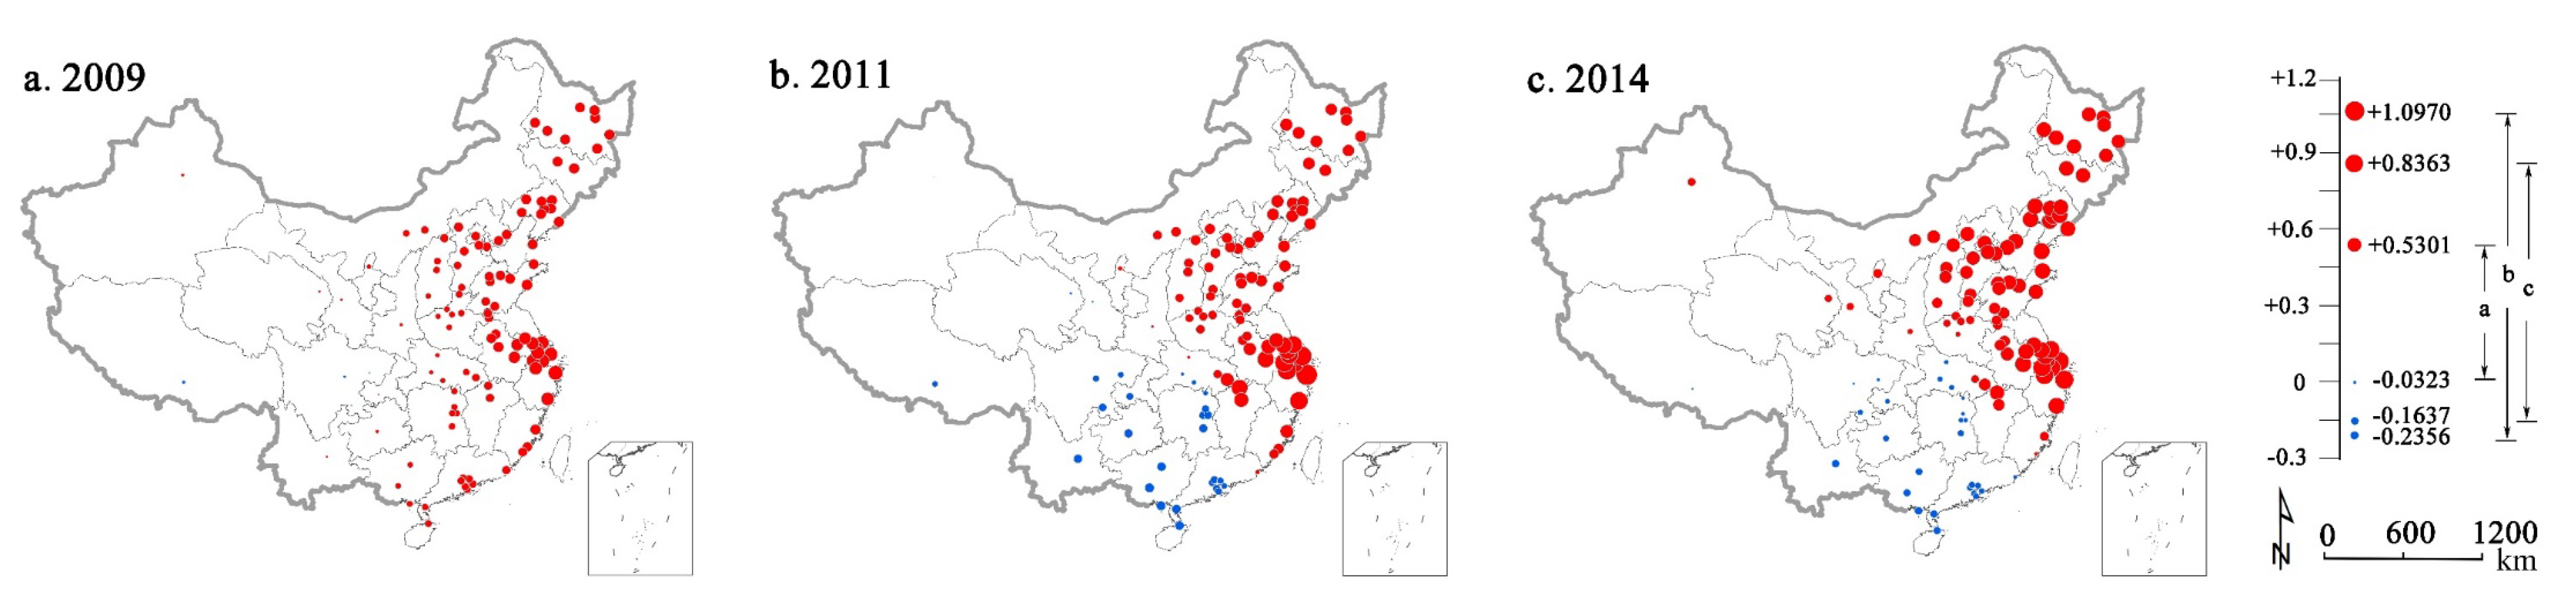
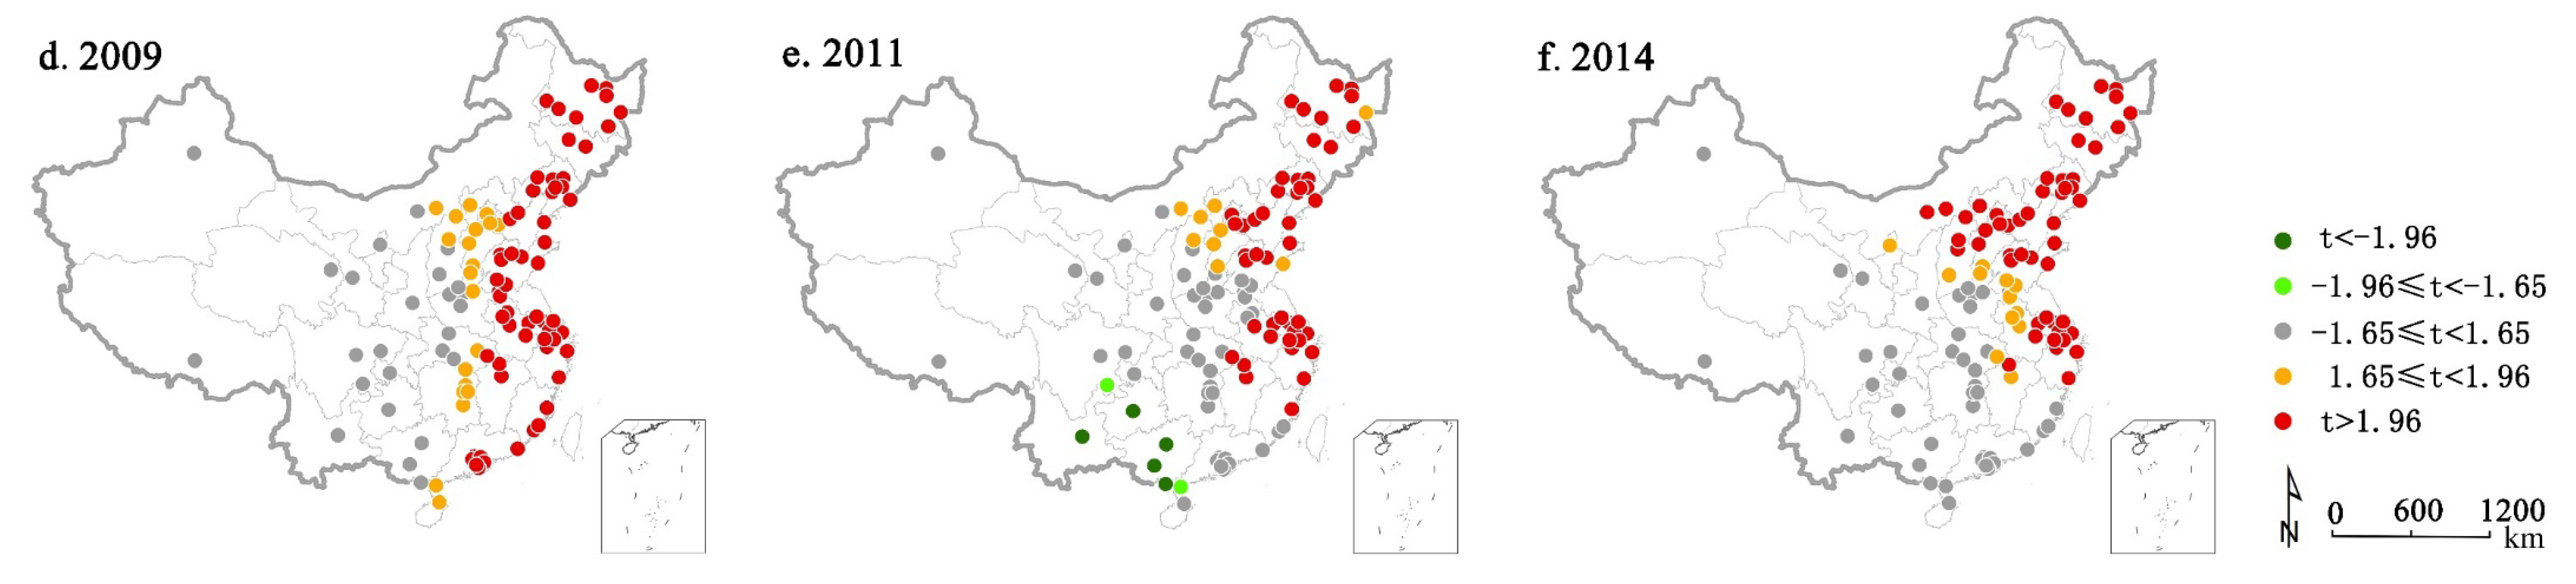
3.2.3. Relationship between Industrial Land Price and Population

The spatio-temporally varying influences of population upon industrial land price have also been explored. Overall, population had a significant positive effect on industrial land price and thus contributed to its increase in most cities. Negative effects only existed in southwestern cities and Pearl River Delta Economic Zone in 2011 and 2014, and positive effects existed within all the other places. Powerful positive effects occurred in all studied places in East and Northeast China during the studied years (Figure 4), which are significant at the 95% confidence level (Figure 8). This means that population, as a basic factor, is generally much more contributive to the development of industrial land price. In addition, developed economy and transportation accessibility in eastern coastal cities, which have attracted many enterprises and labors, might be major reasons for the positive contribution of population, because land price normally increases with fierce market competition. A negative relationship occurred in southwestern cities, which might imply that inconvenient transportation and mountainous topography have certain constraints on industrial development. However, the negative relationship in South China (e.g., some cities in Guangdong) in 2011 and 2014 is difficult to explain and further study is needed.

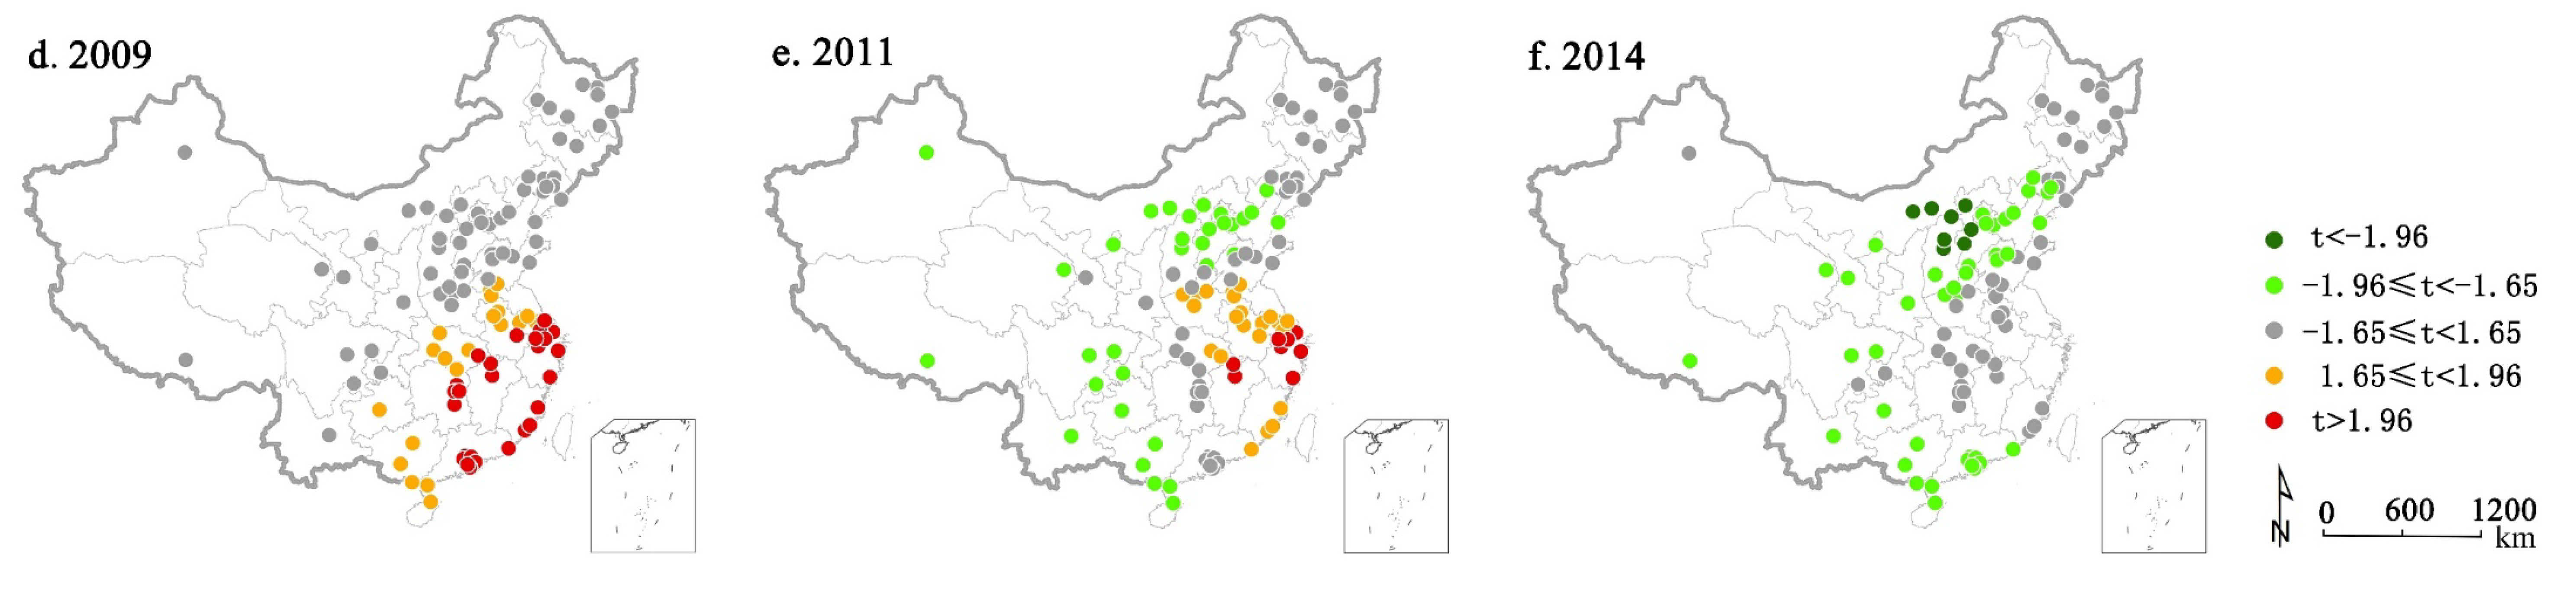
3.2.4. Relationship between Industrial Land Price and Location Quotient Index

As shown in Figure 5 and Figure 9, the effect of the location quotient index on industrial land price strongly varies spatially. The local GWR coefficients for location quotient index range from −83.1875 to 197.4760 for 2009, from −239.9373 to 201.9048 for 2011 and from −368.3462 to 193.5961 for 2014, with increasing magnitude of spatial variation. The number of cities with a significant negative effect grew from 2009 to 2011 and then to 2014, and the area with a negative effect expanded from Northwest China to most areas of China, except for the Yangtze River Delta Economic Zone. Such an expansion might indicate that the agglomeration effect could reduce land cost for enterprise and keep the regional land price low. However, in Yangtze River Delta Economic Zone, the agglomeration effect of industries was not clear, probably because the highly developed economic and service sectors caused regional land price growth and hid the industrial agglomeration effect on industrial land price (see the red clusters area in Figure 5c).

4. Discussions

4.1. Tendency of Population Mobility and Industrial Agglomeration

In 1992, the central government of China determined to promote the construction of a market economy system. Thus, urban construction mushroomed all over China, especially in many newly established industrial parks [8,11]. In China, industry income has become the main source of national wealth. According to the statistics of the National Bureau of Statistics in 2015, the GDP of the industrial sector accounted for approximately 40.5% of the total GDP in China. Driven by market interests, local governments usually viewed industrial districts as the pillars of economic growth. By 2015, there were 347 state-level development zones or high-tech development zones, 1167 province-level industrial parks and tens of thousands of county-level industrial parks in China. Different cities have different levels of zones. State-level development zones or high-tech development zones are mainly concentrated in the eastern coastal areas, where more jobs will be created as well [10,12]. Due to the labor force need of enterprises, many coastal cities attracted a large number of migrant workers, which lowered land supply elasticity [49] and raised local industrial land prices (Figure 4). On the contrary, the industrial land price in West China is generally lower than that in East China, because West China showed a low industrial development level, relatively abundant industrial land resources and sparse population [12].
It is widely acknowledged that industrial parks can improve the intensive strength of industrialization through the agglomeration of production elements [6,17,41]. The higher the agglomeration of industries in a region is, the more intense the market competition there usually will be. This phenomenon means that industrial land price should be positively related with urban industrial agglomeration in most areas of China (Figure 5a), which is in accordance with those in the previous research [6,43]. Probably because of the decreasing transportation cost and the rising information technology in China’s industry, the effect of agglomeration on industrial land price decreased gradually in the years of 2009, 2011 and 2014 (Figure 5), which consequently led to a negative correlation between industrial land price and the location quotient index in most areas. Therefore, with technical progress, industrial restructuring becomes the tendency and imperious demand in industrial districts. Considering the gaps between the industrial development among fast-developing East China and backward West China (plus the old industrial base of Northeast China) (Figure 1), great importance may be attached to industrial upgrading speed in different regions. If not enough attention is paid to the storage of surplus labors in rural areas, the overall competitiveness of China’s economy will be endangered by fast industrial upgrading in West and Middle China without the synchronous increase in labor supply [12]. Further, it is governments’ responsibility to take over the land use right after the incentive of low land price expires and to develop the brownfield land after a firm closure is implemented [8,50], especially in the old industrial base of Northeast China. From the above analysis, it is not difficult to find that the population mobility and industrial agglomeration will become more obvious, which may further increase the differences in industrial land prices in the Middle, East and West China.

4.2. Coupling between Land Supply Plan and Local Tax Growth

In China, governments make plans to use various types of land and adjust the investment income in land market by constraining the supply quantity, structure, manner and price to maintain the stable and healthy development of land market [8,9]. According to the statistics of the Ministry of Natural Resources of the People’s Republic of China, the proportion of land supply for industry and mining in total land supply was 39.1% in 2009, 32.2% in 2011 and 24.2% in 2014. This may suggest that, with the implementation of strict supply policies in recent years, the reduction in supply elasticity decreased the proportion of industrial land gradually and consequently made the land market more sensitive in responding to land supply over the major cities of China [51]; that is, a much stronger negative correlation between industrial land price and leased land appeared in most major cities in 2014, as showed in Figure 3. Since 2003, the central government of China has devoted itself to supporting the economy in less developed regions. Nonetheless, this has affected the competitiveness of the eastern region and the overall efficiency of resource allocation, resulting in marked deterioration in land use efficiency in the middle and western regions. The Department of Landing and Resources of China issued Notice on Applying Strict Cultivated Land Protection Measures, which required annual land use planning to gradually reduce the new construction land plan quota, mainly in the eastern region, especially the three urban agglomerations containing the Bohai Economic Rim, Pearl River Delta Economic Zone, and Yangtze River Delta Economic Zone. This indicates that the land supply in East China will be tighter in the future [42]. For policy makers, more effective land supply intervention strategies should be explored under the pressure of strict farmland protection and limited construction land quota. For example, in Chengdu and Chongqing in Southwest China, the farmers who exploit new land for agriculture can sell the right of some of their rural residential land to promote urban development (see urbanization report for more information). Similar policies and regulations can provide reference for other regions to carry out supply-side structural reform.
According to the data of 105 monitored industrializing cities, the averaged prices of commercial, residential and industrial land were 6552, 5277 and 742 yuan·m−2, respectively, in 2014 [39]. Apparently, industrial land was the cheapest among the three land use types. Part of the reason may be that local governments prefer using low industrial land price or tax relief to attract investments and raising commercial and residential land prices to collect revenue to support the local economy [52]. The cheap industry land price has inhibited the expected great alteration of industrial districts from extensive land usage to intensive land usage. In fact, the oversupply of industrial land and the deterioration of industrial parks not only exist in China, but also exists in some other countries, such as the Netherlands, France, Germany and the UK [2]. However, as Figure 2 shows, tax always has had a positive correlation with land price and this positive effect strengthened with time, to some extent suggesting that the depressed economy in recent years has decreased the vicious competition in attracting investment by reducing local industrial land price. For the sake of realizing the cooperated growth of native finance, appropriate industrial land supply plans should be developed to maintain the regional balance of industrial land prices. In the midwestern regions of China, relevant policies should be formulated to seek long-term benefits through competition. In the eastern developed regions or important cities, industrial transfer, industrial upgrading and the improvement of land use efficiency should be reserved for further consideration. At the same time, favorable institutional order should be established to improve revenue tax with the help of the developing industrial economy.

5. Conclusions

China has experienced rapid industrialization since the adoption of economic reform and opening-up policy in 1978. The rapid industrialization has been accompanied with many environmental and resource problems, including problems in industrial land use management. To improve industrial land use efficiency and facilitate the sustainable development of regional economy, the spatio-temporal nonstationary effects of impact factors on industrial land price in industrializing cities have been studied, which is expected to set a reference for the government to make local specific policies.
In this study, the industrial land price monitoring records of 105 industrializing cities in China were collected. The spatio-temporal relationships of industrial land price and the main impact factors were investigated with the GWR model. Spatio-temporal distribution maps of local estimates for the regression parameters of four main impact factors were derived. The result demonstrates that the connections between industrial land price and the main impact factors (for example, population, location quotient index, tax, leased land) were generally non-stationary over space and time, and different impact factors had different functions. Among these impact factors, the effect of tax on industrial land price was significantly positive and spatially stable all over China in 2009, and the effect varied spatially in the two later studied years, weakened in North and East China and strengthened in South China. The effect of leased land on industrial land price was generally negative; it was very weak in 2009 and 2011, but became negatively strong in most studied cities in 2014, except for a few cities in Middle China. Population had a significant positive effect on industrial land price in the cities of East and Northeast China. For the three studied years, the location quotient index always had a negative effect in Bohai Economic Rim and a positive effect in the Yangtze River Delta Economic Zone, and the negative effect strengthened with time. The possible underlying reasons for the relationships were analyzed. The results show that the spatio-temporal changes in industrial land price are closely related with the industrial agglomeration, population mobility, government intervention and economic situation. The study results may help policy makers in China to make efficient land supply regulations and industrial sustainable development strategies.
It is worth mentioning that the explanatory power of this model for the spatio-temporal change of industrial land price might be reduced by the fact that the industrial land market in some places in China was still premature in the past few years and some factors of the land market (e.g., the receptor side factors) were not considered in this study. Some social and economic factors possibly exert a lagged influence upon the industrial land price [53]. What is more, the magnitude of influences of several factors in big places may be different from that of small cities, hence separate analyses may be necessary if sufficient sample data were available. With the further improvement of the China Urban Land Price Dynamic Monitoring System, more samples will be available and ought to be applied to find out the relationships of industrial land price and its main impact factors, consequently reducing the underlying restrictions of sampling density within GWR analysis [36,38].

Author Contributions

All authors have contributed to the intellectual content of this paper. S.H. designed the research. S.Y. was responsible for the research development and the manuscript. W.L., C.Z. and D.S. provided many suggestions and revised this paper. All authors have read and agreed to the published version of the manuscript.

Funding

This research was funded by [the Chinese National Science Foundation] grant number [41801189, 41671518], as well as [the Fundamental Research Funds for the Central Universities, China University of Geosciences (Wuhan)] to Shengfu Yang, Shougeng Hu and Dongdong Song.

Conflicts of Interest

The authors declare no conflict of interest.

References

  1. Needham, B.; Louw, E.; Metzemakers, P. An economic theory for industrial land policy. Land Use Policy 2013, 33, 227–234. [Google Scholar] [CrossRef]
  2. Erwin, V.D.K.; Edwin, B. Industrial land and property markets: Market processes, market institutions and market outcomes: The Dutch case. Eur. Plan. Stud. 2011, 19, 2127–2146. [Google Scholar]
  3. Bai, X.; Shi, P.; Liu, Y. Society: Realizing China’s urban dream. Nature 2014, 509, 158–160. [Google Scholar] [CrossRef] [Green Version]
  4. Thompson, B.; Tsolacos, S. Industrial land values—A guide to future markets? J. Real Estate Res. 2001, 21, 55–76. [Google Scholar]
  5. Ihlanfeldt, K.R. The effect of land use regulation on housing and land prices. J. Urban Econ. 2007, 61, 420–435. [Google Scholar] [CrossRef]
  6. Barufi, A.M.B.; Haddad, E.A.; Nijkamp, P. Industrial scope of agglomeration economies in Brazil. Ann. Reg. Sci. 2016, 56, 707–755. [Google Scholar] [CrossRef] [Green Version]
  7. Restuccia, D.; Rogerson, R. Misallocation and productivity. Rev. Econ. Dyn. 2013, 16, 1–10. [Google Scholar] [CrossRef]
  8. Wu, Y.Z.; Zhang, X.L.; Skitmore, M.; Song, Y.; Eddie, C.M.H. Industrial land price and its impact on urban growth: A Chinese case study. Land Use Policy 2014, 36, 199–209. [Google Scholar] [CrossRef] [Green Version]
  9. Huang, Z.; Du, X. Government intervention and land misallocation: Evidence from China. Cities 2017, 60, 323–332. [Google Scholar] [CrossRef]
  10. Chen, W.; Shen, Y.; Wang, Y.; Wu, Q. The effect of industrial relocation on industrial land use efficiency in China: A spatial econometrics approach. J. Clean. Prod. 2018, 208, 525–535. [Google Scholar] [CrossRef]
  11. Yang, D.; Wang, H. Dilemmas of local governance under the development zone fever in China: A case study of the Suzhou region. Urban Stud. 2008, 45, 1037–1054. [Google Scholar] [CrossRef]
  12. Lu, J.; Tao, Z. Trends and determinants of China’s industrial agglomeration. J. Urban Econ. 2009, 65, 167–180. [Google Scholar] [CrossRef] [Green Version]
  13. Linard, C.; Tatem, A.; Gilbert, M. Modelling spatial patterns of urban growth in Africa. Appl. Geogr. 2013, 44, 23–32. [Google Scholar] [CrossRef]
  14. Meng, Y.; Zhang, F.R.; An, P.L.; Dong, M.L.; Wang, Z.Y. Industrial land-use efficiency and planning in Shunyi, Beijing. Landsc. Urban Plan. 2008, 85, 40–48. [Google Scholar] [CrossRef]
  15. Tu, F.; Yu, X.; Ruan, J. Industrial land use efficiency under government intervention: Evidence from Hangzhou, China. Habitat Int. 2014, 43, 1–10. [Google Scholar] [CrossRef]
  16. Chen, W.; Shen, Y.; Wang, Y. Does industrial land price lead to industrial diffusion in China? An empirical study from a spatial perspective. Sustain. Cities Soc. 2018, 40, 307–316. [Google Scholar] [CrossRef]
  17. Li, C.; Meng, Y.; Li, Y.; Ge, J.; Zhao, C. Inter-Metropolitan Land-Price characteristics and patterns in the Beijing-Tianjin-Hebei urban agglomeration in China. Sustainability 2019, 11, 4726. [Google Scholar] [CrossRef] [Green Version]
  18. Atteberry, W.; Rutherford, R. Industrial real estate prices and market efficiency. J. Real Estate Res. 1993, 8, 377–385. [Google Scholar]
  19. Brueckner, J.K. Government land-use interventions: An economic analysis. In Urban Landmarkets: Improving Land Management for Successful Urbanization; Lall, S.V., Freire, M., Yuen, B., Eds.; Springer: Berlin/Heidelberg, Germany, 2009. [Google Scholar]
  20. Brandt, L.; Thun, E. Constructing a ladder for growth: Policy, markets, and industrial upgrading in China. World Dev. 2016, 80, 78–95. [Google Scholar] [CrossRef]
  21. Long, H.L. Land use policy in China: Introduction. Land Use Policy 2014, 40, 1–5. [Google Scholar] [CrossRef]
  22. Epifani, P.; Gancia, G. Trade, markup heterogeneity and misallocations. J. Int. Econ. 2011, 83, 1–13. [Google Scholar] [CrossRef] [Green Version]
  23. Kowalski, J.G.; Paraskevopoulos, C.C. The impact of location on urban industrial land prices. J. Urban Econ. 1990, 27, 16–24. [Google Scholar] [CrossRef]
  24. Lockwood, L.J.; Rutherford, R.C. Determinants of industrial property value. Real Estate Econ. 1996, 24, 257–272. [Google Scholar] [CrossRef]
  25. Mondal, B.; Das, D.N. How residential compactness and attractiveness can be shaped by environmental amenities in an industrial city? Sustain. Cities Soc. 2018, 41, 363–377. [Google Scholar] [CrossRef]
  26. Saz-Salazar, S.D.; García-Menéndez, L. Public provision versus private provision of industrial land: A hedonic approach. Land Use Policy 2005, 22, 215–223. [Google Scholar] [CrossRef]
  27. Asabere, P.K.; Huffman, F.E. Zoning and industrial land values: The case of Philadelphia. Real Estate Econ. 1991, 19, 154–160. [Google Scholar] [CrossRef]
  28. Thomas, J. Environmental contamination and industrial real estate prices. J. Real Estate Res. 2002, 23, 179–200. [Google Scholar]
  29. Brunsdon, C.; Fotheringham, A.S.; Charlton, M.E. Geographically weighted regression: A method for exploring spatial nonstationarity. Geogr. Anal. 1996, 28, 281–298. [Google Scholar] [CrossRef]
  30. Nakaya, T.; Fotheringham, A.S.; Charlton, M.; Brunsdon, C. Semiparametric geographically weighted generalised linear modelling in GWR 4.0. In Proceedings of the 10th International Conference on Geocomputation, Sydney, Australia, 30 November–2 December 2009; Available online: http://www.geocomputation.org/2009/PDF/Nakaya_et_al.pdf (accessed on 24 March 2020).
  31. Margaritis, E.; Kang, J. Relationship between green space-related morphology and noise pollution. Ecol. Indic. 2017, 72, 921–933. [Google Scholar] [CrossRef]
  32. Hu, S.G.; Yang, S.F.; Li, W.D.; Zhang, C.Z.; Xu, F. Spatially non-stationary relationships between urban residential land price and impact factors in Wuhan city, China. Appl. Geogr. 2016, 68, 48–56. [Google Scholar] [CrossRef] [Green Version]
  33. Fotheringham, A.S.; Crespo, R.; Yao, J. Exploring, modelling and predicting spatiotemporal variations in house prices. Ann. Reg. Sci. 2015, 54, 417–436. [Google Scholar] [CrossRef]
  34. Pasculli, A.; Palermi, S.; Sarra, A.; Piacentini, T.; Miccadei, E. A modelling methodology for the analysis of radon potential based on environmental geology and geographically weighted regression. Environ. Model. Softw. 2014, 54, 165–181. [Google Scholar] [CrossRef]
  35. Kontokosta, C.E.; Jain, R.K. Modeling the determinants of large-scale building water use: Implications for data-driven urban sustainability policy. Sustain. Cities Soc. 2015, 18, 44–55. [Google Scholar] [CrossRef] [Green Version]
  36. Páez, A.; Farber, S.; Wheeler, D. A simulation-based study of geographically weighted regression as a method for investigating spatially varying relationships. Environ. Plan. A 2011, 43, 2992–3010. [Google Scholar] [CrossRef]
  37. Wang, K.; Zhang, C.R.; Li, W.D. Predictive mapping of soil total nitrogen at a regional scale: A comparison between geographically weighted regression and cokriging. Appl. Geogr. 2013, 42, 73–85. [Google Scholar] [CrossRef]
  38. Silva, A.R.D.; Fotheringham, A.S. The multiple testing issue in geographically weighted regression. Geogr. Anal. 2016, 48, 233–247. [Google Scholar] [CrossRef]
  39. China Urban Land Price Dynamic Monitor (CULPDM). Available online: http://www.landvalue.com.cn (accessed on 10 February 2017).
  40. Combes, P.P.; Duranton, G.; Gobillon, L.; Puga, D.; Roux, S. The productivity advantages of large cities: Distinguishing agglomeration from firm selection. Econometrica 2012, 80, 2543–2594. [Google Scholar]
  41. Yang, S.; Hu, S.; Li, W.; Zhang, C.; Torres, A.J. Spatiotemporal effects of main impact factors on residential land price in major cities of China. Sustainability 2017, 9, 2050. [Google Scholar] [CrossRef] [Green Version]
  42. Lu, M.; Zhang, H.; Liang, W.Q. How the bias toward central/western land supplies boosts wages in the east. Soc. Sci. China 2015, 5, 59–83. (In Chinese) [Google Scholar]
  43. Malmberg, A.; Maskell, P. Towards an explanation of regional specialization and industry agglomeration. Eur. Plan. Stud. 1997, 5, 25–41. [Google Scholar] [CrossRef]
  44. Ding, C. Policy and praxis of land acquisition in China. Land Use Policy 2007, 24, 1–13. [Google Scholar] [CrossRef]
  45. Gluszak, M.; Zygmunt, R. Development density, administrative decisions, and land values: An empirical investigation. Land Use Policy 2018, 70, 153–161. [Google Scholar] [CrossRef]
  46. National Bureau of Statistics of China (NBSC). Available online: http://www.stats.gov.cn/english/Statisticaldata/AnnualData/ (accessed on 10 February 2019).
  47. Ministry of Land and Resources of China (MLRC). Available online: https://tongji.cnki.net/overseas/engnavi/HomePage.aspx?id=N2011110053&name=YGTTJ&floor=1 (accessed on 10 February 2019).
  48. Billings, S.B.; Johnson, E.B. The location quotient as an estimator of industrial concentration. Reg. Sci. Urban Econ. 2012, 42, 642–647. [Google Scholar] [CrossRef]
  49. Green, R.K.; Malpezzi, S.; Mayo, S.K. Metropolitan-specific estimates of the price elasticity of supply of housing, and their sources. Am. Econ. Rev. 2005, 95, 334–339. [Google Scholar] [CrossRef]
  50. Cundy, A.B.; Bardos, R.P.; Puschenreiter, M.; Mench, M.; Bert, V.; Friesl-Hanl, W.; Müller, I.; Li, X.N.; Witters, N.; Vangronsveld, J. Brownfields to green fields: Realising wider benefits from practical contaminant phytomanagement strategies. J. Environ. Manag. 2016, 184, 67–77. [Google Scholar] [CrossRef] [Green Version]
  51. Davidoff, T. Supply elasticity and the housing cycle of the 2000s. Real Estate Econ. 2013, 41, 793–813. [Google Scholar] [CrossRef]
  52. Tao, R.; Su, F.B.; Liu, M.X.; Cao, G. Land leasing and local public finance in China’s regional development: Evidence from prefecture-level cities. Urban Stud. 2010, 47, 2217–2236. [Google Scholar]
  53. Zhang, H. Effects of urban land supply policy on real estate in China: An econometric analysis. J. Real Estate Lit. 2008, 16, 55–72. [Google Scholar]
Figure 1. The trajectories of the industrial land price index in representative cities with three different developmental levels from 2000 to 2014 (a). The allotment of industrial land pricing in major places in China in 2009, 2011 and 2014 (b).
Sustainability 12 02792 g001
Figure 2. Local coefficients of tax in GWR analyses of industrial land price in 2009, 2011 and 2014.
Sustainability 12 02792 g002
Figure 3. Local coefficients of leased land in GWR analyses of industrial land price in 2009, 2011 and 2014. Regression coefficients for some cities are too small to be visible in (b).
Sustainability 12 02792 g003
Figure 4. Local coefficients of population in GWR analyses of industrial land price in 2009, 2011 and 2014.
Sustainability 12 02792 g004
Figure 5. Local coefficients of location quotient index in GWR analyses of industrial land price in 2009, 2011 and 2014.
Sustainability 12 02792 g005
Figure 6. Local t-value coefficients of tax in GWR analyses of industrial land price in 2009, 2011 and 2014.
Sustainability 12 02792 g006
Figure 7. Local t-value coefficients of leased land in GWR analyses of industrial land price in 2009, 2011 and 2014.
Sustainability 12 02792 g007
Figure 8. Local t-value coefficients of population in GWR analyses of industrial land price in 2009, 2011 and 2014.
Sustainability 12 02792 g008
Figure 9. Local t-value coefficients of location quotient index in GWR analyses of industrial land price in 2009, 2011 and 2014.
Sustainability 12 02792 g009
Table 1. Variables and multicollinearity analysis results.
Abbreviation POPLQILANDTAX
VariablePopulationLocation quotient indexLeased landTax
DescriptionAnnual average population in a city.The ratio of manufacture employing in all the employing of city divided by the ratio of manufacture employing in total of the employment of the whole country. Compared with real estate, excavation and electric power, the manufacturing industry has fewer limitations by natural resources. The LQI greatly presents the industrial concentration level [48].The total leased land for industry, mining and warehousing in a city. It is an important index to weigh government intervention.The total industrial value-added tax payable in a city. Tax revenue is an important index to weigh economic achievements of a city.
Unit10 thousand-ha100 million
VIF20091.511.261.221.66
20111.311.261.011.58
20142.371.292.202.01
Table 2. The outcomes of geographically weighted regression (GWR) explanations for the data sets of 2009, 2011 and 2014.
YearResidual Moran’s IAICcAdjusted R2P Value
GWROLSGWROLSGWROLSGWROLS
2009−0.020.161377.371419.570.520.300.000.00
2011−0.020.201378.821448.040.500.340.000.00
20140.000.191438.291509.860.570.430.000.00
Note: AIC: Akaike Information Standard. Adjusted R2: the parameter of determination.
Table 3. Description data of the coefficient estimates within GWR explanations for 2009, 2011 and 2014.
VARIABLEMinLwr QuartileMeanUpr QuartileMaxDIFF of Criterion
β1_TAX_20090.53660.80070.99011.16921.43821.0066
β2_LAND_2009−0.1886−0.1172−0.0711−0.02180.0136−5.4236
β3_POP_2009−0.03230.12470.20480.27740.5301−8.9099
β4_LQI_2009−83.1875−3.037149.5306122.2089197.4760−3.3798
β1_TAX_2011−0.35760.37670.70841.04431.6822−8.8626
β2_LAND_2011−0.2526−0.0036−0.0091−0.00050.0577−1.0158
β3_POP_2011−0.2236−0.01940.24390.37851.0970−12.3876
β4_LQI_2011−239.9373−87.3454−5.900691.7083201.9048−2.0133
β1_TAX_20140.27650.73821.21201.31822.8717−16.7267
β2_LAND_2014−0.7334−0.3896−0.2780−0.17910.1298−2.7771
β3_POP_2014−0.1637−0.01680.32610.58390.8683−1.2208
β4_LQI_2014−368.3462−175.4142−90.1802−20.9673193.59611.7033

