Article

Optimal Placement of TCSC for Congestion Management and Power Loss Reduction Using Multi-Objective Genetic Algorithm

by
Thang Trung Nguyen
1 and
Fazel Mohammadi
2,*
1
Power System Optimization Research Group, Faculty of Electrical and Electronics Engineering, Ton Duc Thang University, Ho Chi Minh City 700000, Vietnam
2
Electrical and Computer Engineering (ECE) Department, University of Windsor, Windsor, ON N9B 1K3, Canada
*
Author to whom correspondence should be addressed.
Sustainability 2020, 12(7), 2813; https://doi.org/10.3390/su12072813
Submission received: 20 February 2020 / Revised: 31 March 2020 / Accepted: 1 April 2020 / Published: 2 April 2020
(This article belongs to the Special Issue Integration of AC/DC Microgrids into Power Grids)

Abstract

:
Electricity demand has been growing due to the increase in the world population and higher energy usage per capita as compared to the past. As a result, various methods have been proposed to increase the efficiency of power systems in terms of mitigating congestion and minimizing power losses. Power grids operating limitations result in congestion that specifies the final capacity of the system, which decreases the conventional power capabilities between coverage areas. Flexible AC Transmission Systems (FACTS) can help to decrease flows in heavily loaded lines and lead to lines loadability improvements and cost reduction. In this paper, total power loss reduction and line congestion improvement are assessed by determining the optimal locations and compensation rates of Thyristor-Controlled Series Compensator (TCSC) devices using the Multi-Objective Genetic Algorithm (MOGA). The results of applying the proposed method on the IEEE 30-bus test system confirmed the efficiency of the proposed procedure. In addition, to check the performance, applicability, and effectiveness of the proposed method, different heuristic algorithms, such as the multi-objective Particle Swarm Optimization (PSO) algorithm, Differential Evolution (DE) algorithm, and Mixed-Integer Non-Linear Program (MINLP) technique, are used for comparison. The obtained results show the accuracy and fast convergence of the proposed method over the other heuristic techniques.

1. Introduction

Electric power consumption growth and an open accessible energy market have caused power systems to operate close to their nominal capacities. Also, the extension and development limits of power grids from things, such as installation issues, operating costs, and environmental concerns, have caused many power systems to operate in overload conditions. In addition, power flow in different parts of the grid is restricted by stability and reliability constraints. Therefore, the growth of line power flow exceeding the allowable limits may cause power systems to collapse by random faults [1,2].
These concepts are investigated and studied through the power flow and congestion management topics [3,4]. Transmission lines congestion is a severe problem in power systems operation. The power grid is called congested when some transmission lines operate outside of allowable limits, and as a result, generators may become inactive [5]. Various methods and equipment such as Flexible Alternative Current Transmission Systems (FACTS) devices are reported to manage the active power flow [6]. FACTS devices control the line power flow without any changes in the grid topology, leading to improved performance, increased power transmission capacity, and reduced power grid congestion. Due to the considerable costs of FACTS devices and the maximum usage of their capabilities, the optimal location of such devices should be determined accurately [7,8,9,10].
One of the technical challenges in deregulated power systems is congestion management. In [11], the operation of a Thyristor-Controlled Series Compensator (TCSC) for the optimization of transmission lines and transmission line congestion is studied, by developing an algorithm to optimize the performance index for contingency analysis and the location and control of TCSC. The optimal placement of TCSC for improving power transmission efficiency and steady-state stability limits, and maintaining the voltage stability of power systems, is reported in [12]. A method to deal with congestion management by controlling the DC power flow using TCSC is also reported in [13]. In [14], a TCSC is utilized to improve transient stability and congestion management in power systems. In [15], an approach to optimize the location and size of TCSC and, accordingly, reduce the congestion in power systems is investigated. In [16], an approach to find the optimal location and size of a TCSC for congestion management and for enhancing the power transfer capability of power transmission lines, by considering a variable reactance model of the TCSC at the steady-state condition, is investigated. In [17], TCSC location is formulated as the Mixed-Integer Non-Linear Program (MINLP), and an approach for the optimal location and size of TCSC is proposed. In [18], TCSC placement is considered to improve the power transmission line loading parameter, reduce power losses, and improve the voltage stability of power systems. Additionally, the obtained results are compared with allocating the Static VAR Compensator (SVC) for congestion management. The optimal placement and size of TCSC in power systems to reduce the risks in power grid operation is discussed in [19]. The optimal allocation of TCSCs for congestion management is also studied in [20,21,22,23] for different applications.
Moreover, total power loss reduction is another important criterion, which should be taken into consideration along with congestion management. In [24], the aim is to reduce power system losses, including switching losses, through economic TCSC installation. Considering short-circuit level and power loss reduction as the two objective functions of the Particle Swarm Optimization (PSO) algorithm, the allocation of TCSC is studied in [25]. In [26], the objective is to provide adequate compensation to reduce the power system losses and improve the voltage profile by finding the optimal location of FACTS devices, including TCSC. As in [26], the optimal allocation of TCSC by checking the sensitivity indices for power loss reduction and voltage profile improvement is investigated in [27].
Congestion management is a systematic approach to schedule and balance the generation and load levels, considering transmission line constraints. Therefore, congestion management in power systems should be continuously investigated due to the fact that changing the generation and load levels can change the location of TCSC. As a result, congestion management requires a fast convergence technique that can obtain optimal solutions. Hence, having a long convergence criterion (number of iterations or computation time) is one of the main drawbacks of other research studies. In addition, obtaining a locally optimal solution instead of a globally optimal one is another issue in this regard. Neglecting non-linear relationships between the parameters of power systems is another issue in other research studies.
To address the above-mentioned issues, this paper aims to optimally allocate TCSCs and their susceptance values, considering power loss reduction, congestion management, and the determination of the power lines compensation rates. The main contributions of this work are (1) to consider the structure of TCSC and the AC characteristics of power systems, formulate a nonlinear problem, and solve it using a heuristic algorithm, and (2) determine the optimal allocation and rating of TCSC through an optimization procedure. The Jacobian sensitivity approach and AC load flow are used for line congestion evaluations. The Multi-Objective Genetic Algorithm (MOGA) is used as an optimization method to determine the optimal locations and susceptance values of TCSCs. To the best of the authors’ knowledge, the consideration of power loss reduction, congestion management, and the determination of the power line compensation rates have never been used to optimally allocate TCSCs and their susceptance values. The proposed method is deployed on the IEEE 30-bus test system, and the results are investigated to illustrate the applicability and effectiveness of the proposed method. In addition, the obtained results are compared with those from different algorithms, such as the multi-objective PSO algorithm, Differential Evolution (DE) algorithm, and MINLP technique. The obtained results show the superiorities of the proposed method, in terms of fast convergence and high accuracy, over the other heuristic methods.
The rest of this paper is organized as follows. Section 2 presents the structure and model of TCSCs. The calculations of the power congestion indices of transmission lines are presented in Section 3. Section 4 describes the proposed Multi-Objective Genetic Algorithm (MOGA) and variable coding procedures. The simulation results and discussions are presented in Section 5. Finally, the conclusions are summarized in Section 6.

2. Structure and Model of the TCSC

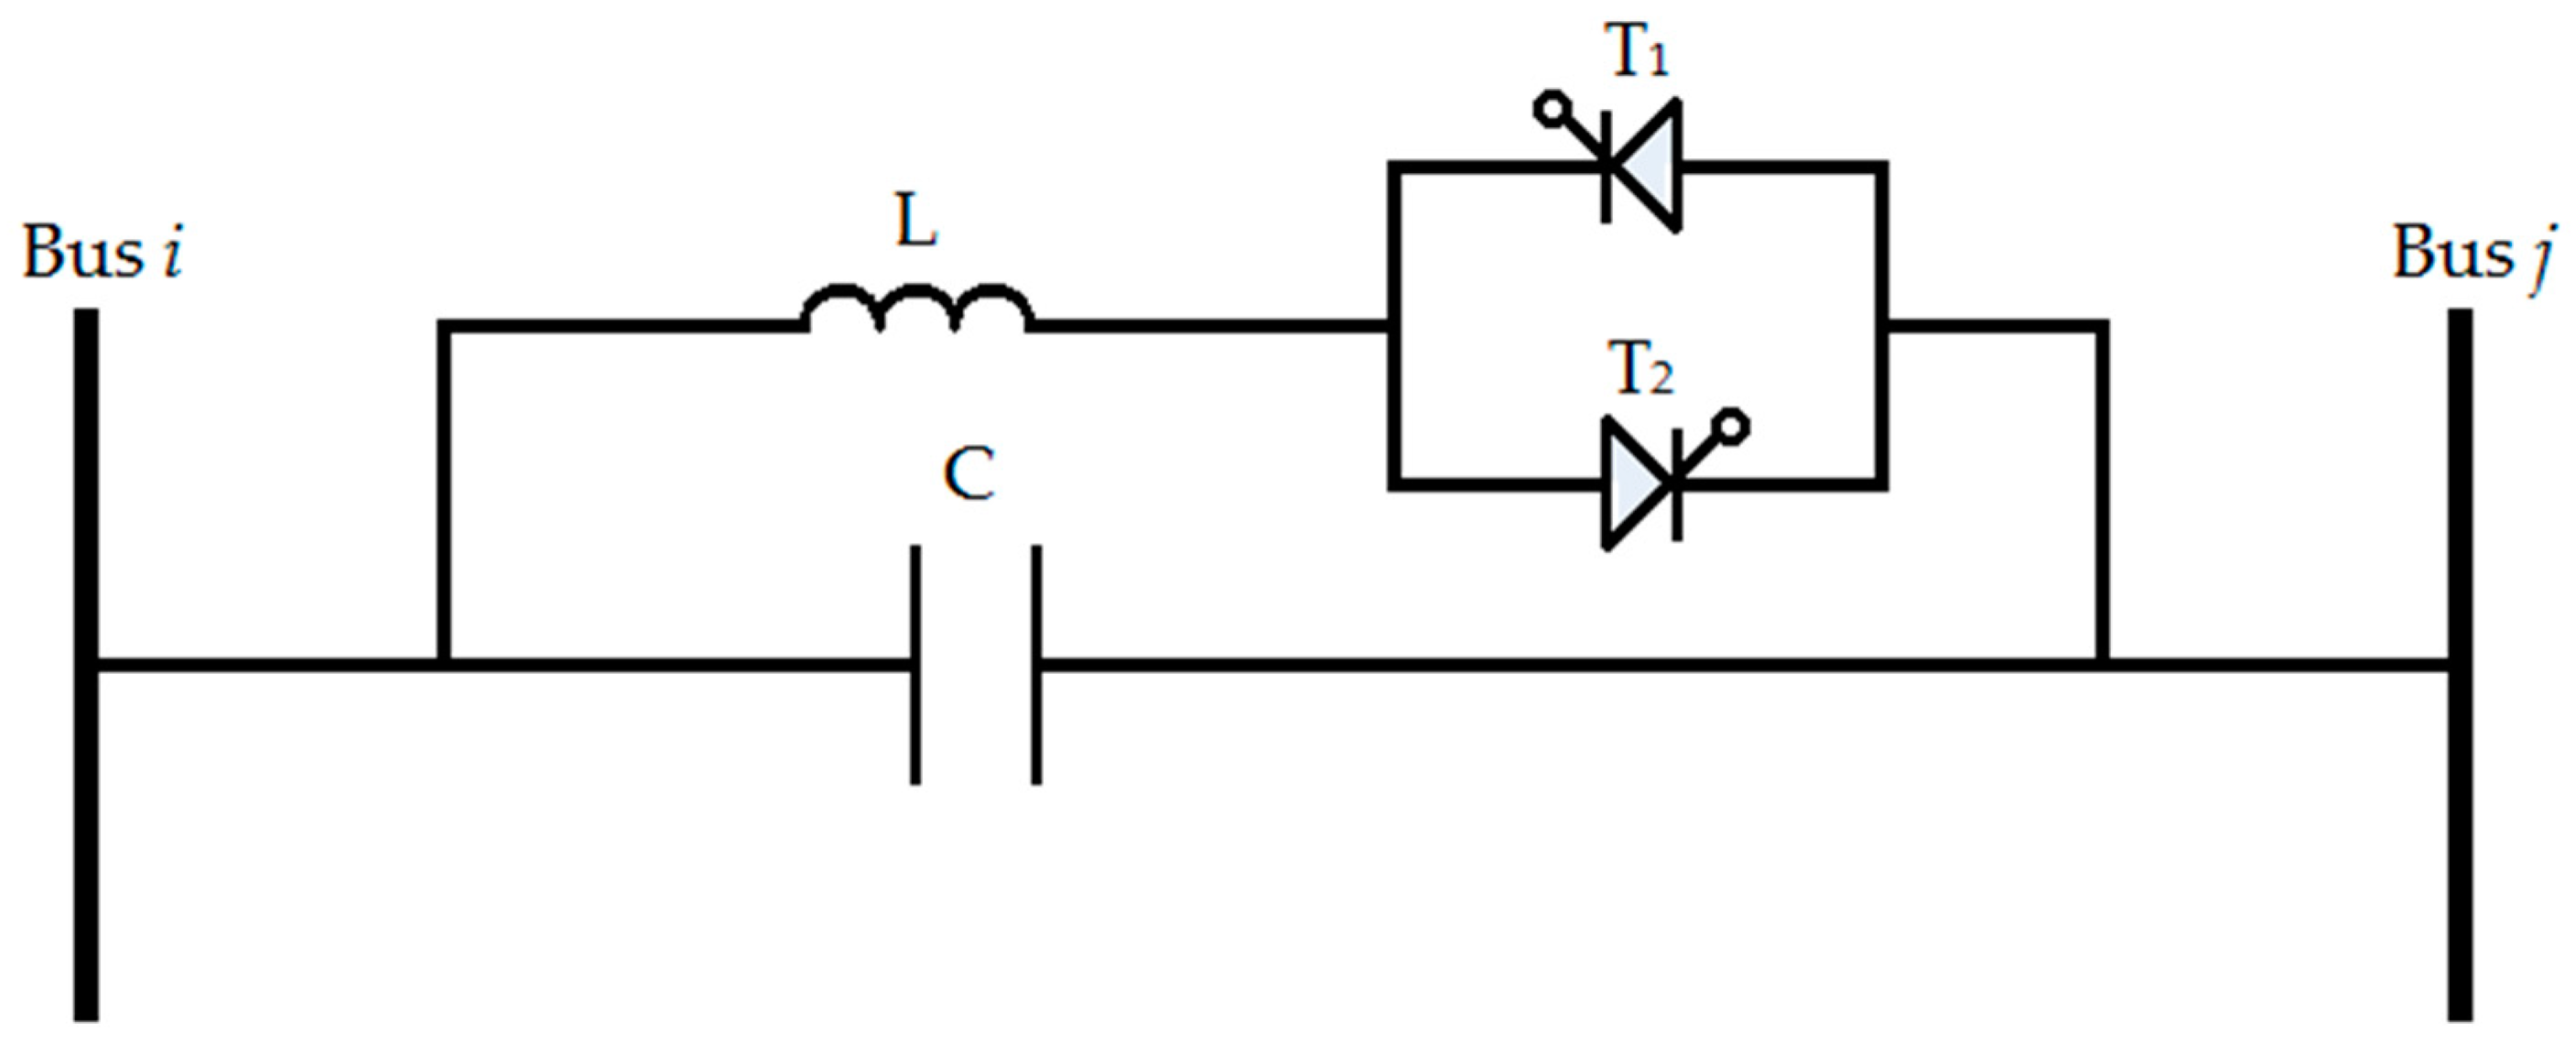
Series capacitors have been used for many years to improve the stability and loadability of the power transmission grids. The basic principle of their operations is to compensate for the power lines’ inductive voltage drop by applying a capacitive voltage and reduce the impact of power transmission line reactance, which can enhance line loadability. One of these series compensators is the TCSC. In the TCSC configuration, a shunt Thyristor Controlled Reactor (TCR) (the set of L and back-to-back connected thyristors, T 1 and T 2 ) is used in parallel with some parts of a capacitor bank ( C ). This combination allows the TCSC to provide a reactive component with continuous changes during the thyristors’ conduction period. Figure 1 shows a single-phase model of a TCSC connected between bus i and bus j .
Figure 2 shows the π equivalent parameters of a transmission line when X > > R . V i δ i and V j δ j are the complex voltage forms of buses i and j , respectively. In Figure 2, Y i j = 1 Z i j = G i j + j B i j is the admittance of the transmission line between buses i and j . G i j and B i j are the conductance and susceptance of the transmission line between buses i and j , respectively. In addition, B s h represents the shunt susceptance of the transmission line.
The active and reactive power flow equations between bus i and bus j ( P i j and Q i j ) can be determined as follows [28,29,30,31,32,33]:
P i j = V i 2 G i j V i V j ( G i j cos δ i j + B i j sin δ i j )
Q i j = V i 2 ( B i j + B s h ) V i V j ( G i j sin δ i j B i j cos δ i j )
where δ i j = δ i δ j is the phase angle difference between the voltage at bus i and bus j .
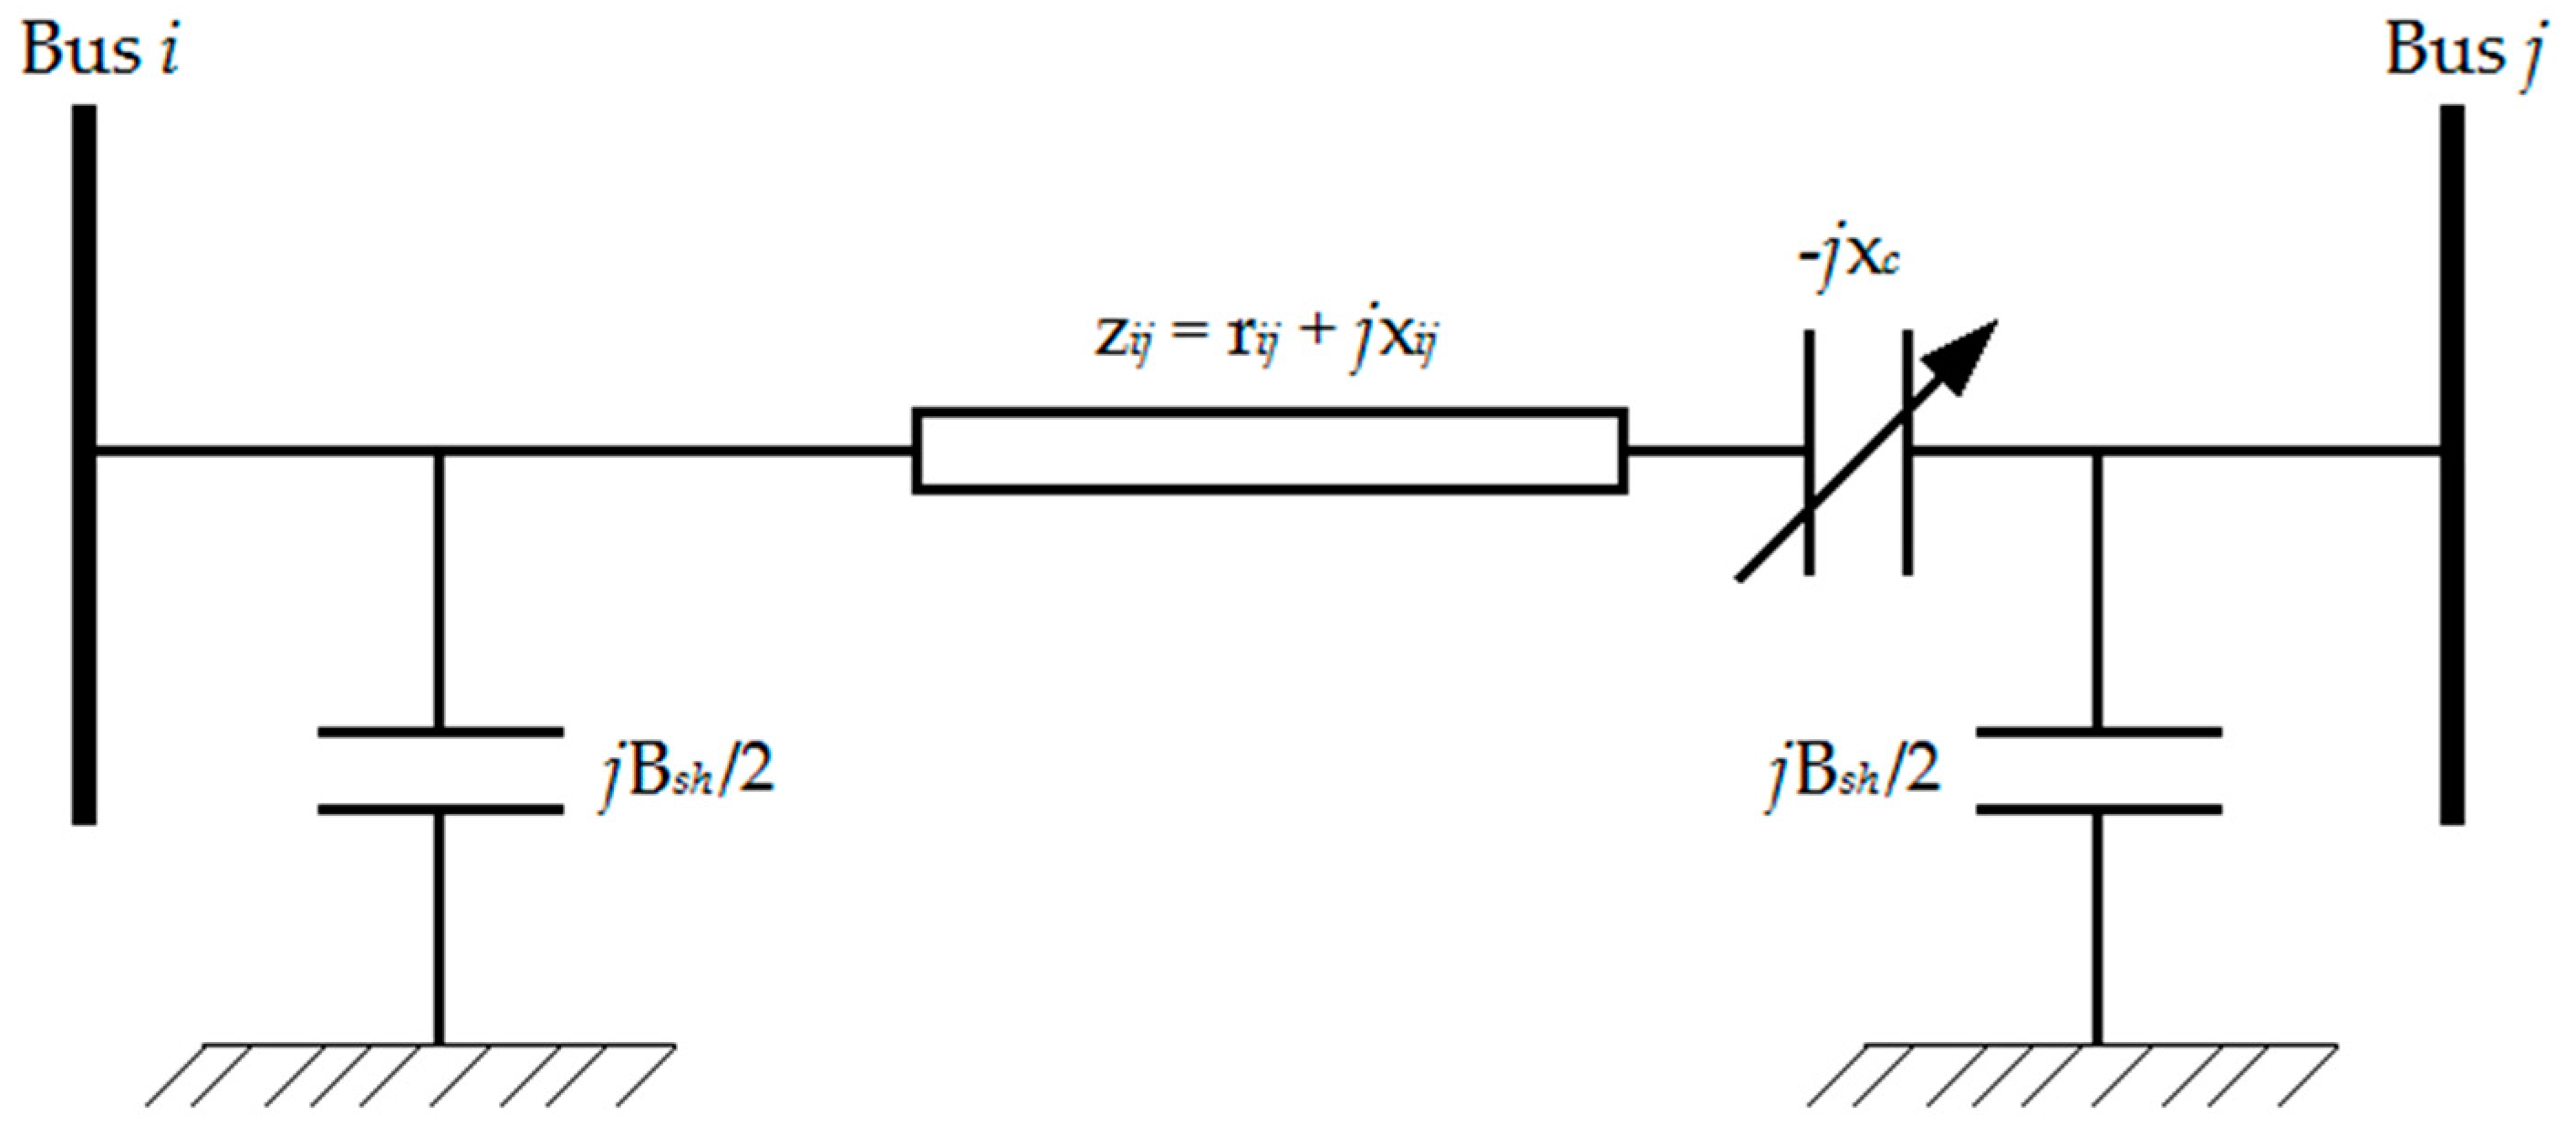
The transmission line model after the installation of the TCSC between bus i and bus j is shown in Figure 3. In Figure 3, z i j = r i j + j x i j is the impedance of the transmission line between buses i and j . r i j and x i j are the resistance and reactance of the transmission line between buses i and j , respectively. At the steady-state, the TCSC can be considered as a static reactance of j x c .
Equations (3) to (6) show the active and reactive power flow equations in the presence of a TCSC between bus i and bus j ( P i j c and Q i j c ) and vice versa ( P j i c and Q j i c ).
P i j c = V i 2 G i j V i V j ( G i j cos δ i j + B i j sin δ i j )
Q i j c = V i 2 ( B i j + B s h ) V i V j ( G i j sin δ i j B i j cos δ i j )
P j i c = V j 2 G i j V i V j ( G i j cos δ i j B i j sin δ i j )
Q j i c = V j 2 ( B i j + B s h ) + V i V j ( G i j sin δ i j + B i j cos δ i j )
Active and reactive power losses ( P l and Q l ) can be determined as follows:
P l = P i j + P j i = G i j ( V i 2 + V j 2 ) ( 2 V i V j G i j cos δ i j )
Q l = Q i j + Q j i = ( V i 2 + V j 2 ) ( B i j + B s h ) + ( 2 V i V j B i j cos δ i j )
where
B i j = ( x i j x c ) r i j 2 + ( x i j x c ) 2
G i j = r i j r i j 2 + ( x i j x c ) 2
Any changes in the line flow due to the series capacitance can be represented as a line without series capacitance, with power injected at the receiving and sending ends of the line, as shown in Figure 4. S i c and S j c in Figure 4 are the injection power at bus i and bus j , respectively. Details of the active and reactive injection power equations in the presence of a TCSC are expressed in [1,2,3,4,5,6,7,8,9,10,27].

3. Power Congestion Index of Transmission Lines

The Transmission Congestion Distribution Factor (TCDF), as proposed in Equation (11), is based on the sensitivity of AC power flow of the lines to changes in the injected power at different buses, as follows [1]:
T C D F ( i , k ) = Δ P i j Δ P i
where T C D F ( i , k ) represents the variations of active power flow ( Δ P i j ) in transmission line k between buses i and j due to the changes in the injected power at bus i ( Δ P i ). In fact, the T C D F index points to changes in the transmission line power, when the injected power in a bus is changed. There are several methods to determine the TCDF, one of which is presented in this paper.
The power flow equation from bus i to bus j can be expressed as follows [31,32,33]:
P i j = V i V j Y i j cos ( θ i j + δ j δ i ) V i 2 Y i j cos θ i j
where V i and V j and δ i and δ j are the voltage magnitudes and voltage angles at bus i and bus j , respectively. Y i j and θ i j are the magnitude and phase angle of the admittance of the i - j th element of Y -bus matrix. Using the Taylor series, and ignoring the second- and higher-order terms due to their less impacts, Equations (13) and (14) can be derived as follows:
Δ P i j = P i j δ i Δ δ i + P i j δ j Δ δ j + P i j V i Δ V i + P i j V j Δ V j
Δ P i j = a i j Δ δ i + b i j Δ δ j + c i j Δ V i + d i j Δ V j
The unknown coefficients in Equation (14) are calculated by deriving Equations (15)–(18).
a i j = V i V j Y i j sin ( θ i j + δ j δ i )
b i j = V i V j Y i j sin ( θ i j + δ j δ i )
c i j = V j Y i j cos ( θ i j + δ j δ i ) 2 V i Y i j cos θ i j
d i j = V i Y i j cos ( θ i j + δ j δ i )
Therefore, the Jacobian matrix can be formed as follows:
( Δ P Δ Q ) = ( j ) ( Δ δ Δ V ) = ( j 11 j 12 j 21 j 22 ) ( Δ δ Δ V )
Voltage magnitude changes on the line power flow are ignored due to their negligible impacts. Hence,
Δ P = ( j 11 ) Δ δ
Δ Q = ( j 22 ) Δ V
Δ δ = ( j 11 ) 1 Δ P = ( M ) Δ P
Equation (22) can be generally stated as follows:
Δ δ = l = 0 n m i l Δ P l , i = 1 , 2 , , n ,    i s
where n denotes the number of buses, s is slack bus, and m i l represents members of matrix M . In accordance with the above-mentioned subject, c i j and d i j are ignored, and Equation (14) can be rewritten as follows:
Δ P i j = a i j Δ δ i + b i j Δ δ j
Considering Equations (23) and (24), Equations (25) and (26) can be derived as follows:
Δ P i j = a i j l = 1 n m i l Δ P l + b i j l = 1 n m j l Δ P l
Δ P i j = T C D F ( 1 , k ) Δ P 1 + T C D F ( 2 , k ) Δ P 2 +   + T C D F ( n , k ) Δ P n
where T C D F ( n , k ) indicates the congestion index of bus n and line k (connection line between bus i and bus j ), and it is given as follows:
T C D F ( n , k ) = a i j m i n + b i j m j n

4. Proposed Multi-Objective Genetic Algorithm (MOGA)

Genetic Algorithm (GA) is a search technique derived from the natural evolutionary mechanism, in which each individual specification of a person is defined by the nature of their chromosomes. There are various applications of the GA, of which multi-objective optimization is one. In fact, the optimization calculations of the GA are performed on variables that form chromosomes using the continuous generation of the population until a predetermined iteration number. On the other hand, the optimization is started with a random generation of the initial population. In the next step, crossover action is performed on chromosomes that are randomly selected. There are several methods for crossover operation, of which the analytical and break methods are two [28,29,30]. After that, mutation operation is randomly performed on chromosomes. The selection operation is the other most important step in the GA. In this step, by sorting the chromosomes based on their optimum calculated values in the objective function, a defined number of chromosomes, which optimizes the objective function more than the others, will be selected. There are various methods for the chromosome selection, and going to the next step, the Roulette Wheel Algorithm is one of them.
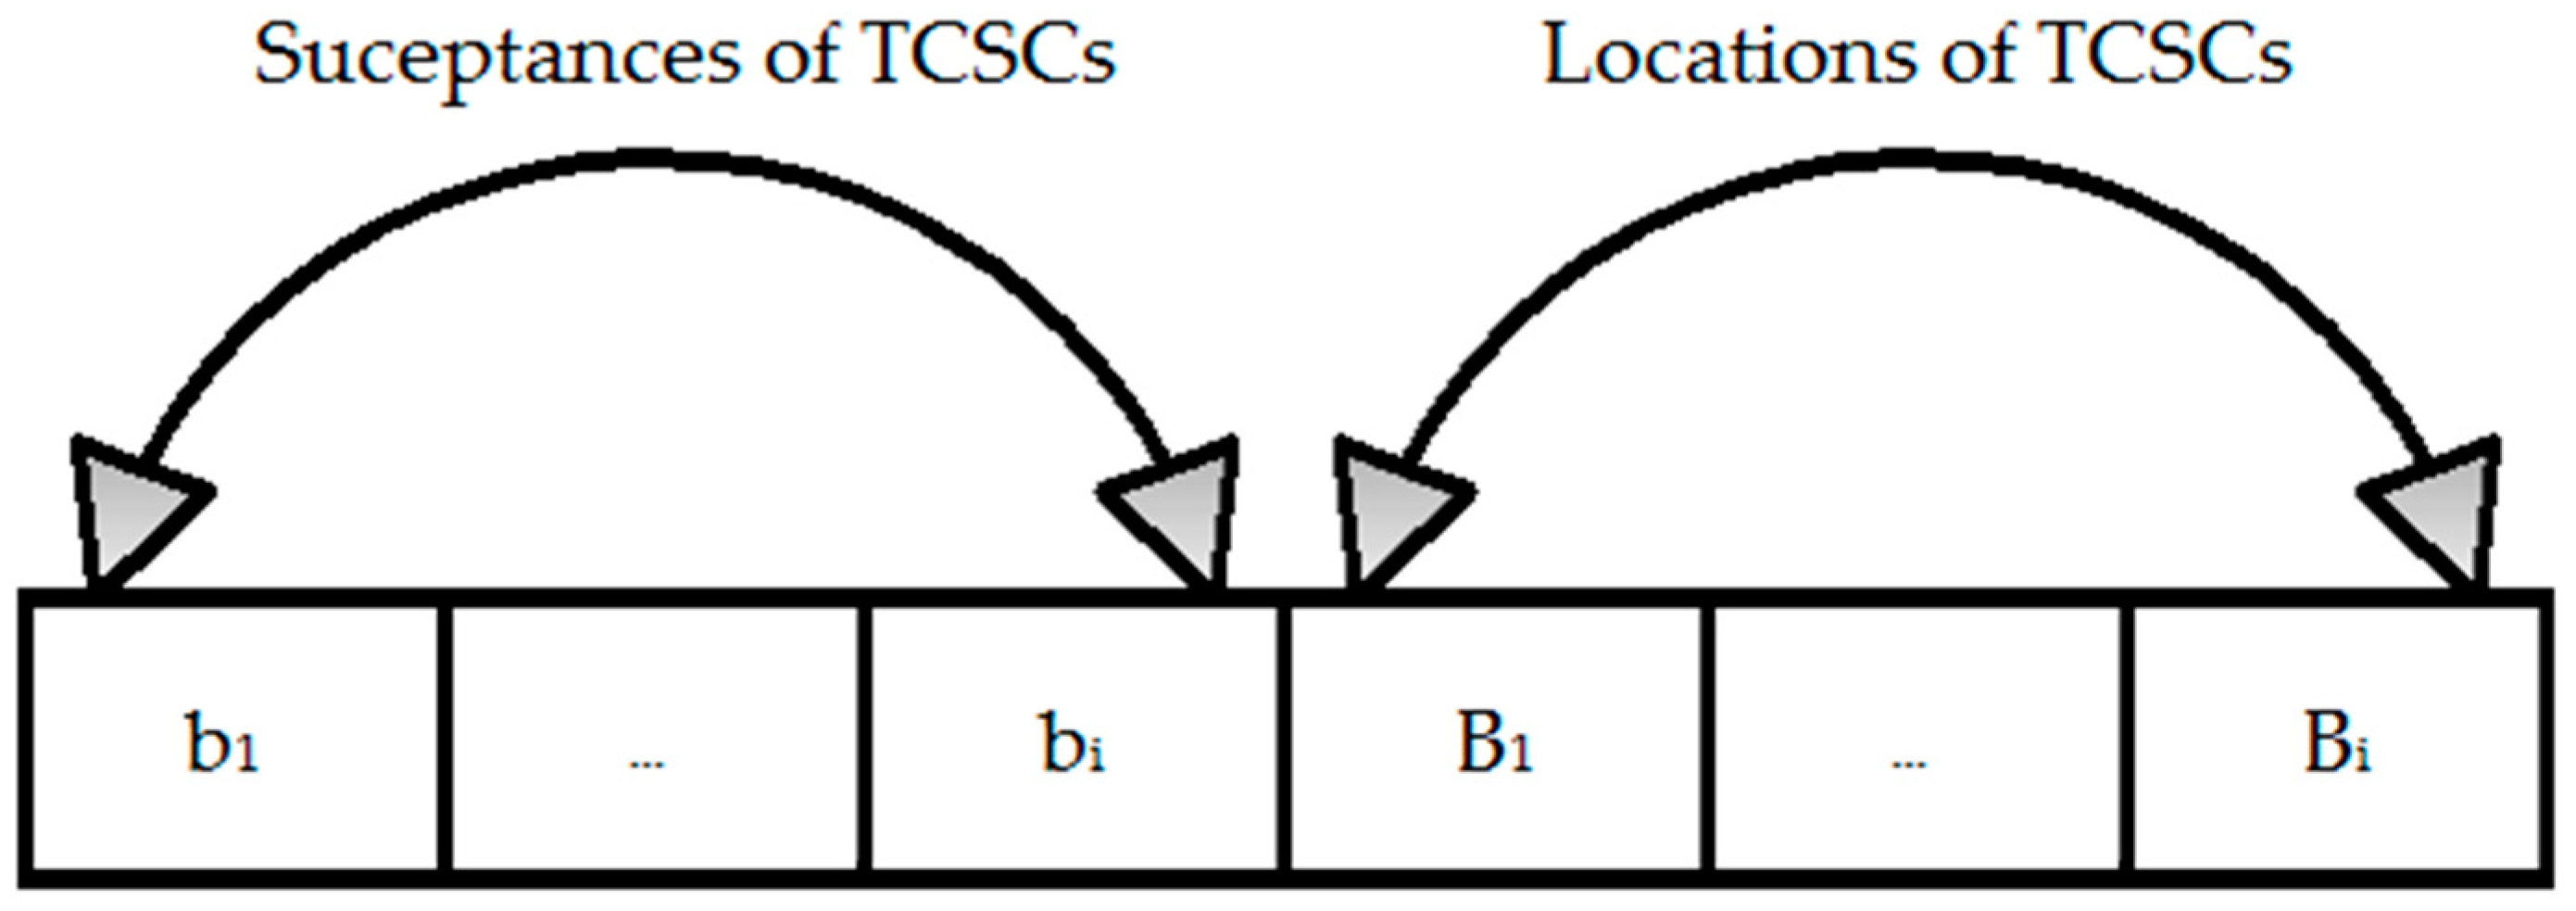
The overall objective function in this problem is composed of the power loss reduction index, congestion improvement indicator ( T C D F ), and TCSC compensation rate. The control (optimization) variables contain the susceptance values of TCSCs ( b 1 , , b i ) and locations of TCSCs ( B 1 , , B i ) in power grids, which are discrete numbers between 1 and the maximum line numbers. Figure 5 shows the coding of the problem variables.
The length of a chromosome is determined according to the number of TCSCs. If one or two TCSCs are utilized, the length of a chromosome is two or four, respectively. Various operational constraints, including the bus voltage, the line maximum power, and also the active and reactive power of generation units are considered in the optimization process [34]. Therefore, the objective function is subjected to the following constraints:
• Bus voltage constraint:
V i m i n V i V i m a x
• Transmission line capacity limitations:
S L i S L i m a x
• Generator active power limitations:
P G i m i n P G i P G i m a x
• Generator reactive power limitations:
Q G i m i n Q G i Q G i m a x
To handle the inequality constraints, the penalty function is defined as follows:
P ( X i ) = { ( X i X i m a x ) 2 ,    X i > X i m a x ( X i m i n X i ) 2 ,    X i < X i m i n 0 ,      X i m i n < X i < X i m a x
where P ( X i ) is the penalty function of variable X i . X i m i n and X i m a x are the lower and upper limits of variable X i .
The two objective functions ( f 1 and f 2 ) are presented as follows:
f 1 = i = 1 N L P l o s s i
f 2 = 1 N L i = 1 N L S L i S L i m a x × 100
where P l o s s i is the active power loss in line i , N L is the total number of transmission lines, S L i is the aperient power of line i , and S L i m a x denotes the maximum allowable aperient power of line i . It should be noted that in this paper, the average percentage of loadability of the lines is considered as an objective function for congestion minimization.
In addition, the third objective function ( f 3 ) is defined as follows:
f 3 = X L = X i j + X T C S C
where X L is the reactance of the transmission line, X i j is the reactance of the transmission line before compensation, and X T C S C is the added reactance to the transmission line after installation of the TCSC. Also, X T C S C = r T C S C × X i j , where r T C S C is the compensation coefficient and has a value between −0.7 and 0.2.
As a result, the overall objective function can be written as follows:
min F = i = 1 M w i f i
where M shows the number of objectives. Also, w i is the weight factor associated with the i t h objective function. It should be noted that i = 1 K w i = 1 . Lastly, f i is the i t h objective function (normalized).

5. Simulation Results and Discussions

5.1. Simulation Results

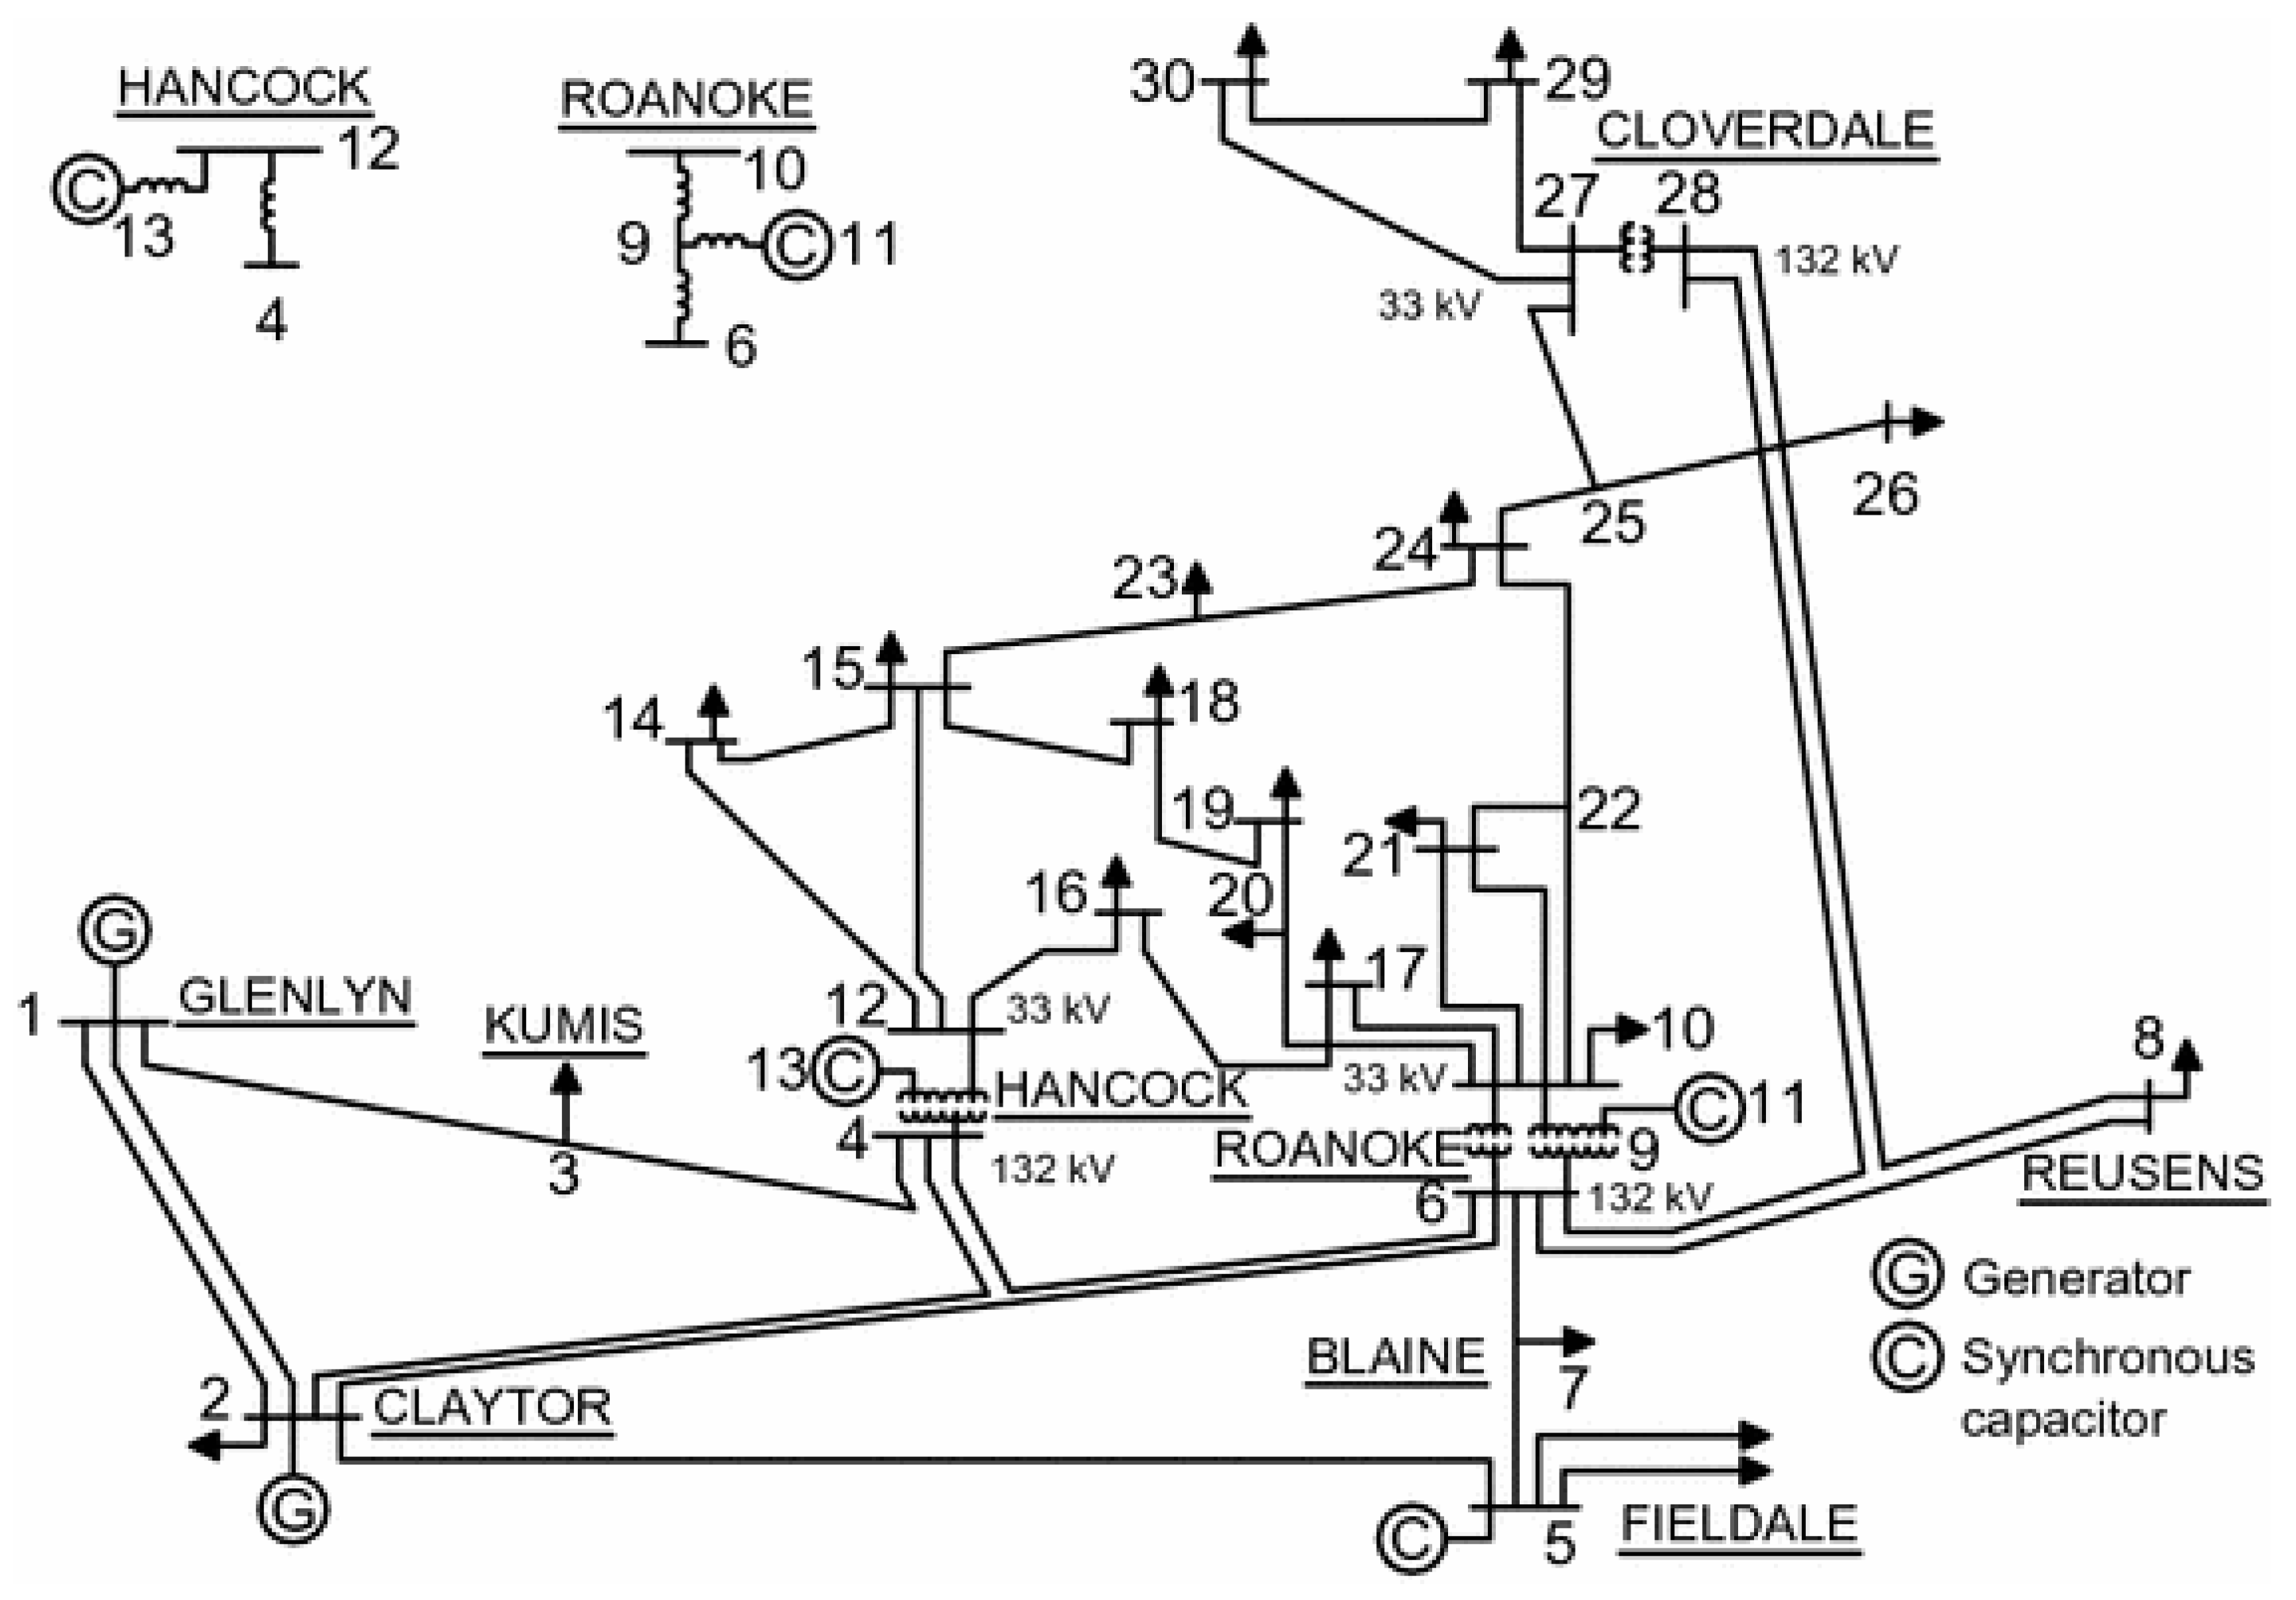
The proposed method is implemented and evaluated on the IEEE 30-bus test system [35], as shown in Figure 6, for determining the optimal locations of one and two TCSCs. It should be noted that the case-study has 41 transmission lines. MATPOWER is used for power flow analysis [36]. The simulations were accomplished in the MATLAB software using a laptop with the Intel Core i7-8550U processor at 1.80 GHz clock speed and 12 GB of RAM.

5.1.1. Installation of One TCSC

In the first scenario, the optimal location of one TCSC and the compensation rate of the corresponding line for power loss reduction are calculated using the MOGA. After 600 iterations, line 36 (the connection line between bus 27 and bus 28) with 59.4% compensation rate of the line reactance is selected as the best location for TCSC installation. Figure 7 demonstrates the voltage improvement at all buses and the voltage drop reduction after the installation of one TCSC.

5.1.2. Installation of Two TCSCs

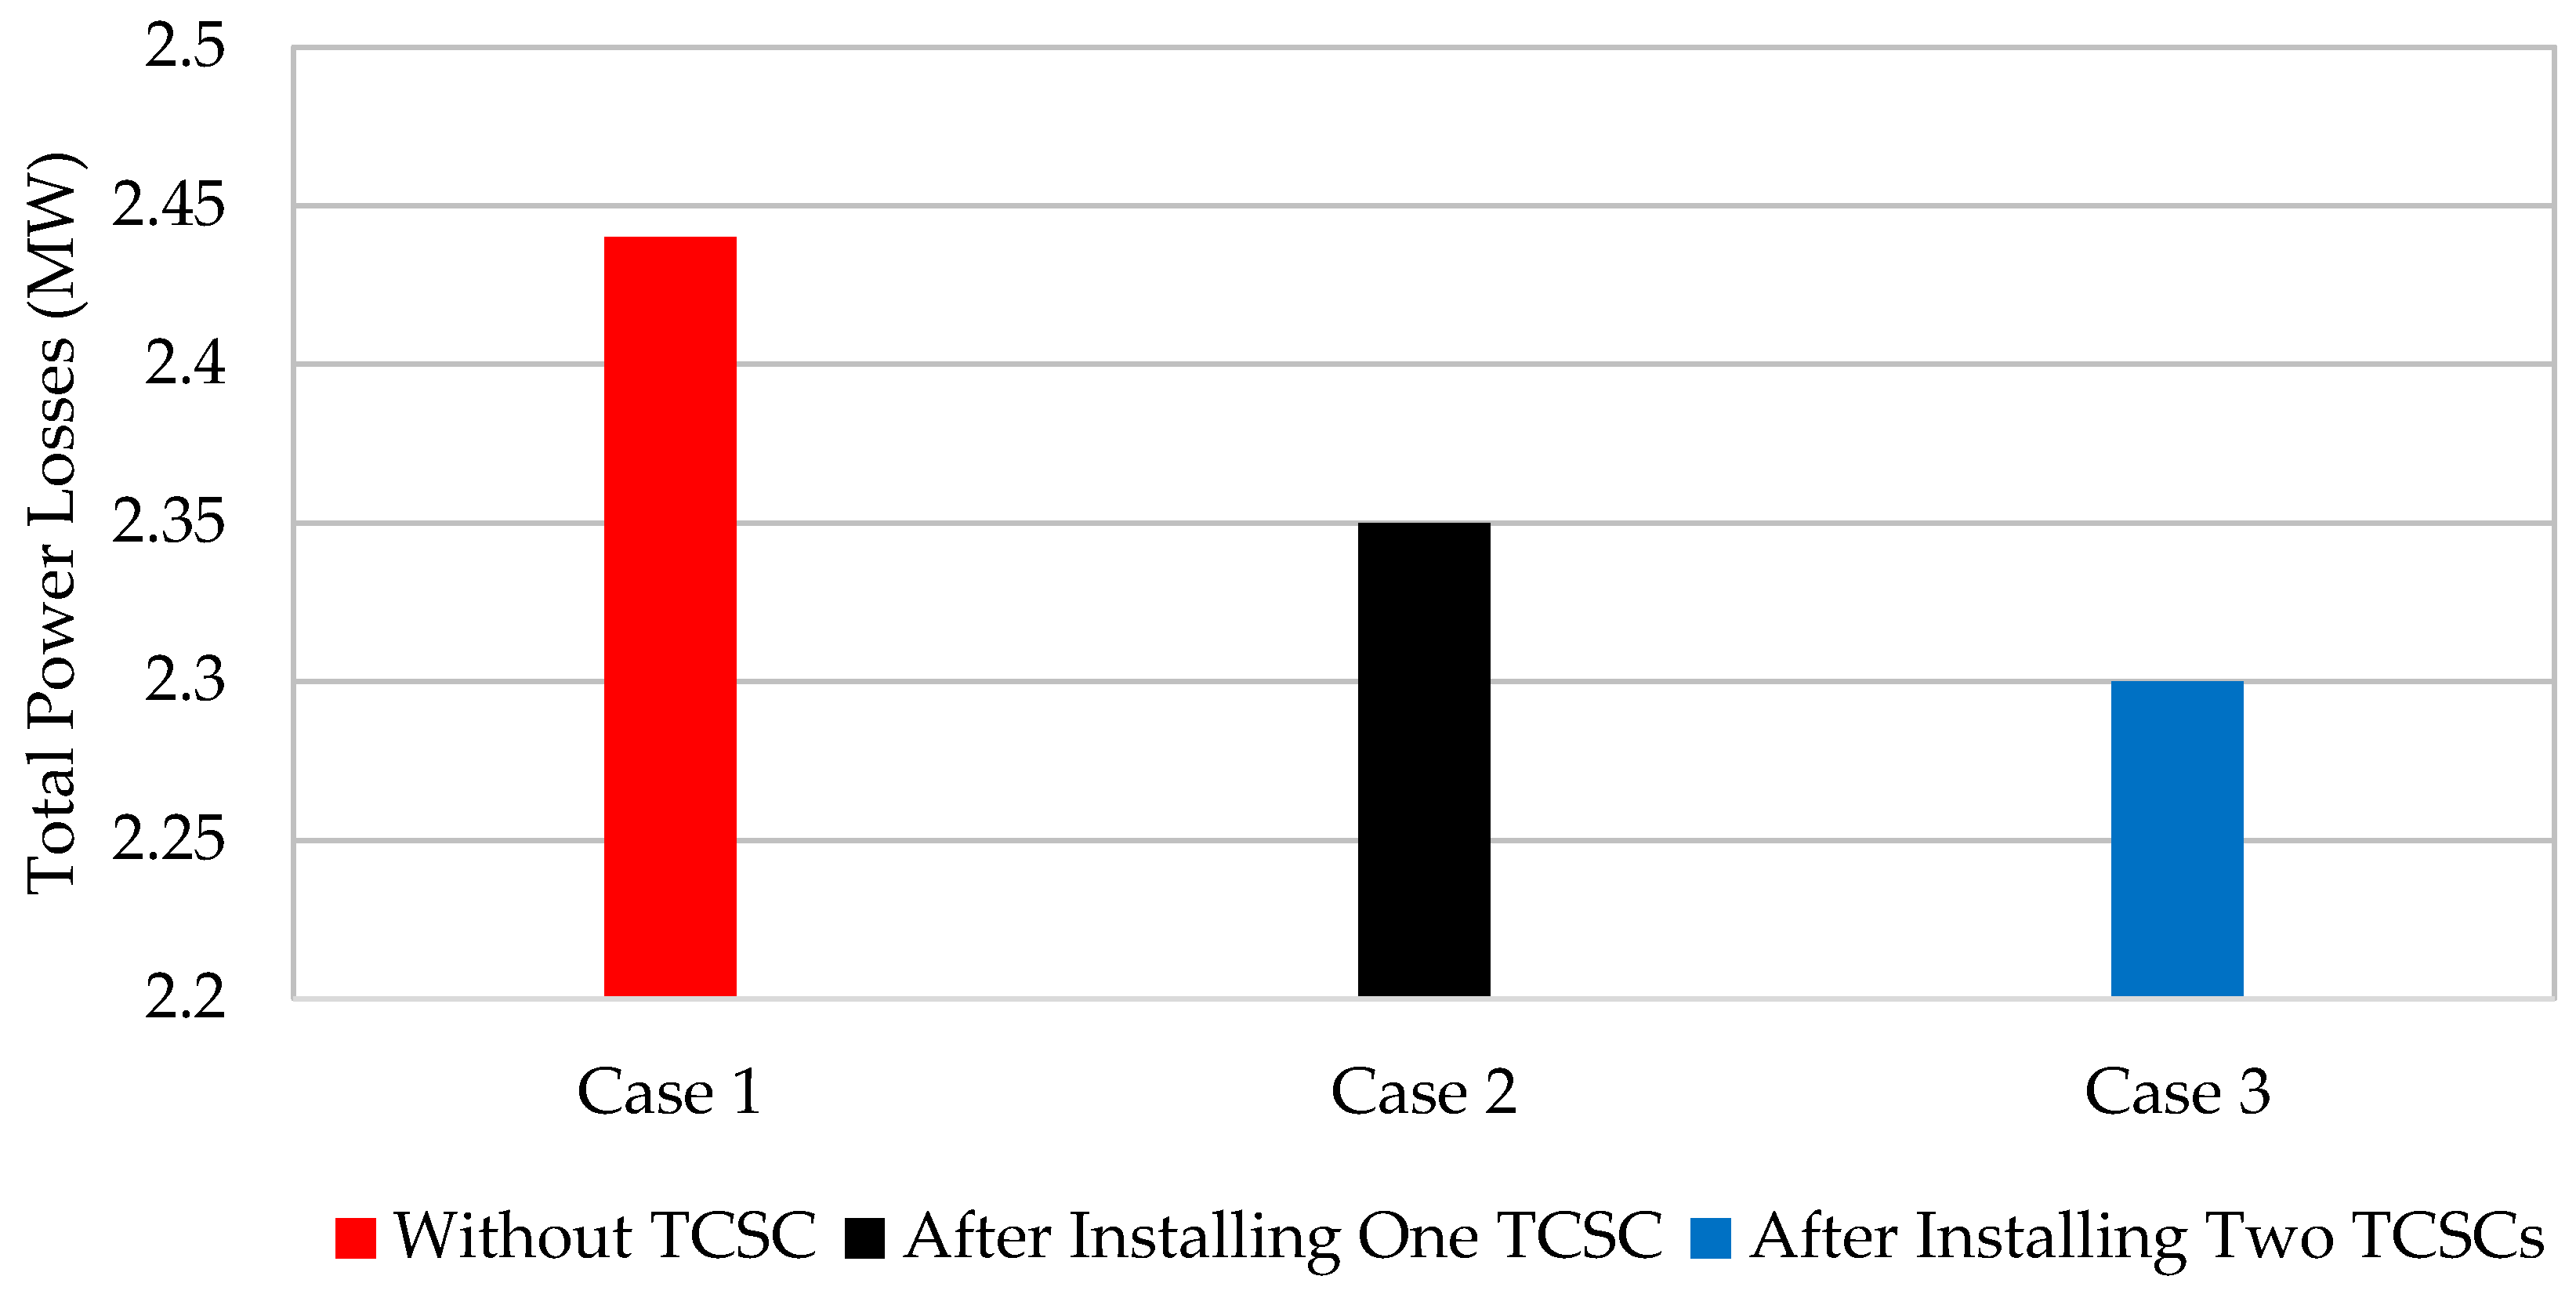
In the second scenario, the optimization of the objective function is carried out for two TCSCs. After 1000 iterations, lines 36 (the connection line between bus 27 and bus 28) and 16 (the connection line between bus 12 and bus 13), with 59.58% and 56.74% compensation rates of the lines reactance, are chosen as the two optimum TCSC locations. As shown in Figure 8, the total power losses in this case with two TCSCs are expectedly less than the power loss in the last case with one TCSC. It should be noted that the line compensation rate is limited to 60% of the line reactance.

5.1.3. Optimizing the Congestion Index with One TCSC

In the next scenario, the optimal location and compensation rate of the line, with the aim of optimizing the congestion index using the MOGA, are obtained. For the minimum congestion index (objective function), it is defined that the congestion index should be greater than 2. Therefore, after 600 iterations, line 36 (the connection line between bus 27 and bus 28) is obtained as the optimal location of the TCSC, with 60% compensation rate of the line reactance. Figure 9 shows the congestion index before and after the installation of one TCSC after 600 iterations. In fact, as the congestion index is smaller and closer to zero, the possibility of the overload condition of the lines due to probable variations is less. Therefore, the power flow through the lines can be smoother.

5.1.4. Optimizing the Congestion Index with Two TCSCs

The impact of installing two TCSCs on the system congestion reduction is investigated. After 1000 iterations, it is observed that the best result is obtained by placing TCSCs in lines 36 (the connection line between bus 27 and bus 28) and 12 (the connection line between bus 6 and bus 10) with 59.8% and 55.8% compensation rates of the lines reactance, respectively. Figure 10 shows the obtained congestion index before and after the installation of two TCSCs. It is also observed that the congestion index is reduced in this case.

5.1.5. Comparison of the Impact of TCSC Installation on the Congestion Index

In order to compare the impact of TCSC installation on the congestion index, some of the obtained values for different states of the case-study are given in Table 1. This table shows that the congestion index is reduced slightly after the installation of two TCSCs rather than one. However, some of the congestion indices are increased, the installation of two TCSCs can cause a reduction in the congestion index.

5.2. Performance Evaluation Using Different Heuristic Techniques

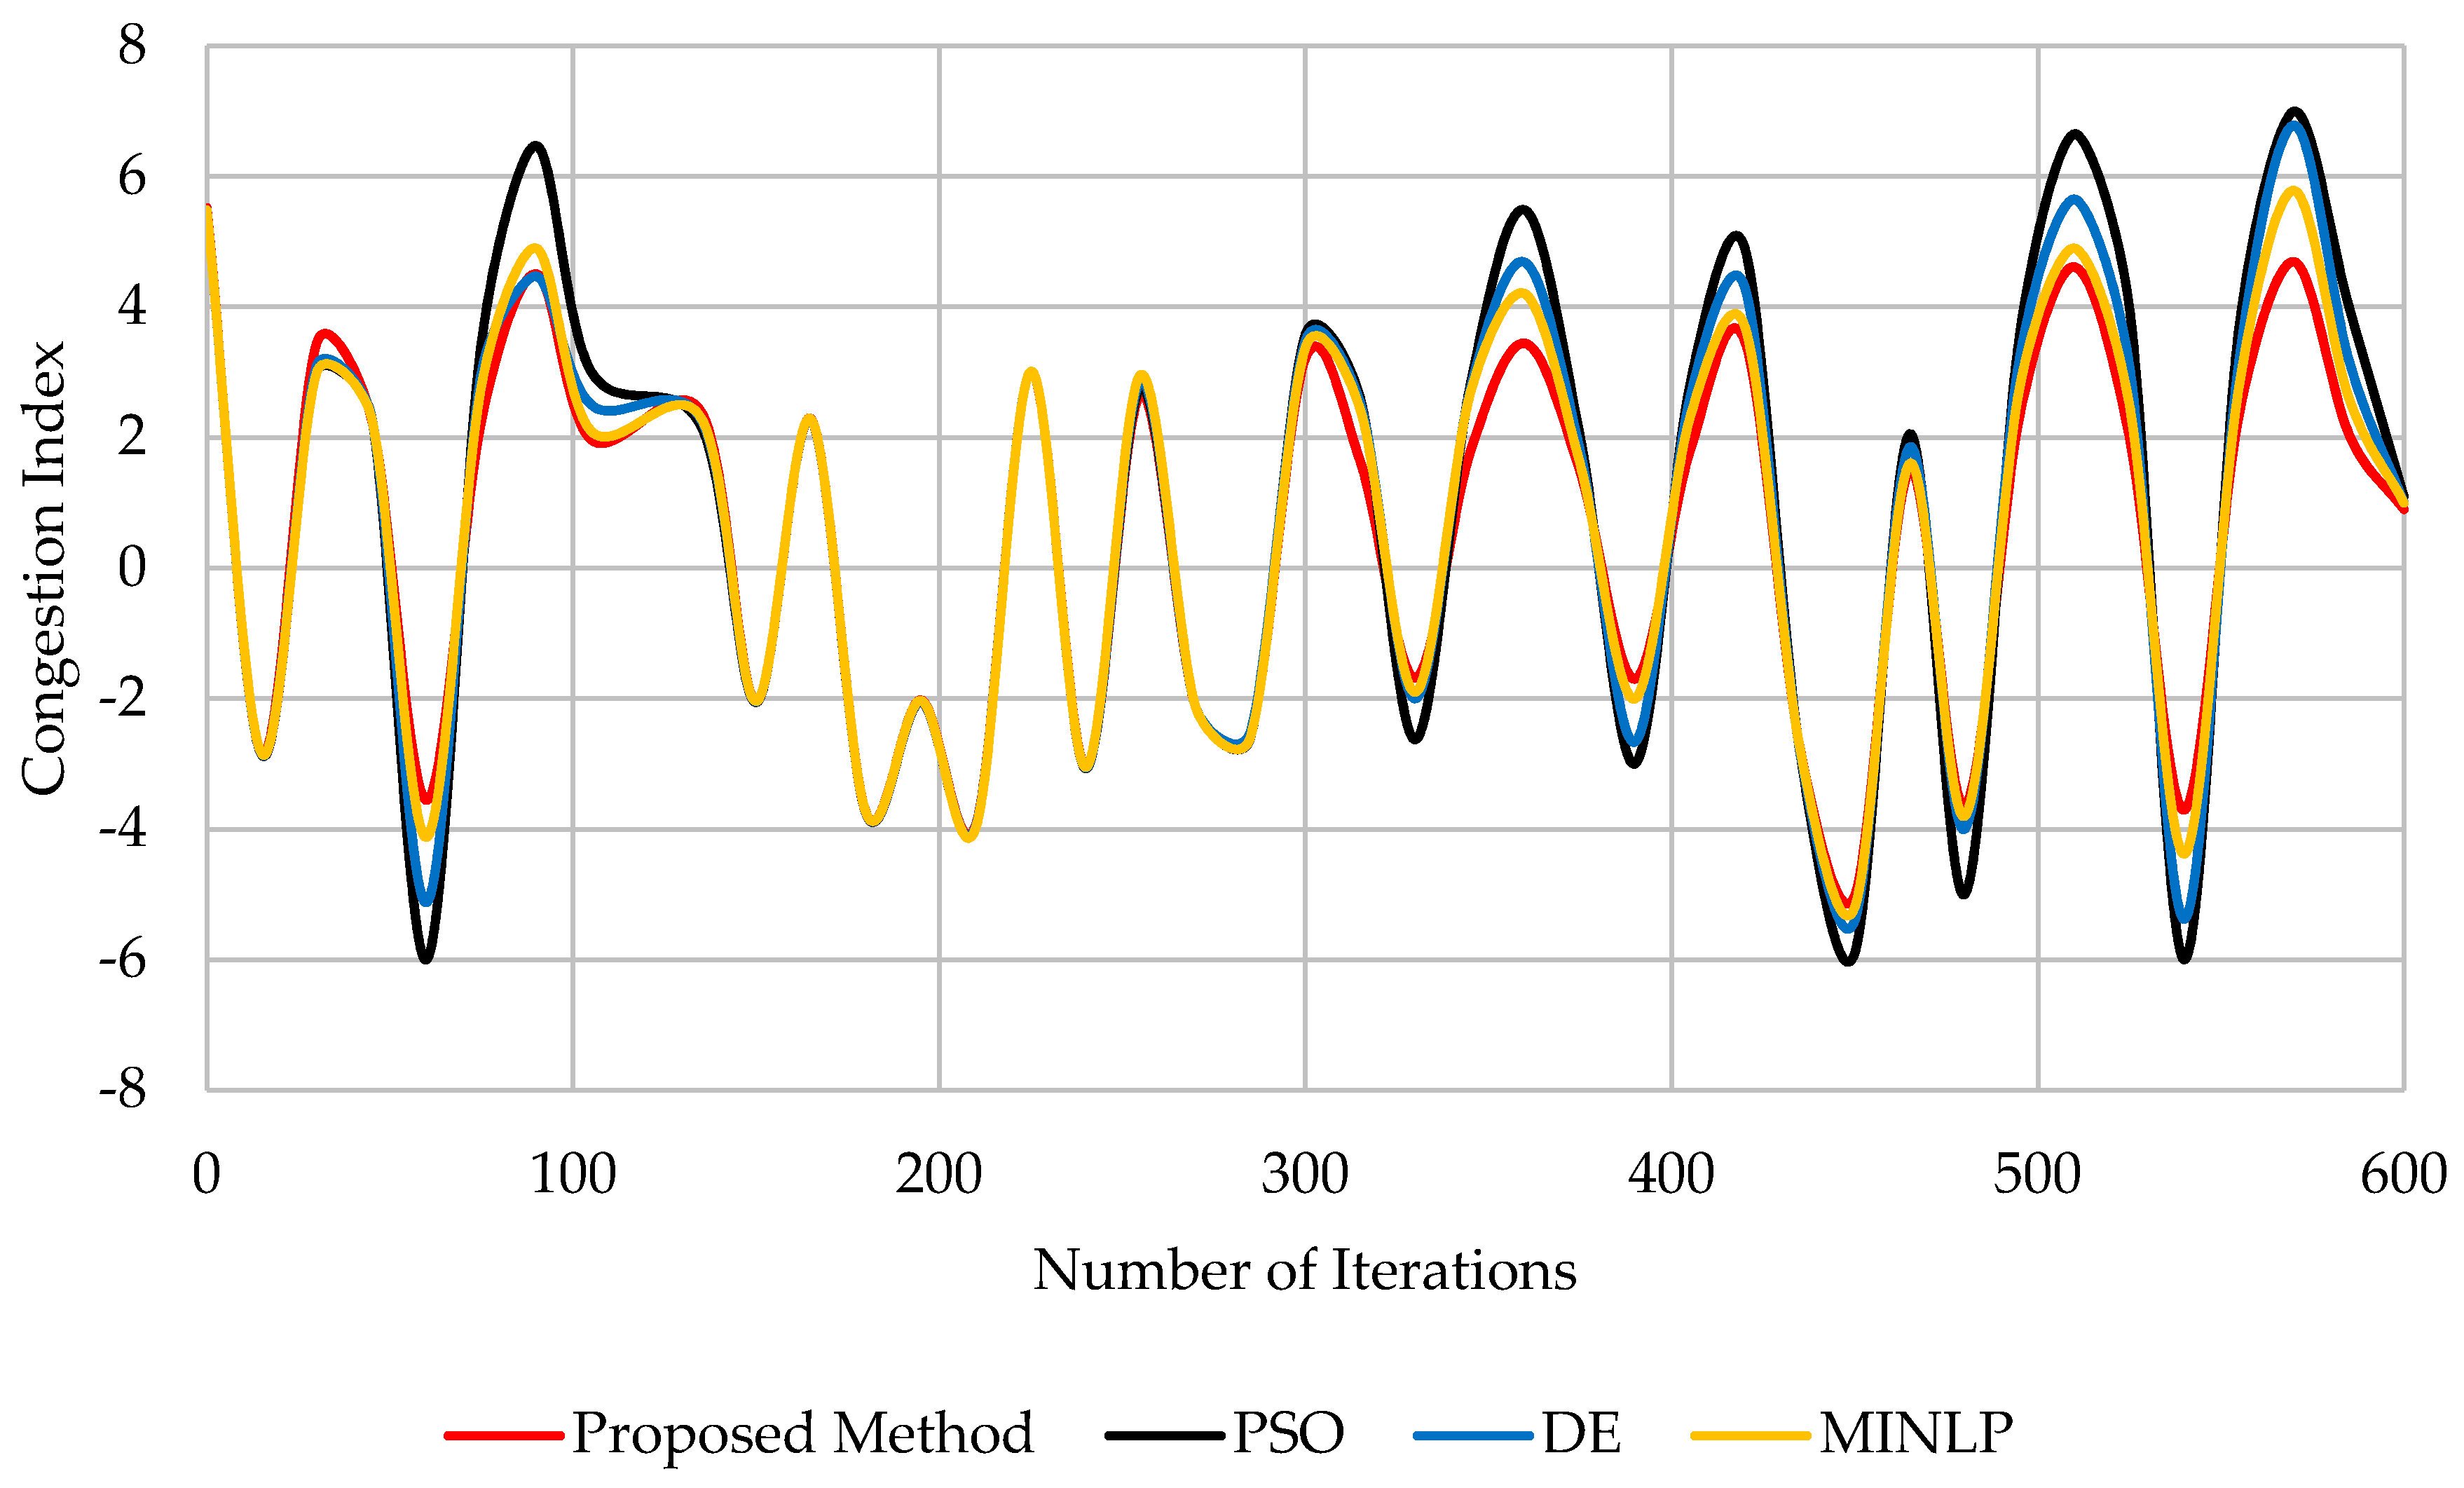
To check the performance, applicability, and effectiveness of the proposed method, different heuristic algorithms, such as the multi-objective PSO algorithm, Differential Evolution (DE) algorithm, and MINLP technique are used for comparison, subject to the same conditions (the same population size, same number of iterations, same number of runs, etc.) and on the same machine. The initial population size for each technique is considered as 1000. It should be noted that finite-time and fast convergence is an important capability of any algorithm in practical tests [37,38,39]. Figure 11, Figure 12, Figure 13 and Figure 14 show a summary of the comparisons among the proposed method and the multi-objective PSO, DE, and MINLP methods.
Figure 11 shows the voltage improvement at all buses after the installation of one TCSC using different techniques. However, after 600 iterations, line 36 (the connection line between bus 27 and bus 28) is determined as the optimal location of the TCSC using different algorithms, the PSO algorithm shows overall higher compensation rates at all of the busses.
The impact of installing two TCSCs on total power losses using different techniques is shown in Figure 12. As shown in this figure, the MOGA determines the lowest total power losses in all three cases (without TCSC, after installing one TCSC, and after installing two TCSCs).
Figure 13 shows the congestion index after the installation of one TCSC using different techniques. As Figure 13 illustrates, the MOGA is highly capable of determining the optimum congestion index after the installation of one TCSC.
Figure 14 demonstrates the congestion index after the installation of two TCSCs using different techniques. As shown in this figure, (1) compared to in Figure 14, the congestion index is slightly reduced, and (2) the MOGA is a superior technique to determine the optimum congestion index after the installation of one TCSC.

6. Conclusions

Congestion management is one of the main challenges of power system optimization. Flexible AC Transmission System (FACTS) devices, such as TCSCs, can be used to manage line congestion with controlling the power flow of the grids. On the other hand, due to the high investment costs of FACTS device installation, determining their optimal locations is very important. In this paper, for the first time, power loss reduction, congestion management, and determination of the power line compensation rates are considered, to optimally allocate TCSCs and their susceptance values. The Jacobian sensitivity approach and AC load flow are used for line congestion evaluations. Then, the Multi-Objective Genetic Algorithm (MOGA) was applied to determine the optimal locations and susceptance values of TCSCs. The obtained results show that the optimal allocation and compensation rate of one TCSC can improve power loss and congestion indices. Additionally, the optimal allocation and compensation rates of two TCSCs show that increasing the number of TCSCs results in a slight power loss reduction and an improvement of the congestion index. Meanwhile, the obtained results are compared with those from different algorithms, such as the multi-objective Particle Swarm Optimization (PSO) algorithm, Differential Evolution (DE) algorithm, and Mixed-Integer Non-Linear Program (MINLP) technique, to evaluate the superiority of the proposed method—in terms of fast convergence and high accuracy—over the other heuristic methods. It is noted that the proposed method is a fast and accurate method that can be used for power system operation and planning studies.

Author Contributions

F.M. was responsible for methodology, collecting resources, data analysis, writing—original draft preparation, supervision, and writing—review and editing. T.-T.N. was responsible for writing—review and editing. All authors have read and agreed to the published version of the manuscript.

Funding

This research received no external funding.

Conflicts of Interest

The authors declare no conflict of interest.

References

  1. Besharat, H.; Taher, S.A. Congestion management by determining optimal location of TCSC in deregulated power systems. Int. J. Electr. Power Energy Syst. 2008, 30. [Google Scholar] [CrossRef]
  2. Rajderkar, V.P.; Chandrakar, V.K. Comparison of series FACTS devices via optimal location in a power system for congestion management. In Proceedings of the Asia-Pacific Power and Energy Engineering Conference, Wuhan, China, 27–31 March 2009. [Google Scholar]
  3. Mandala, M.; Gupta, C.P. Congestion management by optimal placement of facts device. In Proceedings of the Joint International Conference on Power Electronics, Drives and Energy Systems and 2010 Power India, New Delhi, India, 20–23 December 2010. [Google Scholar]
  4. Hosseinipoor, N.; Nabavi, S.M.H. Optimal locating and sizing of TCSC using genetic algorithm for congestion management in deregualted power markets. In Proceedings of the 9th International Conference on Environment and Electrical Engineering, Prague, Czech Republic, 16–19 May 2010. [Google Scholar]
  5. Yousefi, A.; Nguyan, T.T.; Zareipour, H.; Malik, O.P. Congestion management using demand response and FACTS devices. Int. J. Electr. Power Energy Syst. 2012, 37. [Google Scholar] [CrossRef]
  6. Kumar, A.; Srivastava, S.C.; Singh, S.N. A zonal congestion management approach using AC transmission congestion distribution factors. Electr. Power Syst. Res. 2004. [Google Scholar] [CrossRef]
  7. Mori, H.; Goto, Y. A parallel tabu search based method for determining optimal allocation of FACTS in power systems. In Proceedings of the International Conference on Power System Technology, Perth, Australia, 4–7 December 2000. [Google Scholar]
  8. Singh, S.N.; David, A.K. Congestion management by optimising FACTS device location. In Proceedings of the International Conference on Electric Utility Deregulation and Restructuring and Power Technologies, London, UK, 4–7 April 2000. [Google Scholar]
  9. Gerbex, S.; Cherkaoui, R.; Germond, A.J. Optimal location of multi-type FACTS devices in a power system by means of genetic algorithms. IEEE Trans. Power Syst. 2001, 16. [Google Scholar] [CrossRef]
  10. Kumar, A.; Sekhar, C. Congestion management with FACTS devices in deregulated electricity markets ensuring loadability limit. Int. J. Electr. Power Energy Syst. 2013. [Google Scholar] [CrossRef]
  11. Vetrivel, K.; Mohan, G.; Rao, K.U.; Bhat, S.H. Optimal placement and control of TCSC for transmission congestion management. In Proceedings of the International Conference on Computation of Power, Energy, Information and Communication (ICCPEIC), Chennai, India, 16–17 April 2014. [Google Scholar]
  12. Choudekar, P.; Sinha, S.K.; Siddiqui, A. Transmission line efficiency improvement and congestion management under critical contingency condition by optimal placement of TCSC. In Proceedings of the 7th India International Conference on Power Electronics (IICPE), Patiala, India, 17–19 November 2016. [Google Scholar]
  13. Surya, R.; Janarthanan, N.; Balamurugan, S. A novel technique for congestion management in transmission system by real power flow control. In Proceedings of the International Conference on Intelligent Computing, Instrumentation and Control Technologies (ICICICT), Kannur, India, 6–7 July 2017. [Google Scholar]
  14. Retnamony, R.; Raglend, I.J. Congestion management is to enhance the transient stability in a deregulated power system using FACTS devices. In Proceedings of the International Conference on Control, Instrumentation, Communication and Computational Technologies (ICCICCT), Kumaracoil, India, 18–19 December 2015. [Google Scholar]
  15. Dawn, S.; Tiwari, P.K.; Gope, S.; Goswami, A.K.; Kumar, P. An active power spot price based approach for congestion management by optimal allocation of TCSC in competitive power market. In Proceedings of the IEEE Region 10 Conference (TENCON), Singapore, Singapore, 22–25 November 2016. [Google Scholar]
  16. Kulkarni, P.P.; Ghawghawe, N.D. Optimal placement and parameter setting of tcsc in power transmission system to increase the power transfer capability. In Proceedings of the International Conference on Energy Systems and Applications, Pune, India, 30 October–1 November 2015. [Google Scholar]
  17. Ziaee, O.; Choobineh, F.F. Optimal location-allocation of TCSC devices on a transmission network. IEEE Trans. Power Syst. 2017, 32. [Google Scholar] [CrossRef]
  18. Khatavkar, V.; Namjoshi, M.; Dharme, A. Congestion management in deregulated electricity market using FACTS and multi-objective optimization. In Proceedings of the Indian Control Conference (ICC), Hyderabad, India, 4–6 January 2016. [Google Scholar]
  19. Shchetinin, D.; Hug, G. Optimal TCSC allocation in a power system for risk minimization. In Proceedings of the North American Power Symposium (NAPS), Pullman, WA, USA, 7–9 September 2014. [Google Scholar]
  20. Siddiqui, A.S.; Khan, M.T.; Iqbal, F. A novel approach to determine optimal location of TCSC for congestion management. In Proceedings of the 6th IEEE Power India International Conference (PIICON), Delhi, India, 5–7 December 2014. [Google Scholar]
  21. Tang, W.; Pan, W.; Zhang, K.; Liu, C. Study of the location of TCSC for improving ATC considering N-1 security constraints. In Proceedings of the 26th Chinese Control and Decision Conference (CCDC), Changsha, China, 31 May–2 June 2014. [Google Scholar]
  22. Sarwar, M.; Khan, M.T.; Siddiqui, A.S.; Quadri, I.A. An approach to locate TCSC optimally for congestion management in deregulated electricity market. In Proceedings of the 7th India International Conference on Power Electronics (IICPE), Patiala, India, 17–19 November 2016. [Google Scholar]
  23. Sharma, A.; Jain, S. Locating series FACTS devices for managing transmission congestion in deregulated power market. In Proceedings of the 7th India International Conference on Power Electronics (IICPE), Patiala, India, 17–19 November 2016. [Google Scholar]
  24. Gitizadeh, M.; Khalilnezhad, H. Power system loss reduction through TCSC economic installation considering switching loss. In Proceedings of the 45th International Universities Power Engineering Conference (UPEC), Cardiff, Wales, UK, 31 August–3 September 2010. [Google Scholar]
  25. Baghaee, H.R.; Kaviani, A.K.; Mirsalim, M.; Gharehpetian, G.B. Short circuit level and loss reduction by allocating TCSC and UPFC using particle swarm optimization. In Proceedings of the 19th Iranian Conference on Electrical Engineering, Tehran, Iran, 17–19 May 2011. [Google Scholar]
  26. Hridya, K.R.; Mini, V.; Visakhan, R.; Kurian, A.A. Analysis of voltage stability enhancement of a grid and loss reduction using series FACTS controllers. In Proceedings of the International Conference on Power, Instrumentation, Control and Computing (PICC), Thrissur, India, 9–11 December 2015. [Google Scholar]
  27. Manganuri, Y.; Choudekar, P.; Abhishek; Asija, D.; Ruchira. Optimal location of TCSC using sensitivity and stability indices for reduction in losses and improving the voltage profile. In Proceedings of the 1st International Conference on Power Electronics, Intelligent Control and Energy Systems (ICPEICES), Delhi, India, 4–6 July 2016. [Google Scholar]
  28. Moslemi, R.; Shayanfar, H.A. Optimal location for series FACTS devices to transient stability constrained congestion management. In Proceedings of the 10th International Conference on Environment and Electrical Engineering, Rome, Italy, 8–11 May 2011. [Google Scholar]
  29. Reddy, S.S.; Kumari, M.S.; Sydulu, M. Congestion management in deregulated power system by optimal choice and allocation of FACTS controllers using multi-objective genetic algorithm. IEEE PES 2010. [Google Scholar] [CrossRef]
  30. Abou-Ghazala, A. Optimal capacitor placement in distribution systems feeding nonlinear loads. In Proceedings of the IEEE Bologna Power Tech Conference Proceedings, Bologna, Italy, 23–26 June 2003. [Google Scholar]
  31. Mohammadi, F.; Zheng, C. Stability analysis of electric power system. In Proceedings of the 4th National Conference on Technology in Electrical and Computer Engineering, Tehran, Iran, 27 December 2018. [Google Scholar]
  32. Mohammadi, F.; Nazri, G.-A.; Saif, M. A bidirectional power charging control strategy for plug-in hybrid electric vehicles. Sustainability 2019, 11, 4317. [Google Scholar] [CrossRef] [Green Version]
  33. Mohammadi, F.; Nazri, G.-A.; Saif, M. An improved mixed AC/DC power flow algorithm in hybrid AC/DC grids with MT-HVDC systems. Appl. Sci. 2020, 10, 297. [Google Scholar] [CrossRef] [Green Version]
  34. Khanabadi, M.; Ghasemi, H. Transmission congestion management through optimal transmission switching. In Proceedings of the IEEE Power and Energy Society General Meeting, Detroit, MI, USA, 24–28 July 2011. [Google Scholar]
  35. Christie, R. Power Systems Test Case Archive; UW Power Systems Test Case Archive: Seattle, WA, USA, 1993. [Google Scholar]
  36. Zimmerman, R.D.; Murillo-Sanchez, C.E.; Thomas, R.J. MATPOWER: Steady-state operations, planning and analysis tools for power systems research and education. IEEE Trans. Power Syst. 2011, 26. [Google Scholar] [CrossRef] [Green Version]
  37. Mohammadi, F.; Nazri, G.-A.; Saif, M. A fast fault detection and identification approach in power distribution systems. In Proceedings of the 5th International Conference on Power Generation Systems and Renewable Energy Technologies (PGSRET 2019), Istanbul, Turkey, 26–27 August 2019. [Google Scholar]
  38. Karimi, H.; Ghasemi, R.; Mohammadi, F. Adaptive neural observer-based nonsingular terminal sliding mode controller design for a class of nonlinear systems. In Proceedings of the 6th International Conference on Control, Instrumentation, and Automation (ICCIA 2019), Kordestan, Iran, 30–31 October 2019. [Google Scholar]
  39. Tavoosi, J.; Mohammadi, F. Design a new intelligent control for a class of nonlinear systems. In Proceedings of the 6th International Conference on Control, Instrumentation, and Automation (ICCIA 2019), Kordestan, Iran, 30–31 October 2019. [Google Scholar]
Figure 1. A model of a Thyristor-Controlled Series Compensator (TCSC).
Sustainability 12 02813 g001
Figure 2. The π equivalent circuit of a transmission line.
Sustainability 12 02813 g002
Figure 3. The π equivalent circuit of a transmission line after TSCS installation.
Sustainability 12 02813 g003
Figure 4. An equivalent injection model of a transmission line after TCSC installation.
Sustainability 12 02813 g004
Figure 5. The coding of the objective function variables.
Sustainability 12 02813 g005
Figure 6. The single-line diagram of the IEEE 30-bus test system.
Sustainability 12 02813 g006
Figure 7. The voltage at different buses before and after the installation of one TCSC.
Sustainability 12 02813 g007
Figure 8. Comparison of the total power losses for different cases.
Sustainability 12 02813 g008
Figure 9. The congestion index before and after installation of one TCSC.
Sustainability 12 02813 g009
Figure 10. The congestion index before and after installation of two TCSCs.
Sustainability 12 02813 g010
Figure 11. Comparison of the voltage at different buses after the installation of one TCSC using different techniques.
Sustainability 12 02813 g011
Figure 12. Comparison of the total power losses for different cases using different techniques.
Sustainability 12 02813 g012
Figure 13. The congestion index after the installation of one TCSC using different techniques.
Sustainability 12 02813 g013
Figure 14. The congestion index after the installation of two TCSCs using different techniques.
Sustainability 12 02813 g014
Table 1. Congestion index comparison in three different scenarios.
Without TCSCWith Installing One TCSCWith Installing Two TCSCs
5.67825.52095.4876
3.44963.44962.9298
−6.1228−3.5560−3.5882
4.50561.96681.9282
−2.0359−2.0359−1.9552
−2.0222−2.0222−1.8619
3.00623.00621.4983
−2.1218−2.1218−2.2608
3.21353.21352.6835
−3.6272−1.6807−1.8361
3.02201.47991.4364
3.47881.79251.7634
−2.7393−5.0217−5.0954
−6.2709−3.6420−3.0750
4.10852.10431.9749
4.69442.36432.3378