Article

Technology Characteristics, Stakeholder Pressure, Social Influence, and Green Innovation: Empirical Evidence from Chinese Express Companies

1
Jiangsu Key Laboratory of Urban ITS, Jiangsu Province Collaborative Innovation Center of Modern Urban Traffic Technologies, School of Transportation, Southeast University, Nanjing 211189, China
2
School of Traffic Engineering, Huaiyin Institute of Technology, Huaian 223003, China
3
Business School, Huaian Vocational College of Information Technology, Huaian 223003, China
4
Civil Aviation College, Nanjing University of Aeronautics and Astronautics, Nanjing 211106, China
5
School of Modern Posts, Xi’an University of Posts and Telecommunications, Xi’an 710061, China
*
Author to whom correspondence should be addressed.
Sustainability 2020, 12(7), 2891; https://doi.org/10.3390/su12072891
Submission received: 11 March 2020 / Revised: 27 March 2020 / Accepted: 3 April 2020 / Published: 5 April 2020
(This article belongs to the Section Sustainable Transportation)

Abstract

:
Over the past decade, the rapid development of e-commerce and express industries in China has resulted in huge environmental costs. Compared with manufacturing industries, the values of green innovation are less recognized in logistics industries. To promote the green practices in logistic enterprises, it is imperative to have a thorough understanding of the determinants of green innovation adoption. To this end, this paper performs an empirical investigation into the intentions to adopt green innovation from 196 Chinese express companies. The determinant variables were constructed from the perspective of technology characteristics (perceived green usefulness and perceived integration ease of use), stakeholder pressure (government, customer, and platform pressures), and social influence. Then, a 20-item scale was designed based on the literature review and expert opinions. The results revealed the significant positive effects of technology characteristics and social influence on the intentions to adopt green innovation. Meanwhile, only the platform pressure was significant with the adopting intentions among the variables from stakeholder pressure. Moreover, variables from technology characteristics were found to have meditation effects between social influence and adopting intentions. Based on the findings, theoretical and practical implications are proposed to promote the green and sustainable development of express companies in China.

1. Introduction

1.1. Background and Rationale

Green innovation (also known as green technology innovation) refers to the innovation activities (e.g., technology, craft, and countermeasures) that aim to reduce the resource consumptions and climate costs during the processes of product design, manufacture, delivery, and usage [1]. The green innovation can not only reduce pollution, but also gain a competitive advantage in terms of financial and operational performance [2,3,4,5]. These benefits have been widely spotted in manufacturing industries [6,7,8,9,10]. However, in the development of the modern service industry, some overlooked environmental issues are becoming increasingly prominent, especially in transportation and logistics industries [11,12,13,14,15]. While the major activities of the logistics services include transport, warehousing, packaging, and distribution, each service can achieve sustainable innovation and green goals [16].
In recent years, the e-commerce economy and the express industry have grown rapidly in China. Until 2019, the business volume and income of express companies reached 63 billion pieces and 745 billion yuan, respectively [17]. The average growing rates were over 24% and 23% for the business volume and express company income, respectively. In addition, the online retail sales exceeded 8000 billion yuan. Consequently, over 10 million tons of packaging wastes were produced, while the recycling rate was less than 10%. This was accompanied with massive pollutant emissions produced by tens of thousands of delivery vehicles [18]. Warehousing-related environmental externalities, including air pollution and traffic safety concerns, as well as packaging contamination, resource waste, and energy consumption, have become the primary obstacles restricting the sustainable development of China’s express industry [19].
To address the environmental pollutions in the logistics industry, a great deal of environment-related green innovations may be the key to dealing with the above dilemma [20]. Green initiatives, such as increased energy efficiency and green technology applications, are widely proposed. For example, some researchers have examined that the computerized routing and scheduling and vehicle telematics can reduce CO2 emissions and fuel consumption in road freight [21]. Likewise, the great potential of introducing electric vehicles into urban logistics to reduce pollution and the cost of last mile distribution was discovered [22]. The Chinese government has also released several policies that aim to promote environmental protection and energy saving in terms of green packaging, green storage, green transportation, and standard systems, etc. Meanwhile, the industries are also actively endorsing the applications of green technologies and products, such as new energy delivery vehicles, shared delivery boxes, electronic waybills, radio frequency identification devices (RFID), and cloud computing [3,23,24,25].
However, compared to developed countries, the express industry in China is still at the primary stage with respect to environmental management and green practice. The rate of green innovation practice is still relatively low, especially for the large amount of small and medium sized (SMS) express companies. Therefore, it is of great significance to have prior knowledge of the determinants of the green innovation adoptions of express companies before any practical implementation of countermeasures.
The studies of determinants for the enterprises’ green innovation adoptions experienced different stages. Earlier studies were more concerned with the external factors—e.g., government regulations, technology, and market [26,27]. Afterwards, some researchers paid more attention to internal factors among the organizations, such as strategies, resources, and capabilities [28,29]. Recently, researchers have explicated the benefits of green innovation for logistic industries [25,30]. Determinants of the willingness to adopt green innovation practices for logistic enterprises have been explored, such as technology characteristics, regulatory pressure, customer pressure, environmental uncertainty, organization support, and quality of human resources [31,32,33].
It is worth noting that the e-commerce platforms are inextricably intertwined with the express companies. Therefore, e-commerce platforms as a new form of stakeholders may be very influential to the green innovation adoptions of express companies. However, very few studies have investigated such impacts empirically, mainly due to the newly emerging research interests. Meanwhile, social influence has been widely considered in the adoption of new technologies and information systems [34,35]. Since the green innovation practice comprises the procedures of adopting new technologies, new products, and advanced systems, it can be regarded as a technological innovation process [32]. Therefore, following these rationales, this study aims to explore the determinants of green innovation adoptions for Chinese express companies and then propose the effective countermeasures.

1.2. Objectives of This Study

To fill the above research gaps, this paper establishes a comprehensive framework for examining how these express companies respond to green innovation adoption from the perspectives of technological characteristics, stakeholder pressure, and social influence. Inspired by the empirical evidences from the literature, conceptional models and hypotheses were proposed. Then, a questionnaire survey consisting of 20 items was designed and delivered to the corporators from 196 Chinese express companies. To show the impacts of these determinants, a series of statistical analyses was performed. Apart from the descriptive analysis, a structural equation model (SEM) was also adopted to analyze the underlying structure of items in the developed framework. Finally, recommendations were given to promote the green innovation adoptions among Chinese express companies from a policy making aspect. The findings of this study can not only be beneficial to the management and practical implementation of green innovations, but also provide a solid theoretical basis for the motivation of adopting green innovations for express companies.
The remainder of this paper is organized as follows: Section 2 introduces the theoretical framework and hypothesis, including the related findings from the literature; Section 3 describes the design of measures and surveys; Section 4 presents the data analysis and results of model verification from the empirical data; Section 5 discusses the contributions and implications of this study; Section 6 summarizes the conclusions, limitations, and suggestions for future works.

2. Theoretical Framework and Hypothesis

2.1. Theoretical Framework

In the literature, theatrical frameworks, such as the technology adoption model (TAM) and stakeholder theory, have been an important research direction in exploring environmental practices [36,37]. However, few of these models were developed for exploring the determinants of the green innovation adoptions of Chinese express companies. To fill this gap, we propose hypotheses on the determinant variables of adopt intention (AI) from the perspectives of technology characteristics (perceived green usefulness (PGU) and perceived integration ease of use (PIE)), stakeholder pressure (government pressure (GP), customer pressure (CP), and e-commerce platform pressure (PP)), and social influence (SI). In addition, the social-demographic information was regarded as a control variable.
The theoretical framework is proposed to illustrate the structure of the conceptional model (see Figure 1). The collection of a 20-item survey and their reference sources are summarized in Appendix A. In the following paragraph, we will elaborate the motivations for these hypotheses, as well as the methods and theories for designing the items.

2.2. Technology Characteristics and Green Innovation

The most commonly used theories in the adoption of new technologies or information systems include the theory of reasoned action (TRA), the theory of planned behavior (TPB), and the technology acceptance model (TAM), etc. [38,39,40,41]. TAM is a combined use of TRA and TPB, with a further utilization of perceived usefulness and perceived ease of use. Later, Davis et al. (1996) [42] discovered the weak prediction performance of attitudes towards intentions and behaviors and deleted the attitude variable to rebuild TAM. Thereafter, technology characteristics (perceived usefulness and perceived ease of use) were considered more in the research of technology innovation adoption [36,43,44].
Green innovation is a type of technology innovation, with an emphasis on the function of emerging technologies on reducing environmental pollution and energy consumption [31,33]. Therefore, to improve the prediction accuracy of the intentions to adopt green innovation in Chinese express companies, based on TAM, this study modified the perceived usefulness and perceived ease of use as perceived green usefulness (PGU) and perceived integration ease of use (PIE).
PGU represents the perceptions of the benefits of adopting green innovations, which mainly reflects in reducing pollution and cost, gaining competitive advantage, social expectation, and legality, etc. [25,45,46]. Previous evidence showed that the enterprises will adopt green innovation only when they can expect enough revenue [47]. To figure out the return on investment (ROI) of green innovation, Porter (1995) [48] reported that the green investment can be paid back partially or totally in a relatively short period of time. In this regard, green innovation can not only help the enterprise gain the first-mover advantage, but also take advantage of market competition by developing industry standards [49]. Moreover, if the enterprises were inclined to adopt green innovation, they were likely to harvest both economic and environmental benefits [50,51]. Therefore, we expect that the PGU is positively related to the intentions of adopting green innovation, and propose the following hypothesis:
Hypothesis 1 (H1): 
PGU is positively related to the intentions of adopting green innovation for Chinese express companies.
On the other hand, the effects of PIE on green innovation adoption were also found to be significant in the literature. For enterprises, the green innovation always involves the application of new technology, new products, new systems, and even the reengineering of the job and management process. If these changes can be integrated with existing practices and pushed through smoothly, it will have a profound effect on the decision making of green innovation adoption [50,52,53]. The closer that the green innovation is linked with the enterprises’ existing operational experiences, the smaller the resistance in adopting green innovation [46,54,55]. The green practices are easier to diffuse inside the enterprises when they are compatible with existing technology and procedures [32]. Moreover, PIE will also influence the enterprises’ perception of uncertain risks. High PIE can reduce the perception of risk adoption while increasing the intention to adopt green innovation [56]. Therefore, we proposed two hypotheses under the PIE variable:
Hypothesis 2 (H2): 
PIE has a significant positive correlation with the decision making of the intentions to adopt green innovation for Chinese express companies.
Hypothesis 3 (H3): 
PIE has a significant positive correlation with PGU.

2.3. Stakeholder Pressure and Green Innovation

The institutional theory emphasized the impacts of the external environment on the green innovations [57]. From an analytical logic point of view, the green innovation can be considered as an approach to handling the regulation pressure and market demand. The objective is to make the enterprises conform to the public recognition, social expectation, and legality [9,57,58]. Under institutional pressure, the stakeholders’ proposal will have an imperative influence on the green strategies and practices of the enterprises [59,60,61,62,63].
Among the various types of stakeholder pressures, government pressure (GP) and customer pressure (CP) have been considered as the most important determinants in affecting the green innovation adoption of enterprises [37,64]. This paper follows this point of view and also investigates these two factors. However, the related works were more concerned with manufacturing industries. We consider one more step on the heterogenous responses across industries and intend to see the unique response from Chinese express companies [50]. Moreover, as a serious environmental situation of e-commerce logistics, the e-commerce platform will be another important stakeholder in affecting the green practice of express companies, and this is also a research gap, as few studies have considered this factor. This paper intends to fulfill this gap by selecting the platform pressure from the e-commerce industry as the investigating target.
GP usually refers to the government regulations on enterprises, such as environmental policies. To avoid punishment from the government and maintain the regulatory flexibility, enterprises have to stop the environmentally unfriendly behaviors and take up green practices [57,65,66]. Many researchers have demonstrated this viewpoint. For example, following the regulation has been proven as a core driver for the enterprises’ green behaviors [67,68]. Likewise, through a survey of 92 manufacturing enterprises in Germany, it was found that the likelihood of performing green innovation was positive with the strictness of mandatory environmental regulations [9]. In addition, enterprises also need to follow the international environmental regulations to participate in global competition. Therefore, the regulation strictness and the enterprises’ perceptions will have a direct influence on the green innovation adoption [69]. From our empirical knowledge, the perceptions towards GP of express companies may not be as strong as the manufacturing industry. Thus, it is important to test this effect in this study. We propose another hypothesis:
Hypothesis 4 (H4): 
GP has a significant positive correlation with the intentions to adopt green innovation for Chinese express companies.
CP, originating from customer requirements and expectations of environmental protection, is also an important factor that affects the green practices [70,71,72]. Several researchers have studied the CP effects on the enterprises’ green practice decisions. For example, Lee (2008) [73] found a stronger positive correlation between CP and the enterprises’ green actions. Likewise, CP was also considered as a core driver for the green innovations of third-party logistic providers [4]. Different from traditional logistic enterprises, the terminal customers are one of the important serving targets of express companies, especially in countries and regions where e-commerce is highly developed, such as China. Green and low carbon delivery service can help to gain the enterprises’ reputations and improve customer satisfaction. Therefore, the CP effect is worthy of further investigation on Chinese express companies. On this basis, we propose another hypothesis:
Hypothesis 5 (H5): 
CP has a significant positive correlation with the intention to adopt green innovation for Chinese express companies.
PP from the e-commerce platform is a new stakeholder determinant that has been found in the emerging stage of Chinese e-commerce logistics. In order to provide a green logistic service to fight with the growing environmental issues, an e-commerce platform is also needed to implement the service innovation very quickly [71,74,75,76]. At the same time, the government agencies also request that the e-commerce platforms provide the customers with the choices of green logistic services. To this end, the e-commerce platforms work with the cooperative express companies to promote the green standardizations for e-commerce logistics, such as standard trays, shared delivery boxes, electronic labels, and other green logistic facilities. For instance, it was discovered that organizations were inclined to imitate the adopted actions from leading peers [77]. In addition, the standardized pressure played a significant role in the diffusion process of new technologies [78]. However, the perceptions towards PP from the large amount of SMS express companies in China remain unclear. On this root, we propose the following hypothesis:
Hypothesis 6 (H6): 
PP has a significant positive correlation with the intentions to adopt green innovation for Chinese express companies.

2.4. Social Influence and Green Innovation

TAM was originally developed based on the rationale “belief–attitude–intention” from the rational behavior theory (RBT). It ignores the effects of subjective norms on behavioral intentions [38]. To this end, TAM was further developed by introducing the social influence (SI) concept, resulting in the TAM3 and the unified theory of acceptance and use of technology (UTAUT), etc. [79,80]. SI mainly includes subjective norms and impressions [81]. A subjective norm refers to an individual’s perceived SI towards performing a specific behavior. Impression, to some extent, can be known as an individual’s behavior of using a specific product to improve social status or reputation [34].
Many studies have shown the positive effects of SI on the adoption of new technologies or products [82,83,84,85]. For example, the directors’ subjective norm of environmental regulations were found to be positive, with the preference for pollution reduction countermeasures [85]. Impression changes in both social media and word-of-mouth can significantly affect the intentions of adopting cleaning products [34]. Following this idea, we propose the following three hypotheses:
Hypothesis 7 (H7): 
SI has a significant positive correlation with the intentions to adopt green innovation for Chinese express companies.
Hypothesis 8 (H8): 
SI has a significant positive correlation with PGU.
Hypothesis 9 (H9): 
SI has a significant positive correlation with PIE.

3. Data Collection

3.1. Instrument Design

On root of the empirical findings from the reviewed literature and the theoretical framework proposed in the previous section, we designed a questionnaire survey that targeted the corporators from third-party express companies in China. In addition, to improve the reliability of the designed items, we collected experts’ opinions from the directors of express companies during two conferences on the logistics theme in China. Based on the feedback, we revised the survey accordingly and the final version of the survey is shown in Appendix A (Table A1).
Meanwhile, to guarantee the consistency of the terminology usage of green innovation, we categorized the green innovation by scope into the following types:
  • the use of environmentally friendly packaging materials
  • the recyclability of packaging materials
  • the development of new packaging and delivering modes (e.g., shared delivery box)
  • the use of cleaner energy products (e.g., self-pickup cabinet, new energy delivery vehicle)
  • Resource saving and pollution reducing delivery method (delivering routing optimization, joint distribution)
The survey consisted of two parts: part one involved the 20 measuring items categorized into seven variables. A five-item technology characteristics scale measured the PGU and PIE [36,38,39]; an eight-item stakeholder pressure scale measured the GP, CP, and PP [32,38,54]; a four-item social influence scale measured the SI [34,81,86]; and a three-item intention scale measured the stated preference of adopting intentions [38,39,79]. All the measuring items were designed based on a five-point Likert scale [87], ranging from strongly disagree to strongly agree. The scales have been widely adopted for measuring the attitudes and perceptions in transportation and logistics research [88,89,90,91]. Part two included social-demographic information—e.g., gender, age, education, years of working, position, and enterprise properties, such as years of operation and ownership type [85,92]. These factors were considered as control variables in this study.

3.2. Samples

The respondents of this survey were randomly selected from a list of Chinese express companies provided by the China Express Association. The selecting criterion included the respondents’ green practice experience or the familiarity with the green actions of their companies. The letter of recruitment of the respondents was sent through email. To overcome the low response rate of the email delivery method, we invited the local guilds and the government agencies as intermediaries to assist in the distribution and collection of surveys. These intermediaries were also trained to improve the understanding of the objectives and protect the privacy of the respondents. We also guaranteed to share a free copy of our research results with the respondents.
Moreover, as the language of the survey was Chinese only, we adopted the back-translation method to minimize the cultural and linguistic bias between our survey and the literature [93] and experts were invited to validate the final version of items in both English and Chinese. The duration of this survey lasted for three weeks, from 20 May, 2019. Finally, a total of 196 express companies were selected. After filtering the invalid samples, we finally collected 282 valid samples. The recycle rate of valid samples was 45.1%. The demographic distribution of respondents was basically consistent with the research report on the practitioners of social e-commerce logistics in China released by the Alibaba Research Institute in 2016 [94]. Both the managers and ordinary employees from the express companies were included in the target range. A random sampling method was adopted to determine the distribution of respondents and, generally, the respondents in this study could represent the demographic characteristics of the express companies. Table 1 shows the descriptive statistics of the control variables from the valid samples.

4. Data analysis and Results

4.1. Pre-Test Analysis

The primary objectives of the pre-test analysis were to validate the sample size requirement and identify the threats of common method variance (CMV) and non-response bias to the study. First, the acceptability of the sample size for SEM was investigated. Sample size affects the model’s degree of freedom and the fitting process. In general, when the sample size is over 100, SEM can be regarded as stable [95]. Therefore, the sample size of 282 was acceptable for our following analysis.
In order to lower the potential for common method variance (CMV) bias, we adopted a pilot study method and selected the experienced respondents. We also paid attention to the voluntary and privacy protection issues. Additionally, Harmon’s single-factor test was performed to examine the presence of CMV [96,97]. The results showed that no factor accounted for >35% of the variance, indicating that the common-method bias was not a significant issue for this study. In addition, researchers indicated that for mail surveys, the latter respondents were closer to non-respondents [98]. Thus, we ran a two-way t-test statistical analysis to test the potential bias arising from the time sequence. The data of earlier respondents and latter respondents were compared, and no significant results between the two groups were spotted. Therefore, the non-response bias should be an ignorable issue.

4.2. Reliability and Validity Analysis

To assess the measurement model and test the reliability and validity, a confirmatory factor analysis (CFA) was performed using AMOS 24 in SPSS 22. Table 2 summarizes the results of the CFA analysis. The values of Cronbach’s Alpha (α) and composite reliabilities (CR) were higher than the recommended level of 0.70 for all proposed variables (range: 0.840–0.947 and 0.729–0.877), suggesting adequate reliability [99]. Meanwhile, the corrected item-total correlation (CITC) of all the items was over 0.6, and α would not be significantly increased by excluding items, providing further support for reliability [99].
Table 2 also shows that all items loaded over 0.70 (significant at p < 0.001) and all values of average variance extracted (AVE) were above the suggested value of 0.50 (range: 0.729–0.877), indicating adequate convergent validity. Discriminant validity is a measure of the extent to which a given item differs from those of other constructs and is demonstrated when the square roots of AVE of each construct is higher than the correlations [99]. As shown in Table 3, the square roots of the AVEs on the diagonal were higher than all correlations off the diagonal of the matrix, indicating well discriminant validity. The findings also showed that no given item had higher loading with another construct but its respective construct [100]. The results indicated that discriminant validity was further supported by all the constructs.
In addition, the results suggested that each factor exhibited a close relationship with related items, which indicated that the research constructs had a well-constructed validity. The internal validity of the data was examined with Kaiser–Meyer –Olkin (KMO) statistics and a Bartlett spherical hypothesis test [99]. The results showed that KMO = 0.943 > 0.5 and the Bartlett spherical hypothesis test was significant (p < 0.001). Therefore, the proposed model survived the reliability and validity test.

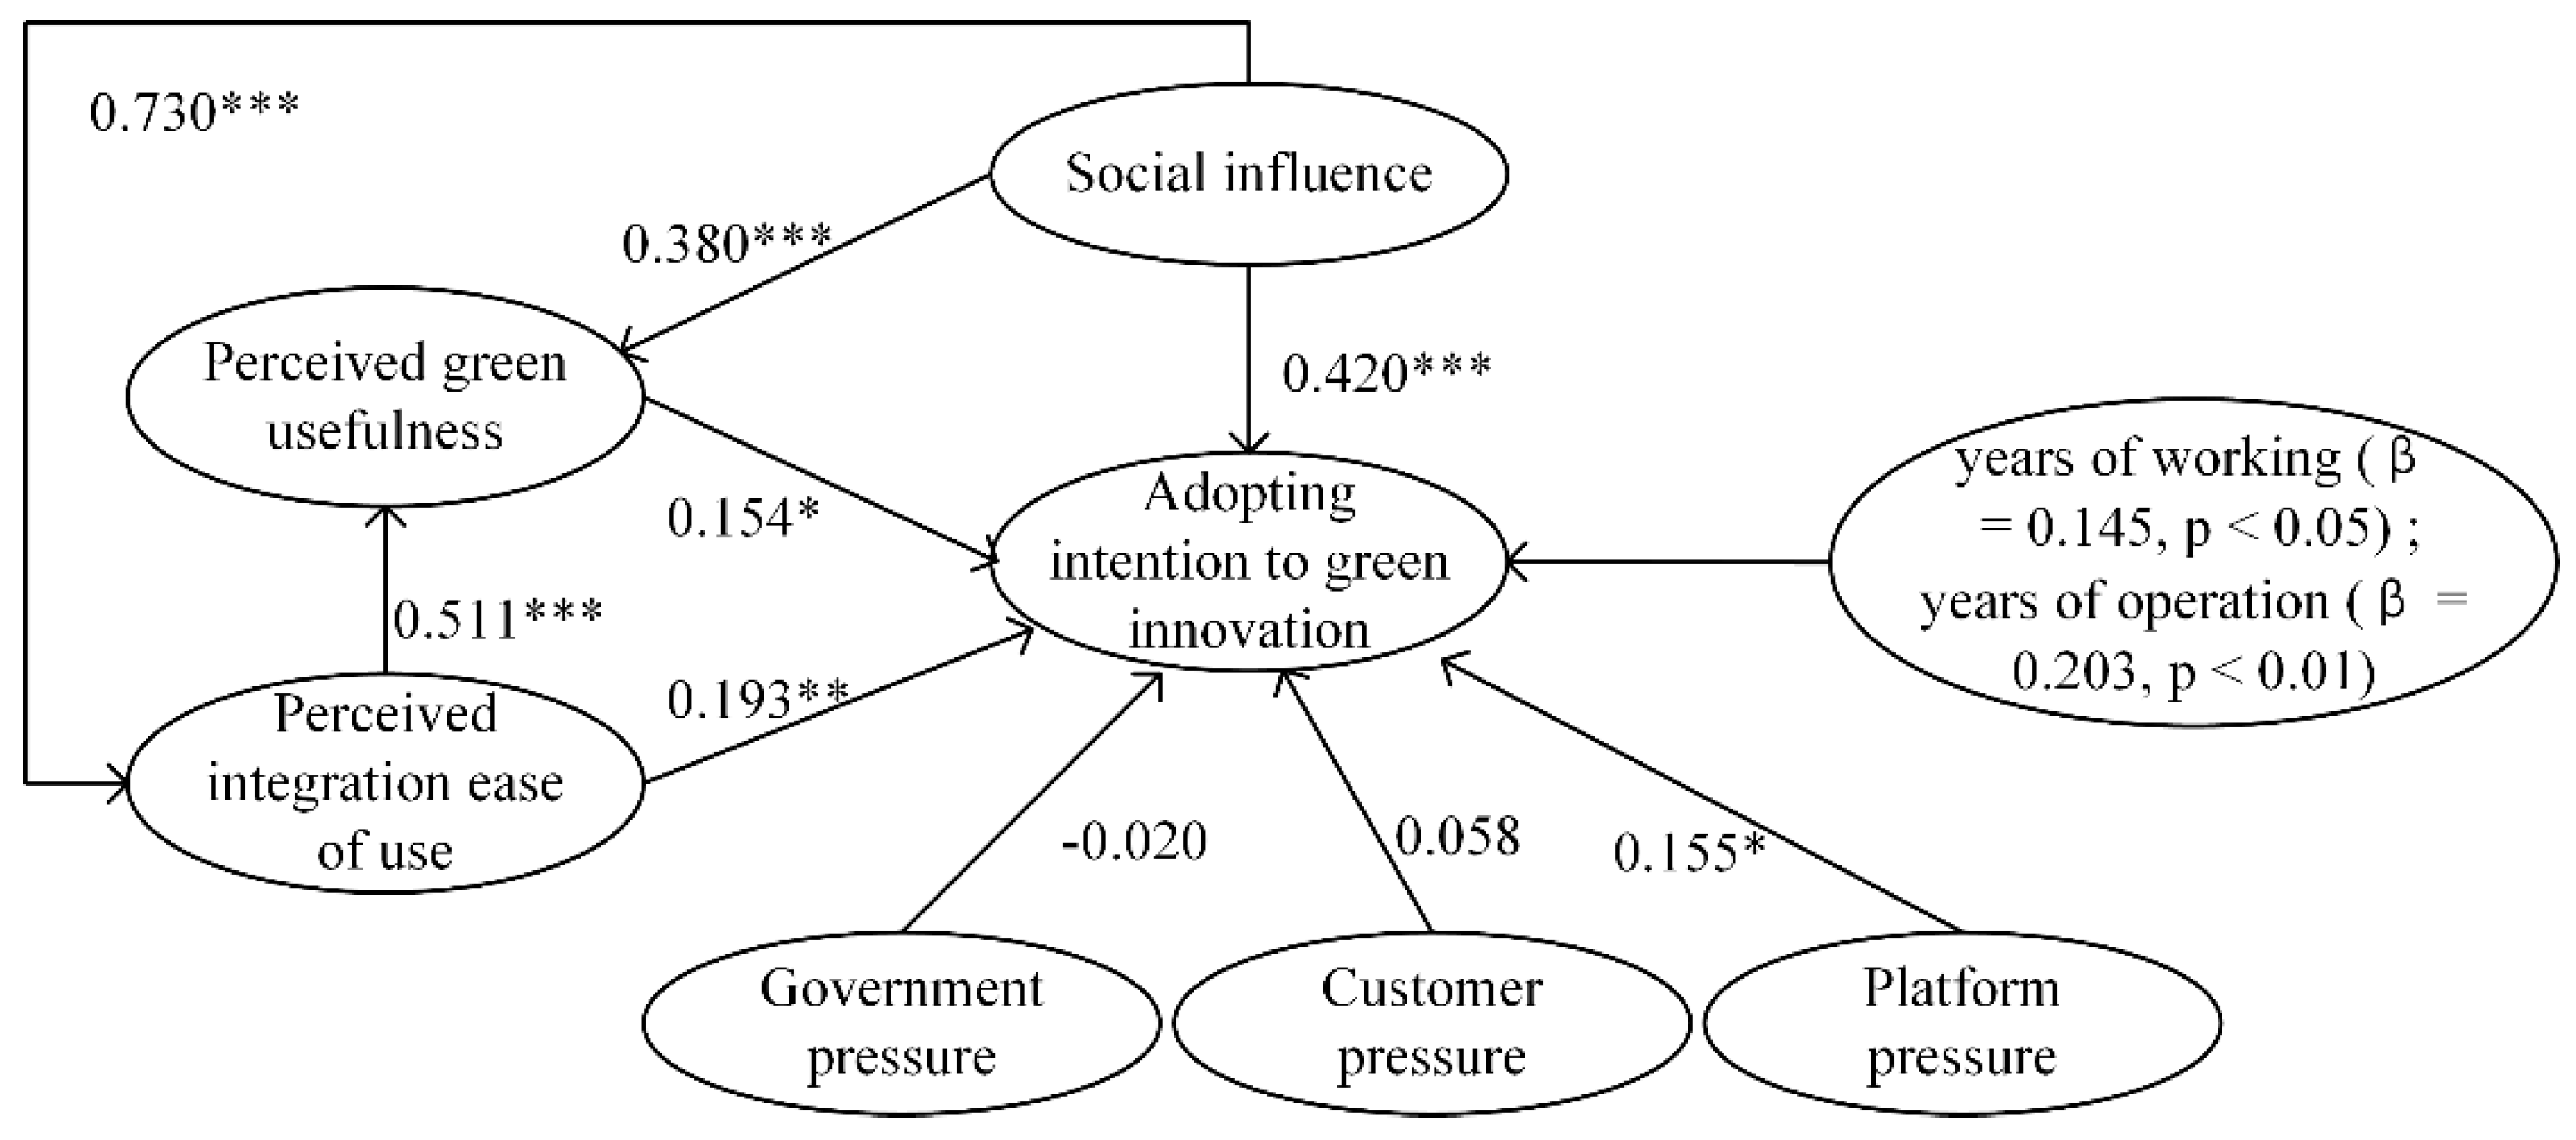
4.3. Structural Model and Hypothesis Test

The goodness of fit of the measurement model and structural model was estimated in this study, and some critical measures of goodness of fit indices were selected to evaluate the model’s performance, such as X²/df, root mean square error of approximation (RMSEA), incremental fit index (IFI), etc. [101,102]. As is shown in Table 4, all of these indices values were within the acceptable limits recommended for previous studies. Therefore, the model construct of this study satisfied the model fit.
PCU (β = 0.154; p < 0.05) and PIE (β = 0.193; p < 0.01) had a significant and positive influence on AI, providing support for H1 and H2 in our analysis. PIE positively affected PGU (β = 0.511; p < 0.001), which meant that H3 was validated. Moreover, in terms of the effects of stakeholder pressure (GP, CP, and PP), only PP had a significant and positive impact on AI (β = 0.155; p < 0.05); GP (β = −0.02; p = 0.765) and CP (β = 0.58; p = 0.326) were not significant, indicating support for H6 and rejection for H4 and H5. In addition, SI significantly and positively affected AI (β = 0.42; p < 0.001), PGU (β = 0.38; p < 0.001), and PIE (β = 0.73; p < 0.001), suggesting that H7, H8, and H9 were supported. The results of the hypothesis tests were shown in Table 5. (See Figure 2).

4.4. Mediation Effect and Control Variables Test

The proposed structural model required a mediation analysis to verify if the size of the effect of SI on the AI was influenced by multiple mediator variables, such as PGU and PIE. Thus, a PROCESS modeling technique (Model 6) proposed by Hayes (2018) [103] was utilized in this study. As this study was based on a serial multiple mediator analysis, the PROCESS technique was suitable, as it generated bootstrap confidence intervals (CI) for all indirect effects, as well as all possible pairwise comparisons between indirect effects using 5000 bootstrap samples [104].
As shown in Table 6, three indirect effect paths (SI ⇒ PGU ⇒ AI, β = 0.1541, p < 0.001; SI ⇒ PIE ⇒ AI, β = 0.0506, p < 0.001; SI ⇒ PIE ⇒ PGU ⇒ AI, β = 0.0485, p < 0.001) were positively significant. The percentile 95% CI had zero value by the 5000 bootstrapped sample approaches [105]. These findings revealed that both PGU and PIE had mediating effects on AI, while SI positively and directly influenced AI. With regards to the control variables, as other path coefficients were not significant, only the years of working (β = 0.145, p < 0.05) and years of operation (β = 0.203, p < 0.01) were found to significantly affect AI. These results suggested that the long-standing express companies had advantages in green technology and the talent retainment played an important role. In addition, the results of the variance analysis showed that there was no significant difference in the willingness of green innovation among the respondents with different jobs. Moreover, the regression analysis showed that D-W = 1.931 and the variance inflation factor (VIF) of all variables were less than 5. The results indicated that there are no collinearity or autocorrelation problems in the current model.

5. Discussions

5.1. Theoretical and Empirical Contributions

Firstly, some previous studies have investigated the pre-determinants of green innovation adoption for enterprises; however, few of them have discussed this issue from multiple theoretical views [106,107,108]. To this end, this study integrated the technology acceptance model (TAM), stakeholder theory, and rational behavior theory (RBT), and established a comprehensive model framework. This model further expands the interpretability of the three theories, implicating that the green innovation adoptions can be learned from three perspectives, such as technology characteristics, stakeholder pressure, and social influence. In addition, our research reveals the mediation effects of technology characteristics (PGU and PIE) between social influence and green innovation adoption. This result implicates that the effects of the countermeasures should be considered dynamically due to the interactions among these determinants.
Secondly, this study makes a contribution to the stakeholder theory by considering a novel factor platform pressure (PP) from the e-commerce economy, and this new factor has exhibited a significant influence on the green innovation adoptions for Chinese express companies. In contrast, the pressure from the government and customer have no significant incentive effects on the green innovation adoptions. These results are different from the manufacturing industries [32,57]. This may be mainly caused by the different properties across industries. For example, express companies are not the pivot domain for green regulations, as the influence of express companies on the environment are generally much smaller than the manufacturing enterprises [32]. In addition, the green regulations in China for the express industry are not completed [76,109]. Therefore, the government pressure is not significant. With respect to customer pressure, the free delivery policy of e-commerce platforms makes the public less concerned with the green aspects of the express services, but more concerned with the efficiency. An important revelation here is that the understanding of the drivers of green innovation needs to be contextualized.
Thirdly, due to the lack of research on green innovation in China’s express industry, this paper is conducive to the in-depth analysis of the literature on green innovation in China’s express industry. Moreover, combined with internal and external factors, this article seeks to find out what factors affect the adoption of green innovation for Chinese express companies. Some common factors will lay a certain foundation for the future research on the green innovation theory and the practice of industries and enterprises.

5.2. Practical Implications

We spot several useful practical implications for express companies based on the findings from technology characteristics and social influence. Firstly, the express companies should note the value of green innovation and be actively involved in the green practices as early as possible. Secondly, the effectiveness of green innovations should also be noticed to manage the potential risk. Thirdly, the effect of social influence cannot be ignored, as it may not be less than the financial performance. The government and social media should enhance the value of green innovation and relieve the harm of logistic pollution through advertisements.
On the other hand, the findings of this study focus on the starting phase of China’s express industries. The enterprises should have a progressive perspective on the GP and PP. From previous experience in manufacturing industries, the environmental protection awareness of the government and public would rise with the development of industries. Therefore, in the foreseeable future, the regulation and public needs may also rise for green logistics. It is also important for the enterprises to be prepared for the future trends. In addition, inspired by the large effects from PP, the government can transform their management ideas and put more regulations on the e-commerce platforms, such as binding green policies to motivate the green actions of express companies. From the view of the supply chain, the customer effects should be incorporated into the entire logistics system. Express companies should gradually guide the customer’s habits to pay for a green delivery service initiatively. This orientation can also inspire the green innovation in supply chain management.
Finally, a clearer research design of how to adopt green innovation for express companies with different business types will provide a richer perspective and practical guidance for this study. At the same time, from a supply chain perspective, proximity to final consumers is an important factor that affects the environmental behavior of express companies, which is worth exploring in the future.

6. Conclusions

As a modern service industry, express companies have non-negligible issues in energy consumption and environmental pollution in spite of the fact that they will not be directly involved in manufacturing. As the public attention on environmental protection grows, it is imperative to introduce green innovations to handle the environmental and sustainable issues of express companies. To this end, it is important to have prior knowledge of the determinants of the enterprises’ intentions to accept the green innovations before any practical implications. However, previous studies have often considered the direct influence of the determinants, while few of them have noticed the underlying structures and interactions among these determinants.
To fill the research gaps in the studies of the green innovation of the Chinese express industry, this study integrated different theories into the investigation of the influencing factors of green innovation and examined the perceptions of express companies on adopting green innovation. Results showed significant positive effects from technology characteristics (perceived green usefulness and perceived integrated ease of use) and the social influence (subjective norm and impression) on the adopting intentions of green innovation from express companies. In addition, the effects from stakeholder pressure only worked with platform pressure; the government pressure and customer pressure were not significant, which was different from the hypotheses. It was also revealed that some technology characteristics might have meditated the effects between social influence and the intentions of green innovation adoptions. Finally, it was discovered that the years of working for green participants and the years of operating for express companies were also significant with the adopted intentions of green innovations.
Based on the findings of this study, several implications were proposed:
  • Chinese express companies have generally realized the benefits of green innovations in terms of promoting the economical profits and environmental benefits. Thus, the green policies may have incentive effects on the investments of green innovations for the large amount of small and medium sized express companies in China.
  • The perceived integrated ease of use of green innovation is negatively related to the perceptions of uncertain risks from enterprises. As a higher level of PIE is beneficial to the acceptance of green practices, standardized and integrable friendly green products—e.g., e-tag and smart cabinets—should be promoted at the initial stage of green promotion.
  • Shaping the green image of enterprises is an important response to social influence, which plays an important role in gaining the support of consumers and improving the competitiveness of enterprises.
  • The prominent role of platform pressure (the only significant factor in adopting intention) may inspire the government to develop bundled policies from a supply chain aspect—e.g., giving incentives to the e-commerce platforms for green practices so as to encourage the platforms to force their cooperative carriers to use green products.
To sum up, the findings of this study not only provided a solid theoretical basis for further investigating the motivation of the express companies for adopting green innovation, but also presented many recommendations on the practical implications in green innovation practices.
However, several limitations of the current research and the future research needs should also be noted:
Firstly, this paper only considered the antecedents of green innovation from a combination of acceptance and behavioral theories. Future research needs to introduce different theories—e.g., the network embedding theory—for exploring the influencing factors of the green innovation’s adoption.
Secondly, current research only considers the external influencing factors of green innovation, but ignores the internal factors, such as resources and capabilities, human capital, organizational support, etc. Therefore, more determinants need to be considered to clarify the internal motivation and explore the integrated effects of external and internal factors on green innovation adoptions.
Thirdly, this study only investigated the chain mediating effect of technical characteristics, and future research should examine the potential mediating effects or moderating effects between different factors and clean up the process of green innovation behavior.
Fourthly, this paper is a static study using cross-sectional data, which is difficult when reflecting the dynamic change of the green innovation characteristics of express companies in different stages, and future research will take panel data or a longitudinal analysis into consideration.
Finally, the respondents in this study may present the demographic characteristics of express companies. However, more abundant sample sources in the evaluation will help to improve the reliability and generalizability of the research conclusions. In future studies, more heterogenous elements, such as cultural difference, should be integrated in the prediction model.

Author Contributions

Conceptualization, H.Z.; methodology, H.Z. and X.S.; software, H.Z.; validation, H.Z. and X.S.; formal analysis, H.Z.; investigation, H.Z.; resources, H.Z. and J.H.; data curation, H.Z.; writing—original draft preparation, H.Z. and X.S.; writing—review and editing, X.S. and J.B.; visualization, H.Z. and J.B.; supervision, J.H. and X.S.; project administration, H.Z.; funding acquisition, H.Z. Q.H. and S.X. All authors have read and agreed to the published version of the manuscript.

Funding

This research is supported by the National Natural Science Foundation of China (71874067 & 51778141), the “Six Industry Talent Peak Project” fund of Jiangsu Province (RJFW-049 & JNHB-115), the “Green and Blue Project” fund of Jiangsu Province (2017SJB1641), the Philosophy and Social Science fund for colleges in Jiangsu Province (2017SJB1641 & 2018SJA1649), the Natural Science Fund for Colleges in Jiangsu Province (17KJB58001), the fund of Huaian Vocational College of Information Technology (HXYC2017003), and the Ministry of education of Humanities and Social Science Project (19YJA790070).

Acknowledgments

The authors would like to thank the government agencies and logistic enterprises for their assistance and engagement in the survey.

Conflicts of Interest

The authors declare no conflict of interest.

Appendix A. The Details of the Survey

Table A1. The details of the survey.
VariableIndexMeasuring ItemReference
Perceive green usefulnessPGU1Green innovation can bring better economic and environmental performance to express companies[36,38,39]
PGU2Green innovation can significantly reduce the environmental pollution of express companies
PGU3Green innovation can bring better competitive advantage and social image to express companies
Perceived integration ease of usePIE1Green innovation is easy to use[32,38,54]
PIE2Green innovation is easy to integrate into existing systems
Government pressureGP1Express companies feel pressure from the government’s environmental policies[23,32,37]
GP2Express companies that do not comply with environmental regulations will be punished
Customer pressureCP1Customers require us to improve environmental performance[23,32,37]
CP2Customers pay more attention to the environmental protection of operational process
CP3Express companies feel pressure from customers to provide green services
Platform pressurePP1Express companies feel pressure from the e-commerce platform’s environmental requirements-
PP2The collaborative e-commerce platforms call for us to provide green service
PP3The e-commerce platform will reduce the business volume for non-environmental express companies
Social influenceSI1People who focus on green innovation are more fashionable[34,81,86]
SI2People who apply green innovation are loyal environmentalists
SI3My colleagues support green innovation
SI4My leaders feel that green innovation is important
Adopting intentionAI1We are willing to adopt green innovation in our work[38,39,79]
AI2We recommend that partners adopt green innovation
AI3We are likely to adopt green innovation in the future

References

  1. Bernauer, T.; Stéphanie Engels, D.; Seijas, K.; Seijas, J. Explaining Green Innovation—Ten Years after Porter’s Win-Win Proposition: How to Study the Effects of Regulation on Corporate Environmental Innovation? Politische Vierteljahresschrift 2007, 39, 323–341. [Google Scholar]
  2. Chiou, T.-Y.; Chan, H.K.; Lettice, F.; Chung, S.H. The influence of greening the suppliers and green innovation on environmental performance and competitive advantage in Taiwan. Transp. Res. Part E Logist. Transp. Rev. 2011, 47, 822–836. [Google Scholar] [CrossRef]
  3. Yin, J.; Gong, L.; Wang, S. Large-scale assessment of global green innovation research trends from 1981 to 2016: A bibliometric study. J. Clean. Prod. 2018, 197, 827–841. [Google Scholar] [CrossRef]
  4. Rossi, S.; Colicchia, C.; Cozzolino, A.; Christopher, M. The logistics service providers in eco-efficiency innovation: An empirical study. Supply Chain Manag. Int. J. 2013, 18, 583–603. [Google Scholar] [CrossRef] [Green Version]
  5. Huang, X.; Hu, Z.; Liu, C.; Yu, D.; Yu, L. The relationships between regulatory and customer pressure, green organizational responses, and green innovation performance. J. Clean. Prod. 2016, 112, 3423–3433. [Google Scholar] [CrossRef]
  6. Du, K.; Li, J. Towards a green world: How do green technology innovations affect total-factor carbon productivity. Energy Policy 2019, 131, 240–250. [Google Scholar] [CrossRef]
  7. Abdullah, M.; Zailani, S.; Iranmanesh, M.; Jayaraman, K. Barriers to green innovation initiatives among manufacturers: The Malaysian case. Rev. Manag. Sci. 2016, 10, 683–709. [Google Scholar] [CrossRef]
  8. Baldwin, J.; Lin, Z. Impediments to advanced technology adoption for Canadian manufacturers. Res. Policy 2002, 31, 1–18. [Google Scholar] [CrossRef]
  9. Kammerer, D. The effects of customer benefit and regulation on environmental product innovation. Empirical evidence from appliance manufacturers in Germany. Ecol. Econ. 2009, 68, 2285–2295. [Google Scholar] [CrossRef]
  10. Wong, S.K.S. Environmental requirements, knowledge sharing and green innovation: Empirical evidence from the electronics industry in China. Bus. Strategy Environ. 2013, 22, 321–338. [Google Scholar] [CrossRef]
  11. Chou, C.J.; Chen, K.S.; Wang, Y.Y. Green practices in the restaurant industry from an innovation adoption perspective: Evidence from Taiwan. Int. J. Hosp. Manag. 2012, 31, 703–711. [Google Scholar] [CrossRef]
  12. Dai, Y.; Gao, H.O. Energy consumption in China’s logistics industry: A decomposition analysis using the LMDI approach. Transp. Res. Part D Transp. Environ. 2016, 46, 69–80. [Google Scholar] [CrossRef]
  13. Solís, J.C.; Sheinbaum, C. Energy consumption and greenhouse gas emission trends in Mexican road transport. Energy Sustain. Dev. 2013, 17, 280–287. [Google Scholar] [CrossRef]
  14. Bastani, P.; Heywood, J.B.; Hope, C. The effect of uncertainty on US transport-related GHG emissions and fuel consumption out to 2050. Transp. Res. Part A Policy Pract. 2012, 46, 517–548. [Google Scholar] [CrossRef]
  15. Bueno, G. Analysis of scenarios for the reduction of energy consumption and GHG emissions in transport in the Basque Country. Renew. Sustain. Energy Rev. 2012, 16, 1988–1998. [Google Scholar] [CrossRef]
  16. He, M.; Shen, J.; Wu, X.; Luo, J. Logistics Space: A Literature Review from the Sustainability Perspective. Sustainability 2018, 10, 2815. [Google Scholar] [CrossRef] [Green Version]
  17. SPBPRC State Post Bureau of the People’s Republic of China. Available online: http://www.spb.gov.cn/xw/dtxx_15079/202001/t20200106_2000289.html (accessed on 06 January 2020).
  18. Giuliano, G.; O’Brien, T.; Dablanc, L.; Holliday, K. Synthesis of Freight Research in Urban Transportation Planning; Transportation Research Board: Washington, DC, USA, 2013. [Google Scholar]
  19. Yuan, Q. Planning Matters: Institutional Perspectives on Warehousing Development and Mitigating Its Negative Impacts. J. Am. Plan. Assoc. 2019, 85, 525–543. [Google Scholar] [CrossRef]
  20. Zhang, N.; Wei, X. Dynamic total factor carbon emissions performance changes in the Chinese transportation industry. Appl. Energy 2015, 146, 409–420. [Google Scholar] [CrossRef]
  21. Baumgartner, M.; Léonardi, J.; Krusch, O. Improving computerized routing and scheduling and vehicle telematics: A qualitative survey. Transp. Res. Part D Transp. Environ. 2008, 13, 377–382. [Google Scholar] [CrossRef]
  22. Roumboutsos, A.; Kapros, S.; Vanelslander, T. Green city logistics: Systems of Innovation to assess the potential of E-vehicles. Res. Transp. Bus. Manag. 2014, 11, 43–52. [Google Scholar] [CrossRef]
  23. Zailani, S.; Iranmanesh, M.; Nikbin, D.; Jumadi, H.B. Determinants and environmental outcome of green technology innovation adoption in the transportation industry in Malaysia. Asian J. Technol. Innov. 2014, 22, 286–301. [Google Scholar] [CrossRef]
  24. Zhu, Q.; Dou, Y.; Sarkis, J. A portfolio-based analysis for green supplier management using the analytical network process. Supply Chain Manag. 2010, 15, 306–319. [Google Scholar] [CrossRef]
  25. Subramanian, N.; Abdulrahman, M.D.; Zhou, X. Integration of logistics and cloud computing service providers: Cost and green benefits in the Chinese context. Transp. Res. Part E Logist. Transp. Rev. 2014, 70, 86–98. [Google Scholar] [CrossRef]
  26. Porter, M.E. America’s green strategy. Sci. Am. 1991, 264, 168. [Google Scholar] [CrossRef]
  27. Rennings, K. Redefining innovation—Eco-innovation research and the contribution from ecological economics. Ecol. Econ. 2000, 32, 319–332. [Google Scholar] [CrossRef]
  28. Horbach, J. Determinants of environmental innovation—New evidence from German panel data sources. Res. Policy 2008, 37, 163–173. [Google Scholar] [CrossRef] [Green Version]
  29. Rexhäuser, S.; Rammer, C. Environmental Innovations and Firm Profitability: Unmasking the Porter Hypothesis. Environ. Resour. Econ. 2014, 57, 145–167. [Google Scholar] [CrossRef]
  30. Zhang, Y.; Thompson, R.G.; Bao, X.; Jiang, Y. Analyzing the Promoting Factors for Adopting Green Logistics Practices: A Case Study of Road Freight Industry in Nanjing, China. Procedia Soc. Behav. Sci. 2014, 124, 432–444. [Google Scholar] [CrossRef] [Green Version]
  31. Lin, C.Y.; Ho, Y.H. An empirical study on logistics service providers’ intention to adopt green innovations. J. Technol. Manag. Innov. 2008, 3, 17–26. [Google Scholar]
  32. Lin, C.Y.; Ho, Y.H. Determinants of Green Practice Adoption for Logistics Companies in China. J. Bus. Ethics 2011, 98, 67–83. [Google Scholar] [CrossRef]
  33. Ho, Y.; Lin, C. An Empirical Study on Taiwanese Logistics Companies ’ Attitudes toward Environmental Management Practices. Adv. Manag. Appl. Econ. 2012, 2, 223–241. [Google Scholar]
  34. Jou, R.C.; Chiou, Y.C.; Ke, J.C. Impacts of impression changes on freeway driver intention to adopt electronic toll collection service. Transp. Res. Part C Emergy Technol. 2011, 19, 945–956. [Google Scholar] [CrossRef]
  35. Trusov, M.; Bucklin, R.E.; Pauwels, K. Effects of word-of-mouth versus traditional marketing: Findings from an internet social networking site. J. Mark. 2009, 73, 90–102. [Google Scholar] [CrossRef] [Green Version]
  36. Chen, S.-Y. Using the sustainable modified TAM and TPB to analyze the effects of perceived green value on loyalty to a public bike system. Transp. Res. Part A Policy Pract. 2016, 88, 58–72. [Google Scholar] [CrossRef]
  37. Weng, H.H.R.; Chen, J.S.; Chen, P.C. Effects of green innovation on environmental and corporate performance: A stakeholder perspective. Sustainability 2015, 7, 4997–5027. [Google Scholar] [CrossRef] [Green Version]
  38. Davis, F.D. Perceived usefulness, perceived ease of use, and user acceptance of information technology. MIS Q. 1989, 13, 319. [Google Scholar] [CrossRef] [Green Version]
  39. Davis, F.D.; Bagozzi, R.P.; Warshaw, P.R. User Acceptance of Computer Technology: A Comparison of Two Theoretical Models. Manag. Sci. 1989, 35, 982–1003. [Google Scholar] [CrossRef] [Green Version]
  40. Ajzen, I. The theory of planned behavior. Organ. Behav. Hum. Decis. Process. 1991, 50, 179–211. [Google Scholar] [CrossRef]
  41. Hill, R.J.; Fishbein, M.; Ajzen, I. Belief, Attitude, Intention and Behavior: An Introduction to Theory and Research; Addison-Wesley: Reading, MA, USA, 1977. [Google Scholar]
  42. Davis, F.D.; Venkatesh, V. A critical assessment of potential measurement biases in the technology acceptance model: Three experiments. Int. J. Hum. Comput. Stud. 1996, 45, 19–45. [Google Scholar] [CrossRef] [Green Version]
  43. Koller, M.; Floh, A.; Zauner, A. Further insights into perceived value and consumer loyalty: A “Green” perspective. Psychol. Mark. 2011, 28, 1154–1176. [Google Scholar] [CrossRef]
  44. Der Chen, C.-D.; Fan, Y.-W.W.; Farn, C.-K.K. Predicting electronic toll collection service adoption: An integration of the technology acceptance model and the theory of planned behavior. Transp. Res. Part C Emergy Technol. 2007, 15, 300–311. [Google Scholar] [CrossRef]
  45. Chen, Z.; Chen, G.-H. The influence of green technology cognition in adoption behavior: On the consideration of green innovation policy perception’s moderating effect. J. Discret. Math. Sci. Cryptogr. 2017, 20, 1551–1559. [Google Scholar] [CrossRef]
  46. Frambach, R.T.; Schillewaert, N. Organizational innovation adoption: A multi-level framework of determinants and opportunities for future research. J. Bus. Res. 2002, 55, 163–176. [Google Scholar] [CrossRef]
  47. Esty, D.C.; Winston, A.S. Green to Gold: How Smart Companies Use Environmental Strategy to Innovate, Create Value, and Build Competitive Advantage; Yale University Press: New Haven, CT, USA, 2006. [Google Scholar]
  48. Porter, M.E.; van der Linde, C. Toward a New Conception of the Environment-Competitiveness Relationship. J. Econ. Perspect. 1995, 9, 97–118. [Google Scholar] [CrossRef]
  49. Gatignon, H.; Robertson, T.S. Technology Diffusion: An Empirical Test of Competitive Effects. J. Mark. 1989, 53, 35–49. [Google Scholar] [CrossRef]
  50. Etzion, D. Research on Organizations and the Natural Environment, 1992-Present: A Review. J. Manag. 2007, 33, 637–664. [Google Scholar] [CrossRef] [Green Version]
  51. Del Río González, P. Analysing the factors influencing clean technology adoption: A study of the Spanish pulp and paper industry. Bus. Strategy Environ. 2005, 14, 20–37. [Google Scholar] [CrossRef]
  52. Yahya, N.; Nair, R.S.; Piaralal, S.K. Green Practices Adoption Framework for Small and Medium Sized Logistics Firms in Malaysia. Sains Humanika 2014, 2, 79–84. [Google Scholar]
  53. Dupuy, D. Technological Change and Environmental Policy: The Diffusion of Environmental Technology. Growth Chang. 1997, 28, 49–66. [Google Scholar] [CrossRef]
  54. Tornatzky, L.G.; Klein, K.J. Innovation characteristics and innovation adoption-implementation: A meta-analysis of findings. IEEE Trans. Eng. Manag. 1982, 29, 28–45. [Google Scholar] [CrossRef]
  55. Jeyaraj, A.; Rottman, J.W.; Lacity, M.C. A Review of the Predictors, Linkages, and Biases in IT Innovation Adoption Research. J. Inf. Technol. 2006, 21, 1–23. [Google Scholar] [CrossRef]
  56. Tseng, M.-L.; Wang, R.; Chiu, A.S.F.; Geng, Y.; Lin, Y.H. Improving performance of green innovation practices under uncertainty. J. Clean. Prod. 2013, 40, 71–82. [Google Scholar] [CrossRef]
  57. Berrone, P.; Fosfuri, A.; Gelabert, L.; Gomez-Mejia, L.R. Necessity as the mother of ‘green’ inventions: Institutional pressures and environmental innovations. Strategy Manag. J. 2013, 34, 891–909. [Google Scholar] [CrossRef]
  58. Lai, K.; Wong, C.W.Y. Green logistics management and performance: Some empirical evidence from Chinese manufacturing exporters. Omega 2012, 40, 267–282. [Google Scholar] [CrossRef]
  59. Bansal, P.; Roth, K. Why companies go green: A model of ecological responsiveness. Acad. Manag. J. 2000, 43, 717–736. [Google Scholar]
  60. Buysse, K.; Verbeke, A. Proactive environmental strategies: A stakeholder management perspective. Strategy Manag. J. 2003, 24, 453–470. [Google Scholar] [CrossRef]
  61. Murillo-Luna, J.L.; Garcés-Ayerbe, C.; Rivera-Torres, P. Why do patterns of environmental response differ? A stakeholders’ pressure approach. Strategy Manag. J. 2008, 29, 1225–1240. [Google Scholar] [CrossRef]
  62. Sarkis, J.; Gonzalez-Torre, P.; Adenso-Diaz, B. Stakeholder pressure and the adoption of environmental practices: The mediating effect of training. J. Oper. Manag. 2010, 28, 163–176. [Google Scholar] [CrossRef]
  63. Guoyou, Q.; Saixing, Z.; Chiming, T.; Haitao, Y.; Hailiang, Z. Stakeholders’ Influences on Corporate Green Innovation Strategy: A Case Study of Manufacturing Firms in China. Corp. Soc. Responsib. Environ. Manag. 2013, 20, 1–14. [Google Scholar] [CrossRef]
  64. Pujari, D. Eco-innovation and new product development: Understanding the influences on market performance. Technovation 2006, 26, 76–85. [Google Scholar] [CrossRef]
  65. BACKER, L. Engaging Stakeholders in Corporate Environmental Governance. Bus. Soc. Rev. 2007, 112, 29–54. [Google Scholar] [CrossRef]
  66. Zhu, Q.; Sarkis, J. The moderating effects of institutional pressures on emergent green supply chain practices and performance. Int. J. Prod. Res. 2007, 45, 4333–4355. [Google Scholar] [CrossRef]
  67. Petts, J.; Herd, A.; Gerrard, S.; Horne, C. The climate and culture of environmental compliance within SMEs. Bus. Strategy Environ. 1999, 8, 14–30. [Google Scholar] [CrossRef]
  68. Freeman, R.E. Strategic Management: A Stakeholder Approach; Pitman: Boston, MA, USA, 2015. [Google Scholar]
  69. Qi, G.Y.; Shen, L.Y.; Zeng, S.X.; Jorge, O.J. The drivers for contractors’ green innovation: An industry perspective. J. Clean. Prod. 2010, 18, 1358–1365. [Google Scholar] [CrossRef]
  70. Zhu, Q.; Sarkis, J. Relationships between operational practices and performance among early adopters of green supply chain management practices in Chinese manufacturing enterprises. J. Oper. Manag. 2004, 22, 265–289. [Google Scholar] [CrossRef]
  71. Zhu, Q.; Sarkis, J.; Geng, Y. Green supply chain management in China: Pressures, practices and performance. Int. J. Oper. Prod. Manag. 2005, 25, 449–468. [Google Scholar] [CrossRef]
  72. González-Benito, J.; González-Benito, Ó. A review of determinant factors of environmental proactivity. Bus. Strategy Environ. 2006, 15, 87–102. [Google Scholar] [CrossRef]
  73. Lee, S.Y. Drivers for the participation of small and medium-sized suppliers in green supply chain initiatives. Supply Chain Manag. 2008, 13, 185–198. [Google Scholar] [CrossRef]
  74. Lin, C.-Y. A Review of Research on Environmental Issues in the Logistics Industry. Inf. Manag. Bus. Rev. 2011, 3, 19–26. [Google Scholar] [CrossRef] [Green Version]
  75. Centobelli, P.; Cerchione, R.; Esposito, E. Environmental sustainability in the service industry of transportation and logistics service providers: Systematic literature review and research directions. Transp. Res. Part D Transp. Environ. 2017, 53, 454–470. [Google Scholar] [CrossRef]
  76. Gong, Y.; Chen, L.; Jia, F.; Wilding, R. Logistics Innovation in China: The Lens of Chinese Daoism. Sustainability 2019, 11, 545. [Google Scholar] [CrossRef] [Green Version]
  77. Guler, I.; Guillén, M.F.; Macpherson, J.M.; Guillen, M.F. Global Competition, Institutions, and the Diffusion of Organizational Practices: The International Spread of ISO 9000 Quality Certificates. Adm. Sci. Q. 2002, 47, 207–232. [Google Scholar] [CrossRef] [Green Version]
  78. Welch, E.W.; Mori, Y.; Aoyagi-Usui, M. Voluntary adoption of ISO 14001 in Japan: Mechanisms, stages and effects. Bus. Strategy Environ. 2002, 11, 43–62. [Google Scholar] [CrossRef]
  79. Venkatesh, V.; Morris, M.G.; Davis, G.B.; Davis, F.D. Davis User acceptance of information technology: Toward a unified view. MIS Q. 2003, 27, 425. [Google Scholar] [CrossRef] [Green Version]
  80. Venkatesh, V.; Bala, H. Technology acceptance model 3 and a research agenda on interventions. Decis. Sci. 2008, 39, 273–315. [Google Scholar] [CrossRef] [Green Version]
  81. Lu, J.; Yao, J.E.; Yu, C.S. Personal innovativeness, social influences and adoption of wireless Internet services via mobile technology. J. Strategy Inf. Syst. 2005, 14, 245–268. [Google Scholar] [CrossRef]
  82. Wang, N.; Sun, Y. Social influence or personal preference? Examining the determinants of usage intention across social media with different sociability. Inf. Dev. 2016. [Google Scholar] [CrossRef]
  83. Tsai, H.T.; Bagozzi, R.P. Contribution behavior in virtual communities: Cognitive, emotional, and social influences. MIS Q. Manag. Inf. Syst. 2014, 38. [Google Scholar] [CrossRef]
  84. Manchanda, P.; Xie, Y.; Youn, N. The role of targeted communication and contagion in product adoption. Mark. Sci. 2008, 27, 961–976. [Google Scholar] [CrossRef]
  85. Cordano, M.; Frieze, I.H. Pollution reduction preferences of U.S. environmental managers: Applying ajzen’s theory of planned behavior. Acad. Manag. J. 2000, 43, 627–641. [Google Scholar]
  86. Yang, S.; Lu, Y.; Gupta, S.; Cao, Y.; Zhang, R. Mobile payment services adoption across time: An empirical study of the effects of behavioral beliefs, social influences, and personal traits. Comput. Hum. Behav. 2012, 28, 129–142. [Google Scholar] [CrossRef]
  87. Likert, R. A Technique for the Measurement of Attitudes; The Science Press: New York, NY, USA, 1932. [Google Scholar]
  88. Shi, X.; Ye, Z.; Shiwakoti, N.; Li, H. Passengers’ perceptions of security check in metro stations. Sustainanility 2019, 11, 2930. [Google Scholar] [CrossRef] [Green Version]
  89. Cong, H.; Shi, X.; Cooper, J.; Ye, Z.; Suo, Z.; Zhao, X.; Ye, Z.; Chen, C. Road rage in China: An exploratory study. J. Transp. Saf. Secur. 2019, 1–22. [Google Scholar] [CrossRef]
  90. Lin, Y.-H.H.; Chen, Y.-S.S. Determinants of green competitive advantage: The roles of green knowledge sharing, green dynamic capabilities, and green service innovation. Qual. Quant. 2017, 51, 1663–1685. [Google Scholar] [CrossRef]
  91. Chiou, Y.C.; Jou, R.C.; Kao, C.Y.; Fu, C. The adoption behaviours of freeway electronic toll collection: A latent class modelling approach. Transp. Res. Part E Logist. Transp. Rev. 2013, 49, 266–280. [Google Scholar] [CrossRef]
  92. Chang, C.-H. The Influence of Corporate Environmental Ethics on Competitive Advantage: The Mediation Role of Green Innovation. J. Bus. Ethics 2011, 104, 361–370. [Google Scholar] [CrossRef]
  93. Su, C.-T.; Parham, L.D. Generating a Valid Questionnaire Translation for Cross-Cultural Use. Am. J. Occup. Ther. 2002, 56, 581–585. [Google Scholar] [CrossRef] [Green Version]
  94. Beijing Jiaotong University; Alibaba Research Institute; Cainiao Network. Research Report of National Socialized E-Commerce Logistics Practitioners; Cainiao Network: Hangzhou, China, 2016. [Google Scholar]
  95. Kline, R.B. Principles and Practice of Structural Equation Modelling, 4th ed.; The Guilford Press: New York, NY, USA, 2015. [Google Scholar]
  96. Podsakoff, P.M.; Organ, D.W. Self-Reports in Organizational Research: Problems and Prospects. J. Manag. 1986. [Google Scholar] [CrossRef]
  97. Podsakoff, P.M.; MacKenzie, S.B.; Lee, J.Y.; Podsakoff, N.P. Common Method Biases in Behavioral Research: A Critical Review of the Literature and Recommended Remedies. J. Appl. Psychol. 2003, 88, 879. [Google Scholar] [CrossRef]
  98. Armstrong, J.S.; Overton, T.S. Estimating Nonresponse Bias in Mail Surveys. J. Mark. Res. 1977, 14, 396. [Google Scholar] [CrossRef] [Green Version]
  99. Nunnally, J.C. Phychometric Theory; McGraw-Hill: New York, NY, USA, 1978. [Google Scholar]
  100. Hulland, J. Use of partial least squares (PLS) in strategic management research: A review of four recent studies. Strategy Manag. J. 1999, 20, 195–204. [Google Scholar] [CrossRef]
  101. Anderson, J.C.; Gerbing, D.W. Structural Equation Modeling in Practice: A Review and Recommended Two-Step Approach. Psychol. Bull. 1988, 103, 411–423. [Google Scholar] [CrossRef]
  102. Hu, L.; Bentler, P.M. Fit indices in covariance structure modeling: Sensitivity to underparameterized model misspecification. Psychol. Methods 1998, 3, 424–453. [Google Scholar] [CrossRef]
  103. Hayes, A.F. Introduction to Mediation, Moderation, and Conditional Process Analysis, Second Edition: A Regression-Based Approach; The Guilford Press: New York, NY, USA, 2018. [Google Scholar]
  104. Lee, B.C. The effect of gamification on psychological and behavioral outcomes: Implications for cruise tourism destinations. Sustainability 2019, 11, 3002. [Google Scholar] [CrossRef] [Green Version]
  105. Ortega-Jimenez, C.H.; Garrido-Vega, P.; Cruz Torres, C.A. Achieving plant responsiveness from reconfigurable technology: Intervening role of SCM. Int. J. Prod. Econ. 2020, 219, 195–203. [Google Scholar] [CrossRef]
  106. Zailani, S.; Govindan, K.; Iranmanesh, M.; Shaharudin, M.R.; Sia Chong, Y. Green innovation adoption in automotive supply chain: The Malaysian case. J. Clean. Prod. 2015, 108, 1115–1122. [Google Scholar] [CrossRef]
  107. Schiederig, T.; Tietze, F.; Herstatt, C. Green innovation in technology and innovation management—An exploratory literature review. R D Manag. 2012, 42, 180–192. [Google Scholar] [CrossRef]
  108. Shi, Q.; Lai, X. Identifying the underpin of green and low carbon technology innovation research: A literature review from 1994 to 2010. Technol. Forecast. Soc. Chang. 2013, 80, 839–864. [Google Scholar] [CrossRef]
  109. Cui, L.; Ivan Su, S.-I. Susanne Hertz Logistics Innovation in China. Transp. J. 2012, 51, 98. [Google Scholar]
Figure 1. Theoretical framework.
Sustainability 12 02891 g001
Figure 2. The results of the SEM. Note: X: independent variable; Y: dependent variable; →: the path influence relationship; S.E.: standard error; *: significant at p < 0.05 level; **significant at p < 0.01 level; ***significant at p < 0.001 level.
Sustainability 12 02891 g002
Table 1. Respondents’ demographic characteristics and enterprise properties.
VariableGroupFrequencyPercentage (%)
Demographic characteristics
GenderMale19067.4
Female9232.6
EducationHigh school graduate and below7526.6
Junior college7827.7
Bachelor degree9132.3
Master/Doctoral degree3813.4
Years of workingLess than 1248.50
1–412845.4
5–98229.1
10 or more4817.0
PositionSenior manager4616.3
Middle manager7325.9
Ordinary employee16357.8
Enterprise properties
Ownership typestate-owned8931.6
foreign-owned3211.3
private-owned16157.1
Years of operationLess than 3176.00
3–75218.4
8–159333.0
Sum282100
Table 2. The results of the confirmatory factor analysis (CFA) (N = 282).
VariablesItemStd. Factor Loading *AVECRCronbach’s α
PGUPGU10.8120.7440.8970.897
PGU20.898
PGU30.880
PIEPIE10.9290.8770.9340.934
PIE20.945
GPGP10.8500.7290.8430.840
GP20.857
CPCP10.7500.7530.9010.896
CP20.950
CP30.902
PPPP10.8420.7970.9210.919
PP20.885
PP30.948
SISI10.8970.8100.9440.943
SI20.892
SI30.911
SI40.896
AIAI10.9140.8630.9500.947
AI20.970
AI30.902
Note: AVE—average variance extracted; CR—composite reliability; * —all item loadings are significant at p < 0.001 level.
Table 3. Correlations and the square roots of AVEs.
MeanS.D.PGUPIEGPCPPPSIAI
PGU4.3510.8660.863
PIE4.3650.8670.7220.936
GP4.1260.9730.5380.5400.854
CP4.0530.9960.7020.6950.4860.868
PP4.0140.9620.6170.6240.7050.6370.892
SI4.0940.9510.6680.6560.6170.7090.7740.900
AI4.2800.8520.6940.7150.5740.7070.7130.7910.929
Note: The squared root of AVE is shown on the diagonal of each matrix in bold; inter-construct correlation is shown off the diagonal.
Table 4. Measures of goodness of fit for the structural equation model (SEM).
Goodness of Fit IndexX²/dfRMSEAIFINFINNFI
Recommended limit<3<0.10>0.9>0.9>0.9
Measurement model2.2870.0680.9680.9450.959
Structural model2.6930.0770.9560.9320.946
Table 5. Results of hypothesis testing.
HypothesisXYS.E.p ValueStd. CoefficientSupport
H1PGUAI0.072*0.154Yes
H2PIEAI0.064**0.193Yes
H3PIEPGU0.066***0.511Yes
H4GPAI0.0650.765−0.020No
H5CPAI0.0560.3260.058No
H6PPAI0.071*0.155Yes
H7SIAI0.094***0.420Yes
H8SIPGU0.060***0.380Yes
H9SIPIE0.048***0.730Yes
Note: X: independent variable; Y: dependent variable; →: the path influence relationship; S.E.: standard error; *: significant at p < 0.05 level; **significant at p < 0.01 level; ***significant at p < 0.001 level.
Table 6. Indirect effects of social influence on adopting intention of green innovation.
PathEffectBoot SEBootLLCIBootULCI
Total0.25320.04530.17040.3448
SI ⇒ PGU ⇒ AI0.15410.04370.06880.2401
SI ⇒ PIE ⇒ AI0.05060.02460.01320.1083
SI ⇒ PIE ⇒ PGU ⇒ AI0.04850.02010.01600.0947
Note: 95% bootstrap confidence. Number of bootstrap samples for percentile bootstrap confidence intervals: 5000.

