Article

Still Green at Fifteen? Investigating Environmental Awareness of the PISA 2015 Population: Cross-National Differences and Correlates

by
Marit Kristine List
1,*,
Fabian T. C. Schmidt
2,
Daria Mundt
3 and
Dennis Föste-Eggers
4
1
DIPF | Leibniz Institute for Research and Information in Education, 60323 Frankfurt a. M., Germany
2
Faculty of Education, University of Hamburg, 20146 Hamburg, Germany
3
Institute of Psychology, University of Kassel, 34127 Kassel, Germany
4
German Centre for Higher Education Research and Science Studies, 30159 Hanover, Germany
*
Author to whom correspondence should be addressed.
Sustainability 2020, 12(7), 2985; https://doi.org/10.3390/su12072985
Submission received: 29 February 2020 / Revised: 24 March 2020 / Accepted: 4 April 2020 / Published: 8 April 2020
(This article belongs to the Special Issue Education and Sustainable Development)

Abstract

:
The PISA studies provide unique opportunities to investigate the competencies and attitudes of 15-year-olds across the world. Past research investigating environmental awareness (EA) in PISA 2006 found associations between EA and science-related competencies and attitudes. Investigating EA in the PISA studies may have important implications for education for sustainable development (ESD): results may show which factors should be considered in educational interventions to enhance students’ EA. Cross-national analyses of EA may provide insights into the predictors of EA on a local, national or international level. This study investigates the individual, school, and country level predictors of EA in PISA 2015 (365,194 students, 12,594 schools, 53 countries). The multi-level regression analysis on EA reveals that most of the variance is located at the student level. On the individual level, variables related to science learning in school are associated with EA across all countries. This study also compares the degrees of EA in the 2006 and 2015 populations. The results show similar degrees of EA in 2006 and 2015. Altogether, the study provides cross-country evidence on important aspects that should be addressed in successful ESD programs.

1. Introduction

In 2018, the United Nations’ Intergovernmental Panel on Climate Change (IPCC) published a special report on the state of climate change and the risks of further global warming [1]. Here, the IPCC stresses the importance of a sustainable development to conserve the planet and give present and future generations the chance to meet their own needs [2]. Novel political movements such as Fridays for Future demonstrate impressively that there are already many young people who are aware of the critical situation they face in the future [3,4].
For decades, factors that determine pro-environmental behavior (PEB) are investigated to achieve a change in human non-sustainable behavior [5,6]. Among other variables, PEB is associated with individuals’ awareness of the status of environmental matters [environmental awareness (EA)] [7,8]. EA refers to the knowledge and understanding of current environmental problems [6,9,10], for example the importance of greenhouse gases in the atmosphere for anthropogenic climate change [1]. In their meta-analysis, Bamberg and Möser [6] identified EA as an important predictor of PEB (see also [8]). Therefore, enhancing EA is one important component of Education for Sustainable Development (ESD) [8]. ESD aims at empowering learners such as school students to behave in a sustainable way [11]. There is a strong agreement that ESD should not only focus on the transfer of knowledge, but also on the development of affective qualities and attitudes towards the environment as important preconditions to enhance PEB [10,11,12,13,14,15].
Because of the global environmental challenges, the Organisation for Economic Co-operation and Development (OECD) assessed environment-related science competencies and attitudes in their third Programme for International Student Assessment (PISA) in 2006 [9,16,17]. PISA aims at determining the status of those competencies of 15-year-old students that are at the core of successful participation in society [18]. Since the first assessment in 2000, PISA is conducted every three years (PISA cycles) alternating in focus on achievement in the domains of reading, mathematics, and science. In addition, background questionnaires assess the students’ learning and home environments, their own as well as their parents’ beliefs and attitudes, and school characteristics as well as teaching practices [18,19,20]. In each cycle, one domain is assessed in more depth (major domain) allowing for the evaluation of the relevant subskills, subdomains, and accompanying attitudes of the students. PISA is assessed in more than 50 countries. Although the majority of these countries are from the Global North [19], nevertheless, spanning a great variety of nations and societies, the PISA studies provide unique opportunities to investigate the competencies and attitudes of 15-year-olds across the world.
In PISA 2006, science was the major domain. The background questionnaire included the EA-scale “students’ awareness of environmental issues” which addresses how well students are informed about global environmental problems such as the increase in greenhouse gases and forest clearings [9]. The descriptive results regarding EA have been summarized in the OECD’s report “Green at fifteen?” [17]. In the sixth PISA cycle in 2015, 15-year-old were once again asked about their awareness of global environmental problems [20]. Investigating EA in the context of PISA has important implications for ESD: results may show which factors need to be considered in educational interventions to enhance students’ EA. Thus, a cross-national analysis of EA may give an overview about the prevalence of the awareness of environmental problems. Besides, it may provide insights into possible predictors of EA on a local, national or even international level. This perspective is of interest as current environmental problems need to be tackled globally [1,2,21].
Drawing on the international PISA-2015-sample, we analyzed correlates of the EA of adolescents in 53 countries. The aim of the present study was to explore predictors of EA as well as to what extent the degree of EA and their correlates differ between countries. Furthermore, we compared our results with the PISA-2006-findings [17,22,23,24,25,26].

1.1. Findings from PISA 2006 on Environmental Awareness

Different studies investigated the correlates of EA in PISA 2006. These studies focus either on single countries (e.g., Colombia: [22]; Flanders: [23]; Germany: [24]; Turkey: [25]), or compare particular countries with one another (e.g., USA and Canada: [26]) in order to identify relevant correlates of adolescents’ EA. Taken together, these studies show similar results: important predictors of EA are scientific literacy [23,24], enjoyment of science [22,23], and engagement in science-related activities, both outside school [22,24] and within the school context [25]. These variables indicate that students with higher competence as well as students with higher interest in science also show higher degrees of EA. EA is also positively correlated with the occurrence of enquiry-based instruction in the science classes [22,23,24,26]. Enquiry-based instruction refers to teaching practices that encourage students to take an active part in their learning, and that help them to develop their own understanding of scientific matters [27]. These findings underline the importance of science education for EA [28,29,30]. Furthermore, optimism regarding the decrease in environmental problems is negatively related to higher levels of EA [22,25].
Research shows that effects of gender and migration background on EA are rather small or insignificant [17,23,26]. However, higher socio-economic status (SES) appears to be related to higher degrees of EA [17,23,25,26]. While Edsand [22] as well as Erbas et al. [25] report a positive relationship between students’ and their parents’ EA for the Colombian and the Turkish PISA sample, respectively, Schöps et al. [24] do not find a relationship for the German sample. Furthermore, students at the upper secondary educational level also have higher levels of EA as opposed to students at the lower level [23,24]. School characteristics also appear to have some influence on students’ EA. Besides educational level, school ownership (public vs. private), school size, and the quality of educational resources is related to students’ EA [22].
To summarize, past research shows that students’ EA is related to school achievement as well as to motivational variables indicating interest in science. EA also appears to be influenced by variables such as optimism regarding future environmental problems.
Fifteen-year-old students spend much time in school and, mostly, their friends attend the same school [31]. Therefore, students likely have common values and social norms. As social norms are predictors of PEB [6,8,32], the peer group’s EA at school is likely to be related to the students’ EA. Besides, Duarte et al. [33] have found differences in students’ pro-environmental attitude (PEA) between rural and urban school areas. PEA is a person’s evaluative response towards environmental issues [34]. PEA is a predictor of the intention to behave pro-environmentally, which in turn influences the action of PEB [5,6,32]. And PEA is determined by EA [6]. Kollmuss and Agyeman [10] even suggest PEA and EA as components of a complex pro-environmental consciousness. In PISA 2006, PEA was operationalized by a scale on the students’ sense of personal and societal responsibility for environmental issues (example item: “I am in favor of having laws that regulate factory emissions, even if this would increase the price of product.”) [9]. Duarte et al. [33] argue that, besides the social composition of the schools, the characteristics of the catchment area of the respective schools might account for differences in individual PEA levels. Because of the conceptual relationship between PEA and EA [10], differences in students’ EA may be related to the school area as well.
To the best of our knowledge, no study to date has analyzed EA in all countries in PISA 2006. What we find in the literature are two studies that have explored PEA in larger subsamples of the PISA-2006-population [33,35]. Taking all EU member states into account, Duarte et al. [33] reported that students at the same school have similar degrees of PEA. Considering 56 countries in PISA 2006, Boeve-de Pauw and Van Petegem [35] found that a country’s level of PEA is related to the country’s performance in environmental protection. However, the authors did not find an effect of the development status of the country, though in another study they found associations between country development and environmental concern [36]. Taken together, these findings suggest that, to some degree, PEA differs between countries with regard to economic or environmental differences. In a similar manner, the degree of EA might also differ between countries with different degrees of environmental protection.

1.2. The Present Investigation

This study aims at exploring EA in the PISA 2015 sample and comparing the results to those reported for the PISA 2006 assessment. More precisely, we want to investigate the following three research questions (RQs): RQ1 concerns school and country differences in EA. Studies have reported effects of school and country characteristics on PEA [33,35]. Because PEA and EA are closely related to one another [10], we assume that students from the same cluster (school/country) are more alike in their EA scores than students from different clusters. RQ2 addresses the predictors of EA on different cluster levels (individual, school, and country level). Here, we investigate if the findings reported for different countries in PISA 2006 [17,22,23,24,25,26,33,35] can be found when considering the total PISA-2015-sample.
RQ3 addresses the comparison of EA in the populations of 2006 and 2015. Since past research used the PISA-2006-data, we also want to investigate the stability of previous results by using data collected almost a decade later. Specifically, we are interested whether the PISA-2015-sample differs in its degree of EA from the PISA-2006-sample: in 2004, the UNESCO started its UN Decade of Education for Sustainable Development, a worldwide initiative aiming at fostering ESD in schools [37]. In 2014, the UN Decade of ESD ended, and in 2015, a follow-up program, UNESCO Global Action Programme on Education for Sustainable Development, was launched [38]. While PISA 2006 took place at the beginning of the UN Decade of ESD, PISA 2015 took place at its end. We aim to compare the degree of EA between these two cohorts. This comparison might indicate an increase in EA as an effect of the initiatives.

2. Materials and Methods

2.1. Sample

This study uses the student PISA 2015 data (e.g., [18,20]) that are publicly available through the OECD website (https://www.oecd.org/pisa/data/2015database/). In our analyses, 53 countries that provided data for the EA-scale were included. Overall, our sample consisted of 365,194 students from 12,594 schools. On average, there are 238 schools and 6890 students per country. Fifty percent of the students are female and 64% of the students attended educational programs at the upper secondary level. Sixty-seven percent of the schools were located in urban areas. The countries included, along with the sample sizes, are listed in Table 1.

2.2. Measures

For most of the continuous variables used in this study, we use Warm’s weighted likelihood estimates (WLE) as provided by PISA [20]. WLE scores were constructed to be standardized variables with a mean of zero and a standard deviation (SD) of 1 with regard to the subsample of OECD countries. The scoring procedure of these WLEs is explained in the PISA 2015 technical report [20], and not repeated here. For detailed information on the scale development and the scaling procedures for all scales used in this study, along with the sampling strategies, we refer to the respective PISA publication [20]. In Table 2, we present the descriptive statistics of all variables included in our analyses of the PISA-2015-data, along with the median reliability estimates as reported in the official PISA report [20].

2.2.1. Environmental Awareness

A. Dependent Variable of the Regression Model.
The dependent variable in our study is the EA scale. This consists of the students’ self-reported familiarity with seven environmental issues (i.e., “How informed are you about the following environmental issues?”), for example, forest clearings, greenhouse gases in the atmosphere, or air pollution. Students rated their awareness for each issue on a four-point scale ranging from I have never heard of this to I am familiar with this and I would be able to explain this well. Higher values on the scale indicate higher levels of awareness of environmental issues. We use the WLE scores of EA (median Cronbach’s α= 0.88, across countries) as provided by PISA (see [20] for details of the scaling procedure).
B. Cohort Comparison of Environmental Awareness.
Because the EA scales used in 2006 and 2015 are not identical, we based our cohort comparison on the common items instead of the WLEs provided in the PISA datasets. There are four items addressing nuclear waste, forest clearings, greenhouse gases in the atmosphere, and genetically modified organisms (GMOs). To this end, we dummy-coded the common items such that the answer options I have never heard of this and I have heard about this but I would not be able to explain what it is really about indicate low EA. The answer options I know something about this and could explain the general issue and I am familiar with this and I would be able to explain this well indicate high EA.

2.2.2. Independent Variables on the Student Level

On the student level, we consider variables that have been proven as correlates of EA. For sociodemographic measures, we included gender (male, female) and SES (median Cronbach’s α = 0.67). Note that relationships between gender and EA found in PISA 2006 are quite small [9,23,26,33]. Despite this fact, we still included gender as a predictor because past research has repeatedly found females to show higher PEA scores than males [39,40,41]. We used the SES scores as provided in the PISA database. Here, SES scores were derived by means of principal component analysis from parents’ educational and occupational level as well as the number of specific household possessions (e.g., the number of books at home; see [20] for details of the scaling procedure). SES scores were standardized with regard to the OECD countries with a mean of zero and an SD of 1. We further included scientific literacy and school track as measures of school achievement. As for scientific literacy, we used the mean of the ten plausible values (PVs) provided by PISA (median PV reliability = 0.91). PVs are standardized using only the OECD subsample with M = 500 and SD = 100. School track was derived from the educational program level the student attended at school. The country-specific program levels were categorized according to the International Standard Classification of Education distinguishing lower secondary level (ISCED level 2) and upper secondary level (ISCED level 3) [20]. As motivational variables, we included enjoyment of science (WLE score) and science-related activities outside of school (science activities; WLE score). Enjoyment of science was measured by five items using a four-point scale ranging from strongly disagree to strongly agree (e.g., “I am interested in learning about broad science.”; median Cronbach’s α = 0.94). Science activities were measured by nine items. Students were asked to rate how often they would perform specific science-related activities on a four-point scale ranging from never or hardly ever to very often (e.g., “Watch TV programs about broad science”; median Cronbach’s α = 0.92). As a measure of affective response to environmental problems, we included the environmental optimism scale (WLE score). Environmental optimism captured students’ beliefs about the development of environmental issues in the next 20 years. Students stated whether they believed that environmental problems would get worse, stay the same or improve over time on a three-point scale. Higher values on this scale indicated higher optimism regarding the development of environmental issues. Environmental optimism was measured by seven items (median Cronbach’s α = 0.86), one item for each of the environmental problems which were also used for the EA scale. Lastly, we included the student rating of the extent of enquiry-based instruction in their science classes (WLE score). Enquiry-based instruction was measured by eight items. Students were asked to rate how often specific activities would occur during science lessons on a four-point scale ranging from never or hardly ever to in all lessons (e.g., “Students are given opportunities to explain their ideas.”; median Cronbach’s α = 0.87).

2.2.3. Independent Variables on the School Level

At the school level, we consider school characteristics and peer group effects. For school characteristics, we included the principal’s rating of quality of science class resources (sum score). Science class resources were assessed with eight dichotomous items (yes/no responses) in the school questionnaire (e.g., “The material for hands-on activities in school science is in good shape.”; median Cronbach’s α = 0.67). We also included a dummy variable for school area. In PISA 2015, principals defined the school area using five categories (village, small town, town, city, large city). For our analyses, we recoded the item in two categories, that is village/small town and town/city/large city. To account for peer group effects, we consider the school averages of students’ scientific literacy, of students’ optimism regarding environmental problems, of students’ SES and the students’ rating of enquiry-based instruction.

2.2.4. Independent Variables on the Country Level

On the country level, we included the environmental performance index (EPI) [42], and the human development index (HDI). The EPI measures the performance of countries at tackling environmental problems with respect to the protection of human health as well as the protection of the ecosystem [42]. The EPI scores are released biennially, and for our analyses, we used the EPI for the year 2014. The HDI is a measure of a country’s overall status of development. It summarizes indicators of health, education, and the standard of living for the country’s population [43]. In our analyses, we used the HDI data for the year 2015. Moreover, we also entered the country mean of students’ scientific literacy to control for country differences in science education.

2.3. Procedure

2.3.1. Multilevel Analysis

The PISA data show a hierarchical structure with students nested in schools nested in countries. Ignoring the nested data structure can lead to overestimating the standard errors, which, in turn, would lead to an overestimation of the significance level of the parameter estimates [44]. As typically employed in educational studies drawing on nested data (e.g., students in schools), we utilize a multilevel regression model with three levels: L1: students, L2: schools, and L3: countries.

2.3.2. Missing Data

In our analyses, we only include those countries that provide data; thus, there are no missing data on L3. However, there are missing values on L1 and L2. Averaged over all variables, there are, in total, 5 % missing data. Following the state-of-the-art recommendations on the handling of missing data [45], we use multiple imputation (MI) methods to account for the missing data on L1 and L2. To this end, five datasets with imputed missing values were created using the MI algorithm implemented in Mplus 8 [46]. Each dataset was analyzed separately, and the obtained parameter estimates were combined to one value according to the formulas by Rubin [47], as implemented in Mplus.

2.3.3. Sampling Weights

PISA uses a complex survey design that provides participating countries with the opportunity to oversample schools and/or students with certain characteristics of interest (e.g., [20]). To account for this design as well as to account for different population sizes in different countries, and the fact that schools are selected with a probability proportional to their size, we use the final student weight provided with the data. Not applying the survey weights potentially leads to biased results [48].

2.3.4. Centering and Standardizing of Independent Variables

In multilevel regression models, the issue of centering and standardizing of the predictor variables arises. Prior to the analyses, all continuous variables were standardized. Dichotomous predictors (gender, school track, school area) were left unstandardized. Because we are interested in the within-school effects of our students’ level predictors, we used group-mean centering for the continuous predictors on Level 1 [49,50]; doing so allows a straightforward interpretation of their effects on the dependent variable as effects of the school environment [51]. The predictors on Level 2 and Level 3 were grand-mean centered. Therefore, the regression coefficients on Level 3 represent the effect of the predictors when controlling for Level 2 effects [49,50,51].

2.4. Statistical Analysis

RQ1 concerns school and country differences in EA. To answer this question, a null model without predictors is computed to explore the proportion of variance in students’ EA that is explained by school or country differences [44]. We investigate the intraclass correlation (ICC) on the school (ICCL2) and on the country level (ICCL3). If a substantial proportion of variance in EA is located at aggregate levels, this could indicate that an individual’s EA is influenced by one’s school or country characteristics.
RQ2 addresses the correlates of EA. To this end, we construct different multilevel regression models with EA as the dependent variable. In the first model (M1), we include only the individual variables on L1 as predictors. In the second (M2) and third model (M3) we add school- (M2) and country-level (M3) predictors. Analyses for the first and second research questions were carried out in Mplus 8 using a robust maximum likelihood estimator [46].
RQ3 addresses the comparison of EA in the populations of 2006 and 2015. We investigate this question by computing the mean differences in EA and the respective effect size measures (Cohen’s h [52]). We only considered the 47 countries that participated in both cycles. The six countries excluded from the analyses are Costa Rica, the Dominican Republic, Peru, China, Singapore, and the United Arab Emirates. Therefore, our sample for RQ3 consists of 331,071 students in PISA 2006 and 290,012 students in PISA 2015. Analyses were carried out in SPSS 24.0.

3. Results

3.1. Descriptive Statistics and Intercorrelations

Descriptive statistics of all variables are listed in Table 2. The distribution of EA for each country is presented in Figure 1. The country means of EA vary between −0.48 (SD = 0.92) for Japan and 0.61 (SD = 1.31) for Portugal. Since the PISA metrics for the derived scores (WLEs, PVs, SES score) are standardized with respect to the OECD subsample [20], and since we considered also non-OECD countries in our analyses, the means and SDs in our results may show deviations from the expected standardized values. The intercorrelations between all variables are displayed in Table 3. These correlations are obtained from multilevel models taking the nested data structure into account. Thus, correlations with EA on higher levels are group-level correlations. On the student level, science achievement and enjoyment of science show the highest correlations with EA (r = 0.33 and r = 0.35, respectively, ps < 0.001). EA is also positively related to SES and science activities (r = 0.21 and r = 0.16, ps < 0.001). Environmental optimism and EA show a negative correlation, indicating that a higher awareness of environmental issues is related to less optimistic view on the development of environmental problems (r = −0.15, p < 0.001).
On the school level, mean scientific literacy is positively related with school level EA (r = 0.18, p < 0.001). School level environmental optimism and EA are negatively related (r = −0.23, p < 0.001). Neither average SES, school area, nor quality of science class resources show significant correlations with EA. On the country level, all of the variables considered show significant negative correlations with country level EA, indicating that higher mean levels of EA correspond to lower levels of environmental protection and country development, as well as lower mean scientific literacy.

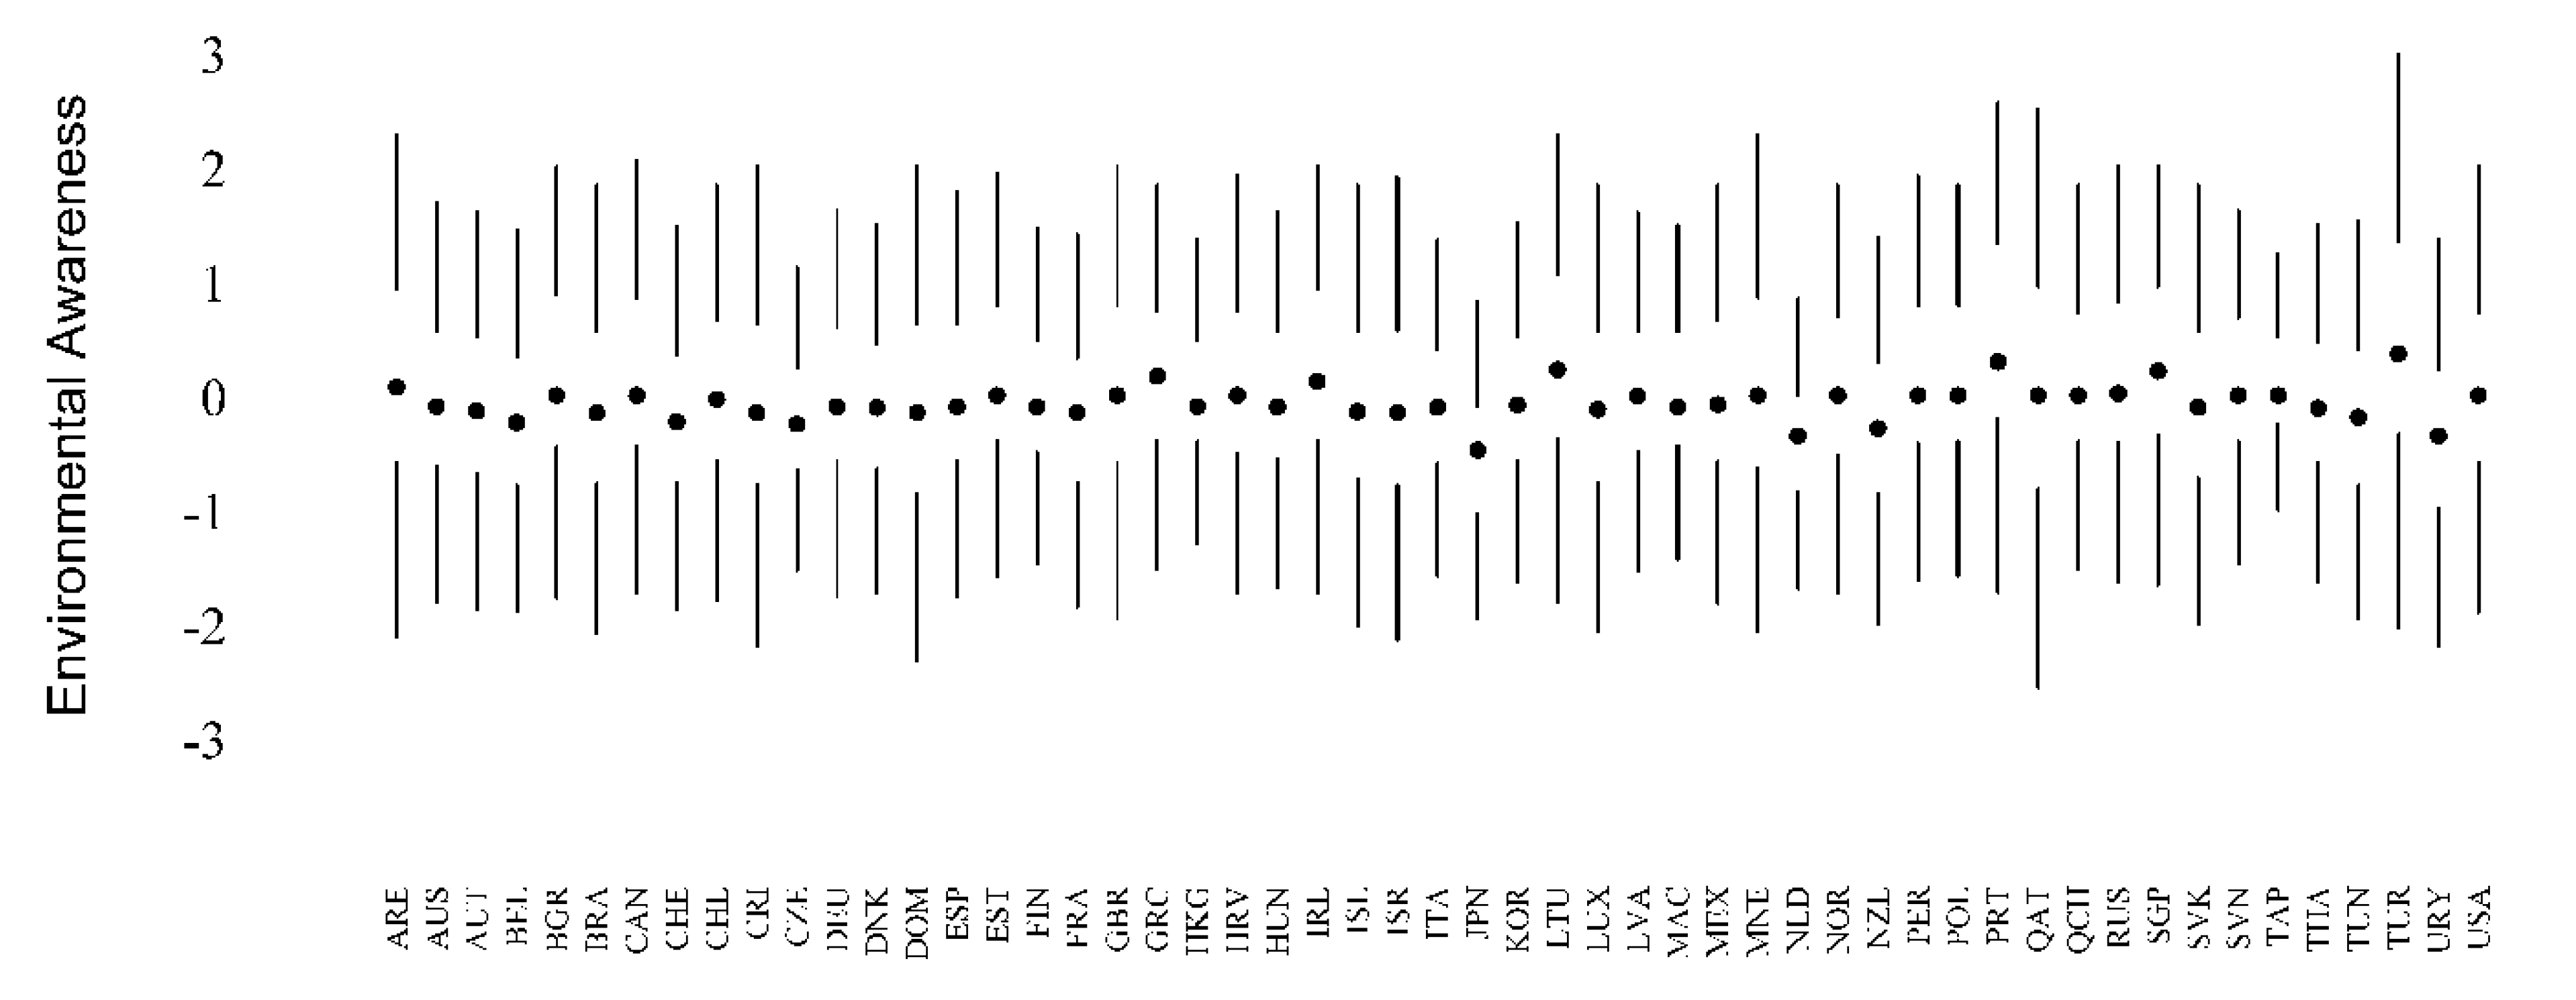
3.2. RQ1: School and Country Differences in Environmental Awareness

Our first research question addresses the degree of variance in students’ EA that is due to cluster effects, meaning those variance proportions most likely attributable to school or country characteristics. The variance decomposition on both cluster levels is 8 % for the school level (ICCL2 = 0.076) and 3 % on the country level (ICCL3 = 0.033). Following Hox’s [53] rule of thumb for the evaluation of cluster effects, there appears to be a small-to-medium effect for the school level, related to environmental awareness. The respective design effect for the school clusters is 3.13, and thus lies above the cut-off score of 2.0 [54], indicating a noticeable clustering effect on the distribution of EA scores. There is no apparent country effect, according to Hox [53]. However, the design effect attributed to the country level is 8.82, thereby placing it above the cut-off score. Taken together, there are school differences in the students’ EA scores but country residence appears to explain—at most—a rather small part of the overall variance in students’ EA scores.

3.3. RQ2: Correlates of Environmental Awareness

In our second research question, we investigate the correlates of EA on the student (L1), school (L2), and country (L3) level in three multilevel regression models. The parameter estimates for all three models (M1, M2, and M3) are displayed in Table 4. On the student level, the strongest predictors of EA are scientific literacy (B = 0.16, p < 0.001), enjoyment of science (B = 0.23, p < 0.001), and environmental optimism (B = −0.10, p < 0.001): While higher science scores and more enjoyment of science are positively related to EA, more environmental optimism corresponds to lower EA scores. Science activities and enquiry-based instruction also show smaller positive associations with EA (B = 0.08, B = 0.07, resp., ps < 0.001). Furthermore, school track shows a significant effect on EA. However, this effect diminishes when the mean school scientific literacy score is considered (M2). Altogether, these predictors explain 13 % of the EA variance on the student level.
For M2, we add the school level variables. Of the school characteristics, the average scientific literacy has the strongest effect on EA (B = 0.24, p < 0.001) indicating that a school’s mean science achievement is positively related to a school’s mean EA. This relationship remains significant when country level science achievement is included (M3). The school averages of SES and inquiry-based science teaching are also positively related to average EA, although the regression coefficients indicate a rather small impact (B = 0.04, B = 0.05, resp., ps < 0.02). Similar to the findings for the student level, environmental optimism and EA have a small, negative relationship on the school level (B = −0.06, p < 0.001). Neither school area nor the quality of science class resources have an effect on EA. With the predictors considered in M2, 71 % of the variance on the school level can be explained.
Adding country level variables (M3), we find that HDI has a small negative effect on EA (B = −0.08, p < 0.05). Mean scientific literacy is also negatively related to EA (B = −0.07, p < 0.05), on the country level. EPI has no significant relationship with EA. The predictors in this model explain 32 % of the variance on the country level EA.
Taken together, scientific literacy and EA are positively related on the student and school level, but there is a negative relationship on the country level. Thus, students with higher levels of EA also tend to have higher scores in scientific literacy, and schools with higher average science scores also tend to have higher average levels of EA, while, on the country level, the degree of EA is lower in countries with higher achievement levels. Similarly, while SES is positively related to EA on the student and school level, on the country level, HDI has a negative relationship: while a higher individual and group-level economic status is associated with higher EA scores, countries with a higher HDI tend to have lower levels of EA.
Furthermore, students who are less optimistic regarding the environmental problems and students who report higher amounts of enquiry-based instruction in their classes tend to have higher EA. For both predictors, we find similar relationships with EA on the school level. Students with greater enjoyment of science and those who engage more frequently in science activities outside school appear to have higher EA. Neither gender nor school track appear to be related to EA. On the school level, neither school area nor the quality of science class resources is related to EA. On the country level, we found no association between EPI and EA.
Overall, our predictors explain only 13 % of the variance on the student level, thus, we assume that there are other variance sources accounting for EA differences. On the school and country level, our predictors explain 71 % (L2) and 32 % (L3) of the variance. Although the explained variance on the aggregate levels is rather high, it is important to note that their proportion of the total variance is 8 % (L2) and 3 % (L3), indicating that most of the variance in EA scores is located at the individual level.

3.4. RQ3: Comparing Environmental Awareness in the Populations of 2006 and 2015

In our third research question, we compare the percentages of students with high EA in both cohorts, including all countries that participated in both cycles. The descriptive statistics of the common items of EA in the samples in 2006 and 2015 are presented in Table 5. On average, the sample from 2015 shows slightly higher amounts of students with high EA than the sample from 2006, though this effect (mean difference in proportions: Cohen’s h = 0.11) appears to be small [52]. The most notable differences are obtained for the awareness of greenhouse gases in the atmosphere and of GMOs (hs = 0.17): students in 2015 report higher awareness of these two issues than the students in 2006. Likewise, in PISA 2015, students have somewhat higher awareness of nuclear waste (h = 0.09); though students of both cohorts do not differ in their awareness of the consequences of forest clearings (h = −0.01). The latter might be due to ceiling effects because the proportions of students having general or detailed knowledge is highest for forest clearings (PISA 2006: 75 %; PISA 2015: 75 %). Generally, knowledge of GMOs is lowest (PISA 2006: 37 %, PISA 2015:45 %). Overall, in both cycles, more than half of the students have at least general knowledge about those environmental problems (PISA 2006: 55 %, PISA 201560 %, see Table 5).

4. Discussion

The purpose of this study was to investigate the predictors of EA using a large and heterogeneous international sample of adolescents. We used data from the sixth PISA cycle (PISA 2015) to investigate differences in the degree of students’ EA across schools and countries by means of multilevel analysis (RQ1). Furthermore, we explored possible correlations of individuals’ awareness of environmental problems with school achievement, enjoyment of science and engagement in science activities outside school, and environmental optimism, as well as sociodemographic characteristics at the student, school, and country (RQ2). In addition, we explored whether the awareness of specific environmental problems has changed between PISA 2006 and PISA 2015 (RQ3).
In the following, we summarize our findings and discuss them with respect to the current state of research. Few studies focus on EA alone; instead, they investigate PEA. Since EA has a strong relationship with PEA [6,10], in the discussion of our findings, we relate our results regarding EA to those results that have been reported for PEA.

4.1. Summary of Results

4.1.1. RQ1: School and Country Differences in Environmental Awareness

We found that proportions of the variance of EA scores can be attributed to school and country levels. Thus, students attending the same schools are, to some degree, more alike in their EA scores than students from different schools. To a lesser degree, the same holds for students from different countries. However, country residence appears to explain a rather small part of the overall variance in students’ EA scores. On the school level, our results might indicate that students’ EA is influenced by school practices, such as ESD activities [22,24,25,55,56], or by shared attitudes and beliefs by the peer groups [57]. On the country level, our results might indicate that EA is also related to cultural differences between countries [58,59,60]. Our results are in line with previous research reporting country differences in PEA for samples comprised of children or adolescents [36,61,62] as well as for adult samples ([63] (for a review see [64]). Compared to the findings of Boeve-de Pauw and Van Petegem [35] regarding students’ PEA, we found a higher effect for the school clusters and a smaller effect for the country clusters (4 % vs. 8 % for L2; 8 % vs. 3 % for L3). In the study of Boeve-de Pauw and Van Petegem [35], the variance in PEA scores is mostly located at the individual level, as we found in our data for EA.

4.1.2. RQ2: Correlates of Environmental Awareness

On the individual level, our results show that students with higher scientific literacy, more enjoyment of science, and a less optimistic view on the development of environmental problems also have higher EA. These results are in line with the findings reported for PISA 2006 [22,23,24,25]. The effect of scientific literacy on EA corroborates the general finding of a positive correlation between educational level and EA [58,65]. The positive relationship between EA and enjoyment of science is also consistent with previous research [66].
We further found positive effects of science activities and enquiry-based instruction on EA. Our results are in line with Evans et al. [67] who found a positive relationship between engaging in science activities outside school and EA. Other studies also report positive relationships between enquiry-based instruction and PEA [68,69]. In our study, the effect of instruction on EA is rather small. To some degree, this could be attributed to a lack of opportunity to learn [70]: if the environmental problems addressed in the EA scale are not explicitly taught in class, teaching practices potentially have little effect on this particular EA measure.
We further found a positive yet rather small effect of SES on EA, that is, a higher SES is associated with higher awareness of environmental problems. This result is in line with the findings by Gelissen [58] regarding PEA of adults (for a review, see [65]). A small effect of SES on EA was also found for the Flemish sample of PISA 2006 by Coertjens et al. [23]. Coertjens et al. [23] see a reason for this finding in the measure of SES in PISA, as it is comprised of diverse subdomains of SES [20]. Therefore, the typical finding of SES as strong predictor for pro-environmental variables ([71], for a review, see [65,72]) might be reduced due to the operationalization in PISA.
We did not find any effect of gender. This is in line with previous research [73,74]. As for school track, we found an effect only for the first model (M1). In line with previous research, students at the upper secondary educational level have higher EA scores [23,24]. The effect of school track vanishes when we include scientific literacy on the school level. Since school tracking is closely related to achievement, it is likely that the effect of school track is mediated by the average science achievement of the schools.
On the school level, mean scientific literacy was by far the strongest predictor of EA. The school mean scores of enquiry-based instruction, environmental optimism, and SES show small, similar effects to their individual-level counterparts. Unlike Edsand [22], we did not find an effect for the quality of science class resources. Since Edsand [22] considered only one country, it is possible that the association of science class resources and EA applies only in specific countries. Moreover, enquiry-based instruction and science class resources might be too broadly defined to capture the effect of specific, ESD-relevant resources. Likewise, we did not find an effect for school area. This stands in contrast to the study by Duarte et al. [33], who report a negative effect of city size on students’ PEA. However, Duarte et al. [33] based their analysis only on EU countries. It is possible that rural–urban differences vary between world regions. Generally, the rural–urban differences in PEA appear to be inconclusive [65].
On the country level, our finding of a small negative effect of the HDI on EA stands in contrast to previous studies, that found positive relationships between the country’s economic wealth and indicators of PEA [36,41,58,75]. However, Boeve-de Pauw and Van Petegem [35] did not find an association between HDI and PEA. The relationship between scientific literacy and EA on the country level is also negative. It is likely that aggregate scores on the country level have complex interrelationships with one another. For example, the education system is also influenced by the country’s development status [76]. Taken together, it appears that the impact of country development and the country’s average science achievement on EA warrants further research, specifically regarding the samples of young people. For instance, the mechanisms by which the country development status and the education system could influence students’ EA should be explored. tThis might be interesting for the further development of ESD policies.
Finally, we found no effect of the EPI score on EA. In contrast, Boeve-de Pauw and van Petegem [35] as well as Gelissen [58] report positive relationships between the EPI and EA. However, both studies found effects only for specific facets of the EPI score (e.g., air quality). Since we have used the composite EPI score, there might be differential effects of its facets that remain undetected. We conclude that the impact of a country’s environmental status on EA needs further research.

4.1.3. RQ3: Environmental Awareness in 2006 and 2015

To date, only a few studies have compared PEA in different cohorts, and no study has investigated EA. In our study, we find a slightly higher level of EA in PISA 2015 as compared to PISA 2006. Recently, Bauske and Kaiser [77] analyzed the development of environmental concern in Germany from 1996 to 2016, and they found an overall increase as well. However, in an international adult sample, Franzen and Vogl [75] found an overall decrease in environmental concern. As shown by Bauske and Kaiser [77], despite the overall increase over time, there are discrepancies from a linear trend. With regard to these findings, and noting that we have compared only two time points, we cannot draw any conclusions regarding the development of EA. In 2024, science will again be the major domain in PISA. If EA is included in this cycle, the trend can be reassessed to give a clearer picture of cohort differences.

4.2. Limitations and Future Research Directions

Our study lacks some important aspects that should be considered in further studies. We did not specifically address the issue of measurement invariance [78,79]. It is possible that the scales are not commensurable across all countries [9,17]. Thus, country differences might also reflect qualitative differences in the constructs instead of purely quantitative differences in the score distributions. Casalo and Escario [80] investigated the predictors of environmental concern in sixteen countries from different world regions in PISA 2006. Since they found that the relationships between environmental concern and all predictors are very similar in all countries with respect to strength and direction, we expect that our results reflect, mostly, quantitative country differences in EA levels.
Some relevant predictors of EA are missing in PISA 2015, or they were not assessed in all countries, and thus we did not consider these in our study. For example, one important predictor of PEB is connectedness to nature [64,81,82]. Past research also shows that connectedness to nature is related to EA [83]. Thus, connectedness to nature appears to be of high importance of successful ESD [84,85,86]. Therefore, its relationship with EA and PEB should be explored in more detail in future studies. Moreover, several authors report positive relationships between parents’ PEA and those of their children [22,25,80,87,88]. As PISA 2015 assessed neither connectedness to nature nor the parents’ EA, we were not able to include these aspects in our analyses. In PISA 2006, parental EA was assessed. Thus, in the case that future PISA assessments will again include parental EA, this variable should be considered.
More research is needed to identify predictors on the school and country level that might account for EA differences. Identifying important predictors on the school level could help to find relevant leverage points for ESD—either by showing which variables need to be considered in ESD interventions, or by identifying structural variables that could be addressed in educational policies for sustainable development. On the country level, EA might be related to cultural value orientation, for example to the country’s level of future orientation [63], of individualism [59], or of postmaterialism [58]. Research has shown that the relationship between PEA and PEB differs across countries [61,89,90], which is in line with our finding of country differences in EA. Future research should not only investigate further country-level predictors of EA, but it should also analyze moderator variables of the relationship between EA and PEB, for example by means of a slopes-as-outcomes-model in multilevel regression (e.g., [90]).
Finally, the conceptualization of EA needs to be considered. Depending on the specific environmental issues addressed in an EA measure, the distribution of EA scores in a sample might vary. The perception of environmental problems as being a serious threat (i.e., high EA) might depend on personal experiences with this matter. For example, “air pollution” might appear more severe to people living in areas with high smog exposure (e.g., in large cities) than to people in rural areas with low exposure to this particular environmental problem [91]. In the literature, there are different definitions of EA. In PISA, EA is a measure of knowledge about specific environmental problems [9]. Nordlund and Garvill [92] define EA as the perception of environmental issues as a threat to humans or the biosphere. In contrast, Littledyke [93] defines EA as being aware of how political actions affect the ecosystem. When discussing the outcomes of a study, the definition of EA should be carefully reviewed, as results are likely to vary according to the conceptualization (perception vs. knowlegde) and the environmental issues considered in the specific measure.

4.3. Implications for ESD in Schools

ESD should contribute to a sustainable development with the ultimate goal of empowering individuals to behave pro-environmentally [12]. A central challenge is how to develop an awareness for environmental problems and how to translate this awareness into persisting PEB. Previous studies have already proven that EA is an important determinant of PEB [6]. The results of our study suggest that schools play a role in adolescents’ development of EA. Several studies corroborate this finding [29,94,95,96,97].
Based on our findings, ESD school programs that aim at increasing EA should focus on enhancing scientific literacy as well as interest in science, and enquiry-based instruction. Learning about environmental topics is important in order to develop an understanding of nature as well as an awareness of environmental problems [94]. Since interest in a subject influences the learning process and triggers further engagement with the learning object [98], EA, but also scientific literacy, may effectively be enhanced by fostering interest in (environmental) science [28,29,30,98]. Specifically, enquiry-based instruction, that is teaching methods that encourage the students to explore themselves, are well suited to foster interest in (environmental) science, which is likely to lead to more PEB [95,99].

5. Conclusions

ESD can enhance students‘ EA. Our results showed that secondary school education affects learners’ EA, and so can primary schools [94,100] and higher education [101], as well as other institutions that implement (in)formal ESD [99] and learning opportunities in everyday life [102]. As the term education in ESD already indicates, ESD is a long-term process and cannot be achieved by single interventions [103,104]. To implement ESD, the teachers play a crucial role [99,103,105,106]. Teachers need to be conscious and convinced about the importance of ESD [106,107]. Accordingly, school or general education administrators need to support and promote ESD in their institutions [99,103,106].
In order to achieve the goal of limiting global warming to no more than 1.5 °C, massive concerted actions on the political, societal, and individual levels are necessary [21,108]. School can enhance not only cognitive, but also motivational and behavioral competences of students [15,16,17]. Within this framework, ESD plays a key role to enhance adolescents’ environmental knowledge, attitudes, and beliefs to empower young people to take action.
Our analyses of the PISA 2015 data shows that school education is associated with EA. Moreover, from our findings we can conclude that individual-level predictors related to science learning in school (i.e., literacy, interest in science) are associated with EA across the world. Additionally, EA is associated with school and country characteristics that are related to education. Altogether, our study provides cross-country evidence on important aspects that should be addressed in successful ESD programs.

Author Contributions

Conceptualization, M.K.L.; methodology, M.K.L., F.T.C.S., D.M. and D.F.-E.; validation, M.K.L., F.T.C.S. and D.F.-E.; formal analysis, M.K.L. and D.F.-E.; data curation, M.K.L.; writing—original draft preparation, M.K.L., F.T.C.S., D.M. and D.F.-E.; writing—review and editing, M.K.L., F.T.C.S., D.M. and D.F.-E.; visualization, M.K.L. All authors have read and agreed to the published version of the manuscript.

Funding

This research received no external funding.

Conflicts of Interest

The authors declare no conflict of interest.

References

  1. IPCC. Summary for Policymakers. In Global Warming of 1.5 °C. An IPCC Special Report on the Impacts of Global Warming of 1.5 °C above Pre-Industrial Levels and Related Global Greenhouse Gas Emission Pathways, in the Context of Strengthening the Global Response to the Threat of Climate Change, Sustainable Development, and Efforts to Eradicate Poverty; Masson-Delmotte, V., Zhai, P., Pörtner, H.-O., Roberts, D., Skea, J., Shukla, P.R., Pirani, A., Moufouma-Okia, W., Péan, C., Pidcock, R., et al., Eds.; World Meteorological Organization: Geneva, Switzerland, 2018. [Google Scholar]
  2. World Commission on Environment and Development. Our Common Future; Oxford University press: Oxford, UK, 1987. [Google Scholar]
  3. Hagedorn, G.; Kalmus, P.; Mann, M.; Vicca, S.; Van den Berge, J.; van Ypersele, J.-P.; Bourg, D.; Rotmans, J.; Kaaronen, R.; Rahmstorf, S.; et al. Concerns of young protesters are justified. Science 2019, 364, 139–140. [Google Scholar] [CrossRef] [PubMed] [Green Version]
  4. Thunberg, G. No One is Too Small to Make a Difference; Penguin Random House: London, UK, 2019. [Google Scholar]
  5. Hines, J.M.; Hungerford, H.R.; Tomera, A.N. Analysis and synthesis of research on responsible environmental behaviour: A metaanalysis. J. Environ. Educ. 1987, 18, 1–8. [Google Scholar] [CrossRef]
  6. Bamberg, S.; Möser, G. Twenty years after hines, hungerford, and tomera: A new meta-analysis of psycho-social determinants of pro-environmental behaviour. J. Environ. Psychol. 2007, 27, 14–25. [Google Scholar] [CrossRef]
  7. Newman, T.P.; Fernandes, R. A re-assessment of factors associated with environmental concern and behavior using the 2010 General Social Survey. Environ. Educ. Res. 2016, 22, 153–175. [Google Scholar] [CrossRef]
  8. Steg, L.; Vlek, C. Encouraging pro-environmental behaviour: An integrative review and research agenda. J. Environ. Psychol. 2009, 29, 309–317. [Google Scholar] [CrossRef]
  9. Organisation for Economic Co-operation and Development [OECD]. PISA 2006 Technical Report; OECD: Paris, France, 2009. [Google Scholar]
  10. Kollmuss, A.; Agyeman, J. Mind the Gap: Why do people act environmentally and what are the barriers to pro-environmental behavior? Environ. Educ. Res. 2002, 8, 239–260. [Google Scholar] [CrossRef] [Green Version]
  11. Carter, R.L.; Simmons, B. The history and philosophy of environmental education. In The Inclusion of Environmental Education in Science Teacher Education; Bodzin, A.M., Klein, B.S., Weaver, S., Eds.; Springer: New York, NY, USA, 2010; pp. 3–16. [Google Scholar] [CrossRef]
  12. United Nations Educational, Scientific and Cultural Organization [UNESCO]. Education for Sustainable Development Goals: Learning Objectives; UNESCO: Paris, France, 2017. [Google Scholar]
  13. Arbuthnott, K.D. Education for sustainable development beyond attitude change. Int. J. Sustain. High. Educ. 2009, 10, 152–163. [Google Scholar] [CrossRef] [Green Version]
  14. Christoforatou, E. Education in a Globalized World: Teaching Right Livelihood; PROLOG: Immenhausen, Germany, 2016. [Google Scholar]
  15. Mochizuki, Y.; Fadeeva, Z. Competences for sustainable development and sustainability: Significance and challenges for ESD. Int. J. Sustain. High. Educ. 2010, 11, 391–403. [Google Scholar] [CrossRef]
  16. Bybee, R.W. Scientific literacy, environmental issues, and PISA 2006: The 2008 Paul F-Brandwein lecture. J. Sci. Educ. Technol. 2008, 17, 566–585. [Google Scholar] [CrossRef]
  17. OECD. Green at Fifteen? How 15-Year-Olds Perform in Environmental Science and Geoscience in PISA 2006; OECD: Paris, France, 2009. [Google Scholar]
  18. OECD. PISA 2015 Assessment and Analytical Framework: Science, Reading, Mathematic, Financial Literacy and Collaborative Problem Solving; OECD: Paris, France, 2017. [Google Scholar]
  19. OECD. PISA 2015 Results (Volume I): Excellence and Equity in Education; OECD: Paris, France, 2016. [Google Scholar]
  20. OECD. PISA 2015 Technical Report; OECD: Paris, France, 2017. [Google Scholar]
  21. O’Brien, K. Is the 1.5 °C target possible? Exploring the three spheres of transformation. Curr. Opin. Environ. Sust. 2018, 31, 153–160. [Google Scholar] [CrossRef]
  22. Edsand, H.-E. Winds of Change—Expanding Renewable Energies in Developing Countries: Towards a Better Understanding of the Determinants of Technological Transitions. Ph.D. Thesis, Maastricht University, Maastricht, The Netherlands, 19 December 2017. [Google Scholar]
  23. Coertjens, L.; Boeve-de Pauw, J.; De Maeyer, S.; Van Petegem, P. Do schools make a difference in their students’ environmental attitudes and awareness? Evidence from PISA 2006. Int. J. Innov. Sci. Math. 2010, 8, 497–522. [Google Scholar] [CrossRef]
  24. Schöps, K.; Senkbeil, M.; Schütte, K. Umweltbezogene einstellungen von jugendlichen in Deutschland-Ergebnisse aus PISA 2006. Z. Erziehwiss. 2008, 10, 53–77. [Google Scholar]
  25. Erbas, A.K.; Tuncer-Teksoz, G.; Tekkaya, C. An evaluation of environmental responsibility and its associated factors: Reflections from PISA 2006. Eurasian J. Educ. Res. 2012, 46, 41–62. [Google Scholar]
  26. Lin, E.; Shi, Q. Exploring individual and school-related factors and environmental literacy: Comparing U.S. and Canada using PISA 2006. Int. J. Innov. Sci. Math. 2014, 12, 73–97. [Google Scholar] [CrossRef]
  27. OECD. PISA 2015 Results (Volume II): Policies and Practices for Successful Schools; OECD: Paris, France, 2016. [Google Scholar]
  28. Birdsall, S. Reconstructing the relationship between science and education for sustainability: A proposed framework of learning. Int. J. Environ. Sci. Educ. 2013, 8, 451–478. [Google Scholar] [CrossRef]
  29. Correia, P.R.M.; do Valle, B.X.; Dazzani, M.; Infante-Malachias, M.E. The importance of scientific literacy in fostering education for sustainability: Theoretical considerations and preliminary findings from a Brazilian experience. J. Clean. Prod. 2010, 18, 678–685. [Google Scholar] [CrossRef]
  30. Rost, J.; Lauströer, A.; Raack, N. Kompetenzmodelle einer bildung für nachhaltigkeit. Prax. Naturwiss. 2003, 52, 10–15. [Google Scholar]
  31. Bernelius, V.; Kauppinen, T.M. School outcomes and neighbourhood effects: A new approach using data from Finland. In Neighbourhood Effects Research: New Perspectives; Van Ham, M., Manley, D., Bailey, N., Simpson, L., Maclennan, D., Eds.; Springer: Dordrecht, Germany, 2012; pp. 225–247. [Google Scholar] [CrossRef]
  32. Farrowa, K.; Grolleau, G.; Ibanez, L. Social norms and pro-environmental behavior: A review of the evidence. Ecol. Econ. 2017, 140, 1–13. [Google Scholar] [CrossRef]
  33. Duarte, R.; Escario, J.-J.; Sanagustín, M.V. The influence of the family, the school, and the group on the environmental attitudes of European students. Environ. Educ. Res. 2017, 23, 23–42. [Google Scholar] [CrossRef]
  34. Kaiser, F.G.; Hartig, T.; Brügger, A.; Duvier, C. Environmental protection and nature as distinct attitudinal objects. Environ. Behav. 2011, 45, 369–398. [Google Scholar] [CrossRef]
  35. Boeve-de Pauw, J.; Van Petegem, P. A cross-national perspective on youth environmental attitudes. Environmentalist 2010, 30, 133–144. [Google Scholar] [CrossRef]
  36. Boeve-de Pauw, J.; Van Petegem, P. Cultural differences in the environmental worldview of children. IEJ. ENVIRON. EDUC. 2012, 2, 1–11. [Google Scholar]
  37. Buckler, C.; Creech, H. Shaping the Future We Want: UN Decade of Education for Sustainable Development; UNESCO: Paris, Fance, 2014. [Google Scholar]
  38. UNESCO. UNESCO Roadmap for Implementing the Global Action Programme on Education for Sustainable Development; UNESCO: Paris, France, 2014. [Google Scholar]
  39. Chan, H.-W.; Pong, V.; Tam, K.-P. Cross-national variation of gender differences in environmental concern: Testing the sociocultural hindrance hypothesis. Environ. Behav. 2019, 51, 81–108. [Google Scholar] [CrossRef]
  40. Czap, N.V.; Czap, H.J. An experimental investigation of revealed environmental concern. Ecol. Econ. 2010, 69, 2033–2041. [Google Scholar] [CrossRef]
  41. Lo, A.Y. National income and environmental concern: Observations from 35 countries. Public Underst. Sci. 2016, 25, 873–890. [Google Scholar] [CrossRef] [PubMed]
  42. Hsu, A.; Emerson, J.; Levy, M.; de Sherbinin, A.; Johnson, L.; Malik, O.; Schwartz, J.; Jaiteh, M. The 2014 Environmental Performance Index; Yale Center for Environmental Law, Policy: New Haven, CT, USA, 2014. [Google Scholar]
  43. United Nations Development Programme [UNDP]. Human Development Report 2016: Human Development for Everyone; UNDP: New York, NY, USA, 2016. [Google Scholar]
  44. Heck, R.H.; Thomas, S.L. An Introduction to Multilevel Modeling Techniques: MLM and SEM Approaches Using Mplus, 3rd ed.; Routledge: New York, NY, USA, 2015. [Google Scholar]
  45. Lüdtke, O.; Robitzsch, A.; Trautwein, U.; Köller, O. Umgang mit fehlenden Werten in der psychologischen Forschung: Probleme und Lösungen. Psychologische Rundschau 2007, 58, 103–117. [Google Scholar] [CrossRef]
  46. Muthén, L.K.; Muthén, B.O. Mplus User’s Guide, 8th ed.; Muthén and Muthén: Los Angeles, CA, USA, 2017. [Google Scholar]
  47. Rubin, D.B. Multiple Imputation for Nonresponse in Surveys; John Wiley and Sons: New York, NY, USA, 1987. [Google Scholar]
  48. Jerrim, J.; Lopez-Agudo, L.A.; Marcenaro-Gutierrez, O.D.; Shure, N. To weight or not to weight?: The case of PISA data. In Proceedings of the XXVI Meeting of the Economics of Education Association, Murcia, Spain, 29–30 June 2017. [Google Scholar]
  49. Brincks, A.M.; Enders, C.K.; Llabre, M.M.; Bulotsky-Shearer, R.J.; Prado, G.; Feaster, D.J. Centering predictor variables in three-level contextual models. Multivariate Behav. Res. 2016, 52, 149–163. [Google Scholar] [CrossRef]
  50. Enders, C.K.; Tofighi, D. Centering predictor variables in cross-sectional multilevel models: A new look at an old issue. Psych. Methods 2007, 12, 121–138. [Google Scholar] [CrossRef]
  51. Lüdtke, O.; Robitzsch, A.; Trautwein, U.; Kunter, M. Assessing the impact of learning environments: How to use student ratings of classroom or school characteristics in multilevel modeling. Contemp. Educ. Psychol. 2009, 34, 120–131. [Google Scholar] [CrossRef]
  52. Cohen, J. Statistical Power Analysis for the Behavioral Sciences, 2nd ed.; Lawrence Erlbaum Associates: Hillsdale, MI, USA, 1988. [Google Scholar]
  53. Hox, J.J. Multilevel Analysis: Techniques and Applications, 2nd ed.; Routledge: New York, NY, USA, 2010; ISBN 978–0–203–85227–9. [Google Scholar]
  54. Muthén, B.O.; Satorra, A. Complex sample data in structural equation modeling. Sociol. Methodol. 1995, 25, 267–316. [Google Scholar] [CrossRef] [Green Version]
  55. Boeve-de Pauw, J.; Gericke, N.; Olsson, D.; Berglund, T. The effectiveness of education for sustainable development. Sustainability 2015, 7, 15693–15717. [Google Scholar] [CrossRef] [Green Version]
  56. Tucker, R.; Izadpanahi, P. Live green, think green: Sustainable school architecture and children’s environmental attitudes and behaviors. J. Environ. Psychol. 2017, 51, 209–216. [Google Scholar] [CrossRef]
  57. Collado, S.; Evans, G.W.; Sorrel, M.A. The role of parents and best friends in children’s proenvironmentalism: Differences according to age and gender. J. Environ. Psychol. 2017, 54, 27–37. [Google Scholar] [CrossRef]
  58. Gelissen, J. Explaining popular support for environmental protection: A multilevel analysis of 50 nations. Environ. Behav. 2007, 39, 392–415. [Google Scholar] [CrossRef]
  59. Morren, M.; Grinstein, A. Explaining environmental behavior across borders: A meta-analysis. J. Environ. Psychol. 2016, 47, 91–106. [Google Scholar] [CrossRef]
  60. Pisano, I.; Mark Lubell, M. Environmental behavior in cross-national perspective: A multilevel analysis of 30 countries. Environ. Behav. 2017, 49, 31–58. [Google Scholar] [CrossRef]
  61. Boeve-de Pauw, J.; Van Petegem, P. A cross-cultural study of environmental values and their effect on the environmental behavior of children. Environ. Behav. 2011, 45, 551–583. [Google Scholar] [CrossRef]
  62. Shobeiri, S.M.; Omidvar, B.; Prahallada, N.N. A comperative study of environmental awareness among secondary school students in Iran and India. Int. J. Environ. Res. 2007, 1, 28–34. [Google Scholar] [CrossRef]
  63. Carmi, N.; Arnon, S. The role of future orientation in environmental behavior: Analyzing the relationship on the individual and cultural levels. Soc. Nat. Resour. 2014, 27, 1304–1320. [Google Scholar] [CrossRef]
  64. Schultz, P. Environmental attitudes and behaviors across cultures. Online Read. Psychol. Cult. 2002, 8, 1–12. [Google Scholar] [CrossRef] [Green Version]
  65. Gifford, R.; Nilsson, A. Personal and social factors that influence pro-environmental concern and behaviour: A review. Int. J. Psychol. 2014, 49, 141–157. [Google Scholar] [CrossRef] [PubMed]
  66. Le Hebel, F.; Montpied, P.; Fontanieu, V. What can influence students’ environmental attitudes? Results from a Study of 15-year-old students in France. Int. J. Environ. Sci. Educ. 2014, 9, 329–345. [Google Scholar] [CrossRef]
  67. Evans, G.W.; Otto, S.; Kaiser, F.G. Childhood origins of young adult environmental behavior. Psych. Sci. 2018, 29, 679–687. [Google Scholar] [CrossRef] [PubMed]
  68. Febriasari, L.K.; Supriatna, N. Enhance environmental literacy through problem based learning. J. Phys. Conf. Ser. 2017, 895, 012163. [Google Scholar] [CrossRef] [Green Version]
  69. Genc, M. The project-based learning approach in environmental education. Int. Res. Geogr. Environ. Educ. 2015, 24, 105–117. [Google Scholar] [CrossRef]
  70. Polikoff, M.S. Instructional sensitivity as a psychometric property of assessments. Educ. Meas. Issues Pract. 2010, 29, 3–14. [Google Scholar] [CrossRef]
  71. Longhi, S. Individual Pro-Environmental Behaviour Inthe Household Context; University of Essex, ISER: Essex, UK, 2013. [Google Scholar]
  72. Blankenberg, A.-K.; Alhusen, H. On the determinants of pro-environmental behavior: A literature review and guide for the empirical economist. CEGE Discuss. Pap. 2019, 350, 1–28. [Google Scholar] [CrossRef] [Green Version]
  73. De Groot, J.I.M.; Steg, L. Value orientations and environmental beliefs in five countries: Validity of an instrument to measure egoistic, altruistic and biospheric value orientations. J. Cross Cult. Psychol. 2007, 38, 318–332. [Google Scholar] [CrossRef]
  74. Boeve-de Pauw, J.; Karen Jacobs, K.; Van Petegem, P. Gender differences in environmental values: An issue of measurement? Environ. Behav. 2014, 46, 373–397. [Google Scholar] [CrossRef]
  75. Franzen, A.; Vogl, D. Two decades of measuring environmental attitudes: A comparative analysis of 33 countries. Glob. Environ. Chang. 2013, 23, 1001–1008. [Google Scholar] [CrossRef]
  76. OECD. PISA 2009 Results: What Students Know and Can Do—Student Performance in Reading, Mathematics and Science; OECD: Paris, France, 2010. [Google Scholar] [CrossRef]
  77. Bauske, E.; Kaiser, F.G. Umwelteinstellung in Deutschland von 1996 bis 2016: Eine Sekundäranalyse der Umweltbewusstseinsstudien; Umweltbundesamt: Dessau-Roßlau, Germany, 2019. [Google Scholar]
  78. He, J.; Barrera-Pedemonte, F.; Buchholz, J. Cross-cultural comparability of noncognitive constructs in TIMSS and PISA. Assess. Educ. Princ. Policy Pract. 2019, 26, 369–385. [Google Scholar] [CrossRef] [Green Version]
  79. Meredith, W. Measurement invariance, factor analysis and factorial invariance. Psychometrika 1993, 58, 525–543. [Google Scholar] [CrossRef]
  80. Casalo, L.V.; Esc, J.-J. Intergenerational association of environmental concern: Evidence of parents’ and children’s concern. J. Environ. Psychol. 2016, 48, 65–74. [Google Scholar] [CrossRef]
  81. Hoot, R.E.; Friedman, H. Connectedness and environmental behavior: Sense of interconnectedness and pro-environmental behavior. Int. J. Transpers. Stud. 2011, 30, 89–100. [Google Scholar]
  82. Restall, B.; Conrad, E. A literature review of connectedness to nature and its potential for environmental management. J. Environ. Manag. 2015, 159, 264–278. [Google Scholar] [CrossRef] [Green Version]
  83. Collado, S.; Corraliza, J.A.; Staats, H.; Ruiz, M. Effect of frequency and mode of contact with nature on children’s self-reported ecological behaviors. J. Environ. Psychol. 2015, 41, 65–73. [Google Scholar] [CrossRef] [Green Version]
  84. Kibbe, A.; Bogner, F.X.; Kaiser, F.G. Exploitative vs. appreciative use of nature—Two interpretations of utilization and their relevance for environmental education. Stud. Educ. Eval. 2014, 41, 106–112. [Google Scholar] [CrossRef]
  85. Otto, S.; Pensini, P. Nature-based environmental education of children: Environmental knowledge and connectedness to nature, together, are related to ecological behaviour. Global Environ. Chang. 2017, 47, 88–94. [Google Scholar] [CrossRef]
  86. Winther, A.A.; Sadler, K.C.; Saunders, G. Approaches to environmental education. In The Inclusion of Environmental Education in Science Teacher Education; Bodzin, A.M., Klein, B.S., Weaver, S., Eds.; Springer: New York, NY, USA, 2010; pp. 31–49. [Google Scholar] [CrossRef]
  87. Grønhøj, A.; Thøgersen, J. Like father, like son. Intergenerational transmission of values, attitudes and behaviours in the environmental domain. J. Environ. Psychol. 2009, 29, 414–421. [Google Scholar] [CrossRef] [Green Version]
  88. Matthies, E.; Selge, S.; Klöckner, C.A. The role of parental behaviour for the development of behaviour specific environmental norms—The example of recycling and re-use behaviour. J. Environ. Psychol. 2012, 32, 277–284. [Google Scholar] [CrossRef]
  89. Eom, K.; Kim, H.S.; Sherman, D.K.; Ishii, K. Cultural variability in the link between environmental concern and support for environmental action. Psychol. Sci. 2016, 27, 1331–1339. [Google Scholar] [CrossRef] [PubMed]
  90. Tam, K.-P.; Chan, H.-W. Environmental concern has a weaker association with pro-environmental behavior in some societies than others: A cross-cultural psychology perspective. J. Environ. Psychol. 2017, 53, 213–223. [Google Scholar] [CrossRef]
  91. Janmaimool, P.; Watanabe, T. Evaluating determinants of environmental risk perception for risk management in contaminated sites. Int. J. Environ. Res. Public Health 2014, 11, 6291–6313. [Google Scholar] [CrossRef] [PubMed] [Green Version]
  92. Nordlund, A.M.; Garvill, J. Effects of values, problem awareness, and personal norm on willingness to reduce personal car use. J. Environ. Psychol. 2003, 23, 339–347. [Google Scholar] [CrossRef]
  93. Littledyke, M. Science education for environmental awareness: Approaches to integrating cognitive and affective domains. Environ. Educ. Res. 2008, 14, 1–17. [Google Scholar] [CrossRef]
  94. Liefländer, A.K.; Bogner, F.X. Educational impact on the relationship of environmental knowledge and attitudes. Environ. Educ. Res. 2018, 24, 611–624. [Google Scholar] [CrossRef]
  95. Uitto, A.; Boeve-de Pauw, J.; Saloranta, S. Participatory school experiences as facilitators for adolescents’ ecological behavior. J. Environ. Psychol. 2015, 43, 55–65. [Google Scholar] [CrossRef]
  96. Hoffmann, R.; Muttarak, R. Greening through schooling: Understanding the link between education and pro-environmental behavior in the Philippines. Environ. Res. Lett. 2020, 15, 014009. [Google Scholar] [CrossRef]
  97. Rost, J.; Gresele, C.; Martens, T. Handeln für Die Umwelt-Anwendung Einer Theorie; Waxmann: Münster, Germany, 2001. [Google Scholar]
  98. Ainley, M.; Ainley, J. Student engagement with science in early adolescence: The contribution of enjoyment to students’ continuing interest in learning about science. Contemp. Educ. Psychol. 2011, 36, 4–12. [Google Scholar] [CrossRef]
  99. Wheeler, G.; Thumlert, C.; Glaser, L.; Schoellhamer, M.; Bartosh, O. Environmental Education Report: Empirical Evidence, Exemplary Models, and Recommendations on the Impact of Environmental Education on K-12 Students; Office of Superintendent of Public Instruction: Olympia, WA, USA, 2007. [Google Scholar]
  100. Caciuc, V.-T. Reflections on the ways to build up responsibility towards nature in primary school. Procedia Soc. Behav. Sci. 2014, 149, 136–141. [Google Scholar] [CrossRef] [Green Version]
  101. Barth, M.; Godemann, J.; Rieckmann, M.; Stoltenberg, U. Developing key competencies for sustainable development in higher education. Int. J. Sustain. High. Educ. 2007, 8, 416–430. [Google Scholar] [CrossRef] [Green Version]
  102. Gould, R.K.; Ardoin, N.M.; Thomsen, J.M.; Roth, N.W. Exploring connections between environmental learning and behavior through four everyday-life case studies. Environ. Educ. Res. 2019, 25, 314–340. [Google Scholar] [CrossRef]
  103. Redman, E.; Wiek, A.; Redman, A. Continuing professional development in sustainability education for k-12 teachers: Principles, programme, applications, outlook. J. Educ. Sustain. Dev. 2018, 12, 59–80. [Google Scholar] [CrossRef]
  104. Dür, M.; Keller, L. Research collaboration of austrian and indian teenagers in the context of education for sustainable development. Sustainability 2019, 11, 5094. [Google Scholar] [CrossRef] [Green Version]
  105. Carrier, S.J.; Tugurian, L.P.; Thomson, M.M. Elementary Science indoors and out: Teachers, time, and testing. Res. Sci. Educ. 2013, 43, 2059–2083. [Google Scholar] [CrossRef]
  106. Anderson, C.; Jacobson, S. Barriers to environmental education: How do teachers’ perceptions in rural ecuador fit into a global analysis? Environ. Educ. Res. 2018, 24, 1684–1696. [Google Scholar] [CrossRef]
  107. Ernst, J. Influences on US middle school teachers’ use of environment-based education. Environ. Educ. Res. 2009, 15, 71–92. [Google Scholar] [CrossRef]
  108. Tàbara, J.D.; Frantzeskaki, N.; Hölscher, K.; Pedde, S.; Kok, K.; Lamperti, F.; Christensen, J.H.; Jäger, J.; Berry, P. Positive tipping points in a rapidly warming world. Curr. Opin. Environ. Sust. 2018, 31, 120–129. [Google Scholar] [CrossRef]
Figure 1. Distribution of environmental awareness (EA) for each country (box plots). Dots indicate country mean, whiskers indicate quartiles. Country codes are explained Table 1.
Sustainability 12 02985 g001
Table 1. List of countries, country code, Organisation for Economic Cooperation and Development (OECD) membership status, number of schools, and number of students.
CountryCode OECDN (Schools)N (Students)
Total 12,594365,194
Average 2386890
United Arab EmiratesARE(-) 41412,427
AustraliaAUS X67713,015
AustriaAUT 2676938
BelgiumBEL X2759237
BulgariaBGR 1805928
BrazilBRA 63118,034
CanadaCAN 65517,255
SwitzerlandCHE X2135531
ChileCHL X2176823
Costa RicaCRI(-) 2026754
Czech RepublicCZE X3356689
GermanyDEU X2035124
DenmarkDNK X2745888
Dominican RepublicDOM(-) 1794367
SpainESP X2006726
EstoniaEST X2035536
FinlandFIN X1675846
FranceFRA X2325660
United KingdomGBR X43811,333
GreeceGRC X2055370
Hong KongHKG 1385359
CroatiaHRV 1605809
HungaryHUN X2335331
IrelandIRL X1575419
IcelandISL X1213347
IsraelISR X1726552
ItalyITA X3408452
JapanJPN X1986647
KoreaKOR X1685581
LithuaniaLTU 3116525
LuxembourgLUX X435281
LatviaLVA X2464812
Macao (China)MAC 454476
MexicoMEX X2747526
MontenegroMNE 645665
NetherlandsNLD X1333856
NorwayNOR X1994826
New ZealandNZL X1533735
PeruPER(-) 2776862
PolandPOL X1664386
PortugalPRT X2427235
QatarQAT 16712,083
B-S-J-G (China)1QCH(-) 2629637
Russian FederationRUS 2096029
SingaporeSGP(-) 1535267
Slovak RepublicSVK X2906350
SloveniaSVN X3045828
Chinese TaipeiTAP 2147708
ThailandTHA 2637872
TunisiaTUN 1444690
TurkeyTUR X1865857
UruguayURY 2206062
United StatesUSA X1755648
Notes.1: participating provinces of China (Beijing, Shanghai, Jiangsu, Guangdong); (-): Country excluded from population comparison (see RQ3); X: country is an OECD member.
Table 2. Descriptive statistics [Number of items, N, M, SD, reliability, proportion of missing values (in %)].
VariableNo. of ItemsNMSDRel. aMiss. b
Student level
Environmental awareness (weighted likelihood estimates (WLE) score)7329,8550.101.200.889.68
Gender1365,1940.50 c --
School track1365,1940.64 d --
Socio-economic status (composite score e) 357,287−0.161.070.672.17
Science literacy (mean plausible values (PV f)) 365,194477.2699.210.91 f--
Enjoyment of science (WLE score)5330,6550.131.100.949.46
Science activities (WLE score)9322,4450.191.170.9211.71
Environmental optimism (WLE score)7330,2250.061.290.869.58
Enquiry-based instruction (WLE score)8307,8180.061.040.8715.71
School level
School area112,5940.67 g --
Science class resources (sum score)812,3564.552.290.671.89
Country level
Environmental Performance Index (composite score i) 5367.1912.01 --
Human Development Index (composite score j) 530.860.07 --
Notes.a: median Cronbach’s α; b: percentage of missing values; c: proportion of females; d: proportion of students at upper secondary level; e: composite score as calculated by the PISA 2015 consortium [20]; f: mean score of the ten PVs; g: median test reliability based on plausible values; h: proportion of schools located in urban areas; i: composite score as calculated by Hsu et al. [42], range = 43.00–87.67; j: composite score as calculated by the United Nations Development Programme [43], range = 0.728–0.948.
Table 3. Intercorrelations between all variables.
Student LevelEA(1)(2)(3)(4)(5)(6)(7)
(1) Gender−0.01
(2) School track0.06 **0.05 ***
(3) SES0.21 ***−0.02 **0.11 *
(4) ScieLit0.33 ***0.000.10 *0.36 ***
(5) JoyScie0.35 ***−0.04 ***0.020.08 ***0.20 ***
(6) ScieAct0.16 ***−0.13 ***0.010.00−0.08 ***0.34 ***
(7) EO−0.15 ***−0.06 ***−0.06 *−0.07 **−0.20 ***−0.010.13 ***
IBTeach0.10 ***−0.06 ***−0.030.01−0.12 ***0.16 ***0.23 ***0.10 ***
School LevelEA(8)(9)(10)(11)(12)
(8) School area−0.01
(9) ScieRes−0.010.16 ***
(10) SES 10.000.28 ***0.36 ***
(11) ScieLit 10.18 **0.18 ***0.32 ***0.62 ***
(12) IBTeach 1−0.09 *−0.13 ***0.06−0.12−0.28 ***
EO 1−0.23 ***−0.10 **−0.05−0.22 **−0.34 ***0.19 **
Country LevelEA(13)(14)
(13) EPI−0.31 **
(14) HDI−0.46 ***0.79 ***
ScieLit 2−0.42 ***0.39 **0.61 ***
Notes. EA: Environmental awareness; ScieLit: Scientific literacy; JoyScie: Enjoyment of science; ScieAct: Science activities; EO: Environmental optimism; IBTeach: Enquiry-based instruction; ScieRes: Science class resources; EPI: Environmental performance index; HDI: Human development index; 1: school level averages; 2: country level averages. * p < 0.05; ** p < 0.01; *** p < 0.001.
Table 4. Predictors of environmental awareness: Results from multilevel linear regression models.
Environmental Awareness
M1M2M3
VariableBBB
Student level
Gender0.020.020.02
School track0.11 ***0.020.02
Social-economic status (SES)0.06 ***0.06 ***0.06 ***
Scientific literacy0.16 ***0.17 ***0.17 ***
Enjoyment of science0.23 ***0.23 ***0.23 ***
Science activities0.08 ***0.08 ***0.08 ***
Environmental optimism−0.10 ***−0.10 ***−0.10 ***
Enquiry-based instruction0.07 ***0.07 ***0.07 ***
School level
School area −0.01−0.01
Science class resources 0.000.00
SES 1 0.04 *0.04 *
Scientific literacy 1 0.24 ***0.24 ***
Environmental optimism 1 −0.06 ***−0.06 ***
Enquiry-based instruction 1 0.05 ***0.05 ***
Country level
EPI 0.00
HDI −0.08 *
Scientific literacy 2 −0.07 *
R² student level0.13 ***0.13 ***0.13 ***
R² school level 0.71 ***0.72 ***
R² country level 0.32 ***
Notes. 1: school means; 2: country means. * p < 0.05; ** p < 0.01; *** p < 0.001.
Table 5. Environmental awareness in 2006 and 2015 [proportions (in %), standard errors (SE)].
PISA 2006PISA 2015
%SE%SEh
The increase in greenhouse gases in the atmosphere570.09650.090.17
The use of genetically modified organisms370.08450.090.17
Nuclear waste500.09540.090.09
The consequences of clearing forests/other land use750.07750.08−0.01
Mean550.06600.060.11
Notes. Proportions of answers "I know something about this and could explain the general issue"/"I am familiar with this and I would be able to explain this well" to the question “How informed are you about this environmental issue?” for each of the environmental problems. h: Cohen’s h [52].

