Article

Sustainability Assessment of Product–Service Systems Using Flows between Systems Approach

by
Natalia Muñoz López
*,
Jose Luis Santolaya Sáenz
,
Anna Biedermann
and
Ana Serrano Tierz
Design and Manufacturing Engineering Department, University of Zaragoza. C/María de Luna 3, 50018 Zaragoza, Spain
*
Author to whom correspondence should be addressed.
Sustainability 2020, 12(8), 3415; https://doi.org/10.3390/su12083415
Submission received: 24 March 2020 / Revised: 9 April 2020 / Accepted: 21 April 2020 / Published: 22 April 2020
(This article belongs to the Section Sustainable Engineering and Science)

Abstract

:
The development of product–service systems (PSS) is currently considered a promising solution to the challenge of sustainability. Nevertheless, the sustainability of these systems has not been systematically assessed and there is a need to develop more guiding principles. In this work, an approach based on the flows between product and service systems is used to facilitate both the definition of PSS boundaries and the identification of links between the systems involved. In addition, the life cycle sustainability assessment (LCSA) method is applied to simultaneously quantify environmental, economic and social impacts. Two cases are analysed. First, the production process of cow´s milk, in which a veterinary service is required, is studied using data measured from a dairy farm. Next, the sustainability of a clothing retail service taking, into account that a construction product is involved in its creation stage, is evaluated. In each PSS specific life cycle, stages are analysed, a functional unit referred to both products and services is defined, and quantitative indicators are selected to assess each sustainability dimension. The category of workers is selected to evaluate social aspects. The relative incidence of each system is evaluated and the impacts of different factors on the PSS sustainability are analysed.

1. Introduction

Products have been the traditional focus of production and commercialization activities while services have been usually considered as a complement to the products value. Hence, sustainability studies have been carrying out in product systems and design for sustainability has been focused in methods to design sustainable products. In the last years, considerable attention has been put in service systems and product–service systems (PSS), since they are considered an innovative business approach and a possible answer to the sustainability challenge [1].
This approach shifts the traditional business focus from mass consumption to the behaviours and highly personalised needs [2,3] of individuals, and from selling only physical products to selling a mix of products and services that are jointly capable of fulfilling specific consumers’ needs (e.g., from selling a washing machine to selling cleaning services) [4]. According to this approach, three PSS main categories can be considered [5]:
-
Product-oriented services: the consumer will be the owner of the product so that the business model is still mainly geared towards selling products. Nevertheless, some additional services are provided by the company (e.g., insurance or maintenance).
-
Use-oriented services: service provider owns the product, selling only the function to customer. Thus, a change in product availability is produced. Product can be sometimes shared by a number of users (e.g., car rental).
-
Result-oriented services: the profit centre is result delivered, which client and provider firstly agree on (e.g., activity management-outsourcing such as catering services). There is no predetermined product involved. All materials products and consumables used to deliver the result now become cost factors, creating an incentive to minimize their use.
Ashford and Hall [6] consider that requirements of users and consumers can be fulfilled in two different modes: the use of products or the provision of services. The difference between them lies in the material nature of products and the immaterial character of services, as well as the timeline of the consumption, which is usually shorter in the case of services. In both cases, different actors are involved, and some sort of infrastructure is needed. Nevertheless, products and services are not completely independent systems. Service provision is based on products, and products require services to obtain a final utility. Thus, broader systems resulting from the combination of products and services are generated. PSS are defined by Boehm and Thomas [7] as an “integrated bundle of products and services which aims at creating customer utility and generating value”.
The design of PSS that provide more sustainable solutions to the current demands of society is the goal of a number of researchers [2,8,9]. Vezzoli et al. [8], consider PSS design for sustainability as the design of systems able to deliver a ‘unit of satisfaction’ looking for economic interest from providers, as well as environmental and socio-ethical beneficial results. To address the sustainable design of a PSS, the sustainability performance of the system, taking into account environmental, economic and social dimensions, should be quantified. However, the studies in relation to PSS sustainability assessment are still in the early phase, and criteria, methods and tools to support the assessment process are required [10,11].
The life cycle sustainability assessment (LCSA) method is considered by numerous authors [12,13,14,15] as an adequate framework to evaluate impacts and consider interdependencies between different sustainability dimensions. Nevertheless, LCSA has been mainly product-oriented and are hardly applied in other systems. A subject that adds complexity to the study of PSS is the need to consider various life cycles due to the combination of different products and services. The distinction between product and service life cycle and the system boundaries establishment in relation with the analysed PSS are significant challenge [16,17].
This work aims at quantitatively assessing the sustainability of PSS in two case studies using an approach based on the flows between product and service systems. This approach is intended to facilitate the definition of PSS boundaries and to identify connections between different systems. Two very different case studies are discussed in order to show how this approach can be implemented. In the first case, sustainability assessment is focused on the milk production process, taking into account that a veterinary service is required to ensure the animal health and manure is also obtained as a coproduct. In the second case, the sustainability of a clothing retail service is evaluated considering the construction of the store in which the service is provided. In order to evaluate PSS sustainability, the LCSA method is applied focusing on specific life cycle stages to adjust to the objective of the study and using a limited number of quantifiable indicators in each sustainability dimension. The following section examines a number of works, in which this methodology is already applied to both products and services systems. Section 3 exposes how flows between systems approach and the LCSA method can be jointly applied in the context of PSS. In Section 4, the sustainability of two different PSS is assessed, and the results are finally analysed.

2. LCSA Applied in Product and Service Systems

Most sustainability studies of product and service systems are based on a life cycle perspective, since including the whole life cycle trade-offs associated with all stages are identified. ISO standard [18] defines the life cycle as sequential and interconnected phases of a product system beginning from raw material acquirement or creation from natural resources to final disposal including activities of reuse, recycling or waste processing.
To obtain a more precise description, successive product transformations and intermediate processes can be considered in each stage of the product life cycle. Intermediate products (outputs from a unit process that represent inputs to other unit processes requiring further transformation within the system) as well as intermediate flows (products, materials or energy flows taking place between unit processes of the system) can be also defined. Different stages and phases within each stage can be identified in a product life cycle. The scope of an LCA, including the system boundary and level of detail, depends on the subject and objectives of the study.
In order to assess the environmental impact of a system, the life cycle assessment (LCA) methodology is frequently used. LCA structure was clearly established through the joint work of SETAC and ISO [18,19]. It complies and evaluates the elementary flows of the system: inputs (drawn from the environment without previous human transformation) and outputs (released to environment without subsequent human transformation). In addition, different tools that consider a wide number of impact categories and specific indicators can be used to assess environmental effects [20,21].
Besides the environmental protection, economic and social issues should also be considered in an approach of sustainability based on a triple bottom line (also referred to as planet, profit and people). According to this approach [22,23], the life cycle sustainability assessment (LSCA) methodology analyses environmental issues, economic aspects and social concerns to effectively achieve the sustainability assessment of a system [12,13]. LCSA evaluates impacts and provides guidelines for sustainable products and services development, combining environmental life cycle assessment (E-LCA), life cycle costing (LCC) and social life cycle assessment (S-LCA) techniques. To value social issues, UNEP’s guidelines [24] propose five stakeholder categories: workers, local community, society, consumers and value chain actors. In addition, for each stakeholder group, different social impact subcategories are identified.
LCSA methodology is based on the development of four phases:
(i)
Goal and scope definition. FU is identified and the system boundaries are established according to the depth and breadth of the study.
(ii)
Life cycle sustainability inventory (LCSI). Inputs and outputs of the system are collected to obtain a detailed data inventory.
(iii)
Life cycle sustainability impact assessment (LCSIA). Impacts of each sustainability dimension are evaluated using a set of suitable indicators. Quantitative indicators are preferred, although qualitative indicators are also used to value social aspects.
(iv)
Interpretation of results. Results are analysed and recommendations for decision making process can be proposed.
A critical issue is the selection of the most appropriate indicators to assess the sustainability in each dimension [25] and the difficulty of integrating the interrelationships between the three dimensions of LCSA results [26]. Since three different techniques (E-LCA, LCC, S-LCA) are used, indicators of each technique can be combined by means of aggregation and weighting methods to obtain a simplified index that allows communicating a final sustainability result [27,28]. Nevertheless, if a composite index is evaluated, weighting and aggregation of indicators can considerably affect the measured sustainability of a system. Thus, the parallel presentation of results obtained in each sustainability dimension is recommended by authors as Valdivia et al. [29], and Santolaya et al. [30], in order to effectively identify real impacts and to achieve a better understanding of the impact causes.
A significant number of works are making use of LCSA as assessment method to support decision making on sustainability. This methodology has been progressively implemented in the study of product systems and has been much less applied in the study of service systems. Several investigations performed over the last years, in which the sustainability of both products and services is object of study, are summarized in Table 1. Authors of these research works, the system object of study, the objectives and scope of the investigation, the method to assess sustainability as well as the main results obtained are indicated in each case.
We can observe in Table 1 that very different products, usually associated to industrial activity, and services, related to both public and private sector, are analysed. Predominant studies are those focused on comparing the sustainability of different alternatives or scenarios (comparative studies). Other works aim at identifying the hot spots of a selected system (descriptive studies). In this case, major impacts should be identified, and well-targeted strategies should also be applied to obtain significant improvements in the sustainability of the system [14]. Nevertheless, the effectiveness of the strategies applied is not usually determined due to the difficulty of evaluating the sustainability of the redesigned system.
A full analysis of the life cycle in a product or service system entails all the stages related. However, it is possible to circumscribe the assessment focusing on specific stages to adjust to the objective or to limit the complexity of the study. According to an objective focused on evaluating different alternatives or scenarios, a large number of studies are found in literature that address only some stages of the life cycle. Regarding those works collected in Table 1, we observe that Capitano et al. [31], analyse the production phase of marble products in two different industrial plants, and Foolmaun and Ramjeawon [32] compare four scenarios in regard to the final disposition of PET bottles. In service studies, Cheng and Hsu [33] analyse two temperature control systems in refrigerated food distribution service and Bartolozzi et al. [34], compare manual and mechanical systems in the operative stage of a street sweeping municipal service. Works like those of Asadi et al. [35], and Hossain and Poon [36], evaluate the sustainability of different alternatives along the entire life cycle of the product. In service studies, the entire life cycle is not usually analysed.
It is also observed in Table 1 that the combination of different techniques (LCA, LCC, S-LCA) is carried out to quantify the sustainability of a system. In a number of product studies, the three sustainability dimensions are assessed to support decision-making on the best alternative or scenario [31,37,38]. Meanwhile, environmental data are mainly obtained in service studies, economic data are also obtained in some cases [39], and social issues are almost never evaluated.
In each case, FU is defined to express and compare sustainability results. It should be noted that a time period of service provision is also required in FU definition of service studies. However, common FU is not always chosen in studies conducted on the same system. For instance, in the analysis of buildings and construction products, both ’one square meter over a period of 50 years’ and ’the entire building’ are selected as FU in different studies [40]. In the case of milk production, some authors chose ’the volume of raw milk’ and other authors prefer to emphasize the nutritional function of milk and correct the raw production according to its energy content [41]. In the case of a service system, FU is usually selected to quantify the provision stage, in which two main stakeholders, service receivers (customers) and service providers (workers), are usually involved. For instance, Bartolozzi et al. [34], select one hour and one worker to analysis the operation stage of a street sweeping service and Millán et al. [42], define FU in a day-care service taking into account one child and one year of service provision. In all cases, selecting FU to facilitate the comparison of different sustainability studies is very convenient. On the contrary, the results can only be used for the development of one single study. In addition, it is considered that FU should be the same in the three techniques (LCA, LCC and S-LCA) of a LCSA.
On the other hand, although weighted index is used in some works [27,43], single indicators are preferred by researchers to show results of the sustainability performance. In addition, a multicriteria decision-making framework is used in various product studies [32,37] to determine the most sustainable system.
Thus, the LCSA method is increasingly used to assess the sustainability of product systems, but is hardly applied in the assessment of service systems. The review of sustainability assessment approaches carried out by Wulf et al. [52] confirm that an increased number of studies applying LCSA have been published, but many questions concerning the methodology are still open and there is a need to develop more guiding principles. In order to apply LCSA to PSS, an approach that simultaneously considers aspects of products and services is required. This approach is developed in the following section.

3. Methodology

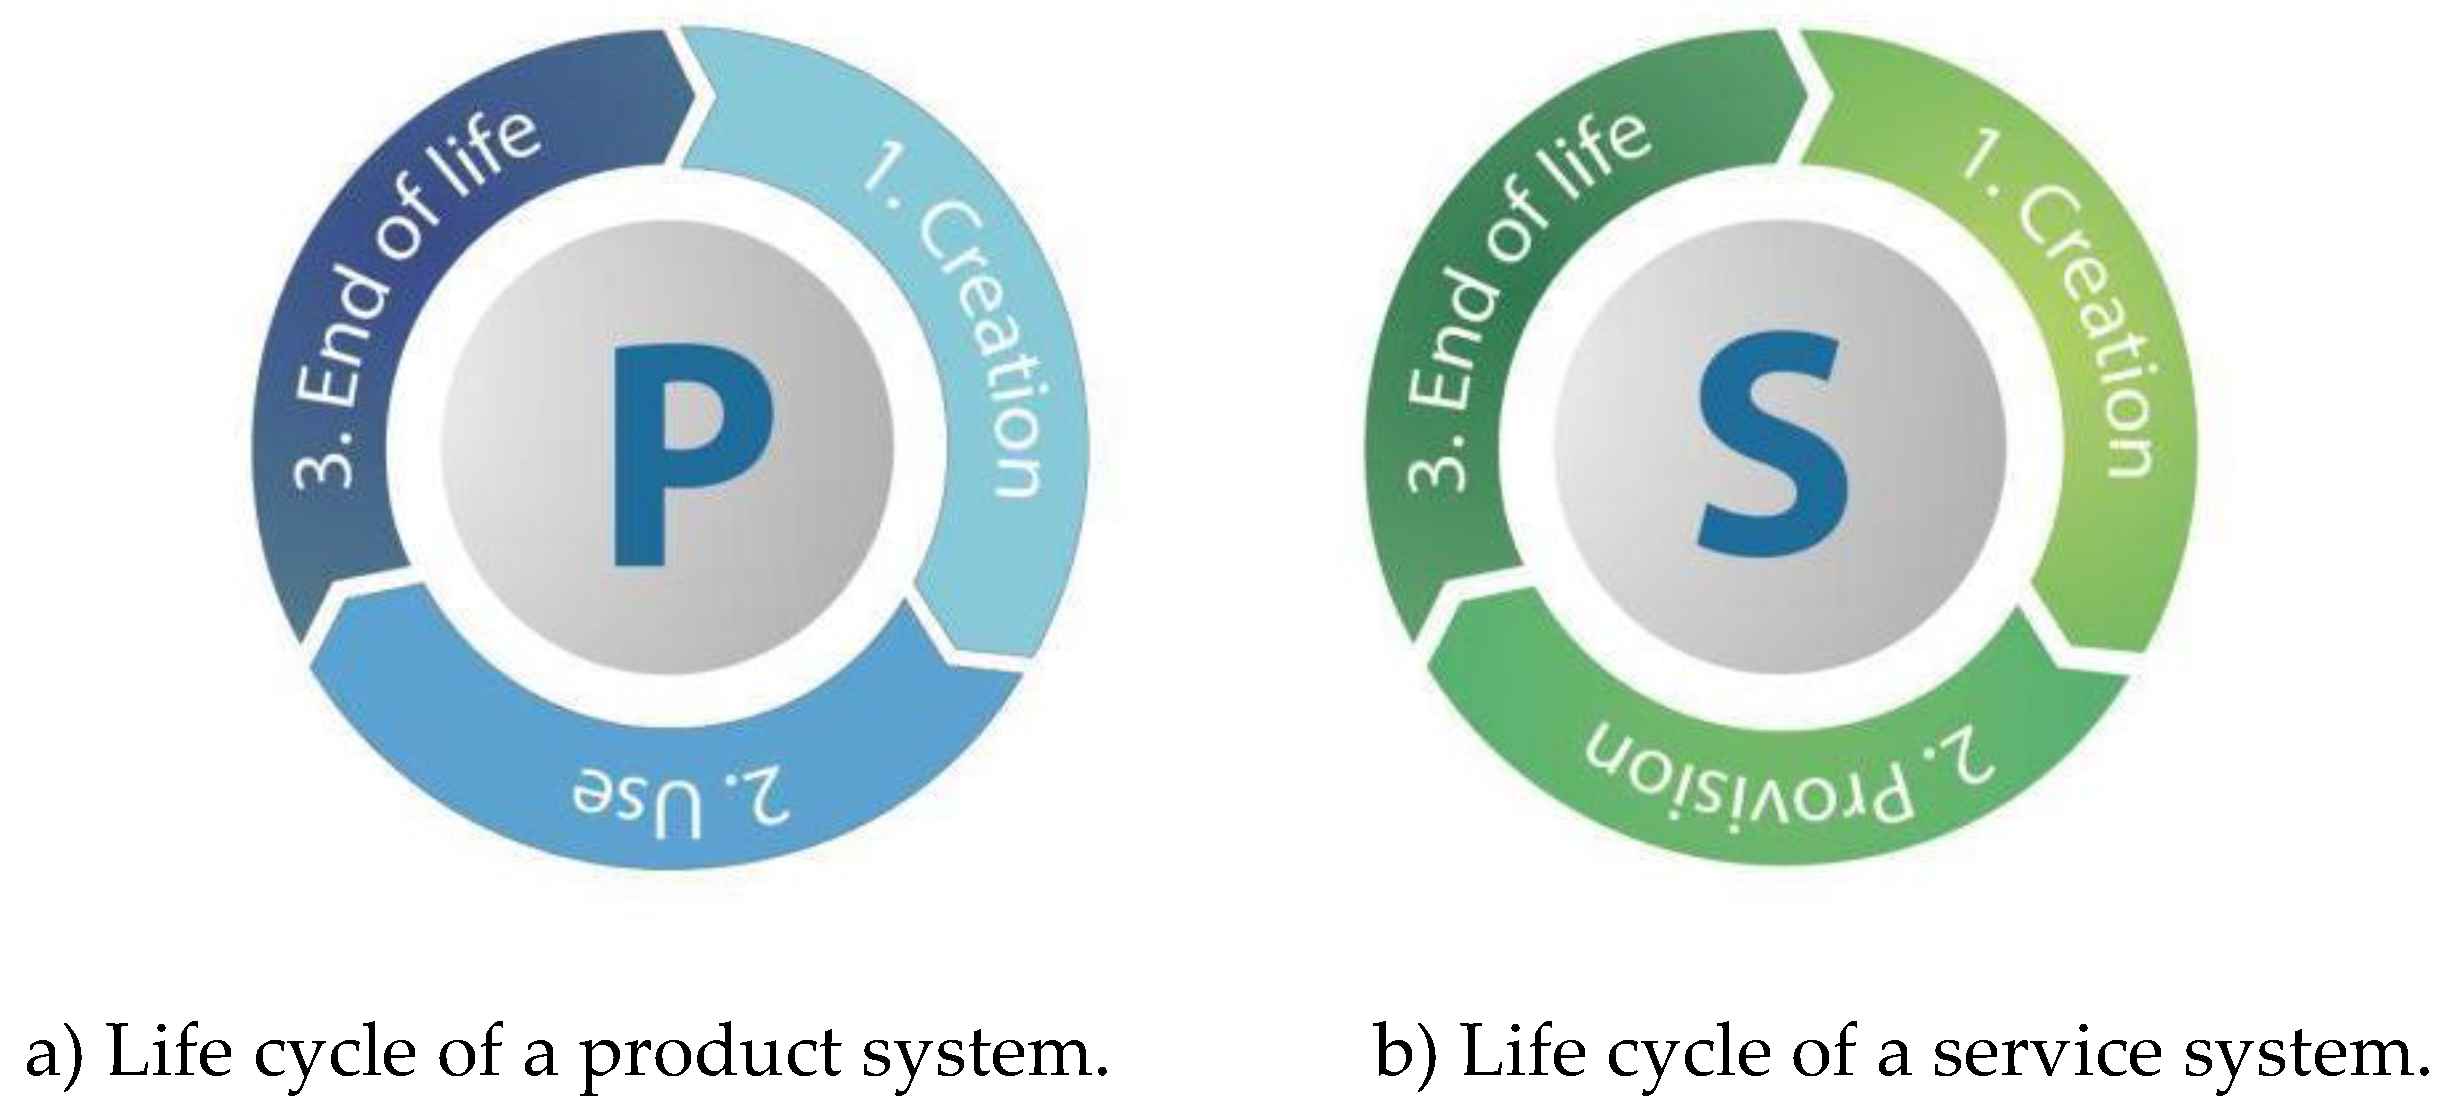
3.1. Flows between Systems Approach

Since both products and services are involved in a PSS, various life cycles should be taken into account to effectively assess sustainability. A simplified scheme, in which phases of the product life cycle can be grouped into phases prior to use, phases associated with use, and phases after use, is proposed in this work as elementary description of the life cycle. Phases such as raw materials extraction, manufacture and distribution, usually considered in the product life cycle, are included in the creation stage.
Thus, three main stages: 1. Creation, 2. Use and 3. End of life, can be differentiated in a product system, as shown in Figure 1a. Taking into account that both products and services aim at delivering satisfaction or creating utility, a similar scheme of three stages is proposed to describe the life cycle of a service system: 1. Creation; 2. Provision; 3. End of life, as displayed in Figure 1b. The service provision stage, which is based on satisfying the customer demands by the service provider, is the stage usually analysed in service development studies. Activities required for the service provision under optimal conditions are carried out in the creation stage. As the service provision is finished, the end of life stage includes the activities for a satisfactory treatment of all materials and resources that have been used.
A wide number of works regard PSS as a mix of products and services that are jointly capable of fulfilling specific consumers’ needs [4]. Thus, an approach focused on the business development to boost the sales of a product is provided. In this work, a wider perspective based on the flows between systems is proposed. Use and provision are, respectively, the main purpose of products and services, which leave from or enter another product or service system, generating a product–service flow. Two kinds of systems can be differentiated: the foreground system (FS), which refers to the main system object of study, and the background systems (BS), which refer to the systems supporting FS throughout its life cycle. Thus, a PSS is integrated by a bundle of product and service systems, in which a number of BS is involved in different stages of the FS life cycle.
A general scheme to show the flows between FS and BS as well as some examples of PSS, in which products and services are combined, are shown in Figure 2 (examples of PSS are, respectively, designated as i, ii, iii and iv). In each PSS, FS and BS are differentiated, and the life cycle stages of FS in which the BS is required or generated are highlighted. The general scheme has been used to describe PSS composed by a product of FS, in which different BS are involved as well as PSS composed by a service of FS in which a number of BS are identified. This graphic representation is proposed in this work to facilitate the definition of PSS boundaries and to identify connections between different systems. Thus, all systems involved in the study and the specific stages of each system to be analysed could be established according to the depth and the breadth of the study.
An important point in the analysis, comparison and characterization of the system´s performance is the definition of the functional unit (FU) as the reference unit that quantifies the primary function of the system. Doualle et al. [53], indicates that FU has to describe the functionality of the system including products and services when it is applied to PSS. In addition, to assess the impacts related to a main product in systems that generate coproducts, the allocation or partition of the flows between the studied system and one or more other systems should be established. For example, in dairy farms produces, milk and manure or wheat grains are simultaneously processed into flour and bran during the milling process. The allocation depends on whether or not the coproducts are fully utilised in the economy, and requires a good knowledge of utilisation proportions [54]. The ISO 14040-series [19] recommends using allocation to limit the system expansion. Thus, allocation applying physical and economic weights should be used for setting the proportions in which a system is involved in a PSS. These parameters or dimensions which are useful in a definition of a specific allocation and its assessment should be established.
A number of issues should be particularly addressed in each phase of the LCSA methodology according to the previously exposed approach based on the flows between systems, and taking into account that the FU identification and the allocation use are relevant to conveniently assess PSS sustainability. These issues are:
(i)
Goal and scope definition. Identification of the FS and BSs involved in PSS and detection of links between systems. FU definition so that it is referred to both products and services, to describe and compare the sustainability of the PSS.
(ii)
Life cycle sustainability inventory for each system included in the PSS. Inventory data can be expressed in accordance to the reference unit that quantifies each process or activity.
(iii)
Life cycle sustainability impact assessment in PSS. Sustainability results of the PSS should be expressed in accordance to the FU defined. Allocation could be applied in systems that generate coproducts.
(iv)
Interpretation of results. Analysis of PSS sustainability results. Relative impact of different systems and recommendations for decision-making process.

3.2. Sustainability Indicators

A set of suitable indicators should be selected in order to effectively assess the sustainability of PSS. In this work, the quantitative measure of the impacts in each sustainability dimension and the presentation of results without aggregation are respectively proposed in the selection of indicators and subsequent results interpretation. Thus, data can be easily compared with those obtained in other systems, and the improvement of a system can be effectively addressed.
Environmental dimension can be measured by the use of midpoint indicators [21]. Environmental unit indicators for a variety of products and basic services can be obtained from different data bases, which have been developed in the last decades based mostly on average data representing average production and supply conditions [55]. The global warming potential (GWP100), Acidification (Ac) and global energy (GE) indicators are used in this work to assess the environmental dimension. GWP100 represents total emissions of the greenhouse gases and it is the most used indicator in sustainability studies. Ac is an indicator commonly used to show the environmental impact of farming and livestock activities, and GE is an indicator frequently used in transport, manufacture and construction activities. These indicators are defined in Table 2.
An environmental indicator can be calculated using the corresponding unit indicator, which is obtained from different data bases. The following databases are used in this work. The Agri-footprint [56] and Probas [57] databases were applied to obtain unit impacts of a wide number of raw materials. In addition, the environmental module of Cype software was used to evaluate impacts in construction projects, the International Environmental Product Declaration (EPD) System [58] programme was applied to determinate energy consumptions in clothes production and the emission factors of electric commercial companies operating in Spain [59] were used to obtain greenhouse emissions due to energy consumption or fuel use.
For the economic and social dimension, different indicators to report and quantify overall data of each system object of study are proposed (Table 2). Particularly, the following economic indicators are used: the execution cost (CE) that expresses the total costs to develop an activity and the eco-efficiency (EE) that combines the economic and the environmental aspects [60]. On the other hand, the category of workers is selected to evaluate the social dimension of the sustainability and the working time (Tw) and the salary of the workers (Sw), are the quantifiable indicators considered to value social impacts. Nevertheless, an exhaustive sustainability assessment would require the study of other stakeholder groups.

4. Case Studies

Two different PSS are analysed, in which the FS objects of study are a product and a service, respectively. First, the production process of cow’s milk is studied using data measured in a dairy farm. Next, the sustainability of a clothing retail service, which is currently operated in the centre of a big city, is evaluated.

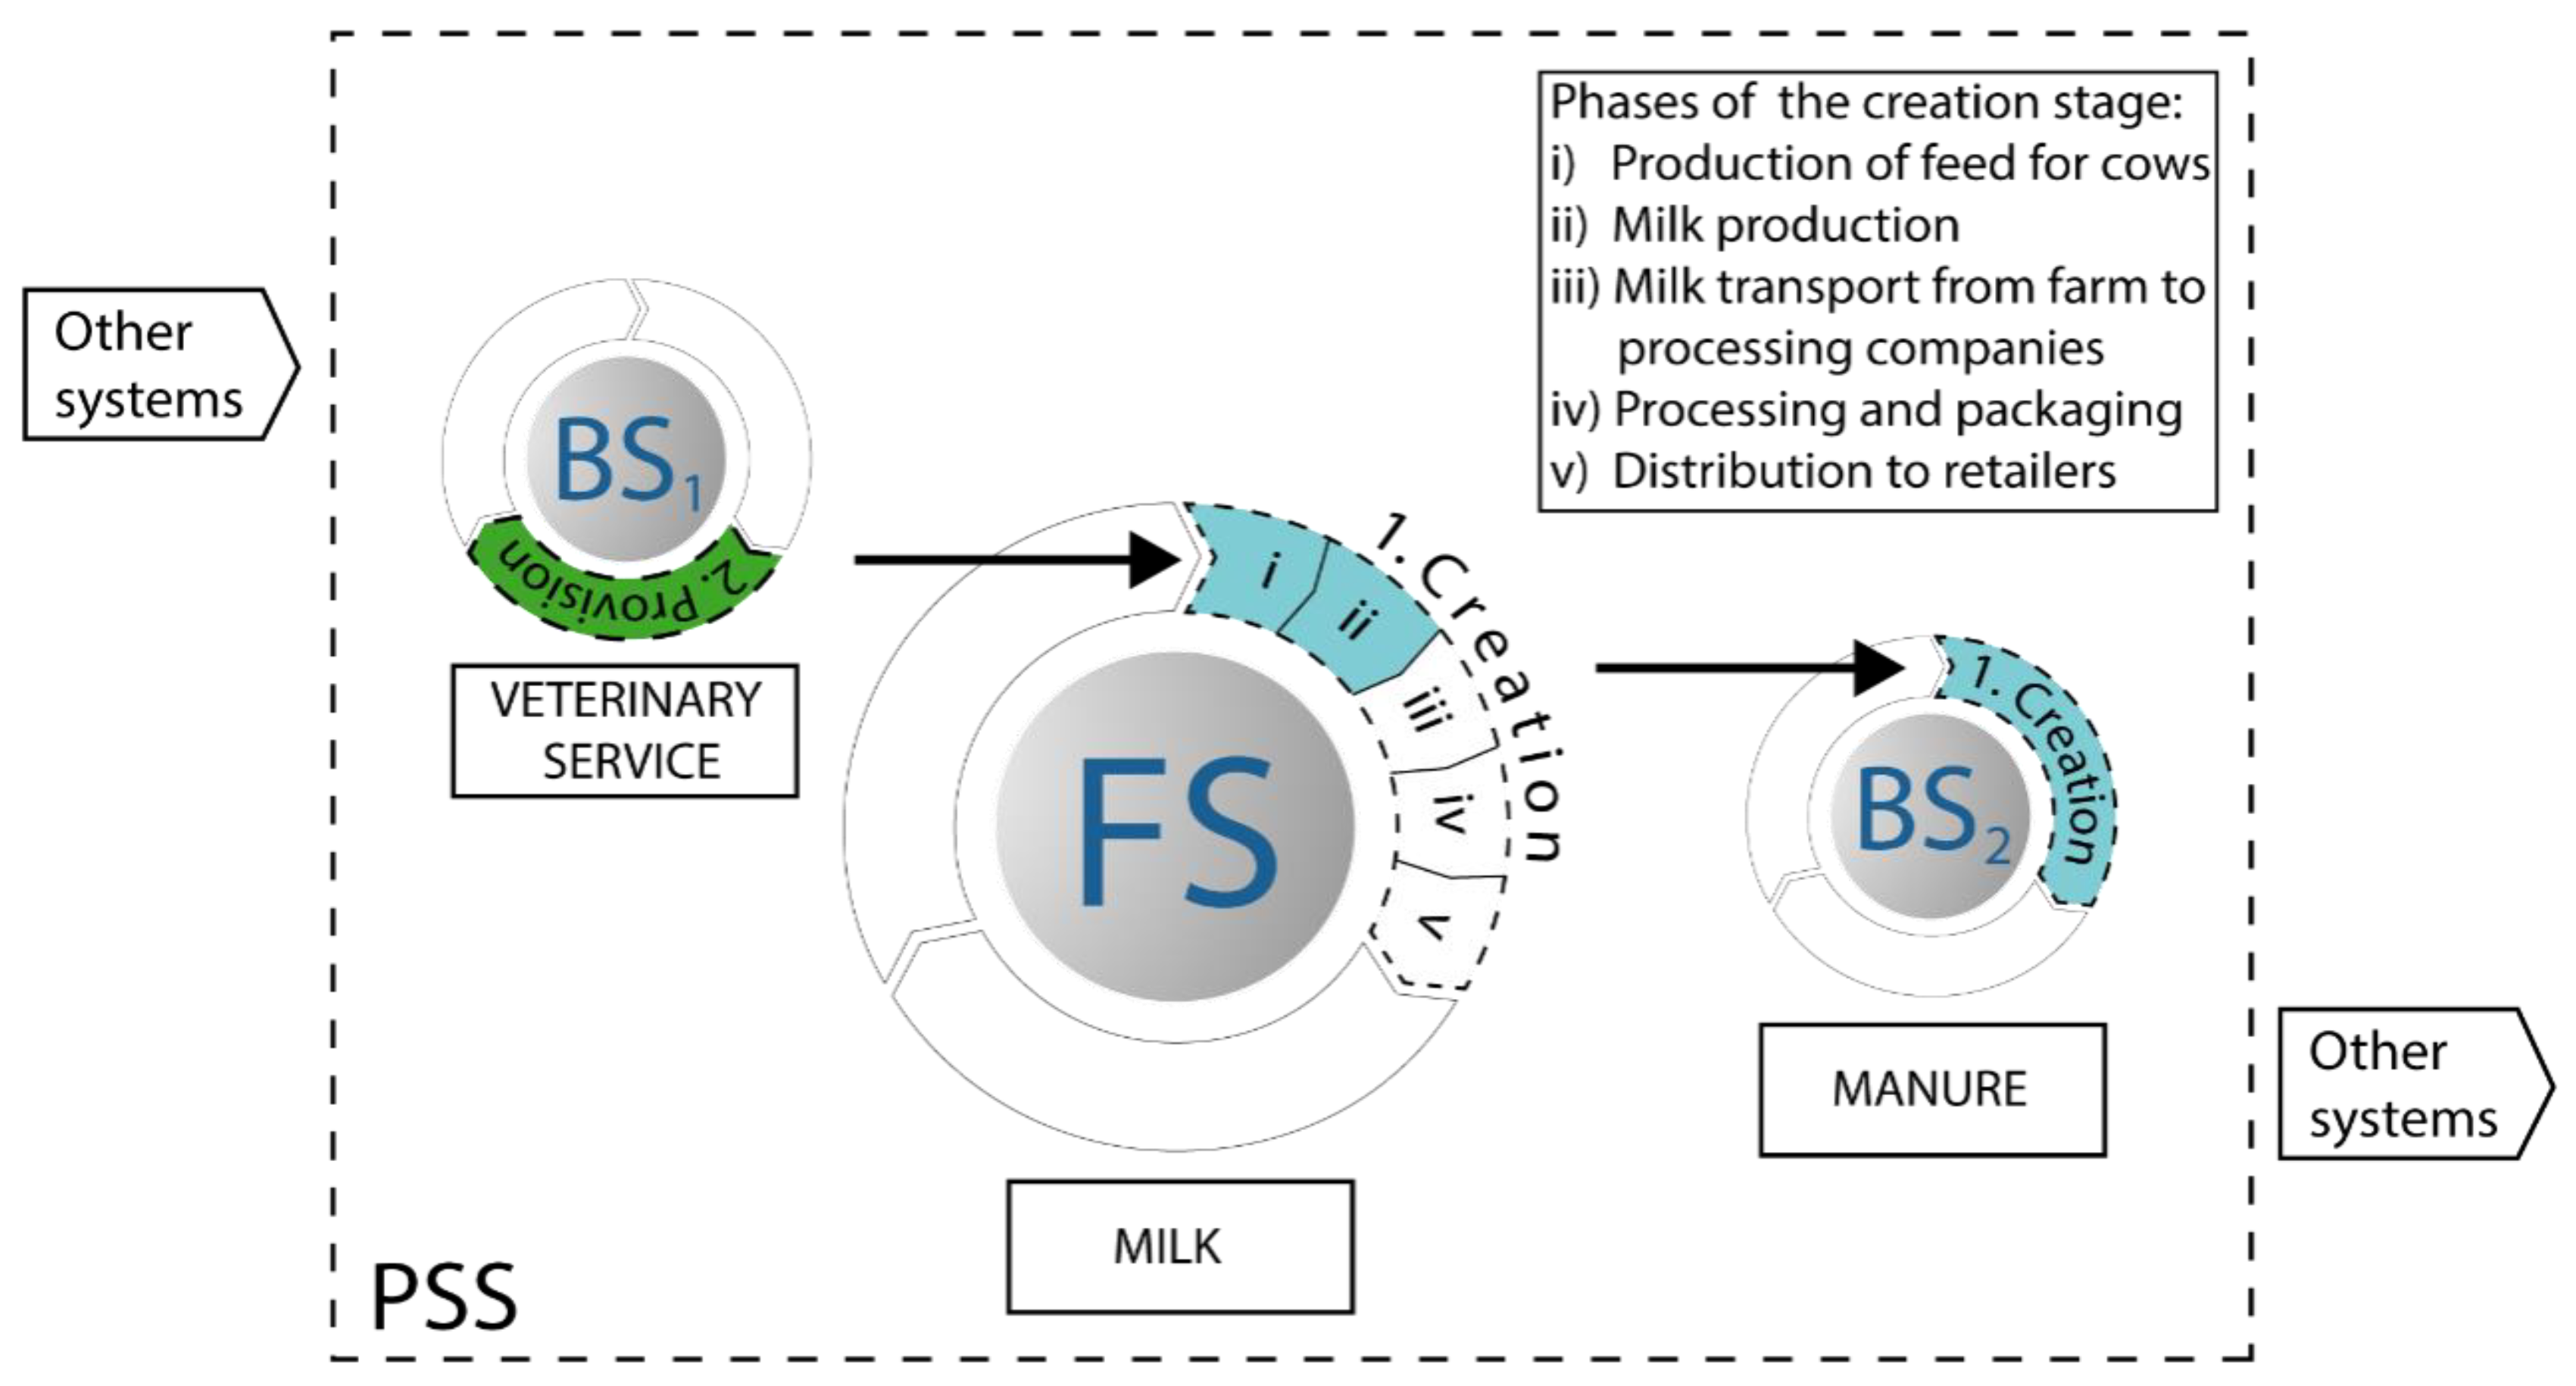
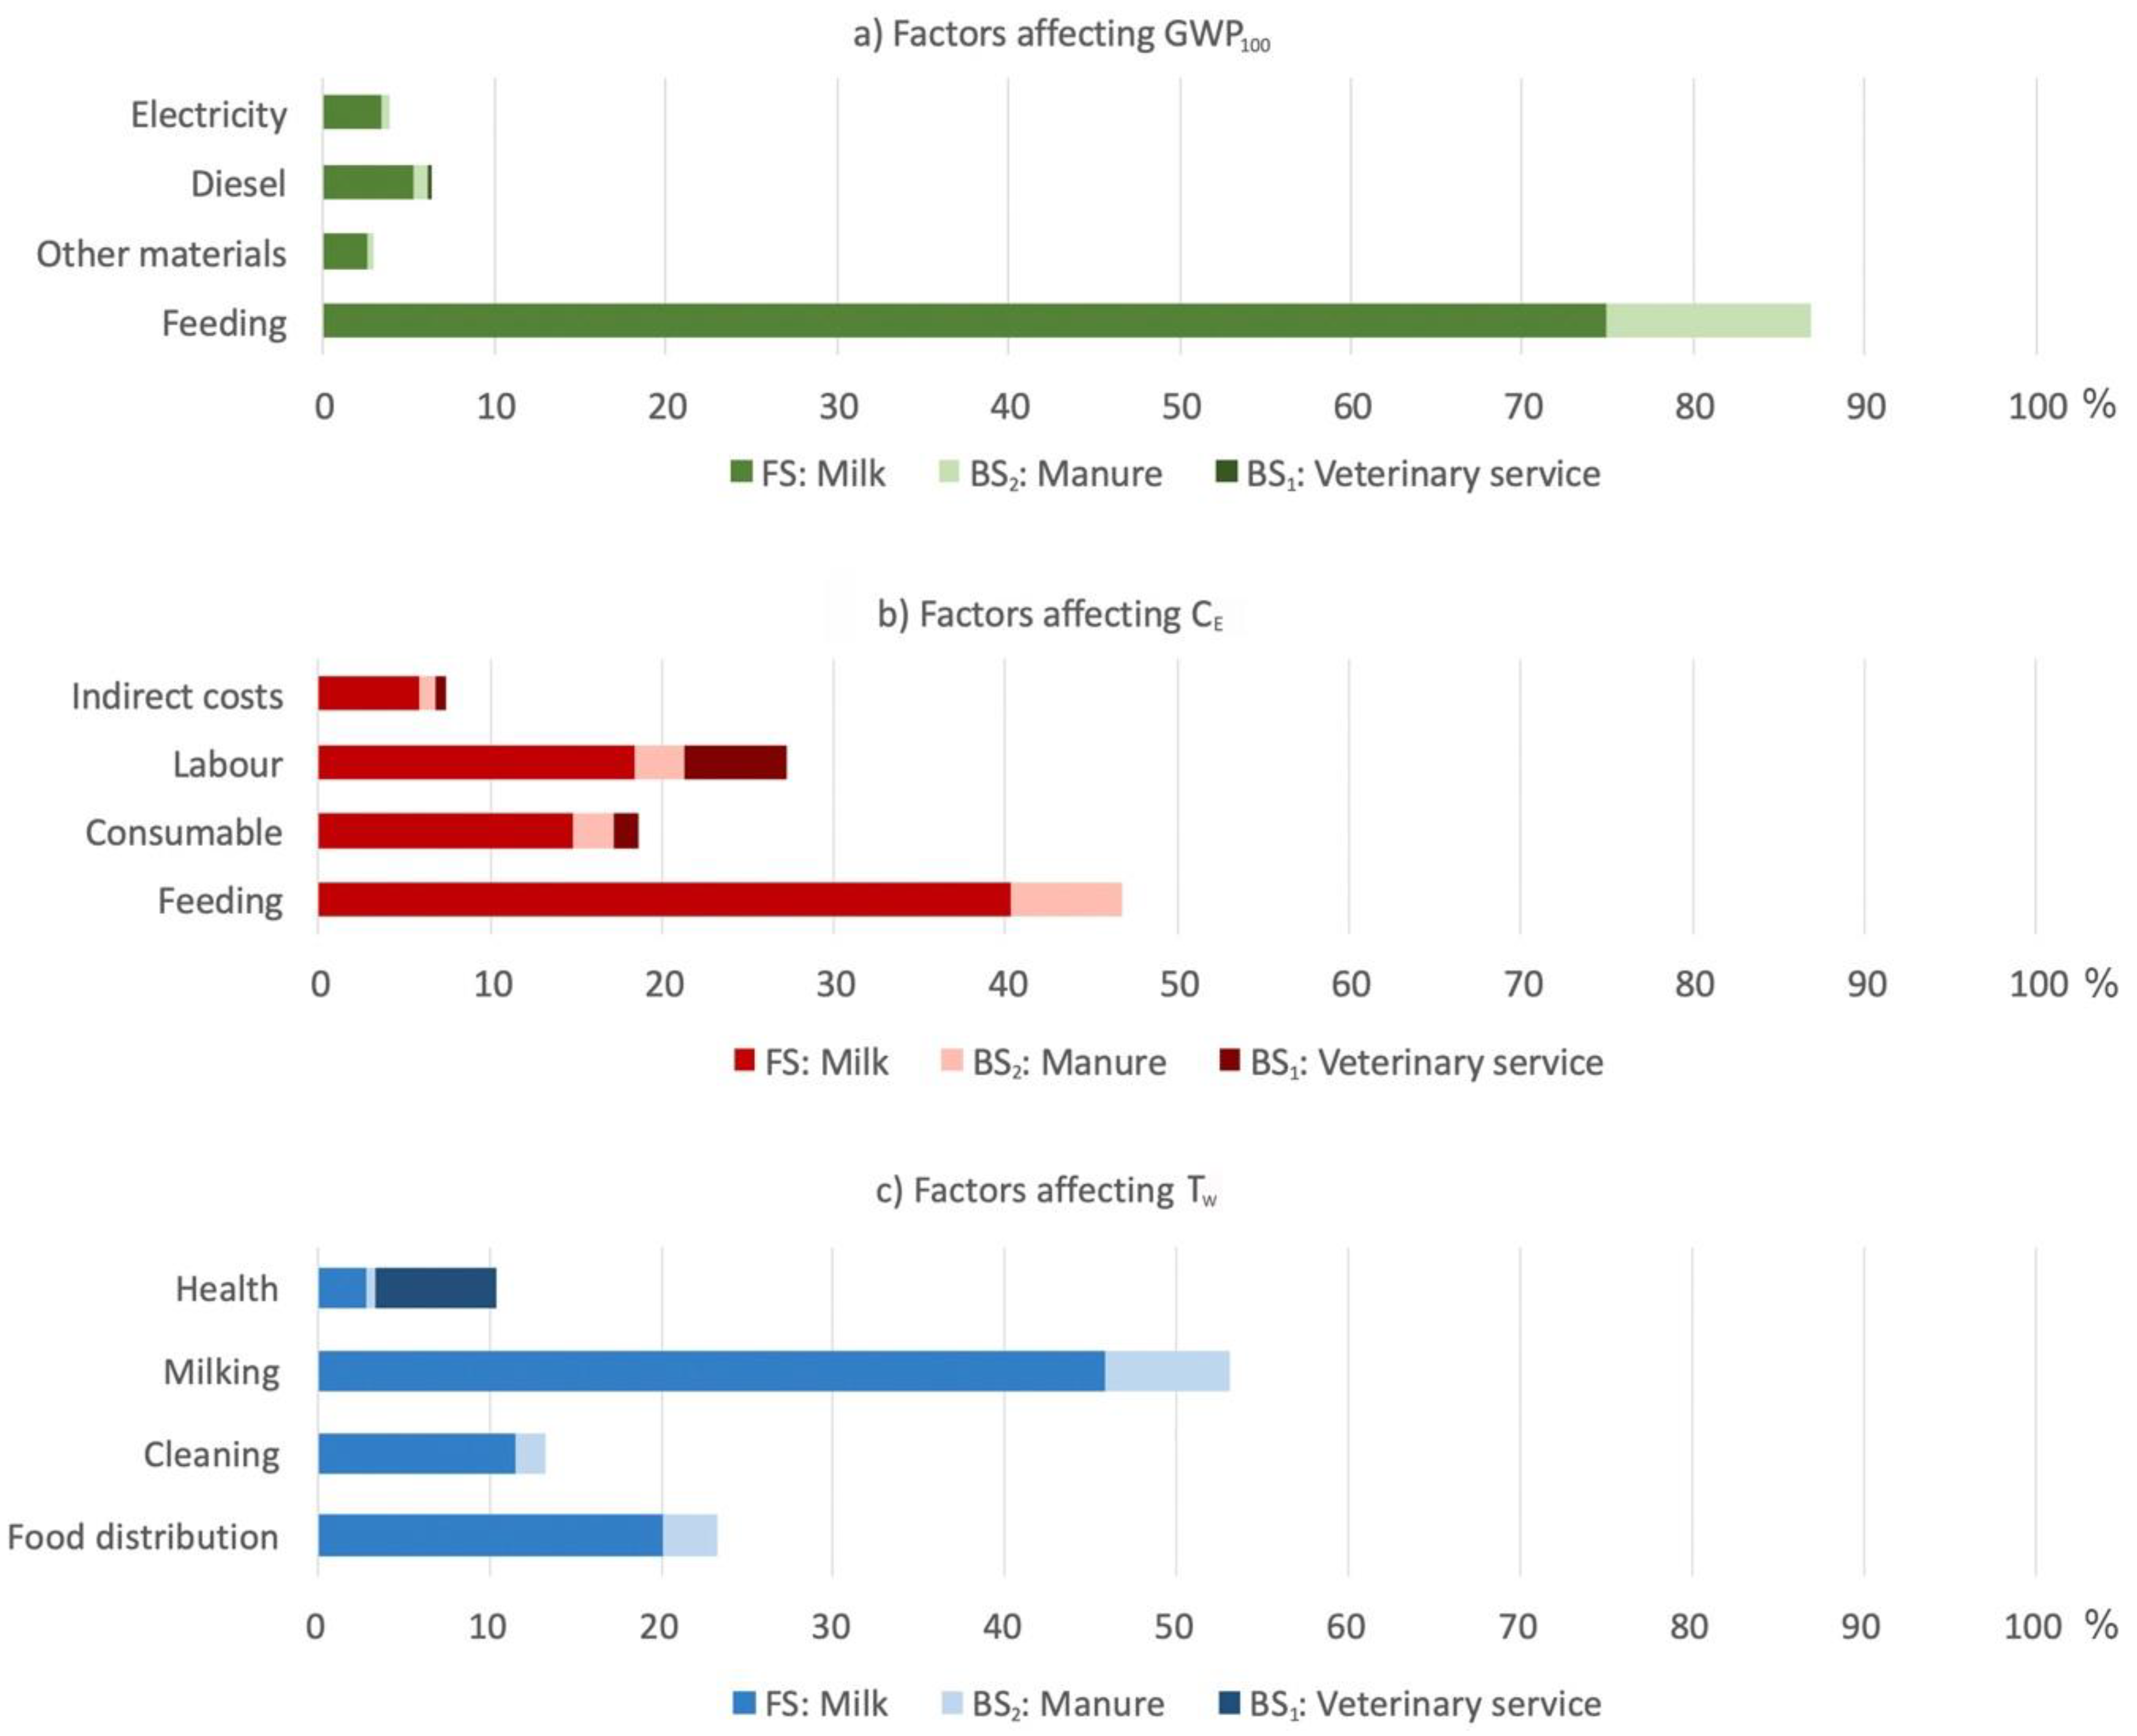
4.1. Case 1: Milk Production

The following phases are usually considered in the supply chain of the milk: (i) production of feed for cows; (ii) milk production; (iii) milk transport from farm to processing companies; (iv) processing and packaging; (v) distribution to retailers, (vi) use by the consumer. This study is focused on a limited number of phases in the product creation stage. Milk processing, packaging and distribution phases are not analysed. It is carried out in an intensive type farm with 38 cows. An average milk production of 1064 l is obtained each day.
Other systems are involved in the milk production process. A veterinary service is required to ensure the animal health and manure is also obtained as a coproduct. Figure 3 shows a scheme of the resulting PSS, in which two BS, (veterinary service, BS1, and manure, BS2) are involved in FS (milk).
Inventory for each system is obtained. Data of material inputs and energy consumptions in the dairy farm were gathered for one year [61]. Each cow consumes per day around 40 kg of food and between 80 and 100 L of water, depending on the season of the year. Feeding consists in three main components: corn silage, feed and alfalfa. Water is required in the feeding of animals and is also used in cleaning processes along with other products such as detergent, acid and protector. Medicines, which are periodically administered to the cows, straw that is used for conditioning the animals stay area and diesel for vehicles operation constitute the material inputs. Data expressed per litre of milk, are summarized in Table 3. These data are consistent with those measured in other studies [62,63].
The milk price in the region in which the study is carried out is 0.31 €/l [59]. Nevertheless, money inputs in the system do not only proceed from milk production. Other revenues are obtained by the sale of manure fertilizer. In particular, 2.44 kg of manure are obtained as a co-product per each litre of milk. Revenues due to both milk and manure production are shown in Table 3. The proportion in which each system is economically involved is, respectively, 86.3 and 13.7%. On the other hand, the main production costs in the dairy farm are due to the purchase of components for cows feeding, consumable (acquisition of other materials and electricity), labour and indirect costs (insurance payments and taxes). Other revenues such as those due to the commercialization of cows and young animals not destined for milk production and other costs such as those due to amortization of the dairy farm equipment, have not been considered in this analysis.
The activity of the veterinarian was also reviewed to obtain a number of significant data. A total of ten dairy farms are regularly visited within an extensive territory and each farm is usually visited once a week. Taking into account the average milk production, a total of 1.3 × 10⁻⁴ visits per litre of milk are obtained. The average distance that the veterinarian drives per visit is 110 km, which requires a fuel consumption of 6.8 l using a diesel van. The total working time includes both driving time, which is approximately 1.5 h and service delivery time in the farm, which is around 2.5 h. Its tariff is 99.1 € per visit, which includes labour (70.6 €) and other costs such as fuel and consumable.
The productive process within the dairy farm was analysed taking into account the following group of activities: mixing and distribution of food, water heating, milking, stables cleaning, milk cooling and activities associated with cow health. Energy consumptions and working times in these activities are shown in Table 3. All activities are carried out by only one worker in almost 50 weekly working hours.
The PSS sustainability was measured using those indicators shown in Table 2. In particular, GWP100 and Ac, commonly used in the dairy sector, are the indicators selected to assess the environmental impact, and the Agri-footprint [56] database is used to obtain unit impacts of raw materials. Sustainability indicators, expressed per functional unit, are shown in Table 4. In accordance with the PSS studied, FU is one litre of milk. In the environmental dimension, total values of 0.645 kgCO2-eq and 13.28 × 10⁻³ gSO2-eq are, respectively, obtained. In the economic dimension, PSS execution cost of 0.326 € and a global ecoefficiency of 0.5 €/kgCO2-eq are calculated. Finally, in the social dimension, accumulated working times and salaries by the farmer and veterinarian are 7.13 × 10⁻³ h and 0.081 €, respectively.
Reviewing the sustainability indicators of the veterinary service (BS1), we observe that the incidence of this BS is relatively small in the case of greenhouse emissions (0.31%) but significant in other PSS indicators such as acidification (4.3%), production costs (3.9%) and working time (7.4%). On the other hand, total greenhouse emissions of 0.643 kgCO2-eq, production costs of 0.313 € and working times of 6.6 × 10⁻³ h are obtained for both milk and manure production. Allocation applying economic weights is used to separately value indicators in product and coproduct. These are also shown in Table 4.
The most significant factors affecting PSS sustainability indicators are shown in Figure 4. Environmental, economic and social aspects are analysed. The percentage distribution of greenhouse emissions, production costs and working times is represented in Figure 4a–c, respectively. In each diagram, we can also observe the percentage contribution of each system (FS, BS1 and BS2) involved in the PSS.
It is noted that emissions due to feeding components (86.8%) are much higher than emissions due to other materials, diesel or electricity. Food also accounts for 46.7% of PSS costs but other costs as those due to labour are relatively high (27.2%). While, milking is the most time-consuming activity (53.1%), other activities such as the food distribution (23.4%) and stables cleaning (13.2%) are also notable.
A sensitivity analysis is also carried out to assess the uncertainty associated with two different factors: the amount of food consumed by animals and the distance that the veterinarian has to drive in order to visit the dairy farm. First, variation of ±9% in food mass was considered. The effects on GWP100, CE and Tw indicators are shown in Figure 5a. The results are compared with those obtained in the base case (40 Kg of food per cow and per day). Significant variations of ±7.6 and ±4.2% are, respectively, obtained in GWP100 and CE indicators, while Tw is practically unaffected.
On the other hand, the sensitivity to the distance driven by the vet was studied considering a distance range of 12–240 Km. The effects on GWP100, CE and Tw indicators are shown in Figure 5b. In relation to the base case (110 Km), only small variations can be detected in CE (−0.3 and +1.4%) and Tw (−2.5 and +3.2%) indicators. The GWP100 indicator is practically unaffected.

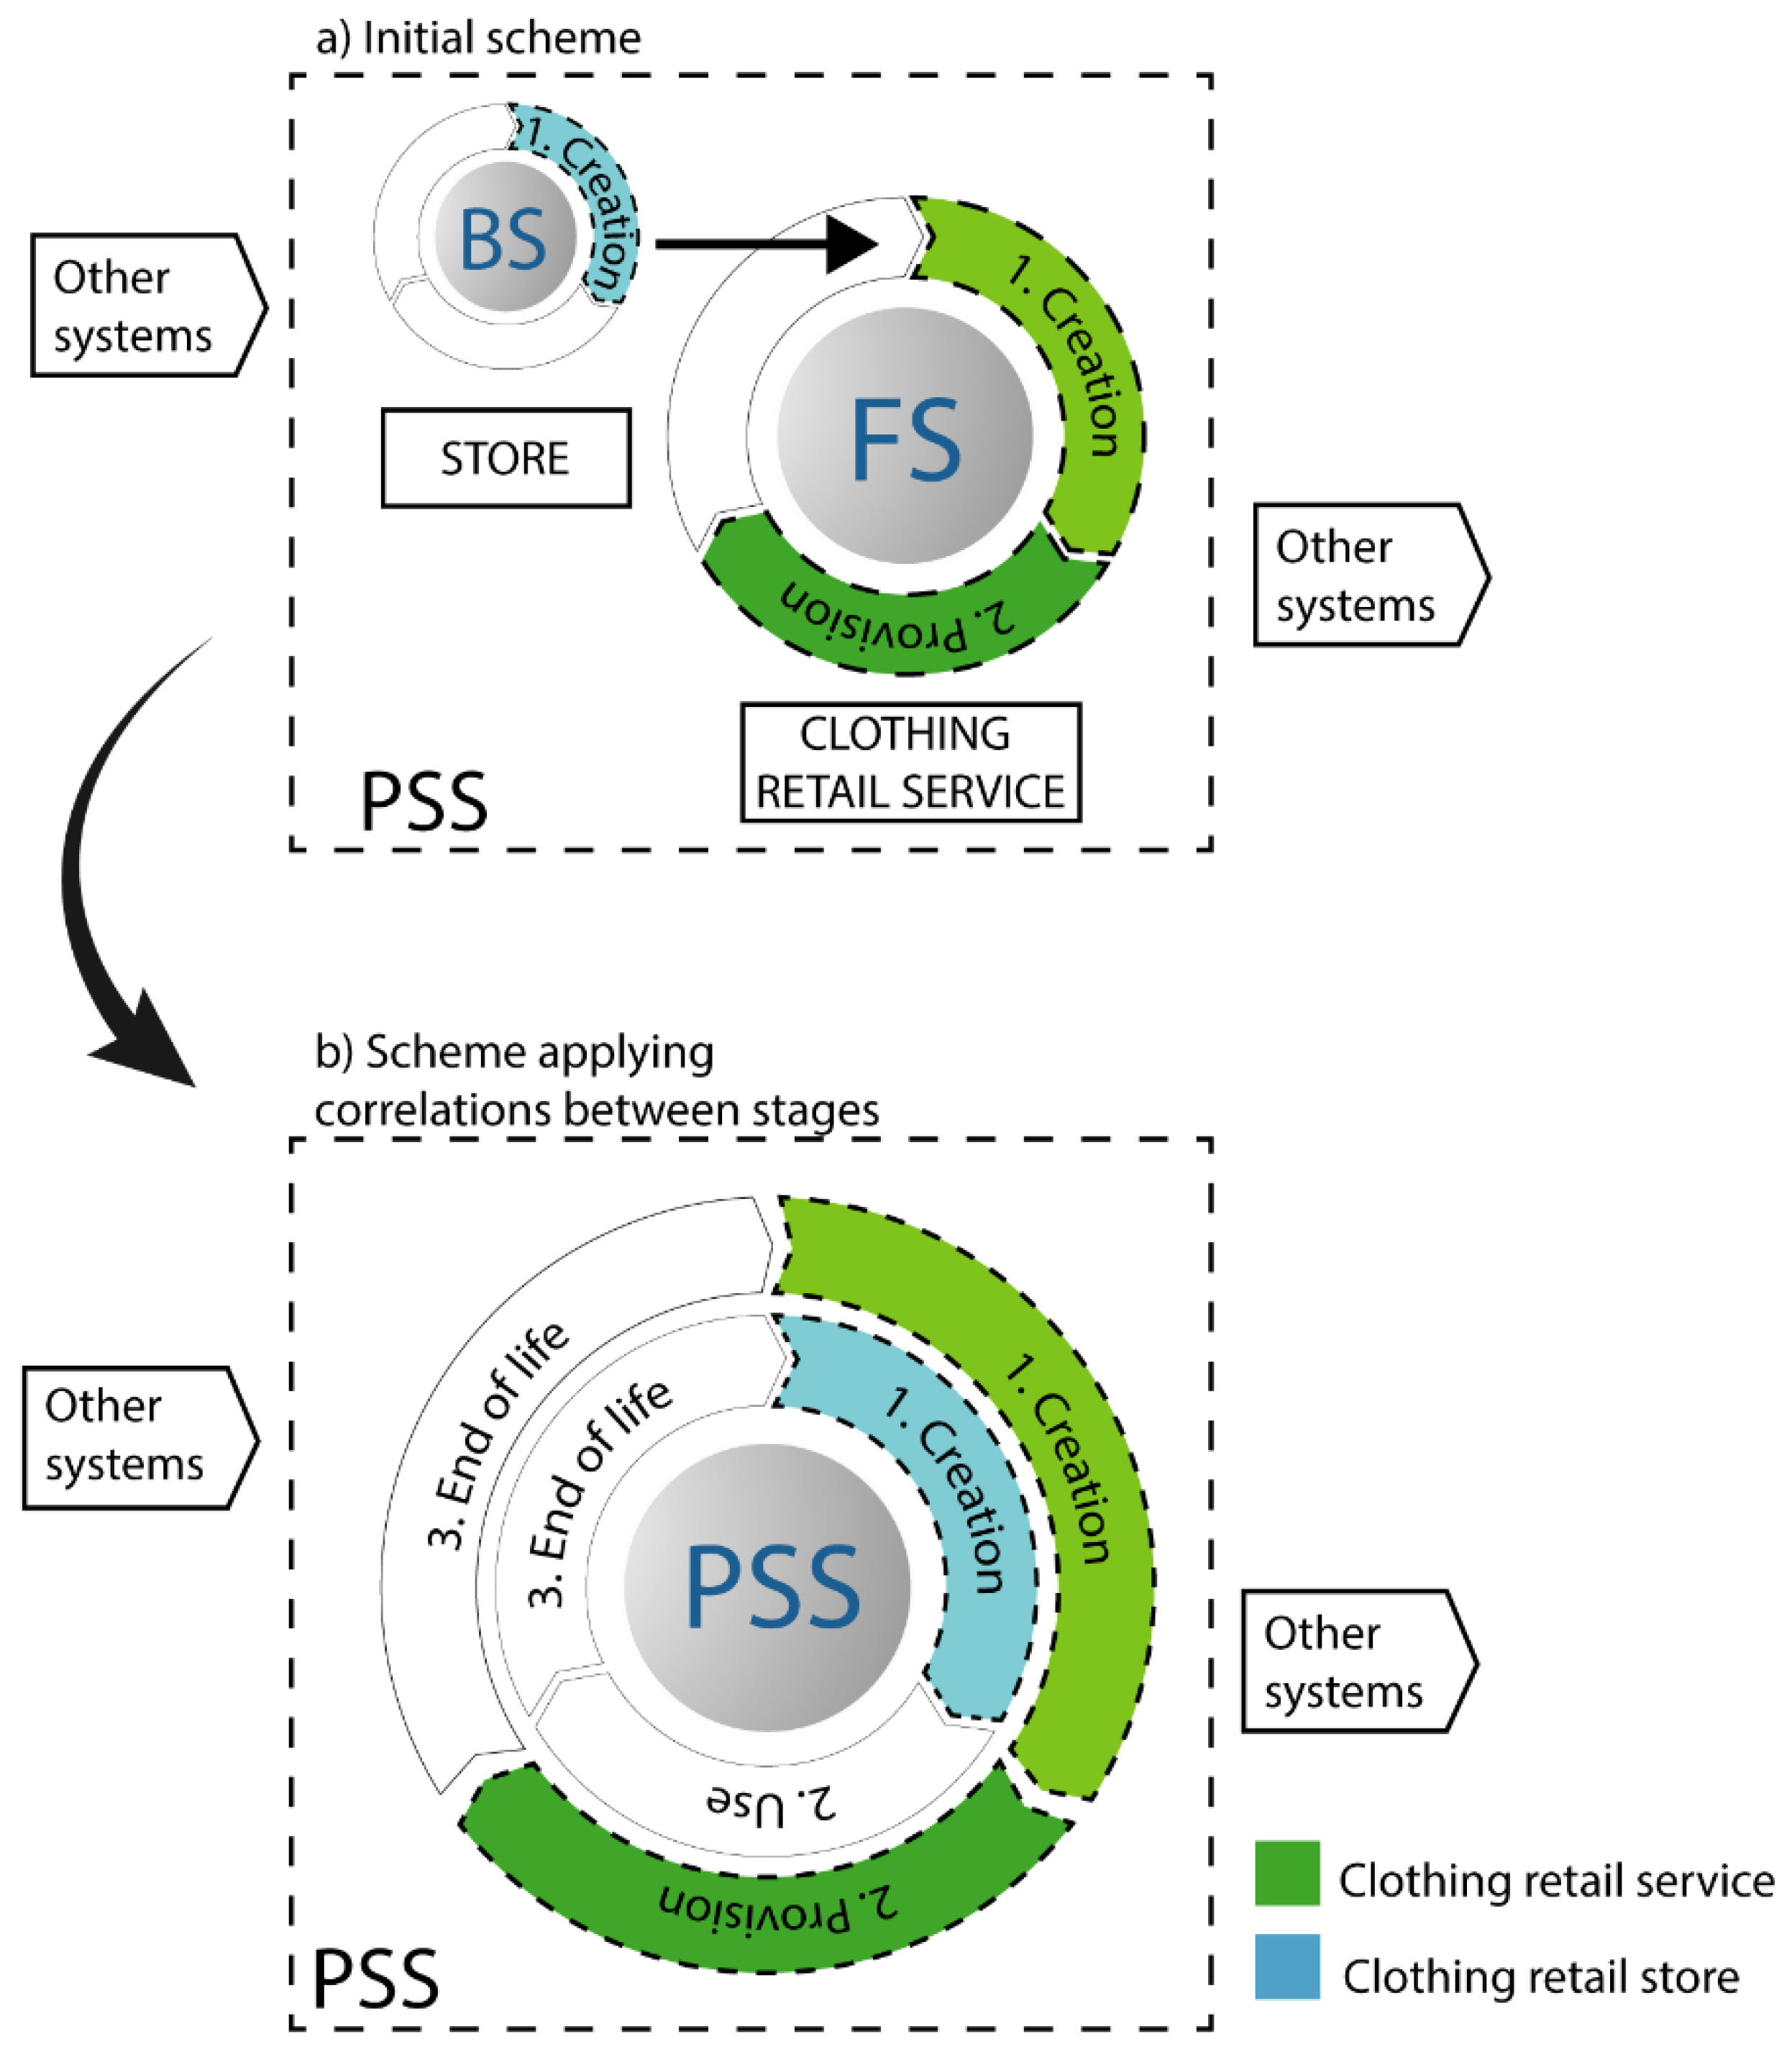
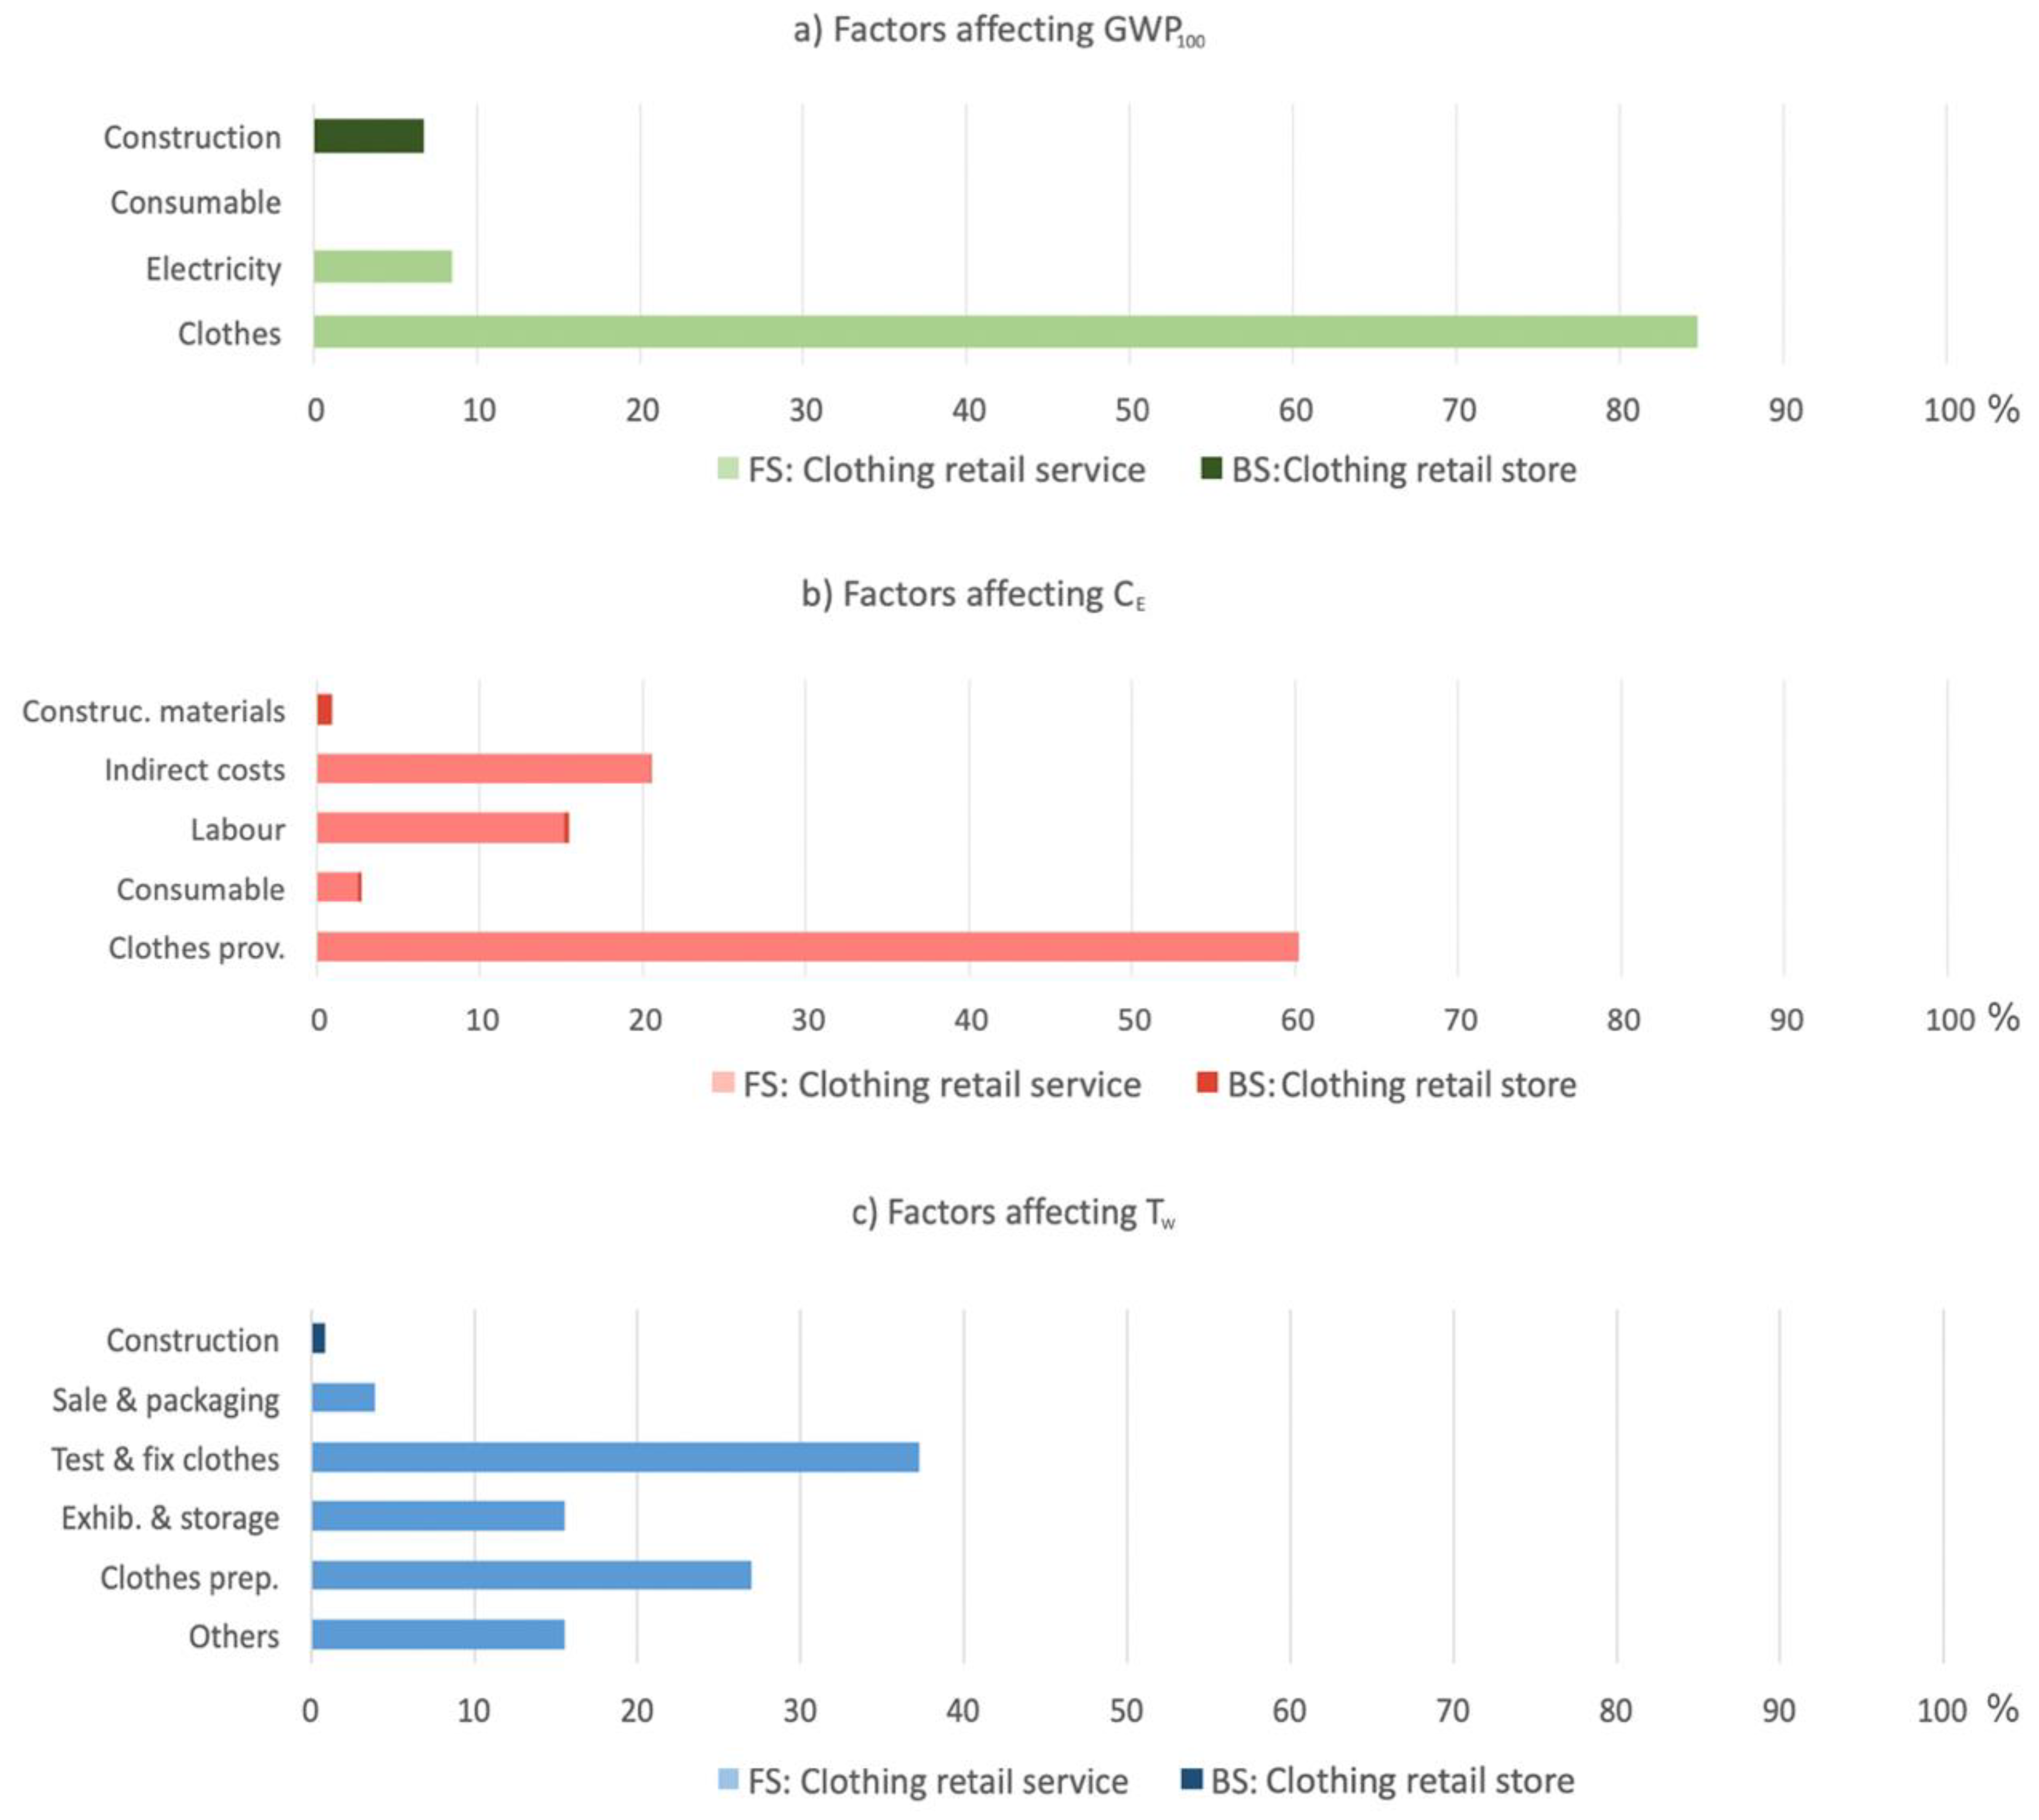
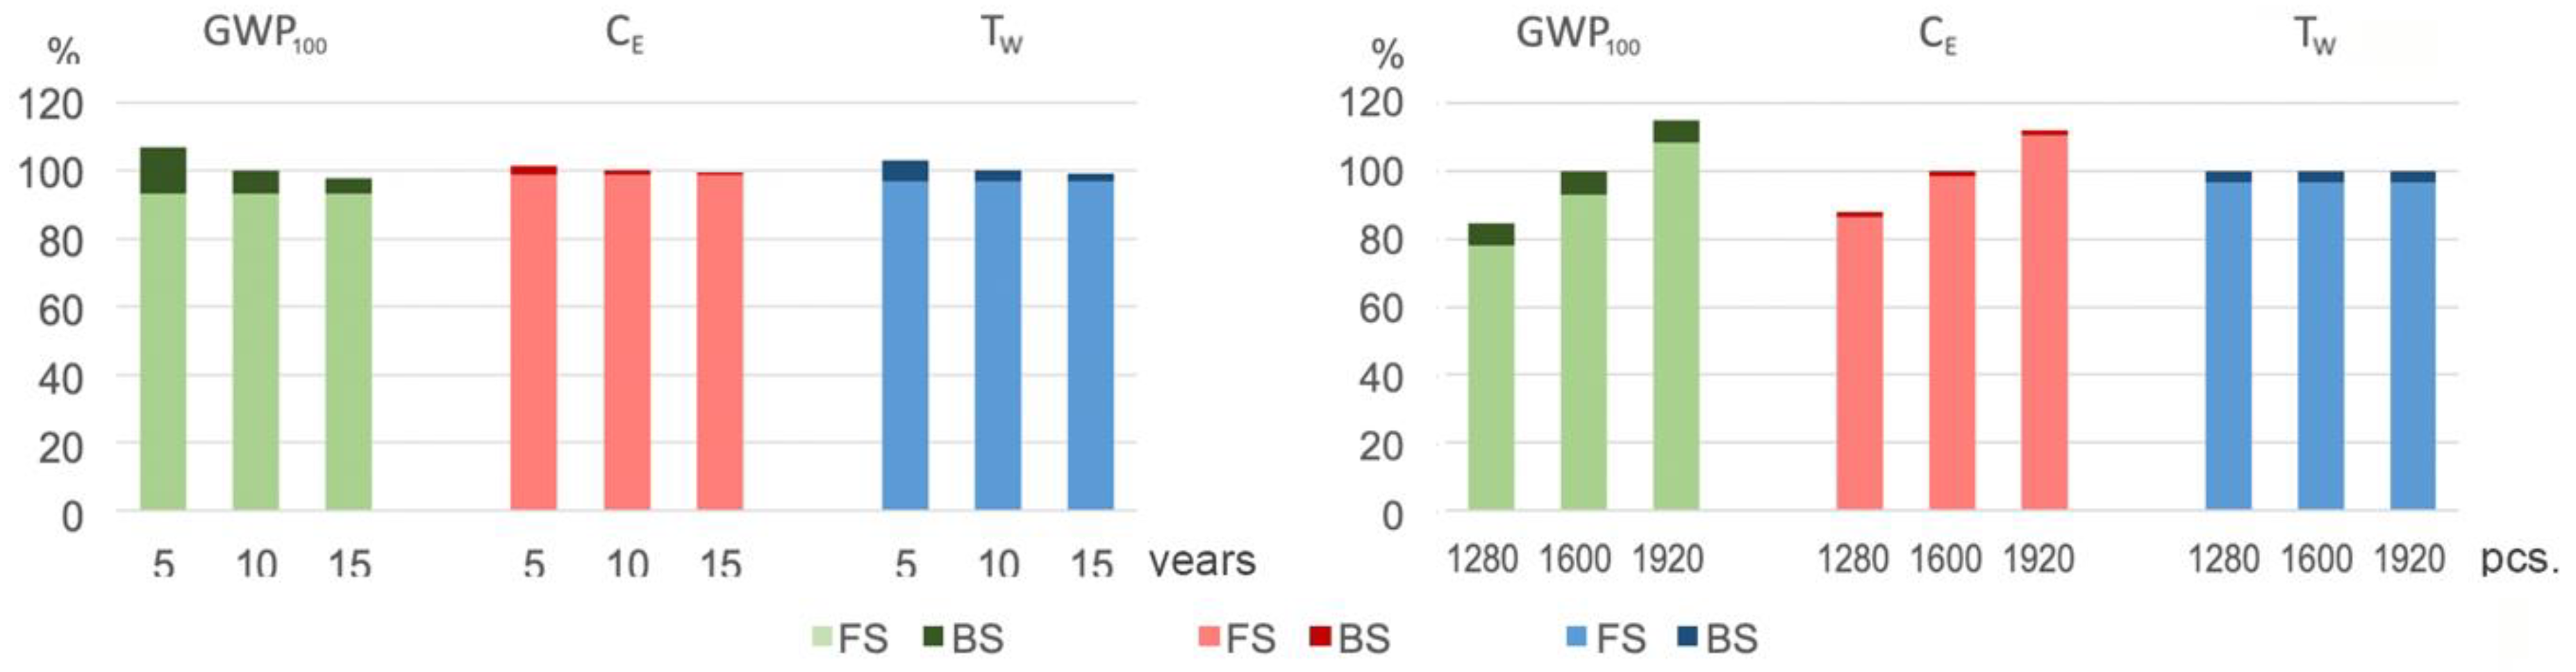
4.2. Case 2: Clothing Retail Service

In this case, the sustainability of a clothing retail service located in the centre of a big city is evaluated. People with a medium–high purchase power that seek a personalized attention are regular customers of this service. This study is focused on the creation and provision stages of the service life cycle.
The transformation of an empty area into a well-equipped store of 65.3 m2 was carried out in the creation stage. Thus, a construction product (BS) is involved in the service development (FS) such as is shown in Figure 6a. The life cycle stages of both service and construction product are particularly linked in this case. The product creation is required in the service creation stage, use of the construction product happens during the service provision stage, and finally, the deconstruction process and management of wastes generated should be carried out in the service’s end-of-life stage. A scheme that describes the correlation between the life cycle stages of each system is proposed in Figure 6b.
The inventory data in the creation and provision stages of the service life cycle were collected. In the creation stage, different materials are used, and a set of construction activities are developed to achieve well-equipped clothing retail store. Standard EN 15804:2012+A2:2019 [64] is applied to identify the life cycle stages of the construction product. Thus, phases refer to the extraction of materials, transport and manufacture, as well as those associated to the transport of manufactured materials to the construction site and construction or installation processes are taken into account. Data of materials required, energy consumptions, execution costs and working times were obtained by means of Cype software, which is used in construction projects. Details of all activities required, as well as extensive inventory data associated to the construction process of the clothing retail store can be consulted in Muñoz et al. [65]. A summary of these data, in which a total of six groups of activities are considered, is presented in Table 5.
On the other hand, the service provision performance was analysed. Operation of the clothing retail service is carried out by two workers, each working 38.5 hours weekly. Their activities were classified in the following groups: (i) clothes preparation, which includes reception and unpacking of the merchandise supplied from the textile industry, classification, ironing and labelling of the clothes received; (ii) storage and display; (iii) test and fix of clothes, in which personalized attention to customers in the selection and trying-on of clothes is carried out; (iv) sale and packaging of the clothes and customer charge; (v) others activities such as cleaning of the store and service management. Working times and energy consumptions in each group of activities due to the use of different equipment, as well as the consumptions of different materials are shown in Table 6. Data were collected over one year and are expressed per customer visit. A total number of 336 visits were registered in the clothing retail service during the reference year. Four types of customers were differentiated: seasonal, monthly, on offers and special event customers.
In addition, the costs associated to the service operation were determined. Operating costs were classified into four groups: clothes provision, labour, consumable and indirect costs. Clothes provision counts the initial expenditure carried out by the service provider to buy merchandise. Two clothing collections of around 800 items are purchased each year. Costs due to energy consumption and acquisition of materials used in packaging, sewing or cleaning activities are included in consumable. Indirect costs take into account insurance payments and taxes. Data are summarized in Table 6.
The database of the International EPD System [58] was used to assess the environmental impact in clothes. The EPD for ISKO26632 finished denim fabric jeans in accordance with ISO 14025 was applied to the half of the clothes acquired, and the EPD for t-shirt 7046 THV was applied to the other half of clothes. Final PSS sustainability indicators expressing per functional unit are shown in Table 7. In this case, FU is one customer visit. Only customer visits in which clothes are acquired were computed. A total operation time of ten years was also considered.
If environmental indicators are reviewed, total greenhouse emissions of 0.487 kgCO2-eq and energy consumption of 10.55 MJ are obtained. In the economic dimension, total costs of 10.25 € and a global ecoefficiency of 21.04 €/kg CO2-eq are obtained. The accumulated working times and salaries of both service providers and workers involved in the store construction are 0.152 h and 0.71 €, respectively. We can observe that indicators calculated in the service operation are much higher than those obtained in the store construction. In all dimensions, more than 93% of the PSS impacts are caused by the clothing retail service.
The incidence of FS and BS on the PSS sustainability considering different impact factors is shown in Figure 7. The percentage distribution diagrams of GWP100, CE and Tw indicators are represented in Figure 7a–c, respectively. It is observed that clothes provision is the most important impact factor in both environmental and economic dimension, since it accounts for 84.7% of greenhouse emissions and 60% of execution costs. In contrast, in the social dimension, the activities associated to test and fix clothes (36.3%) and clothes preparation (26.3%) have high incidence in the working time indicator. Store construction only accounts for 6.7% of GWP100, 1.2% of CE and 1% of Tw.
The assessment of the PSS sustainability is based on the assumption that the clothing retail service is operating over ten years. Other scenarios of five and fifteen years, respectively, can be also considered. Sensitivity of the PSS sustainability to the total operation time is presented in Figure 8a. Results show that impacts reduce if service operation time increases. In the scenario in which the service operates for fifteen years in comparison to five years, the GWP100, CE and Tw decrease by, 9.6, 1.6 and 4.1%, respectively. In addition, the sensitivity of the PSS sustainability due to the variation of ±20% in the number of clothes acquired was analysed. We observe in Figure 8b that a substantial variation of ±15.2 and ±12.1% (compared to the base case) is produced in the GWP100 and CE indicators, respectively. Social indicator is hardly affected.

5. Conclusions

In this work, the sustainability assessment of PSS was addressed, giving special attention to adequately defining the initial structure of these systems. An approach based on the flows between product and service systems was proposed to facilitate the comprehensive study of the links between the systems involved. This perspective, in which products and services leave from or enter another product and service system, subsequently generating a product–service flow, allowed for the identification of the distinction between the foreground system (FS) and background systems (BS), which support FS along its life cycle. In order to simultaneously evaluate environmental, economic and social aspects of the sustainability, the LCSA methodology was applied. In each phase of the LCSA method, specific PSS aspects such as the FU definition referring to product and service systems, the identification of PSS boundaries, and the analysis of the sustainability results, taking into account the relative incidence of each system, were included.
Two different cases were the objects of study. In the first case, the milk production process was studied, taking into account that manure is also obtained as a coproduct and a veterinary service is required. In the second case, the development of a clothing retail service was analysed, including the store construction process. In both cases, FS and BS were identified, PSS boundaries were defined and links between involved systems were established using flows between systems approach. A quantitative assessment of the sustainability was obtained in each case by applying a set of indicators referring to each sustainability dimension. In particular, the global warming potential (GWP100), the execution cost (CE) and the working time (TW) indicators have been used to analyse sustainability results.
The incidence of each system on the PSS sustainability were evaluated in each case study. In the milk production case, the economic proportion allocation of 86.3 and 13.7% was applied to separately evaluate impacts of milk and manure. The veterinary service accounts, respectively, for 4% and 7.4% of the cost and working time indicators, and its incidence on the environmental indicators is less than 1%. In the clothing retail case, the store construction accounts for 6.7% of GWP100, 1.2% of CE and 3.2% of TW.
Furthermore, the identification of factors affecting PSS sustainability and the determination of their relative impact was carried out in each case object of study. In the milk production case, the results show that cow feeding is a very relevant impact factor in environmental (86.8% of GWP100) and economic (46.7% of CE) indicators. Labour is also a notable impact factor in CE (27.2%). In the social dimension, milking is the most time-consuming activity (53.1% of Tw). Sensitivity of the PSS sustainability indicators to both amount of food consumed by animals and distance driven by the veterinarian were also reviewed. Variations of ±7.6 and ±4.2% were obtained in GWP100 and CE indicators, respectively, due to variations of ±9% in cow feeding. CE and Tw indicators range 1.7 and 5.7%, respectively, if the distance driven by the vet is modified.
In the clothing retail case, results show that clothes provision is the most important impact factor in greenhouse emissions (84.7%) and execution costs (60%). While, test and fix of clothes (36.3%) and clothes preparation (26.3%) are the most influential activities in the working time distribution. In addition, the sensitivity of the PSS sustainability due to uncertainties in two different factors was analysed. Variations of ±20% in the clothes provision factor cause variations of ±15.2 and ±12.1% in the GWP100 and CE indicators, respectively. In contrast, variations of ±50% in the operation time of the service generation, and variations of ±4.8, ±0.8 and ±2.1% in GWP100, CE and Tw indicators, respectively, were observed.
Thus, the sustainability of two different PSS was assessed and the incidence of different factors was analysed. Future research works should expand the PSS study boundaries, adding other involved background systems, and the entire life cycle of products and services should be considered for a complete sustainability assessment of systems. Finally, a more sustainable design of PSS or the redesign of existing systems could be addressed using results of the most important factors affecting PSS sustainability.

Author Contributions

Conceptualization, J.L.S.S.; data curation, N.M.L.; investigation, N.M.L., J.L.S.S., A.B. and A.S.T.; methodology, N.M.L. and J.L.S.S.; software, N.M.L., A.B. and A.S.T.; supervision, A.B.; validation, J.L.S.S. and A.S.T.; visualization, A.B. and A.S.T.; writing—original draft, J.L.S.S.; writing—review and editing, N.M.L., J.L.S.S. and A.B. All authors have read and agree to the published version of the manuscript.

Funding

This research received no external funding.

Conflicts of Interest

The authors declare no conflict of interest.

References

  1. Pigosso, D.C.A.; McAloone, T.C. Maturity-based approach for the development of environmentally sustainable product/service-systems. CIRP J. Manuf. Sci. Technol. 2016, 15, 33–41. [Google Scholar] [CrossRef] [Green Version]
  2. Morelli, N. Developing new product service systems (PSS): methodologies and operational tools. J. Clean. Prod. 2006, 14, 1495–1501. [Google Scholar] [CrossRef]
  3. Tukker, A.; Tischner, U. Product-services as a research field: past, present and future. Reflections from a decade of research. J. Clean. Prod. 2006, 14, 1552–1556. [Google Scholar] [CrossRef]
  4. United Nations Environment Programme (UNEP). 2015. Using Product-Service Systems to Enhance Sustainable Public Procurement. Available online: http://www.unep.org/10yfp/Portals/50150/10YFP%20SPP/3A_Technical%20report.pdf (accessed on 15 August 2015).
  5. Tukker, A. Product services for a resource-efficient and circular economy – a review. J. Clean. Prod. 2015, 97, 76–91. [Google Scholar] [CrossRef]
  6. Ashford, N.; Hall, R. The Importance of Regulation-Induced Innovation for Sustainable Development. Sustainability 2011, 3, 270–292. [Google Scholar] [CrossRef] [Green Version]
  7. Boehm, M.; Thomas, O. Looking beyond the rim of one’s teacup: a multidisciplinary literature review of Product-Service Systems in Information Systems, Business Management, and Engineering & Design. J. Clean. Prod. 2013, 51, 245–260. [Google Scholar] [CrossRef]
  8. Vezzoli, C.; Kohtala, C.; Srinivasan, A. Product-Service System Design for Sustainability; Greenleaf Publishing: Sheffield, UK, 2014. [Google Scholar]
  9. Chen, C.-W. Guidance on the Conceptual Design of Sustainable Product–Service Systems. Sustainability 2018, 10, 2452. [Google Scholar] [CrossRef] [Green Version]
  10. Nasiri, M.; Rantala, T.; Saunila, M.; Ukko, J.; Rantanen, H. Transition towards Sustainable Solutions: Product, Service, Technology, and Business Model. Sustainability 2018, 10, 358. [Google Scholar] [CrossRef] [Green Version]
  11. Sousa-Zomer, T.; Cauchick-Miguel, P.A. Sustainable business models as an innovation strategy in the water sector: An empirical investigation of a sustainable product-service system. J. Clean. Prod. 2018, 171, S119–S129. [Google Scholar] [CrossRef]
  12. Kloepffer, W. Life-cycle based sustainability assessments as part of LCM. In Proceedings of the 3rd LCM Conference, Zurich, Switzerland, 27–29 August 2007. [Google Scholar]
  13. Finkbeiner, M.; Schau, E.; Lehmann, A.; Traverso, M. Towards Life Cycle Sustainability Assessment. Sustainability 2010, 2, 3309–3322. [Google Scholar] [CrossRef] [Green Version]
  14. Lacasa, E.; Santolaya, J.; Biedermann, A. Obtaining sustainable production from the product design analysis. J. Clean. Prod. 2016, 139, 706–716. [Google Scholar] [CrossRef]
  15. Fauzi, R.T.; Lavoie, P.; Sorelli, L.; Heidari, M.D.; Amor, B. Exploring the Current Challenges and Opportunities of Life Cycle Sustainability Assessment. Sustainability 2019, 11, 636. [Google Scholar] [CrossRef] [Green Version]
  16. Tan, A.R.; McAloone, T.C.; Andreasen, M.M. What happens to integrated product development models with product/service-system approaches? In Proceedings of the 6th Workshop on Integrated Product Development, Magdeburg, Germany, 18–20 September 2006. [Google Scholar]
  17. Kjaer, L.L.; Pagoropoulos, A.; Schmidt, J.; McAloone, T.C.; Kjær, L.L. Challenges when evaluating Product/Service-Systems through Life Cycle Assessment. J. Clean. Prod. 2016, 120, 95–104. [Google Scholar] [CrossRef] [Green Version]
  18. ISO, 2006a. ISO 14040 International Standard. In Environmental Management - Life Cycle Assessment - Principles and Framework; International Organisation: Geneva, Switzerland, 2006. [Google Scholar]
  19. ISO, 2006b. ISO 14040 International Standard. In Environmental Management - Life Cycle Assessment - Requirements and Guidelines; International Organisation: Geneva, Switzerland, 2006. [Google Scholar]
  20. Goedkoop, M.; Spriensma, R. The Eco-indicator 99. A damage oriented method for Life Cycle Impact Assessment; Methodology Report; PRé Consultants B.V.: Amersfoort, The Netherlands, 2001. [Google Scholar]
  21. Guinée, J.; Gorrée, M.; Heijungs, R.; Huppes, G.; Kleijn, R.; de Koning, A.; van Oers, L.; Sleeswijk, A.; Suh, S.; Udo de Haes, H. Life Cycle Assessment - an Operational Guide to the ISO Standards. Centre of Environmental Sciences (CML), Leiden University, 2001. Available online: https://pdfs.semanticscholar.org/83a8/8111da022a55b5045da17e5480ddaa754b26.pdf (accessed on 9 April 2020).
  22. WCED (World Commission on Environment and Development). Our Common Future; Oxford University Press: Oxford, UK, 1987. [Google Scholar]
  23. UNCED, Agenda 21. In Proceedings of the United Nations Conference on Environment and Development, Rio de Janeiro, Brazil, 3–14 June 1992.
  24. UNEP/SETAC. Guidelines for Social Life Cycle Assessment of Products; United Nations Environment Programme: Paris, France, 2009. [Google Scholar]
  25. Kloepffer, W. Life cycle sustainability assessment of products (with comments by Helias A. Udo de Haes, p. 95). Int. J. Life Cycle Assess. 2008, 13, 89–95. [Google Scholar] [CrossRef]
  26. Hannouf, M.; Assefa, G. A Life Cycle Sustainability Assessment-Based Decision-Analysis Framework. Sustainability 2018, 10, 3863. [Google Scholar] [CrossRef] [Green Version]
  27. Traverso, M.; Asdrubali, F.; Francia, A.; Finkbeiner, M. Towards life cycle sustainability assessment: an implementation to photovoltaic modules. Int. J. Life Cycle Assess. 2012, 17, 1068–1079. [Google Scholar] [CrossRef]
  28. Bernier, E.; Wang, L.; Samson, R. Life cycle optimization of energy-intensive processes using eco-costs. Int. J. Life Cycle Assess. 2013, 18, 1747–1761. [Google Scholar] [CrossRef] [Green Version]
  29. Valdivia, S.M.; Ugaya, C.M.L.; Hildenbrand, J.; Traverso, M.; Mazijn, B.; Sonnemann, G. A UNEP/SETAC approach towards a life cycle sustainability assessment—our contribution to Rio+20. Int. J. Life Cycle Assess. 2012, 18, 1673–1685. [Google Scholar] [CrossRef]
  30. Santolaya, J.L.; Lacasa, E.; Biedermann, A.M.; Muñoz, N. A practical methodology to project the design of more sustainable products in the production stage. Res. Eng. Des. 2019, 30, 539–558. [Google Scholar] [CrossRef]
  31. Capitano, C.; Traverso, M.; Rizzo, G.; Finkbeiner, M. Life cycle sustainability assessment: an implementation to marble products. In Proceedings of the LCM Conference, Berlin, Germany, 28–31 August 2011. [Google Scholar]
  32. Foolmaun, R.K.; Ramjeawon, T. Life cycle sustainability assessments (LCSA) of four disposal scenarios for used polyethylene terephthalate (PET) bottles in Mauritius. Environ. Dev. Sustain. 2012, 15, 783–806. [Google Scholar] [CrossRef]
  33. Chen, W.-T.; Hsu, C.-I. Greenhouse gas emission estimation for temperature-controlled food distribution systems. J. Clean. Prod. 2015, 104, 139–147. [Google Scholar] [CrossRef]
  34. Bartolozzi, I.; Baldereschi, E.; Daddi, T.; Iraldo, F. The application of life cycle assessment (LCA) in municipal solid waste management: A comparative study on street sweeping services. J. Clean. Prod. 2018, 182, 455–465. [Google Scholar] [CrossRef]
  35. Asadi, S.; Babaizadeh, H.; Foster, N.; Broun, R. Environmental and economic life cycle assessment of PEX and copper plumbing systems: A case study. J. Clean. Prod. 2016, 137, 1228–1236. [Google Scholar] [CrossRef]
  36. Hossain, U.; Poon, C.S. Comparative LCA of wood waste management strategies generated from building construction activities. J. Clean. Prod. 2018, 177, 387–397. [Google Scholar] [CrossRef]
  37. Ren, J.; Manzardo, A.; Mazzi, A.; Zuliani, F.; Scipioni, A. Prioritiation of bioethanol production pathways in China based on life cycle sustainability assessment and multicriteria decision-making. Int. J. Life Cycle Assess. 2015, 20, 842–853. [Google Scholar] [CrossRef]
  38. Wang, J.; Wang, Y.; Sun, Y.; Tingley, D.D.; Zhang, Y. Life cycle sustainability assessment of fly ash concrete structures. Renew. Sustain. Energy Rev. 2017, 80, 1162–1174. [Google Scholar] [CrossRef]
  39. Rabbitt, N.; Ghosh, B. Economic and environmental impacts of organised Car Sharing Services: A case study of Ireland. Res. Transp. Econ. 2016, 57, 3–12. [Google Scholar] [CrossRef]
  40. Vilches, A.; Garcia-Martinez, A.; Sanchez-Montañes, B. Life cycle assessment (LCA) of building refurbishment: A literature review. Energy Build. 2017, 135, 286–301. [Google Scholar] [CrossRef]
  41. Baldini, C.; Gardoni, D.; Guarino, M. A critical review of the recent evolution of Life Cycle Assessment applied to milk production. J. Clean. Prod. 2017, 140, 421–435. [Google Scholar] [CrossRef]
  42. Millán, I.; Lacasa, E.; Sánchez, A.; Diago, L.; Santolaya, J.L. Methodology for a sustainable design of Product-Service Systems. In Advances on Mechanics, Design Engineering and Manufacturing II; Springer Nature: Basel, Switzerland, 2019; pp. 13–22. [Google Scholar]
  43. Vinyes, E.; Oliver-Solà, J.; Ugaya, C.; Rieradevall, J.; Gasol, C.M. Application of LCSA to used cooking oil waste management. Int. J. Life Cycle Assess. 2012, 18, 445–455. [Google Scholar] [CrossRef]
  44. Ciroth, A.; Franze, J. LCA of an Ecolabeled Notebook. Consideration of Social and Environmental Impacts along the Entire Life Cycle; GreenDeltaTC GmbH: Berlin, Germany, 2011. [Google Scholar]
  45. Chang, Y.-J.; Sproesser, G.; Neugebauer, S.; Wolf, K.; Scheumann, R.; Pittner, A.; Rethmeier, M.; Finkbeiner, M. Environmental and Social Life Cycle Assessment of Welding Technologies. Procedia CIRP 2015, 26, 293–298. [Google Scholar] [CrossRef] [Green Version]
  46. Ferrari, A.; Volpi, L.; Pini, M.; Siligardi, C.; García-Muiña, F.E.; Settembre-Blundo, D. Building a Sustainability Benchmarking Framework of Ceramic Tiles Based on Life Cycle Sustainability Assessment (LCSA). Resources 2019, 8, 11. [Google Scholar] [CrossRef] [Green Version]
  47. Iriarte, A.; Gabarrell, X.; Rieradevall, J.; Durany, X.G. LCA of selective waste collection systems in dense urban areas. Waste Manag. 2009, 29, 903–914. [Google Scholar] [CrossRef] [PubMed]
  48. Li, P.; Bai, W.; Ma, K. Life cycle assessment based carbon footprint calculation and analysis of Accommodation services — A case of four-star hotels in Kunming city of China. In Proceedings of the International Conference on Management and Engineering (CME), Shanghai, China, 24–25 May 2014; pp. 1400–1418. [Google Scholar]
  49. Sanjuan-Delmás, D.; Petit-Boix, A.; Martínez-Blanco, J.; Rieradevall, J. Environmental metabolism of educational services. Case study of nursery schools in the city of Barcelona. Energy Effic. 2015, 9, 981–992. [Google Scholar] [CrossRef] [Green Version]
  50. Chun, Y.-Y.; Lee, K.M. Environmental impacts of the rental business model compared to the conventional business model: a Korean case of water purifier for home use. Int. J. Life Cycle Assess. 2016, 22, 1096–1108. [Google Scholar] [CrossRef]
  51. Cerutti, A.; Ardente, F.; Contu, S.; Donno, D.; Beccaro, G.L. Modelling, assessing, and ranking public procurement options for a climate-friendly catering service. Int. J. Life Cycle Assess. 2017, 23, 95–115. [Google Scholar] [CrossRef] [Green Version]
  52. Wulf, C.; Werker, J.; Ball, C.; Zapp, P.; Kuckshinrichs, W. Review of Sustainability Assessment Approaches Based on Life Cycles. Sustainability 2019, 11, 5717. [Google Scholar] [CrossRef] [Green Version]
  53. Doualle, B.; Medini, K.; Boucher, X.; Laforest, V. Investigating Sustainability Assessment Methods of Product-service Systems. Procedia CIRP 2015, 30, 161–166. [Google Scholar] [CrossRef]
  54. Weidema, B.P. Avoiding Co- Product Allocation in Life Cycle. J. Ind. Ecol. 2000, 4, 11–34. [Google Scholar] [CrossRef]
  55. Boër, C.R.; Pedrazzoli, P.; Bettoni, A.; Sorlini, M. Mass Customization and Sustainability. An Assessment Framework and Industrial Implementation; Springer: London, UK, 2013. [Google Scholar]
  56. Durlinger, B.; Koukouna, E.; Broekema, R.; van Paassen, M.; Scholten, J. Agri-footprint 3.0; Blonk consultants: Gouda, The Netherlands, 2017. [Google Scholar]
  57. Probas Database. German Environmental Protection Agency. Umweltbundesamt (UBA). Available online: https://www.probas.umweltbundesamt.de/php/index.php (accessed on 13 April 2017).
  58. EPD Database, 2020. Available online: www.environdec.com/EPD-Search/ (accessed on 4 February 2020).
  59. Mapama, 2018. Spain Government. Available online: www.miteco.gob.es/ca/cambio-climatico/temas/mitigacion-politicas-y-medidas/factores_emision_tcm34-446710.pdf (accessed on 23 January 2018).
  60. Ng, R.; Yeo, Z.; Low, J.S.C.; Song, B. A method for relative eco-efficiency analysis and improvement: case study of bonding technologies. J. Clean. Prod. 2015, 99, 320–332. [Google Scholar] [CrossRef]
  61. Lacasa, E. Approach and Implementation of a Methodology to Project the Development of Sustainable Products. Ph.D. Thesis, University of Zaragoza, Zaragoza, Spain, 2018. [Google Scholar]
  62. De Vries, M.; De Boer, I.J.M. Comparing environmental impacts for livestock products: A review of life cycle assessments. Livest. Sci. 2010, 128, 1–11. [Google Scholar] [CrossRef]
  63. Fantin, V.; Buttol, P.; Pergreffi, R.; Masoni, P. Life cycle assessment of Italian high quality milk production. A comparison with an EPD study. J. Clean. Prod. 2012, 28, 150–159. [Google Scholar] [CrossRef]
  64. EN 15804:2012+A2:2019. Sustainability of Construction Works - Environmental Product Declarations - Core rules for the Product Category of Construction Products; CEN/TC: Brussels, Belgium, 2019. [Google Scholar]
  65. Muñoz, N.; Santolaya, J.L.; Biedermann, A.; Molina, J. Sustainability assessment in the implementation phase of a retail space. Adv. Des. Eng. 2020, 31–39. [Google Scholar] [CrossRef]
Figure 1. Life cycle schemes.
Sustainability 12 03415 g001
Figure 2. Flows between systems involved in a product–service system (PSS). General scheme and examples.
Sustainability 12 03415 g002
Figure 3. Case 1: Milk production. Systems involved and life cycle stages object of study.
Sustainability 12 03415 g003
Figure 4. Case 1: Milk production. Percentage distribution of impact factors.
Sustainability 12 03415 g004
Figure 5. Case 1: Milk production. Sensitivity of the PSS sustainability indicators to different factors.
Sustainability 12 03415 g005
Figure 6. Case 2: Clothing retail service. Systems involved and life cycle stages in object of study.
Sustainability 12 03415 g006
Figure 7. Case 2: Clothing retail service. Percentage distribution of impact factors.
Sustainability 12 03415 g007
Figure 8. Case 2: Clothing retail service. Sensitivity of the PSS sustainability indicators to different factors.
Sustainability 12 03415 g008
Table 1. Product and service sustainability studies.
AuthorsSystemObjectiveScopeAssessment MethodResults
Product sustainability studiesCiroth and Franze [44] (2011)Notebook for office useDetection of main impacts in environment and social dimensionsEntire life cycle E-LCA; S-LCA; Single indicators; FU: 1 notebookThe development of a more sustainable product (environmental and social) is possible
Capitano et al., (2011)Marble products Evaluation and comparison of two production industrial plantsStages of extraction, production and distributionLCSA; Single indicators;
FU: 1 m3
The identification of hot spots in the two production processes
Traverso et al., (2012)Photovoltaic module Study of three different scenarios of productionProduction stage (assembly process)LCSA; LCSD;
Aggregated index; FU: 1 m2
The best sustainability performance is detected by an aggregated index
Foolmaun and Ramjeawon (2012)PET bottlesComparative analysis of four scenarios for used bottlesFinal disposition stageLCSA; Multi-criteria; AHP;
Single indicators; FU: 1 t
A scenario that combines flake production and landfilling causes less impact.
Chang et al. [45],
(2015)
Welding technology Study of four different welding processesProduction stageLCA; SLCA; Single indicators;
FU: 1 m weld seam
The technology with the higher impact and higher health risk for welders is identified
Ren et al., (2015)Bioethanol Comparing three production alternativesCrop and bioethanol production stagesLCSA; MCDM; AHP;
Single indicators; FU: 1 t
The selection of an alternative is carried out by the decision-makers.
Asadi et al., (2016)Plumbing system Effects of the use of two materials in pipingEntire life cycleLCA; LCC; Single indicators;
FU: 1000 m
PEX piping reduce the effect of environmental impacts and reduce the total cost
Wang et al., (2017)Structures of concrete Study of different substitution percentage of fly ashMaterial acquisition and productionLCSA; Sustainable Value; Aggregated index; FU: 1 m3Impacts are considerably reduced if cement is replaced by fly ash
Hossain and Poon (2018)Wood waste from construction activitiesTo evaluate the potential of four different management systemsEntire life cycleLCA; Single indicators; Sensitivity analysis; FU: 1 tThe use of wood waste instead of virgin wood is preferable in production of particleboard
Ferrari et al. [46], (2019)Ceramic tilesConstruction of a reference benchmarking in this ambitEntire life cycle including internal production costsLCA; LCC and S-LCA:
FU: 1 m2 porcelain stoneware
The logistics system presents critical issues and opportunities for improvement
Service sustainability studiesIriarte et al. [47], (2009)Collection of municipal solid wasteTo compare three selective collection servicesWaste storage, urban and inter-city transportLCA; Single indicators;F
U: 1500 t in 1 month
The multi-container system has the least impact. Inter-city transport is a critical stage in all cases
Vinyes et al., (2013)Collection of domestic used cooking oilTo compare three systems of collection in a big cityCollection and transport to the plant by tankerLCSA; Aggregated index;
FU: 10000 hab in 1 year
A multi-waste collection service is preferred.
The transport stage has a high influence
Li et al. [48], (2014)Hotel accommodationEmissions assessment due to service provision in six hotelsConstruction, operation and post-operationLCA; CFT model;
FU: 1 room and 1 night
Operation phase has high impact due mainly to the energy consumption
Chen and Hsu, (2015)Refrigerated food distributionAnalysis of two temperature control techniquesTransport from terminal to retailersNumerical model; Single indicators; FU: 1 kg in 1 dayA multi-temperature joint distribution system reduces emissions by lowering fuel consumption
Rabbitt and Ghosh, (2016)Organized car sharing serviceStudy of potential impacts of switching to car sharingService operation within an areaStatistical data; Surveys; Single indicators;
FU: geographic area in 1 year
Significant savings in travel costs and CO2 emissions could be obtained Introducing car sharing service
Sanjuán et al. [49], (2016)Early education of childrenEnvironmental profile of 12 public nursery schoolsTravel to the nursery school and child-careE-LCA; Surveys; Single indicators; FU: 1 m2 in 1 yearEnergy consumption in facilities and car use in transport show high potential for improvement
Chun and Lee [50] (2017)Home water purifier rentalTo compare rental model with a product-oriented modelOperation and maintenanceLCA; Single indicators;
FU: 10 l/day for 15 years
Rental model shows high potential for the improvement if consumers are educated
Bartolozzi et al., (2018)Municipal service of street sweepingTo compare manual and mechanical street sweepingActivities directly related in operational phaseLCA; PEF; Single indicators;
FU: 1 h and one worker
Fuel consumption is the largest contributor in all environmental impact categories
Cerutti et al. [51], (2018)Public restoration—school cateringTo assess and rank the effect of different strategiesFrom production of food to waste managementLCA; Single indicators;
FU: average meal for 1 year
The production of food is the dominant stage.
A change in diet is the most effective strategy
Table 2. Indicators selected to assess PSS sustainability.
Environmental Dimension
GWP100(kgCO2-eq)
Ac (gSO2-eq)
GE (MJ)
Global Warming Potential. Total emissions of the greenhouse gases calculating the radiative forcing over a time horizon of 100 years.
Acidification. It indicates the pH reduction due to emissions of acid gases like the nitrogen oxides (NOx) and sulphur oxides (SOx).
Global Energy. Energy consumption considering electricity as well as net calorific value of resources used.
Economic Dimension
CE (€)
EE (€/kg CO2-eq)
Execution cost.
It expresses the total cost to develop an activity.
Eco-efficiency. Ratio between economic and environmental impacts.
CE and GWP100 indicators can be used.
Social Dimension
Tw (h)
Sw (€)
Working time.
Time required by the workers to develop an activity.
Salary of the workers involved in the development of an activity.
Workers category
Table 3. Case 1: Milk production. Inventory data (expressed per litre of milk).
Material inputs and OutputsUnitsMeas.
FeedingCorn silagekg0.786
Feedkg0.357
Alfalfa kg0.250
Waterl3.496
Other material inputsWaterl0.282
Detergentl0.0014
Acidl0.0008
Protectorl0.0007
Medicinesg0.150
Strawkg0.125
Diesell0.009
Outputs Milkl1
Manurekg2.44
Activities within the dairy farmEnergy (MJ)TW (h)·10−3
Mixing and distribution of food0.3431.65
Water heating0.129-
Stables cleaning0.1710.94
Milking0.0503.76
Milk cooling0.081-
Animal health-0.23
Money inputs and outputs(€)
RevenuesMilk0.310
Manure0.049
Production
costs
Feeding0.158
Consumable0.058
Labour0.072
Indirect costs 0.025
Table 4. Case 1: Milk production. Sustainability indicators. FU: 1 litre of milk.
Environmental DimensionEconomic DimensionSocial Dimension
SystemGWP100 (kg CO2-eq)Ac (g SO2-eq)·10−3CE (€)EE (€/kg CO2-eq)Tw (h)·10−3Sw (€)
(FS) Milk 0.55710.90.2700.535.70.062
(BS2) Manure 0.0861.80.0430.530.90.010
(FS+BS2)0.64312.70.3130.536.60.072
(BS1) Veterinary 0.0020.580.0136.50.530.009
PSS (FS+BS1+BS2)0.64513.280.3260.507.130.081
Table 5. Case 2: Clothing retail service. Inventory data in the creation stage (expressed per m2).
MaterialMass (t)MaterialMass (t)
Wood0.33Plaster2.99
Metal0.61Concrete20.7
Plastic0.19Ceramic1.23
Glass0.35Others0.03
ActivitiesGE (MJ)CE (€)Tw (h)
Facades219.850.50.28
Partitions272.649.31.53
Facilities145.1135.60.60
Coatings251.197.62.46
Furniture115.358.20.24
Others239.136.80.38
Table 6. Case 2: Clothing retail service. Inventory data in the operation stage (expressed per customer visit).
Material inputsUnits
Clothes3.6
Other material inputs(g)
Packaging320
Management9.6
Sewing1.5
Cleaning products29.6
ActivitiesEnergy(MJ)Tw(h)
Clothes preparation24.443.14
Exhibition and storage7.961.78
Test and fix of clothes19.274.34
Sale and packaging1.950.42
Others8.291.79
Operation costs(€)
Clothes provision404.7
Labour102.1
Consumable16.79
Indirect costs137.8
Table 7. Case 2: Clothing retail service. Sustainability indicators. FU: 1 customer visit.
Environmental DimensionEconomic DimensionSocial Dimension
SystemGWP100 (kg CO2-eq)GE (MJ)CE (€)EE (€/kg CO2-eq)Tw (h)Sw (€)
(FS) Service0.45410.1810.1322.310.1760.683
(BS) Store 0.0330.370.1273.860.00160.027
PSS (FS+BS)0.48710.5510.2521.040.1770.71

