Article

Effects of Meteorological Factors and Anthropogenic Precursors on PM2.5 Concentrations in Cities in China

1
Key Research Institute of Yellow River Civilization and Sustainable Development & Collaborative Innovation Center on Yellow River Civilization of Henan Province, Henan University, Kaifeng 475004, Henan, China
2
Institute of Urban Big Data, College of Environment and Planning, Henan University, Kaifeng 475004, Henan, China
3
Laboratory of Geospatial Technology for the Middle and Lower Yellow River Regions, Ministry of Education, Henan University, Kaifeng 475004, Henan, China
4
Henan Key Laboratory of Integrated Air Pollution Control and Ecological Security, Henan University, Kaifeng 475004, Henan, China
5
College of Environment and Planning, Henan University, Kaifeng 475004, Henan, China
6
Department of Geography, Kent State University, Kent, OH 44242, USA
7
School of Computer and Information Engineering, Henan University, Kaifeng 475004, Henan, China
8
Henan Key Laboratory of Big Data Analysis and Processing, Henan University, Kaifeng 475004, Henan, China
9
Henan Ecological and Environmental Monitoring Center, Zhengzhou 450000, Henan, China
*
Authors to whom correspondence should be addressed.
These authors contributed equally to this work and should be considered co-first authors.
Sustainability 2020, 12(9), 3550; https://doi.org/10.3390/su12093550
Submission received: 7 February 2020 / Revised: 6 April 2020 / Accepted: 20 April 2020 / Published: 27 April 2020
(This article belongs to the Section Environmental Sustainability and Applications)

Abstract

:
Fine particulate matter smaller than 2.5 μm (PM2.5) in size can significantly affect human health, atmospheric visibility, climate, and ecosystems. PM2.5 has become the major air pollutant in most cities of China. However, influencing factors and their interactive effects on PM2.5 concentrations remain unclear. This study used a geographic detector method to quantify the effects of anthropogenic precursors (AP) and meteorological factors on PM2.5 concentrations in cities of China. Results showed that impacts of meteorological conditions and AP on PM2.5 have significant spatio-temporal disparities. Temperature was the main influencing factor throughout the whole year, which can explain 27% of PM2.5 concentrations. Precipitation and temperature were primary impacting factors in southern and northern China, respectively, at the annual time scale. In winter, AP had stronger impacts on PM2.5 in northern China than in other seasons. Ammonia had stronger impacts on PM2.5 than other anthropogenic precursors in winter. The interaction between all factors enhanced the formation of PM2.5 concentrations. The interaction between ammonia and temperature had strongest impacts at the national scale, explaining 46% (q = 0.46) of PM2.5 concentrations. The findings comprehensively elucidated the relative importance of driving factors in PM2.5 formation, which can provide basic foundations for understanding the meteorological and anthropogenic influences on the concentration patterns of PM2.5.

1. Introduction

With rapid urbanization and economic development, China has experienced increased emissions of greenhouse gases and atmospheric pollutants [1]. Particulate matter (PM), especially fine PM with a diameter less than 2.5 μm (PM2.5), has significant impacts on human health [2,3,4,5,6], atmospheric visibility [7,8], climate [9,10], and ecosystems [11,12]. In 190 Chinese cities, the annual mean PM2.5 concentration (57 ± 18 μg m−3) severely exceeds the limited value (35 μg m−3) recommended by the Chinese ambient air quality standards (CAAQS) (GB3095-2012) [13], which is at least 1.6 times the limited value. PM2.5 pollution is a severe threat to the economic and social sustainability of China.
PM2.5 concentrations could be affected by numerous factors such as meteorological conditions and anthropogenic precursors (AP) [14,15,16,17]. Meteorological conditions play important roles in the process of air pollutant emission, transport, dilution, chemical conversion, and deposition [18,19,20]. AP directly or indirectly affect PM2.5 concentrations in the atmosphere through a series of photochemical reactions under specific meteorological conditions [21,22,23]. Previous studies have explored the effects of AP and meteorological conditions (MCs) on the formation of PM2.5 concentrations. They found that temperature affects PM2.5 concentrations through atmospheric disturbances and photochemical reactions [24]. For example, as temperature and sulfur dioxide levels (SO2) rise, this leads to increased sulfate concentrations [25,26]. In addition, temperature has indirect effects on secondary organic aerosols. Under high-temperature conditions, higher biomass volatile organic compound (VOC) emissions can increase secondary organic aerosol concentrations [27]. Wind speed can change the diffusion and transport of PM2.5 in the horizontal direction [28,29]. Wet deposition caused by precipitation has scavenging effects on PM2.5 in most areas [25,29]. Absolute humidity also affects PM2.5 concentrations, and the increase in humidity is conducive to the conversion of semi-volatile substances into an aerosol phase, thereby increasing PM2.5 concentrations [30,31]. Moreover, the height of the mixing layer also plays an important role in the dilution of primary and secondary aerosols [32,33].
Due to the limitation of data accessibility before 2013 in China, research on PM2.5 was concentrated in Beijing-Tianjin-Hebei [17,34,35], the Yangtze River Delta [36,37,38], and the Pearl River Delta [39,40,41,42]. With the release of national air quality monitoring data, it is possible to study the temporal and spatial variations [43,44,45] and driving mechanisms of PM2.5 concentrations [46,47,48] throughout China. In recent years, some studies have been conducted to identify spatial distributions and temporal trends in PM2.5 concentrations at the national level, and to explore their relationships with meteorological conditions and precursor emissions. A series of models have been used to identify driving mechanisms influencing factors in PM2.5 formation, such as the classical ordinary least square model, geographically weighted regression model [49], spatial regression model [50], and land-use regression and other models [51]. The mechanisms of PM2.5 formation are very complicated, and there are interactions between influencing factors. The complex coupling of factors remains unclear. Under different driving conditions, PM2.5 concentrations have greater heterogeneity at different spatial and temporal scales. Moreover, traditional methods can lead to biased results because the impacting factors can interact closely with each other. Therefore, advanced methods should be adopted to explore the relative importance of the effects of each influencing factor on PM2.5.
To solve this issue, we applied a geographical detector q statistical method (GeoDetector) to assess the influence of AP and MCs on the concentrations of PM2.5 in major cities of China. This study can provide a better understanding of the contribution of a single impacting factor on PM2.5 concentration. The findings can also provide a foundation for the improvement of PM2.5 prediction models’ performance.

2. Materials and Methods

2.1. Study Area

Given differences in economic development, topography, and climate patterns, mainland China can be typically divided into 10 regions (Supplementary Materials, Figure S1). These 10 regions are NE (northeastern region), NC (northern coastal region), EC (eastern coastal region), SC (southeastern coastal region), MUYR (Yangtze River’s middle and upper reaches), MUPR (Pearl River’s middle and upper reaches), UYR (Yellow River’s upper reaches), MYR (Yellow River’s middle reaches), XJ (Xinjiang region), and QTP (Qinghai Tibetan Plateau region) [29]. Among them, MUPR, SC, EC, and MUYR are considered to be southern China, while NC, NE, MYR, and UYR are considered to belong to northern China.

2.2. Datasets

According to CAAQS, annual average PM2.5 concentrations are limited to 15 μg m−3 (Grade I) and 35 μg m−3 (Grade II). The daily average concentrations are 35 μg m−3 (Grade I) and 75 μg m−3 (Grade II) [39]. Grade I refers to the concentration limit required for scenic spots, nature reserves, and other areas requiring special conservation in China. Grade II refers to the concentration limits required for rural areas, residential areas, industrial areas, cultural areas, and mixed-use residential areas. The daily PM2.5 concentrations of 366 cities in China were obtained from the China Environmental Monitoring Center. Due to the availability of data, data for Hong Kong, Macau, and Taiwan were not included. Figures S3 and S4 show maps of PM2.5 concentrations [29].
We acquired meteorological data (839 sites) from the China Meteorological Data Network throughout the whole year of 2016. The daily meteorological data included surface air pressure (PS, hPa), air temperature (TE, °C), relative humidity (RH, %), wind velocity (WI, m s−1), sunshine duration (SS, h), and accumulated precipitation (PE, mm) (Figures S5–S11) [29]. The monthly anthropogenic emissions of VOCs ammonia (NH3), sulfur dioxide (SO2), and nitrogen oxide (NOx) were monitored in 2016. They were usually considered as AP of PM2.5 and were collected from MEIC (multi-resolution emission inventory for China, http://www.meicmodel.org/). The MEIC includes emission data of the four sub-sectors of transportation, power, industry, and residential [52], and has been widely used in the research of air pollution [53,54,55,56]. Figure S12 indicates that the highest anthropogenic precursor emissions are mainly distributed in EC, MYR, SC, NC, and MUYR.

2.3. GeoDetector

In this study, the q statistics of GeoDetector were used to quantitatively analyze the impacts of AP and MCs on PM2.5 in China. GeoDetector supports a series of statistical methods that can explore spatial difference and identify the driving factors. The main idea is based on the assumption that if an independent variable (X) causes a dependent variable (Y), then the spatial distribution of the independent variable and the dependent variable should be consistent [57,58,59,60]. GeoDetector can detect both qualitative data and numerical data. Compared with traditional linear statistical methods, this is a major advantage of GeoDetector. Another unique advantage of GeoDetector is the ability to detect the interaction between two factors acting on the dependent variable. The GeoDetector includes four detectors, which are factor detection, risk area detection, ecological detection, and interaction detection. In this study, factor detection and interaction detection were used.
Factor detector uses q statistic to detect the influence of X (e.g., MCs and AP) on Y (e.g., the PM2.5 concentrations). The expression is:
q = 1 h = 1 L N h σ h 2 N σ 2 = 1 S S W S S T ,   S S W = h = 1 L N h σ h 2 ,   S S T = N σ 2
In the formula, h = 1,…, L, which classifies X or Y; N and Nh are the numbers of the whole region and categories in classification h; σ2 and σh2 are the Y value of the whole region and the variance of strata h, respectively. SST and SSW are the total variance of the whole region and the sum of variance within the strata, respectively. Greater values of q (0–1) indicate more spatial variation in Y. If the classification is based on X, a higher q value explains the influence of X on Y (i.e., explaining power: 100 × q%).
Interaction detection can identify the impact of the interaction between potential driving factors. Based on that, we can assess whether the interaction between X1 and X2 will strengthen or weaken the explaining power of Y. Additionally, the influences of these factors on the dependent variable Y would be independent of each other. There are five types of interactions; please refer to [59] for more information. In addition, in order to identify the positive or negative correlations between PM2.5 concentrations and influencing factors, this study calculated their Pearson correlation coefficients at different temporal and spatial scales.

3. Results

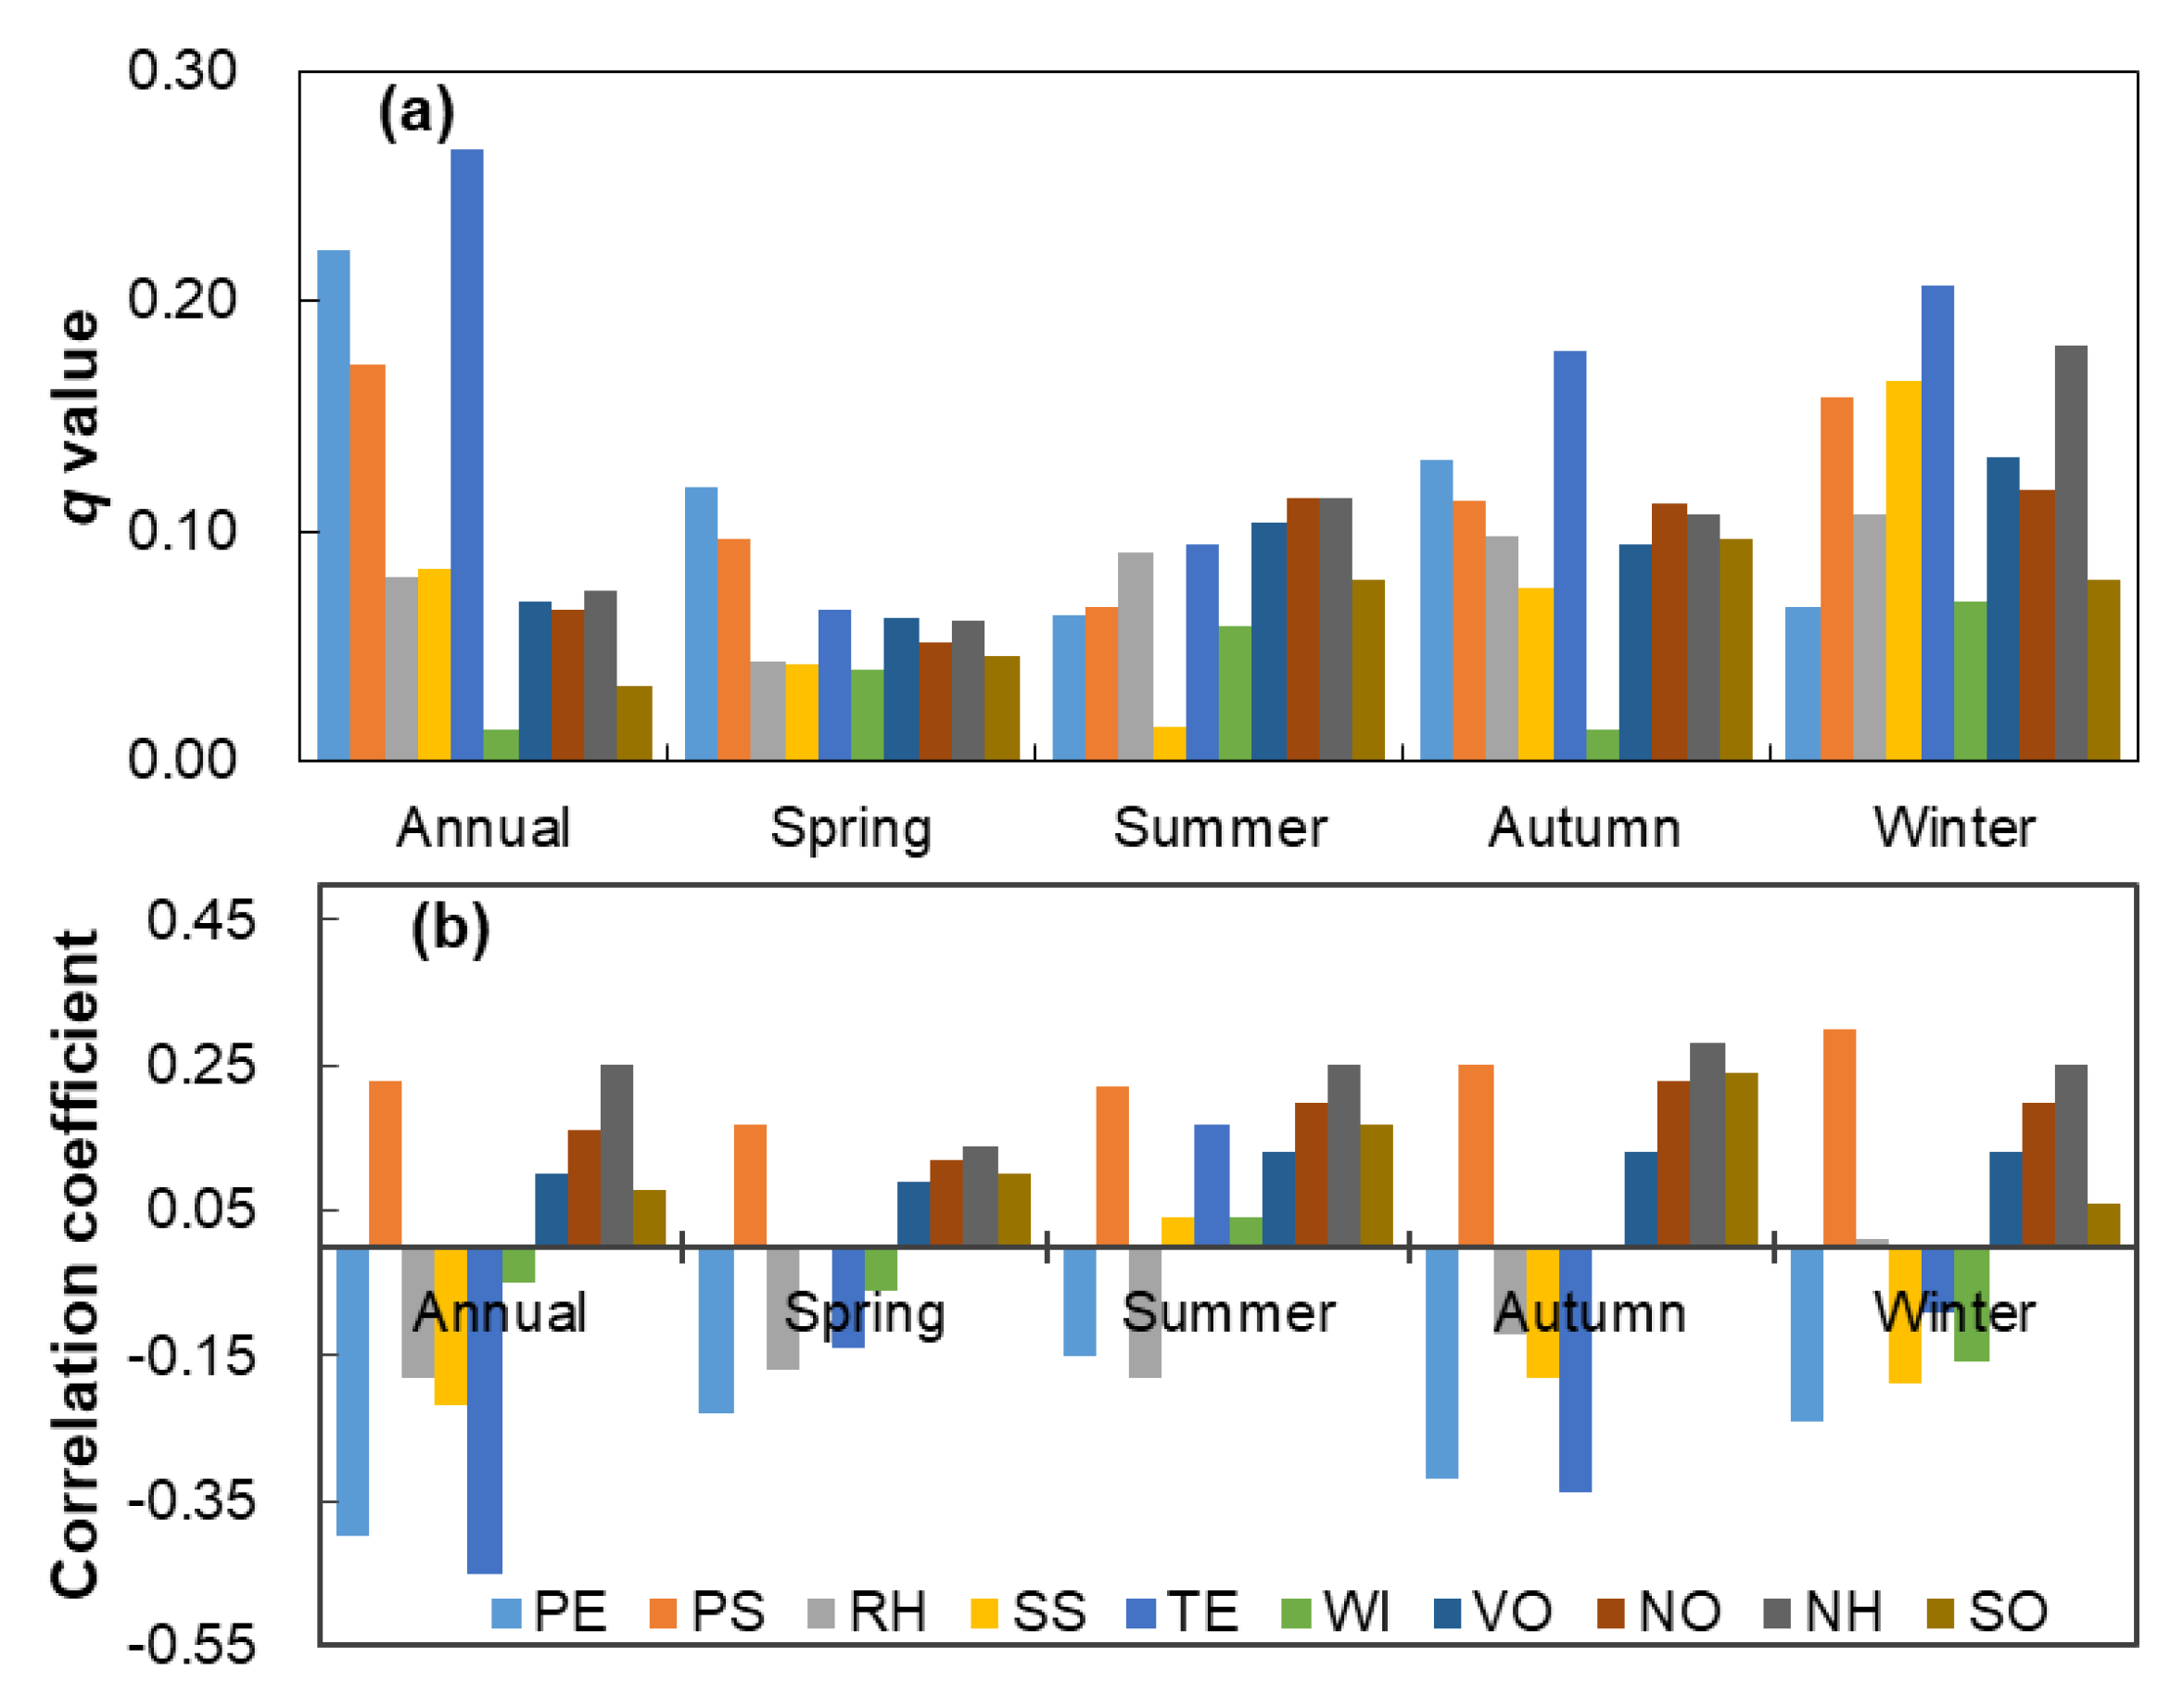
3.1. Effects on PM2.5 Concentrations at the National Scale

The influence of each driving factor on PM2.5 concentrations was acquired by calculating the corresponding q value (the power of determinant, Figure 1a), which indicated the contribution of each impacting factor on PM2.5 concentrations. Figure 1 shows that there were obvious seasonal and annual difference in factors’ impacts on PM2.5. Meteorological conditions were dominant impacting factors in PM2.5 formation at the annual time scale. TE (q = 0.27) was the primary impacting factor, followed by PE (q = 0.22) and PS (q = 0.17).
Meteorological factors were dominant driving forces in spring, such as PE (q = 0.12) and PS (q = 0.10). In summer, AP showed stronger impacts on PM2.5 concentrations than meteorological conditions, and the NOx, NH3, and VOCs were the three dominant factors (q > 0.10). In autumn, the meteorological factors and AP showed comparative influence on PM2.5. The dominant impacting factor in autumn was TE (q = 0.18), followed by PE (q = 0.13), NOx (q = 0.11), and NH3 (q = 0.10). Similar to the autumn, meteorological factors and AP had comparative impacts on PM2.5 concentrations in winter. TE (q = 0.25) was the dominant factor, followed by NH3 (q = 0.18), SSD (q = 0.17), PS (q = 0.16), and VOCs (q = 0.13). This indicated that AP were the dominant impacting factor in winter.

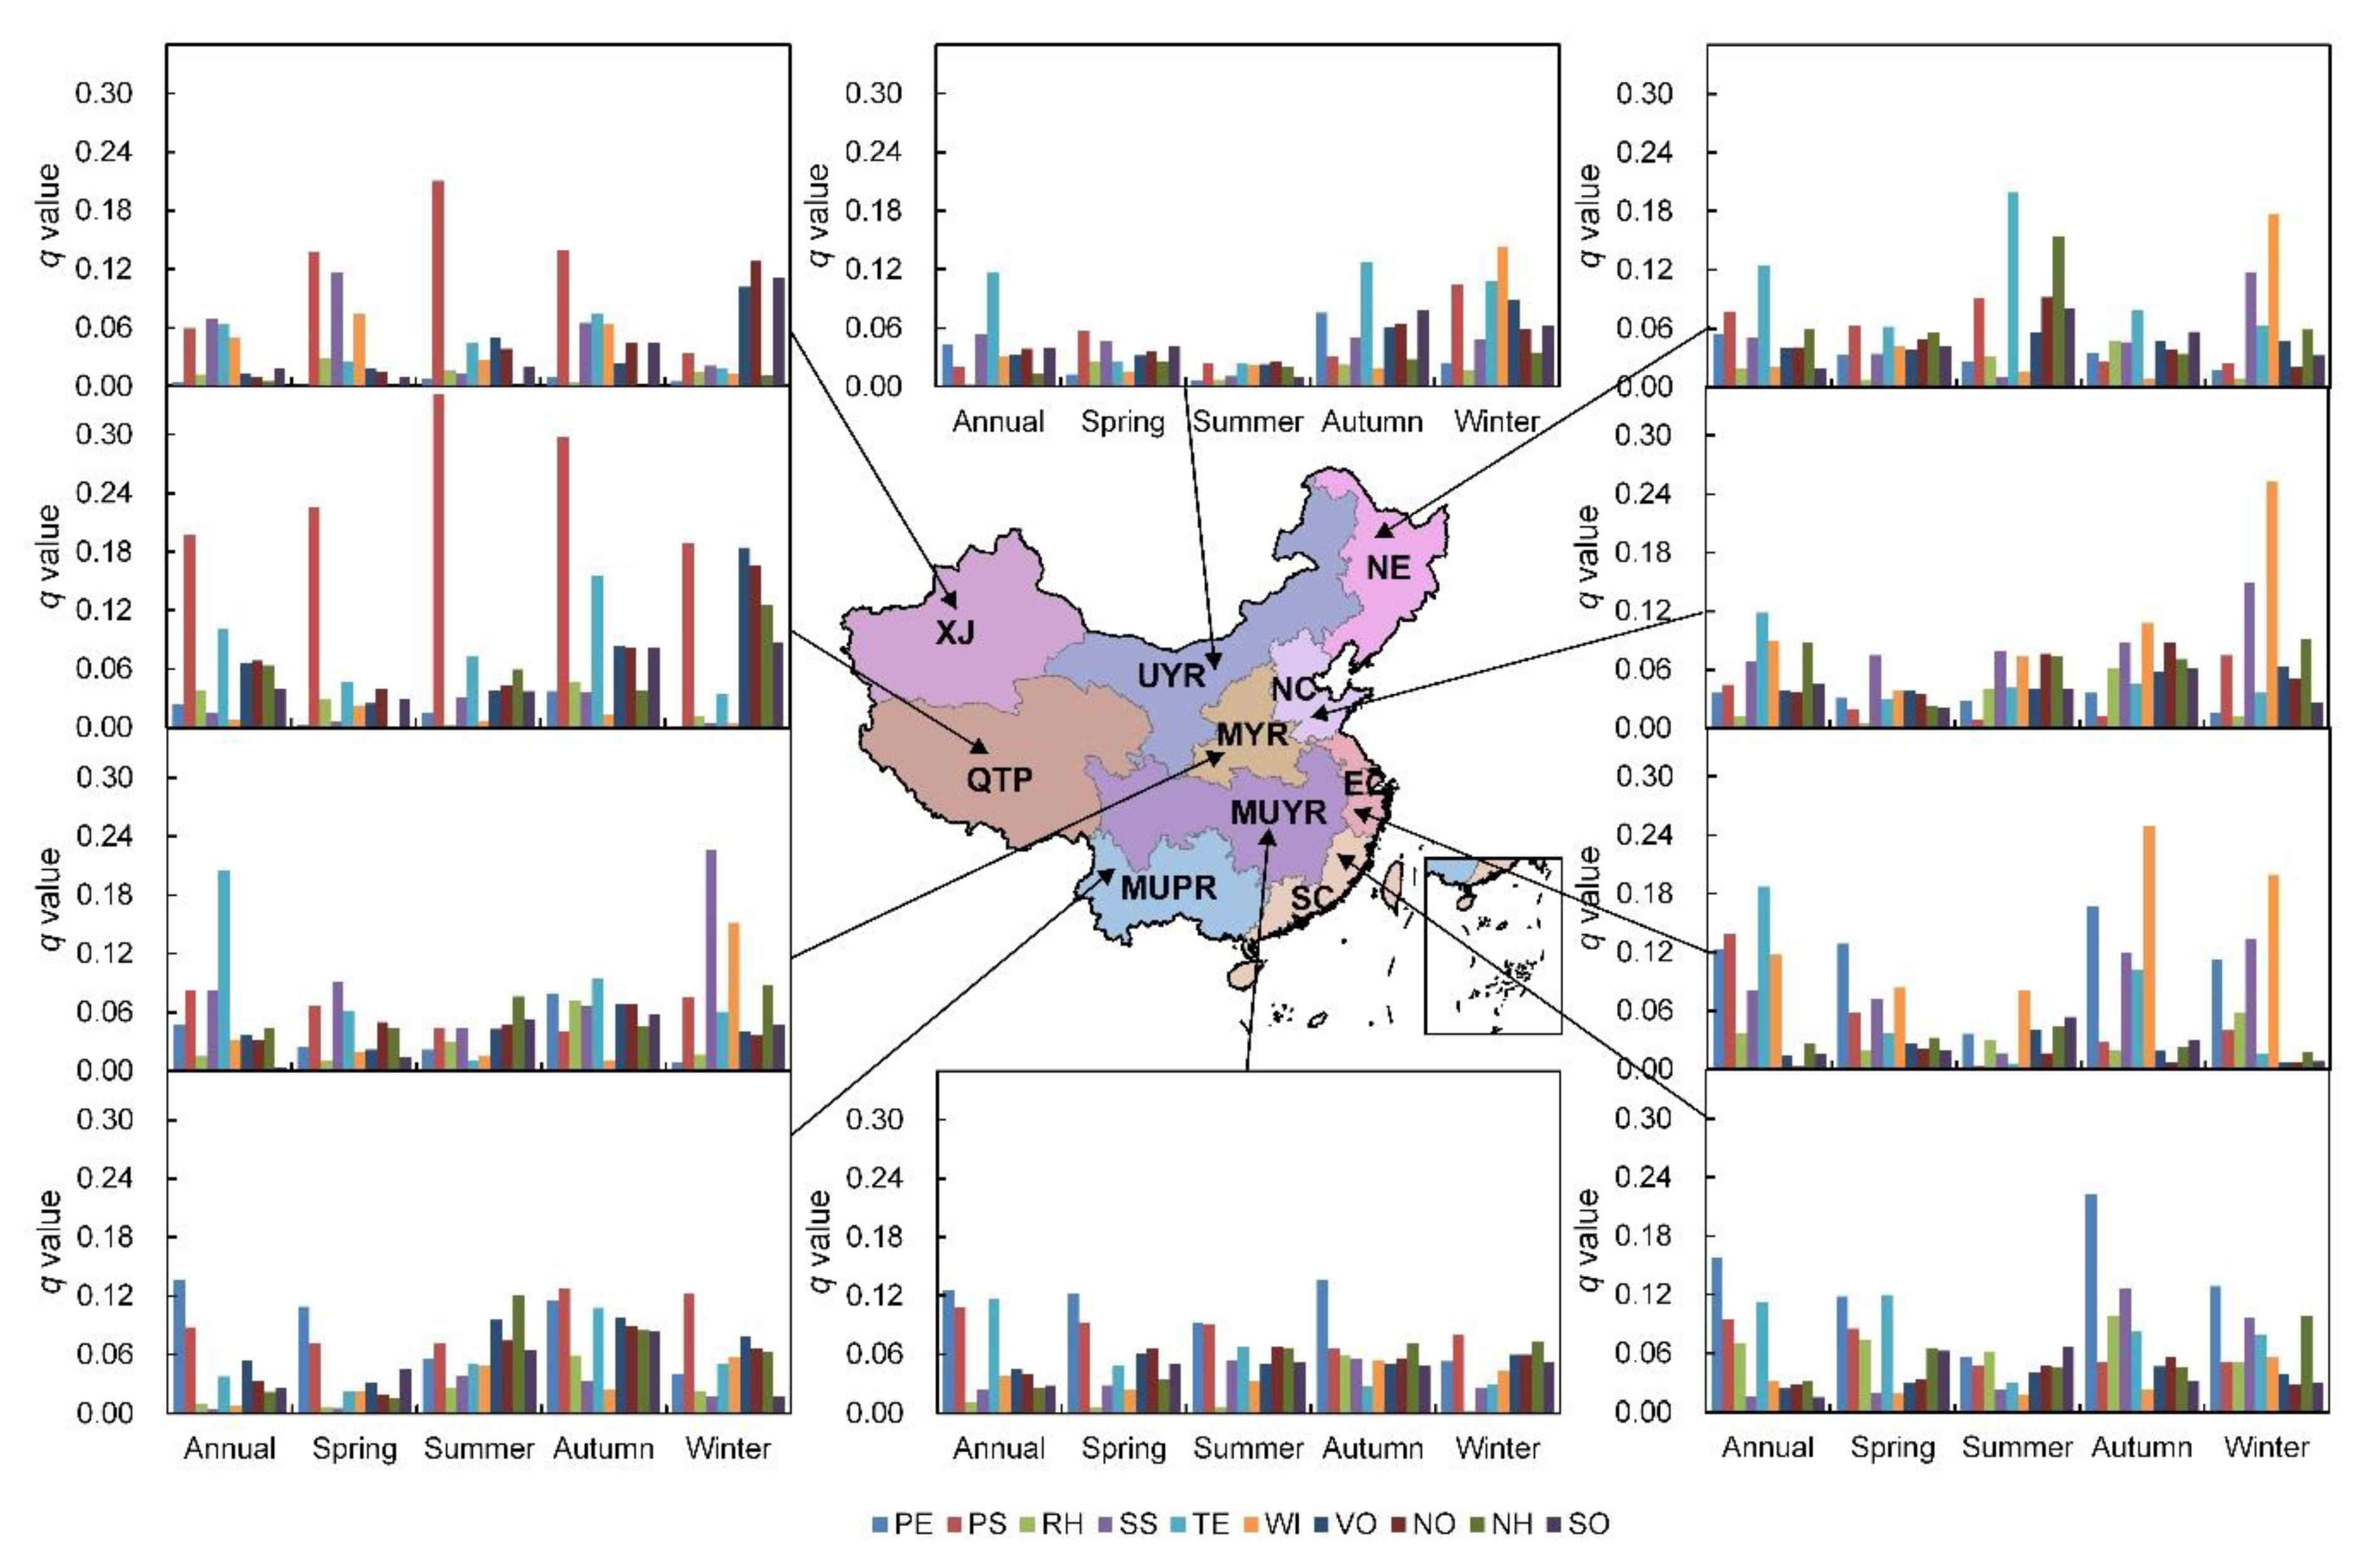
3.2. Effects on PM2.5 Concentrations at the Regional Scale

Figure 2 shows the effects of AP and MCs on PM2.5 significantly varied at regional and seasonal scales in China. In general, meteorological factors were the major driving forces in China. PE and TE were primary driving forces in southern and northern China, respectively.
Figure 2 shows that meteorological factors were primary drivers of PM2.5 formation in spring, which is similar to most regions at the annual time scale. The dominant meteorological factor was PE and SS in southern and regions of MYR and NC, respectively. Meteorological factors and AP showed comparative impacts on PM2.5 concentrations in summer except for in XJ and QTP. TE was the dominant driving factor on PM2.5 concentrations in autumn in UYR, NE, and MYR, but PE and WI played the dominant role in regions of MUYR and SC, and of NC and EC, respectively. WI was the primary driving factor in NC, NE, EC, and UYR in winter, but PS was the major driving factor in MUYR and MUPR. However, in QTP, PS was the major impacting factor on PM2.5 concentrations throughout the whole year.

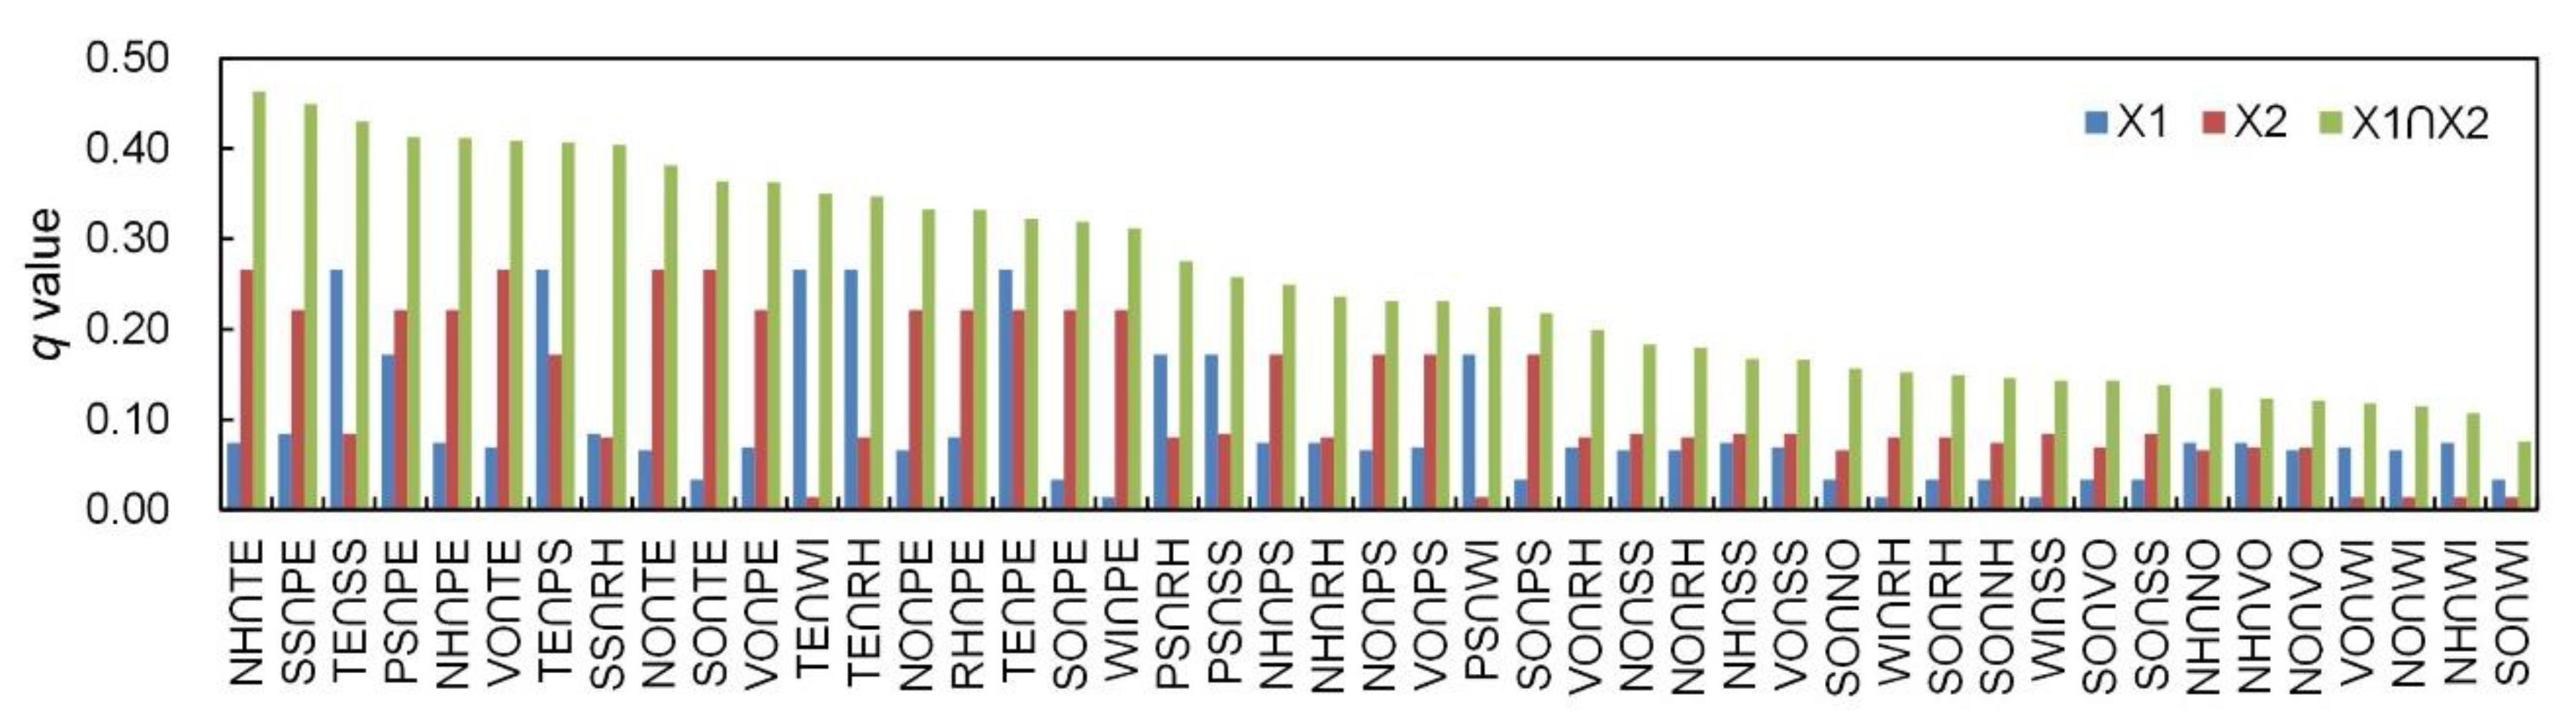
3.3. Interactive Effects on PM2.5

This study explored interactive effects on PM2.5 by using the interaction detector with a total of 45 pairs of interactions. The interaction of any two factors was analyzed by comparing their combined contribution with their individual contributions to PM2.5 concentrations. Figure 3 shows the q values of each pair of impact factors and their interaction through the whole year at the national scale. Interactions of PE ∩ TE, PS ∩ TE, PS ∩ VO, PS ∩ NO, VO ∩ NO, VO ∩ NH, and NO ∩ NH belong to bivariate enhancements and other interactions belong to nonlinear enhancements (Figure 3). Generally, the interaction between NH and TE (q value = 0.46) was the strongest interaction among all impacting factors. Figure S14 indicates that there were obvious seasonal disparities in the interactive influence. In spring, fall, and winter (but not summer), the interactions between meteorological factors played major roles in PM2.5 concentrations. The interaction WI ∩ RH (q value = 0.38) had the strongest effect on PM2.5 in spring. In autumn and winter, the interaction between SS and TE (autumn: q value = 0.54; winter: q value = 0.42) played the strongest role in PM2.5 concentrations. However, NH ∩ RH (q value = 0.35) was the highest in summer.
There were obvious regional disparities in all the interactions in China (Figure 4). The interactions between meteorological factors were strongest in all regions. In the interactions between AP and meteorological factors, the interaction of AP∩TE played a primary role in EC, MUYR, and northern China, and the interaction of AP∩PE played a dominant role in MUYR, MUPR, and SC. Figures S15–S18 show the seasonal interactive effects of each pair of driving factors at the regional scale in China, indicating that there were also obvious regional and seasonal differences in all the interactions.

4. Discussion

PM2.5 concentrations were found to be driven by natural conditions and human activities. Previous studies had reported that PM2.5 concentrations correlate with both MCs and AP emissions [16,61,62,63,64,65]. We analyzed influences of AP and meteorological factors and their interactions on PM2.5 in Chinese cities. Results showed that effects of AP and MCs and their interactions on PM2.5 had obvious seasonal and regional variations across China.
In this study, we found that meteorological factors were the leading driving factors at the annual time scale and the national scale, indicating that the meteorological conditions had dominant influences on PM2.5 concentrations. TE and PE were the two leading factors affecting PM2.5 concentrations. TE was closely related to PM2.5 concentrations by affecting atmospheric perturbation and chemical reactions [24]. PE could scavenge PM2.5 from the air and had a moisture removal effect [11,66,67]. However, the major influencing factors on PM2.5 concentration had significantly seasonal variations. The influences of meteorological conditions on PM2.5 concentrations were the strongest in winter, and TE was the leading factor affecting PM2.5 concentrations. This is because temperature inversion can weaken the scattering and dispersion of PM2.5, resulting in higher local PM2.5 pollution [68,69]. In summer, influences of meteorological conditions on PM2.5 concentrations were weakest. RH was the leading factor affecting PM2.5 concentrations in summer. This was because RH was higher in summer than in the other three seasons, which had a suppression effect on PM2.5 under moist air conditions [29].
At the annual time scale, TE was the dominant factor in northern and southern China (except MUPR), which is consistent with previous studies [70,71]. PE was the primary factor affecting PM2.5 concentrations in southern China in most seasons throughout the whole year. This was because PE in southern China was higher than in other regions [29]. The increasing PE had scavenging effects on PM2.5 by wet deposition, and could lower the PM2.5 concentration [66,67]. WI was the main influencing factor in EC and northern China in winter, which is similar to some reports that WI was the most important and negative impacting factor on PM concentrations [72,73]. This was because weaker East Asia winter monsoons could slow wind speeds and increased the frequency of static wind, which had made it more difficult for PM to disperse [74].
Previous studies have indicated that AP were also crucial driving factors on PM2.5 [48,63,75]. We found that the influence of AP on PM2.5 in winter were higher than in other seasons in XJ and northern China (MYR, UYR, NC). This might be due to the high anthropogenic emissions from winter carbon-fired heating and less surface vegetation cover in winter in northern China, which significantly increased pollutant emissions in the atmosphere [76,77]. In addition, NH3 had important impacts on PM2.5 among AP factors in winter at the national scale and in some individual regions (NC, SC, MUYR, and MYR). Ammonia is an important precursor, and emissions of ammonia had stronger associations with PM2.5 concentrations than other anthropogenic precursors; this is similar to results of previous studies [78]. Ammonia participates in photochemical reactions as an atmospheric alkaline gas, which is important in the SIA (secondary inorganic aerosol) formation of compounds such as ammonium salts, sulfate, and nitrate [79,80,81,82,83]. In China, SIA was an important driving factor of PM2.5 pollution, especially during severe smog events [80,84]. SIA accounted for 32% of PM2.5 mass concentration in China (e.g., Beijing, Guangzhou, Shanghai, and Xi’an) during the 2013 haze pollution events [84]. There was a 5.7% reduction in the annual concentration of PM2.5 concentrations when ammonia emissions were cut by 47% in the Beijing-Tianjin-Hebei region of China [79].
PM2.5 concentrations are affected by complex interactions between AP and meteorological conditions. This study found that interactions between any driving factors at all time and space scales had significant enhancement effects on PM2.5 concentrations. The leading interactive effect between AP and MCs was between AP with RH and PE at the national scale in summer. This might be due to the fact that PE and RH have scavenging and suppression effects on PM2.5 by wet deposition in summertime. However, the primary interactive effect between AP and MCs was AP ∩ TE at the national scale in winter. This was due to increased temperature inversion under the lower winter temperature, which weakened the diffusion and dispersion of pollution. The interaction between AP had the dominant effect on PM2.5 concentrations over most regions in summer, which indicated that accelerated photochemical reactions between AP occurred under high-temperature conditions. Interactions between AP and factors of PE and PS were important at annual and seasonal scales in southern China. This might be due to the high precipitation and surface pressure in southern China [29].

5. Conclusions

The effects of AP and MCs on PM2.5 in Chinese cities were systematically analyzed in this study. The findings revealed significant seasonal and regional disparities in the impacts of examined factors and how they interacted on PM2.5. The results can help us to better understanding the relative importance of the driving factors in the formation of PM2.5. The study indicated that local AP and meteorological factors had important impacts on PM2.5 in China, and had obvious regional and seasonal variations. Meteorological conditions played a leading role in determining PM2.5 concentrations at the regional and national scales throughout the whole year. At the seasonal time scale, WI was the primary factor on PM2.5 concentrations in winter in northern China and XJ, but PE was the major driver on PM2.5 concentrations during most seasons in southern China. However, AP had stronger impacts on PM2.5 during winter than in other seasons in XJ and most regions of northern China. NH3 had a stronger effect on PM2.5 concentrations during winter than other anthropogenic precursors. Interactions between all influencing factors have enhanced effects on PM2.5 concentrations. In addition, the interaction between MCs and AP played a leading role at the national scale throughout the whole year and in summer and winter. The results could provide a basis for the government to develop more precise air pollution control strategies.
Some limitations to the study should be clarified to assist future studies. First, land use and land cover, socioeconomic conditions, elevation, and topography were not considered to assess their influence on PM2.5 concentrations. Second, the uncertainty of MEIC emission inventory may lead to some uncertainties in the research results. When processing emissions inventory data, because the inventory only has monthly emissions data, so as to match the daily PM2.5 concentration and daily weather monitoring data, we took the arithmetic average of the monthly inventory emissions data, which also increased the uncertainty of the analysis results. Third, the data used in this study is limited to 2016, and does not include data analysis of other years. This is because the emission inventory data that we could obtain were for 2008, 2010, 2012, 2014, and 2016, but the PM2.5 data in 366 cities were available only from 2015 to 2017. In order to maintain consistency between the data, we selected 2016 as the research period in this study. There was no comparative analysis of inter-annual variability. Therefore, we should comprehensively consider other factors on PM2.5 concentrations including socioeconomic, land use, terrain, and elevation in the future. In addition, inter-annual change analysis based on multi-year data needs to be added.

Supplementary Materials

The following are available online at https://www.mdpi.com/2071-1050/12/9/3550/s1, Figure S1: Ten regions in China, including NE, NC, EC, SC, MYR, MUYR, MUPR, UYR, XJ, and QTP. Figure S2: Map of air quality monitoring sites (a) and meteorological sites (b). Figure S3: Annual mean PM2.5 concentrations in Chinese cities (2015–2017). Figure S4: Seasonal mean PM2.5 concentrations in spring (a), summer (b), autumn (c), and winter (d) in Chinese cities (2015–2017). Figure S5: Spatial distributions of annual mean precipitation (a), surface pressure (b), relative humidity (c), sunshine duration (d), air temperature (e), and wind speed (f) in China during 2015–2017. Figure S6: Spatial distributions of seasonal precipitations in spring (a), summer (b), autumn (c), and winter (d) in China during 2015–2017. Figure S7: Spatial distributions of seasonal surface pressure in spring (a), summer (b), autumn (c), and winter (d) in China during 2015–2017. Figure S8: Spatial distributions of seasonal relative humidity in spring (a), summer (b), autumn (c), and winter (d) in China during 2015–2017. Figure S9: Spatial distributions of seasonal sunshine duration in spring (a), summer (b), autumn (c), and winter (d) in China during 2015–2017. Figure S10: Spatial distributions of seasonal air temperature in spring (a), summer (b), autumn (c), and winter (d) in China during 2015–2017. Figure S11: Spatial distributions of seasonal wind speed in spring (a), summer (b), autumn (c), and winter (d) in China during 2015–2017. Figure S12: (a) NH3 emissions, (b) NOx emissions, (c) SO2 emissions, and (d) VOCs in China in 2016 with resolution of 0.25° × 0.25°. Figure S13: Correlations between PM2.5 concentrations and impacting factors in 10 regions (a.EC, b. MUPR, c. MUYR, d. MYR, e. NC, f. NE, g. QTP, h. SC, i. UYR, and j. XJ) of China. Figure S14: The seasonal interactive q values and the original q value of each pair of factors. Figure S15: The interactions between impacting factors in spring at the regional scale in China. Figure S16: Interactions between impacting factors in summer at the regional scale in China. Figure S17: Interactions between impacting factors in autumn at the regional scale in China. Figure S18: Interactions between impacting factors in winter at the regional scale in China. Table S1: Effect of various factors on PM2.5 in China in 2016. Table S2: Effect of various factors on PM2.5 throughout the whole year at the regional scale. Table S3: Effect of various factors on PM2.5 in spring at the regional scale. Table S4: Effect of various factors on PM2.5 in summer at the regional scale. Table S5: Effect of various factors on PM2.5 in autumn at the regional scale. Table S6: Effect of various factors on PM2.5 in winter at the regional scale.

Author Contributions

Conceptualization, H.S.; methodology, H.S.; software, P.L., T.X.; validation, P.L., T.W. and J.L.; formal analysis, P.L.; investigation, P.L.; resources, H.S. and Y.X.; data curation, P.L.; writing—original draft preparation, Z.J., P.L.; writing—review and editing, P.L. and H.S.; visualization, T.W.; supervision, H.S. and J.L. All authors have read and agreed to the published version of the manuscript.

Funding

This research was funded by the Natural Science Foundation of China (41401107) and the Basic and Frontier Technology Research Project of Henan Province, China (162300410132), and the Higher Education Research Project of Henan Province, China (17B170003).

Acknowledgments

We the authors thank Shenghui Zhou from Henan University for helpful discussions on data analysis.

Conflicts of Interest

The authors declare no conflict of interest.

References

  1. Liu, X.H.; Zhang, Y.; Xing, J.; Zhang, Q.; Wang, K.; Streets, D.G.; Jang, C.; Wang, W.X.; Hao, J.M. Understanding of regional air pollution over China using CMAQ, part II. Process analysis and sensitivity of ozone and particulate matter to precursor emissions. Atmos. Environ. 2010, 44, 3719–3727. [Google Scholar] [CrossRef]
  2. Zhang, Q.; He, K.; Hong, H. Cleaning China’s air. Nature 2012, 484, 161–162. [Google Scholar] [CrossRef] [PubMed]
  3. Watson, T. Environment: Breathing trouble. Nature 2014, 513, S14–S15. [Google Scholar] [CrossRef] [PubMed]
  4. Jerrett, M. Atmospheric science: The death toll from air-pollution sources. Nature 2015, 525, 330–331. [Google Scholar] [CrossRef] [PubMed] [Green Version]
  5. Kerl, P.Y.; Zhang, W.; Moreno-Cruz, J.B.; Nenes, A.; Realff, M.J.; Russell, A.G.; Sokol, J.; Thomas, V.M. New approach for optimal electricity planning and dispatching with hourly time-scale air quality and health considerations. Proc. Natl. Acad. Sci. USA 2015, 112, 10884–10889. [Google Scholar] [CrossRef] [PubMed] [Green Version]
  6. Patz, J.A.; Campbell-Lendrum, D.; Holloway, T.; Foley, J.A. Impact of regional climate change on human health. Nature 2005, 438, 310–317. [Google Scholar] [CrossRef] [PubMed]
  7. Pui, D.Y.H.; Chen, S.-C.; Zuo, Z. PM2.5 in China: Measurements, sources, visibility and health effects, and mitigation. Particuology 2014, 13, 1–26. [Google Scholar] [CrossRef]
  8. Liu, Y.-J.; Zhang, T.-T.; Liu, Q.-Y.; Zhang, R.-J.; Sun, Z.-Q.; Zhang, M.-G. Seasonal variation of physical and chemical properties in TSP, PM10 and PM2.5 at a roadside site in Beijing and their influence on atmospheric visibility. Aerosol Air Qual. Res. 2014, 14, 954–969. [Google Scholar] [CrossRef] [Green Version]
  9. Song, H.; Zhang, K.; Piao, S.; Wan, S. Spatial and temporal variations of spring dust emissions in northern China over the last 30 years. Atmos. Environ. 2016, 126, 117–127. [Google Scholar] [CrossRef]
  10. Song, H.; Wang, K.; Zhang, Y.; Hong, C.; Zhou, S. Simulation and evaluation of dust emissions with WRF-Chem (v3.7.1) and its relationship to the changing climate over East Asia from 1980 to 2015. Atmos. Environ. 2017, 167, 511–522. [Google Scholar] [CrossRef]
  11. Song, H.; Zhang, K.; Piao, S.; Liu, L.; Wang, Y.-P.; Chen, Y.; Yang, Z.; Zhu, L.; Wan, S. Soil organic carbon and nutrient losses resulted from spring dust emissions in Northern China. Atmos. Environ. 2019, 213, 585–596. [Google Scholar] [CrossRef]
  12. Liu, J.; Rühland, K.M.; Chen, J.; Xu, Y.; Chen, S.; Chen, Q.; Huang, W.; Xu, Q.; Chen, F.; Smol, J.P. Aerosol-weakened summer monsoons decrease lake fertilization on the Chinese Loess Plateau. Nat. Clim. Chang. 2017, 7, 190–194. [Google Scholar] [CrossRef]
  13. Zhang, Y.-L.; Cao, F. Fine particulate matter (PM2.5) in China at a city level. Sci. Rep. 2015, 5, 14884–14896. [Google Scholar] [CrossRef] [PubMed] [Green Version]
  14. Tai, A.P.K.; Mickley, L.J.; Jacob, D.J. Correlations between fine particulate matter (PM2.5) and meteorological variables in the United States: Implications for the sensitivity of PM2.5 to climate change. Atmos. Environ. 2010, 44, 3976–3984. [Google Scholar] [CrossRef]
  15. Yang, D.; Wang, X.; Xu, J.; Xu, C.; Lu, D.; Ye, C.; Wang, Z.; Bai, L. Quantifying the influence of natural and socioeconomic factors and their interactive impact on PM2.5 pollution in China. Environ. Pollut. 2018, 241, 475–483. [Google Scholar] [CrossRef]
  16. Zhou, C.; Chen, J.; Wang, S. Examining the effects of socioeconomic development on fine particulate matter (PM2.5) in China’s cities using spatial regression and the geographical detector technique. Sci. Total Environ. 2018, 619–620, 436–445. [Google Scholar] [CrossRef]
  17. Gui, K.; Che, H.; Wang, Y.; Wang, H.; Zhang, L.; Zhao, H.; Zheng, Y.; Sun, T.; Zhang, X. Satellite-derived PM2.5 concentration trends over Eastern China from 1998 to 2016: Relationships to emissions and meteorological parameters. Environ. Pollut. 2019, 247, 1125–1133. [Google Scholar] [CrossRef]
  18. Hogrefe, C. Air quality: Emissions versus climate change. Nat. Geosci. 2012, 5, 685–686. [Google Scholar] [CrossRef]
  19. Kinney, P.L. Climate Change, Air Quality, and Human Health. Am. J. Prev. Med. 2008, 35, 459–467. [Google Scholar] [CrossRef]
  20. Lacressonnière, G.; Foret, G.; Beekmann, M.; Siour, G.; Engardt, M.; Gauss, M.; Watson, L.; Andersson, C.; Colette, A.; Josse, B.; et al. Impacts of regional climate change on air quality projections and associated uncertainties. Clim. Chang. 2016, 136, 309–324. [Google Scholar] [CrossRef]
  21. Chang, W.; Zhan, J.; Zhang, Y.; Li, Z.; Xing, J.; Li, J. Emission-driven changes in anthropogenic aerosol concentrations in China during 1970–2010 and its implications for PM2.5 control policy. Atmos. Res. 2018, 212, 106–119. [Google Scholar] [CrossRef]
  22. Arif, M.; Kumar, R.; Kumar, R.; Eric, Z.; Gourav, P. Ambient black carbon, PM2.5 and PM10 at Patna: Influence of anthropogenic emissions and brick kilns. Sci. Total Environ. 2018, 624, 1387–1400. [Google Scholar] [CrossRef] [PubMed]
  23. Blanchard, C.L.; Shaw, S.L.; Edgerton, E.S.; Schwab, J.J. Emission influences on air pollutant concentrations in New York state: II. PM2.5 organic and elemental carbon constituents. Atmos. Environ. X 2019, 3, 100039. [Google Scholar] [CrossRef]
  24. He, J.; Gong, S.; Yu, Y.; Yu, L.; Wu, L.; Mao, H.; Song, C.; Zhao, S.; Liu, H.; Li, X.; et al. Air pollution characteristics and their relation to meteorological conditions during 2014–2015 in major Chinese cities. Environ. Pollut. 2017, 223, 484–496. [Google Scholar] [CrossRef] [PubMed]
  25. Lecoeur, E.; Seigneur, C. Dynamic evaluation of a multi-year model simulation of particulate matter concentrations over Europe. Atmos. Chem. Phys. 2013, 13, 4319–4337. [Google Scholar] [CrossRef] [Green Version]
  26. Jacob, D.J.; Winner, D.A. Effect of climate change on air quality. Atmos. Environ. 2009, 43, 51–63. [Google Scholar] [CrossRef] [Green Version]
  27. Heald, C.L.; Henze, D.K.; Horowitz, L.W.; Feddema, J.; Lamarque, J.F.; Guenther, A.; Hess, P.G.; Vitt, F.; Seinfeld, J.H.; Godstein, A.H.; et al. Predicted change in global secondary organic aerosol concentrations in response to future climate, emissions, and land use change. J. Geophys. Res. Atmos. 2008, 113, 1–16. [Google Scholar] [CrossRef]
  28. Aksoyoglu, S.; Keller, J.; Barmpadimos, I.; Oderbolz, D.; Lanz, V.A.; Prév?t, A.S.H.; Baltensperger, U. Aerosol modelling in Europe with a focus on Switzerland during summer and winter episodes. Atmos. Chem. Phys. 2011, 11, 7355–7373. [Google Scholar] [CrossRef] [Green Version]
  29. Li, X.; Song, H.; Zhai, S.; Lu, S.; Kong, Y.; Xia, H.; Zhao, H. Particulate matter pollution in Chinese cities: Areal-temporal variations and their relationships with meteorological conditions (2015–2017). Environ. Pollut. 2019, 246, 11–18. [Google Scholar] [CrossRef]
  30. Dawson, J.P.; Racherla, P.N.; Lynn, B.H.; Adams, P.J.; Pandis, S.N. Impacts of climate change on regional and urban air quality in the eastern United States: Role of meteorology. J. Geophys. Res. 2009, 114, 1–11. [Google Scholar] [CrossRef] [Green Version]
  31. Galindo, N.; Varea, M.; Gil-Moltó, J.; Yubero, E.; Nicolás, J. The Influence of Meteorology on Particulate Matter Concentrations at an Urban Mediterranean Location. Water Air Soil Pollut. 2011, 215, 365–372. [Google Scholar] [CrossRef]
  32. Sandeep, A.; Rao, T.N.; Ramkiran, C.N.; Rao, S.V.B. Differences in Atmospheric Boundary-Layer Characteristics Between Wet and Dry Episodes of the Indian Summer Monsoon. Bound. -Layer Meteorol. 2014, 153, 217–236. [Google Scholar] [CrossRef]
  33. Pay, M.T.; Jiménez-Guerrero, P.; Baldasano, J.M. Assessing sensitivity regimes of secondary inorganic aerosol formation in Europe with the CALIOPE-EU modeling system. Atmos. Environ. 2012, 51, 146–164. [Google Scholar] [CrossRef] [Green Version]
  34. Yan, S.; Cao, H.; Chen, Y.; Wu, C.; Hong, T.; Fan, H. Spatial and temporal characteristics of air quality and air pollutants in 2013 in Beijing. Environ. Sci. Pollut. Res. 2016, 23, 13996–14007. [Google Scholar] [CrossRef] [PubMed]
  35. Chen, Z.; Xu, B.; Cai, J.; Gao, B. Understanding temporal patterns and characteristics of air quality in Beijing: A local and regional perspective. Atmos. Environ. 2016, 127, 303–315. [Google Scholar] [CrossRef]
  36. Yang, D.; Lu, D.; Xu, J.; Ye, C.; Zhao, J.; Tian, G.; Wang, X.; Zhu, N. Predicting spatio-temporal concentrations of PM2.5 using land use and meteorological data in Yangtze River Delta, China. Stoch. Environ. Res. Risk Assess. 2017, 32, 2445–2456. [Google Scholar] [CrossRef]
  37. Lu, D.; Xu, J.; Yang, D.; Zhao, J. Spatio-temporal variation and influence factors of PM2.5 concentrations in China from 1998 to 2014. Atmos. Pollut. Res. 2017, 8, 1151–1159. [Google Scholar] [CrossRef]
  38. Ma, T.; Duan, F.; He, K.; Qin, Y.; Tong, D.; Geng, G.; Liu, X.; Li, H.; Yang, S.; Ye, S.; et al. Air pollution characteristics and their relationship with emissions and meteorology in the Yangtze River Delta region during 2014–2016. J. Environ. Sci. (China) 2019, 83, 8–20. [Google Scholar] [CrossRef]
  39. Lai, S.; Zhao, Y.; Ding, A.; Zhang, Y.; Song, T.; Zheng, J.; Ho, K.F.; Lee, S.; Zhong, L. Characterization of PM2.5 and the major chemical components during a 1-year campaign in rural Guangzhou, Southern China. Atmos. Res. 2016, 167, 208–215. [Google Scholar] [CrossRef]
  40. Wang, Q.Q.; Huang, X.H.H.; Zhang, T.; Zhang, Q.; Feng, Y.; Yuan, Z.; Wu, D.; Lau, A.K.H.; Yu, J.Z. Organic tracer-based source analysis of PM2.5 organic and elemental carbon: A case study at Dongguan in the Pearl River Delta, China. Atmos. Environ. 2015, 118, 164–175. [Google Scholar] [CrossRef]
  41. Zhao, X.; Wang, X.; Ding, X.; He, Q.; Zhang, Z.; Liu, T.; Fu, X.; Gao, B.; Wang, Y.; Zhang, Y.; et al. Compositions and sources of organic acids in fine particles (PM2.5) over the Pearl River Delta region, south China. J. Environ. Sci. 2014, 26, 110–121. [Google Scholar] [CrossRef]
  42. Huang, H.; Ho, K.F.; Lee, S.C.; Tsang, P.K.; Ho, S.S.H.; Zou, C.W.; Zou, S.C.; Cao, J.J.; Xu, H.M. Characteristics of carbonaceous aerosol in PM2.5: Pearl Delta River Region, China. Atmos. Res. 2012, 104–105, 227–236. [Google Scholar] [CrossRef]
  43. Li, Y.; Dai, Z.; Liu, X. Analysis of Spatial-Temporal Characteristics of the PM2.5 Concentrations in Weifang City, China. Sustainability 2018, 10, 2960. [Google Scholar] [CrossRef] [Green Version]
  44. Jin, Q.; Fang, X.; Wen, B.; Shan, A. Spatio-temporal variations of PM2.5 emission in China from 2005 to 2014. Chemosphere 2017, 183, 429–436. [Google Scholar] [CrossRef] [PubMed]
  45. Fang, C.; Wang, Z.; Xu, G. Spatial-temporal characteristics of PM2.5 in China: A city-level perspective analysis. J. Geogr. Sci. 2016, 26, 1519–1532. [Google Scholar] [CrossRef]
  46. Wang, S.; Liu, X.; Yang, X.; Zou, B.; Wang, J. Spatial variations of PM2.5 in Chinese cities for the joint impacts of human activities and natural conditions: A global and local regression perspective. J. Clean. Prod. 2018, 203, 143–152. [Google Scholar] [CrossRef]
  47. Wang, S.; Zhou, C.; Wang, Z.; Feng, K.; Hubacek, K. The characteristics and drivers of fi ne particulate matter (PM2.5) distribution in China. J. Clean. Prod. 2017, 142, 1800–1809. [Google Scholar] [CrossRef]
  48. Wang, P.; Guo, H.; Hu, J.; Kota, S.H.; Ying, Q.; Zhang, H. Responses of PM2.5 and O3 concentrations to changes of meteorology and emissions in China. Sci. Total Environ. 2019, 662, 297–306. [Google Scholar] [CrossRef]
  49. Hu, X.; Waller, L.A.; Al-Hamdan, M.Z.; Crosson, W.L.; Estes, M.G.; Estes, S.M.; Quattrochi, D.A.; Sarnat, J.A.; Liu, Y. Estimating ground-level PM2.5 concentrations in the southeastern U.S. using geographically weighted regression. Environ. Res. 2013, 121, 1–10. [Google Scholar] [CrossRef]
  50. Hao, Y.; Liu, Y.M. The influential factors of urban PM2.5 concentrations in China: A spatial econometric analysis. J. Clean. Prod. 2016, 112, 1443–1453. [Google Scholar]
  51. Mao, L.; Qiu, Y.; Kusano, C.; Xu, X. Predicting regional space–time variation of PM2.5 with land-use regression model and MODIS data. Environ. Sci. Pollut. Res. 2012, 19, 128–138. [Google Scholar] [CrossRef]
  52. Zhang, Q.; Streets, D.G.; Carmichael, G.R.; He, K.B.; Huo, H.; Kannari, A.; Klimont, Z.; Park, I.S.; Reddy, S.; Fu, J.S.; et al. Asian emissions in 2006 for the NASA INTEX-B mission. Atmos. Chem. Phys. 2009, 9, 5131–5153. [Google Scholar] [CrossRef] [Green Version]
  53. Geng, G.; Zhang, Q.; Tong, D.; Li, M.; Zheng, Y.; Wang, S.; He, K. Chemical composition of ambient PM2. 5 over China and relationship to precursor emissions during 2005–2012. Atmos. Chem. Phys. 2017, 17, 9187–9203. [Google Scholar] [CrossRef] [Green Version]
  54. Zheng, Y.; Zhang, Q.; Liu, Y.; Geng, G.; He, K. Estimating ground-level PM2.5 concentrations over three megalopolises in China using satellite-derived aerosol optical depth measurements. Atmos. Environ. 2016, 124, 232–242. [Google Scholar] [CrossRef]
  55. Jiang, X.; Hong, C.; Zheng, Y.; Zheng, B.; Guan, D.; Gouldson, A.; Zhang, Q.; He, K. To what extent can China’s near-term air pollution control policy protect air quality and human health? A case study of the Pearl River Delta region. Environ. Res. Lett. 2015, 10, 1–14. [Google Scholar] [CrossRef]
  56. Zheng, B.; Zhang, Q.; Zhang, Y.; He, K.B.; Wang, K.; Zheng, G.J.; Duan, F.K.; Ma, Y.L.; Kimoto, T. Heterogeneous chemistry: A mechanism missing in current models to explain secondary inorganic aerosol formation during the January 2013 haze episode in North China. Atmos. Chem. Phys. Discuss. 2014, 14, 16731–16776. [Google Scholar] [CrossRef]
  57. Wang, J.; Xu, C. Geodector: Principle and prospective. Acta Geogr. Sin. 2017, 72, 116–134. [Google Scholar]
  58. Wang, J.; Li, X.; Christakos, G.; Liao, Y.; Zhang, T.; Gu, X.; Zheng, X. Geographical Detectors-Based Health Risk Assessment and its Application in the Neural Tube Defects Study of the Heshun Region, China. Int. J. Geogr. Inf. Sci. 2010, 24, 107–127. [Google Scholar] [CrossRef]
  59. Wang, J.F.; Zhang, T.L.; Fu, B.J. A measure of spatial stratified heterogeneity. Ecol. Indic. 2016, 67, 250–256. [Google Scholar] [CrossRef]
  60. Wang, J.-F.; Hu, Y. Environmental health risk detection with GeogDetector. Environ. Model. Softw. 2012, 33, 114–115. [Google Scholar] [CrossRef]
  61. Luo, J.; Du, P.; Samat, A.; Xia, J.; Che, M.; Xue, Z. Spatiotemporal Pattern of PM2.5 Concentrations in Mainland China and Analysis of Its Influencing Factors using Geographically Weighted Regression. Sci. Rep. 2017, 7, 40607–40621. [Google Scholar] [CrossRef] [PubMed]
  62. Xu, Y.; Xue, W.; Lei, Y.; Huang, Q.; Zhao, Y.; Cheng, S.; Ren, Z.; Wang, J. Spatiotemporal variation in the impact of meteorological conditions on PM2.5 pollution in China from 2000 to 2017. Atmos. Environ. 2020, 223, 117215. [Google Scholar] [CrossRef]
  63. Liu, Q.; Wang, S.; Zhang, W.; Li, J.; Dong, G. The effect of natural and anthropogenic factors on PM2.5: Empirical evidence from Chinese cities with different income levels. Sci. Total Environ. 2019, 653, 157–167. [Google Scholar] [CrossRef] [PubMed]
  64. Zhang, Q.; Ma, Q.; Zhao, B.; Liu, X.; Wang, Y.; Jia, B.; Zhang, X. Winter haze over North China Plain from 2009 to 2016: Influence of emission and meteorology. Environ. Pollut. 2018, 242, 1308–1318. [Google Scholar] [CrossRef] [PubMed]
  65. Xu, G.; Ren, X.; Xiong, K.; Li, L.; Bi, X.; Wu, Q. Analysis of the driving factors of PM2.5 concentration in the air: A case study of the Yangtze River Delta, China. Ecol. Indic. 2020, 110, 105889. [Google Scholar] [CrossRef]
  66. Lin, G.; Fu, J.; Jiang, D.; Wang, J.; Wang, Q.; Dong, D. Spatial variation of the relationship between PM2. 5 concentrations and meteorological parameters in China. BioMed Res. Int. 2015, 2015, 1–15. [Google Scholar]
  67. Li, X.; Ma, Y.; Wang, Y.; Liu, N.; Hong, Y. Temporal and spatial analyses of particulate matter (PM10 and PM2.5) and its relationship with meteorological parameters over an urban city in northeast China. Atmos. Res. 2017, 198, 185–193. [Google Scholar] [CrossRef]
  68. Hien, P.D.; Bac, V.T.; Tham, H.C.; Nhan, D.D.; Vinh, L.D. Influence of meteorological conditions on PM2.5 and PM2.5–10 concentrations during the monsoon season in Hanoi, Vietnam. Atmos. Environ. 2002, 36, 3473–3484. [Google Scholar] [CrossRef]
  69. Trinh, T.T.; Trinh, T.T.; Le, T.T.; Tu, B.M. Temperature inversion and air pollution relationship, and its effects on human health in Hanoi City, Vietnam. Environ. Geochem. Health 2019, 41, 929–937. [Google Scholar] [CrossRef]
  70. Mažeikis, A. Urbanization influence on meteorological parameters of air pollution: Vilnius case study. Baltica 2013, 26, 51–56. [Google Scholar] [CrossRef] [Green Version]
  71. Megaritis, A.G.; Fountoukis, C.; Charalampidis, P.E.; Denier Van Der Gon, H.A.C.; Pilinis, C.; Pandis, S.N. Linking climate and air quality over Europe: Effects of meteorology on PM2.5 concentrations. Atmos. Chem. Phys. 2014, 14, 10283–10298. [Google Scholar] [CrossRef] [Green Version]
  72. Zhou, W.; Tie, X.; Zhou, G.; Liang, P. Possible effects of climate change of wind on aerosol variation during winter in Shanghai, China. Particuology 2015, 20, 80–88. [Google Scholar] [CrossRef]
  73. Cheng, X.; Zhao, T.; Gong, S.; Xu, X.; Han, Y.; Yin, Y.; Tang, L.; He, H.; He, J. Implications of East Asian summer and winter monsoons for interannual aerosol variations over central-eastern China. Atmos. Environ. 2016, 129, 218–228. [Google Scholar] [CrossRef]
  74. Wang, C.; An, X.; Zhang, P.; Sun, Z.; Cui, M.; Ma, L. Comparing the impact of strong and weak East Asian winter monsoon on PM2.5 concentration in Beijing. Atmos. Res. 2019, 215, 165–177. [Google Scholar] [CrossRef]
  75. Backes, A.M.; Aulinger, A.; Bieser, J.; Matthias, V.; Quante, M. Ammonia emissions in Europe, part II: How ammonia emission abatement strategies affect secondary aerosols. Atmos. Environ. 2016, 126, 153–161. [Google Scholar] [CrossRef] [Green Version]
  76. Yu, L.; Wang, G.; Zhang, R.; Zhang, L.; Song, Y.; Wu, B.; Li, X.; An, K.; Chu, J. Characterization and source apportionment of PM2.5 in an urban environment in Beijing. Aerosol Air Qual. Res. 2013, 13, 574–583. [Google Scholar] [CrossRef] [Green Version]
  77. Wu, J.; Xie, W.; Li, W.; Li, J. Effects of urban landscape pattern on PM2.5 Pollution-A Beijing Case Study. PLoS ONE 2015, 10, e0142449. [Google Scholar] [CrossRef] [Green Version]
  78. Vayenas, D.V.; Takahama, S.; Davidson, C.I.; Pandis, S.N. Simulation of the thermodynamics and removal processes in the sulfate-ammonia-nitric acid system during winter: Implications for PM2.5 control strategies. J. Geophys. Res. Atmos. 2005, 110, 1–11. [Google Scholar] [CrossRef]
  79. Ye, Z.; Guo, X.; Cheng, L.; Cheng, S.; Chen, D.; Wang, W.; Liu, B. Reducing PM2.5 and secondary inorganic aerosols by agricultural ammonia emission mitigation within the Beijing-Tianjin-Hebei region, China. Atmos. Environ. 2019, 219, 116989. [Google Scholar] [CrossRef]
  80. Gu, B.; Sutton, M.; Chang, S.; Ge, Y.; Chang, J. Agricultural ammonia emissions contribute to China’s urban air pollution. Front. Ecol. Environ. 2014, 12, 265–266. [Google Scholar] [CrossRef]
  81. Wu, Y.; Gu, B.; Erisman, J.W.; Reis, S.; Fang, Y.; Lu, X.; Zhang, X. PM2.5 pollution is substantially affected by ammonia emissions in China. Environ. Pollut. 2016, 218, 86–94. [Google Scholar] [CrossRef] [PubMed] [Green Version]
  82. Tao, J.; Gao, J.; Zhang, L.; Zhang, R.; Che, H.; Zhang, Z.; Lin, Z.; Jing, J.; Cao, J.; Hsu, S.C. PM2.5 pollution in a megacity of Southwest China: Source apportionment and implication. Atmos. Chem. Phys. 2014, 14, 8679–8699. [Google Scholar] [CrossRef] [Green Version]
  83. Wu, S.-P.; Zhang, Y.-J.; Schwab, J.J.; Li, Y.-F.; Liu, Y.-L.; Yuan, C.-S. High-resolution ammonia emissions inventories in Fujian, China, 2009–2015. Atmos. Environ. 2017, 162, 100–114. [Google Scholar] [CrossRef]
  84. Huang, R.J.; Zhang, Y.; Bozzetti, C.; Ho, K.F.; Cao, J.J.; Han, Y.; Daellenbach, K.R.; Slowik, J.G.; Platt, S.M.; Canonaco, F.; et al. High secondary aerosol contribution to particulate pollution during haze events in China. Nature 2014, 514, 218–222. [Google Scholar] [CrossRef] [Green Version]
Figure 1. The annual and seasonal q values (a) and correlation coefficient (b) between PM2.5 concentrations and influencing factors at the national scale. Note: VO denotes volatile organic compounds (VOCs); NO denotes NOx; NH denotes NH3; SO denotes SO2.
Sustainability 12 03550 g001
Figure 2. The q values of impacting factors at the annual and seasonal time scales in 10 regions of China. Note: VO denotes VOCs; NO denotes NOx; NH denotes NH3; SO denotes SO2.
Sustainability 12 03550 g002
Figure 3. The annual interactive and individual q value of impacting factors in China. Note: VO denotes VOCs; NO denotes NOx; NH denotes NH3; SO denotes SO2.
Sustainability 12 03550 g003
Figure 4. Annual interactions between driving factors at the regional scale (we listed the top 15 interactions). Note: VO denotes VOCs; NO denotes NOx; NH denotes NH3; SO denotes SO2.
Sustainability 12 03550 g004

