Improved Model Parameter Transferability Method for Hydrological Simulation with SWAT in Ungauged Mountainous Catchments


Abstract
:1. Introduction
2. Data and Methods
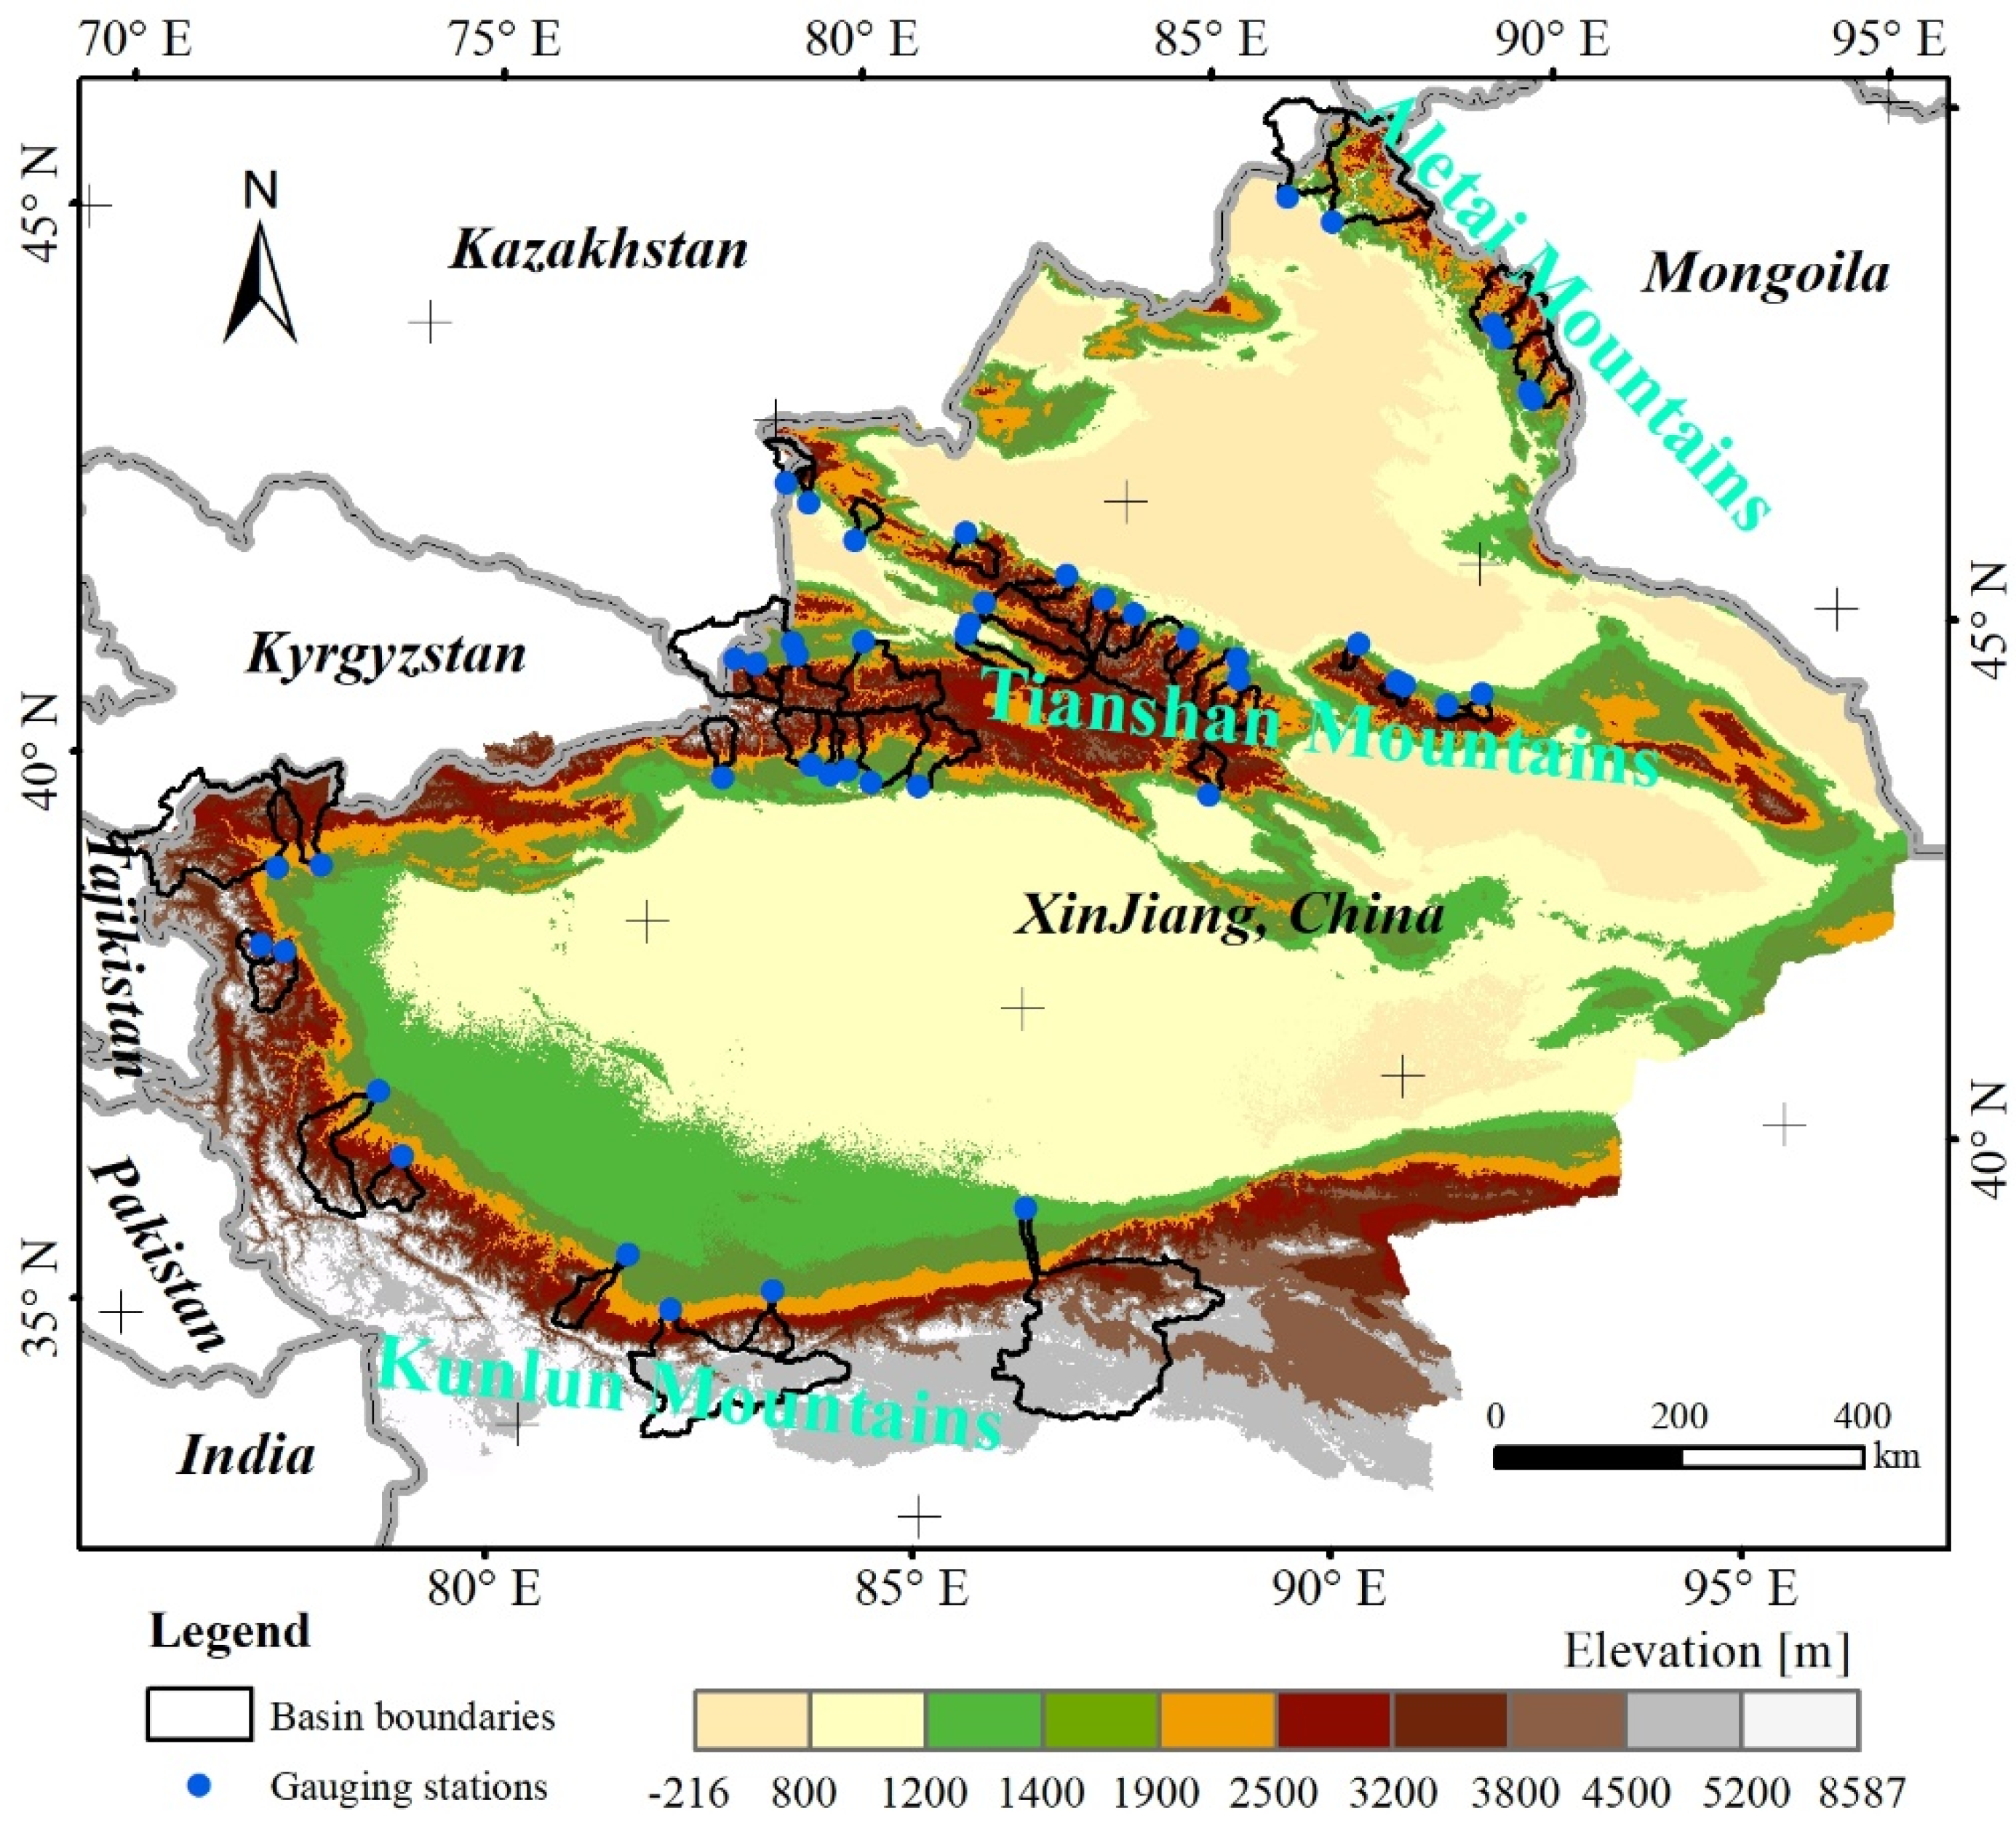
2.1. Catchments
2.2. Data Sources
2.3. SWAT Model
2.4. Traditional Model Parameter Transferability Methods
2.4.1. Theoretical Basis
2.4.2. Traditional Parameter Transfer Methods
- (1)
- Distance approximation principle
- (2)
- Attribute similarity principle
3. Improved Model Parameter Transferability Method
3.1. Basic Idea and Overall Design
3.2. Parameter Sensitivity Analysis
3.3. Improved Model Parameter Transferability Method
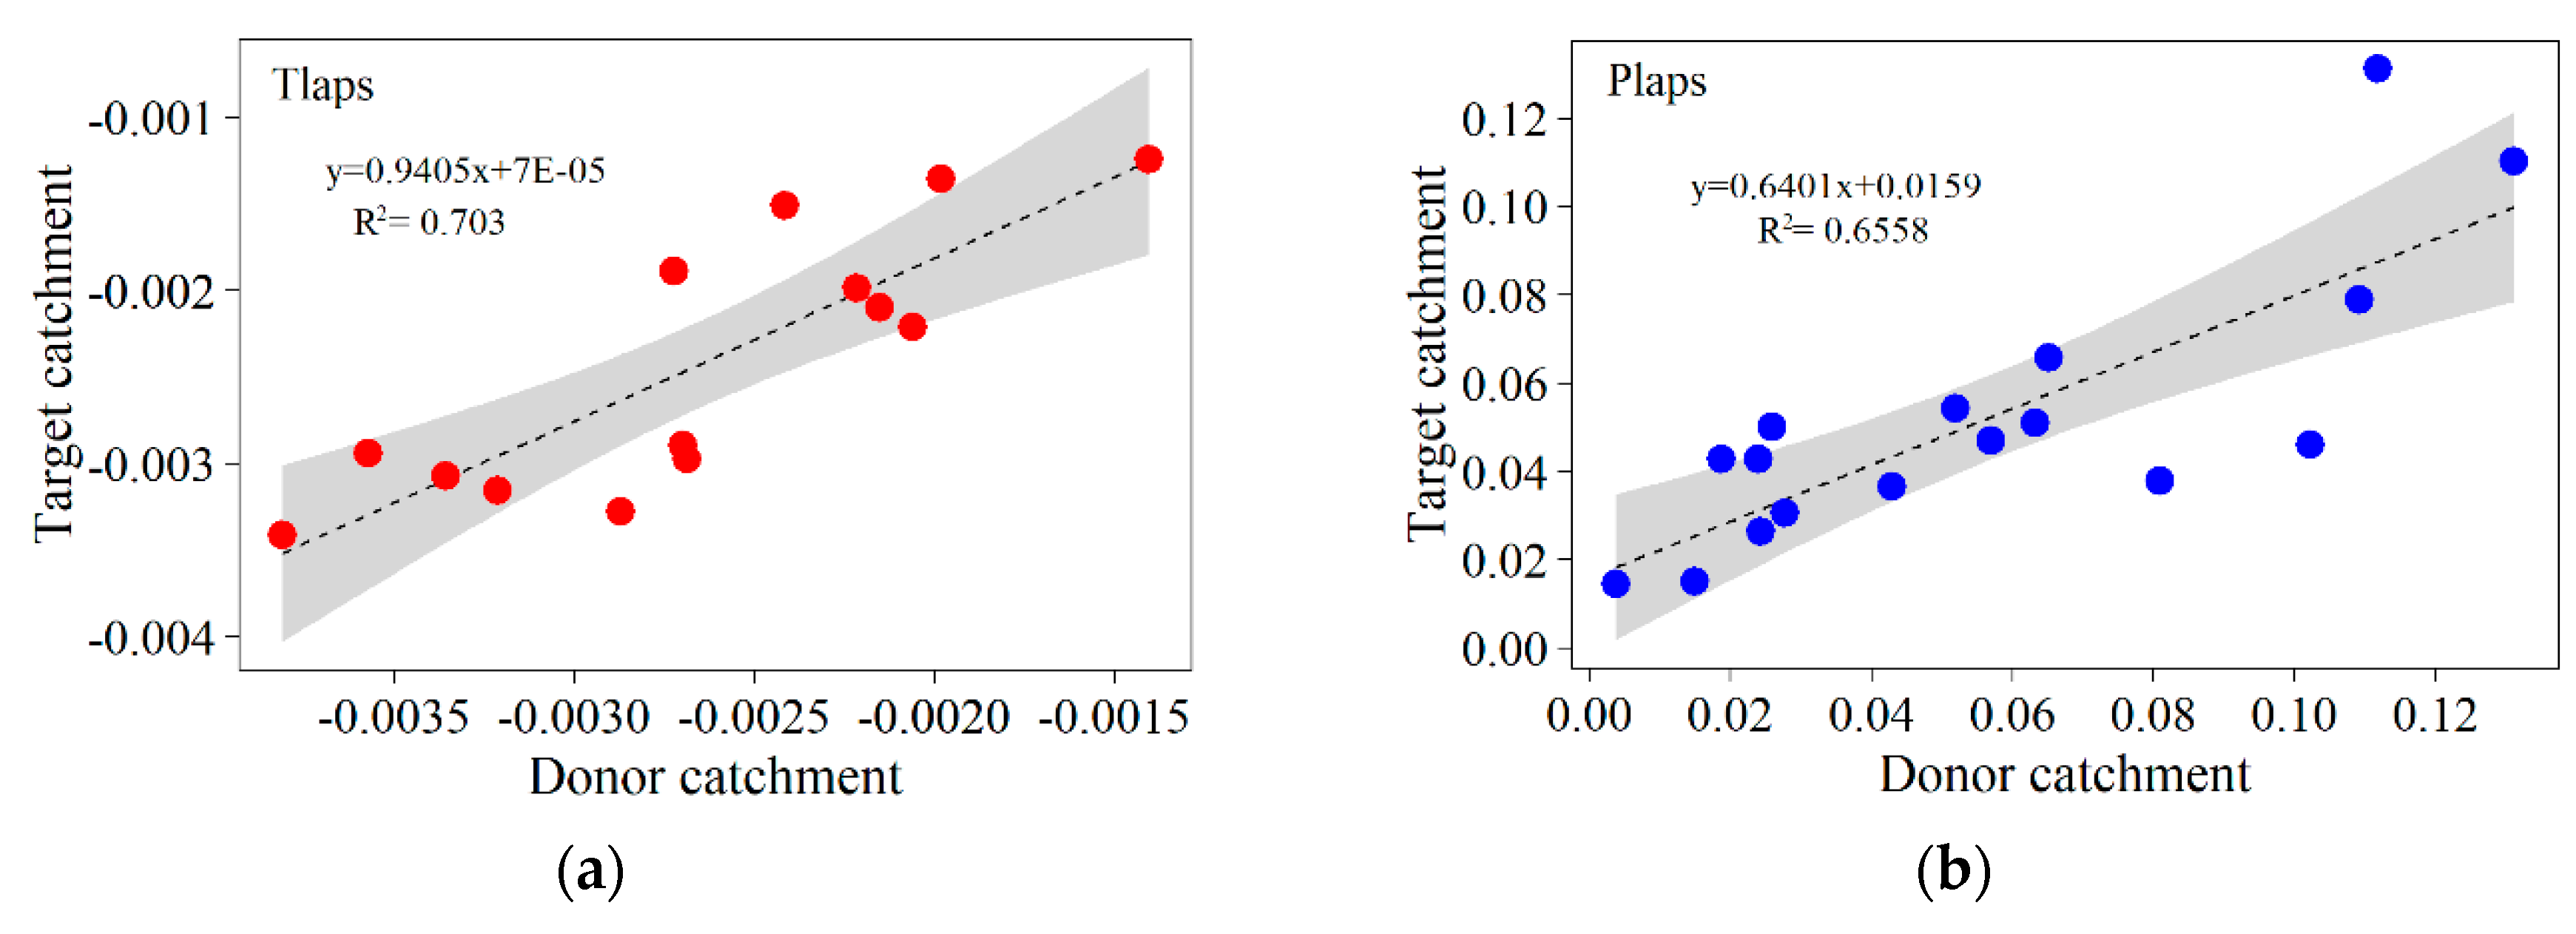
3.3.1. PLAPS and TLAPS
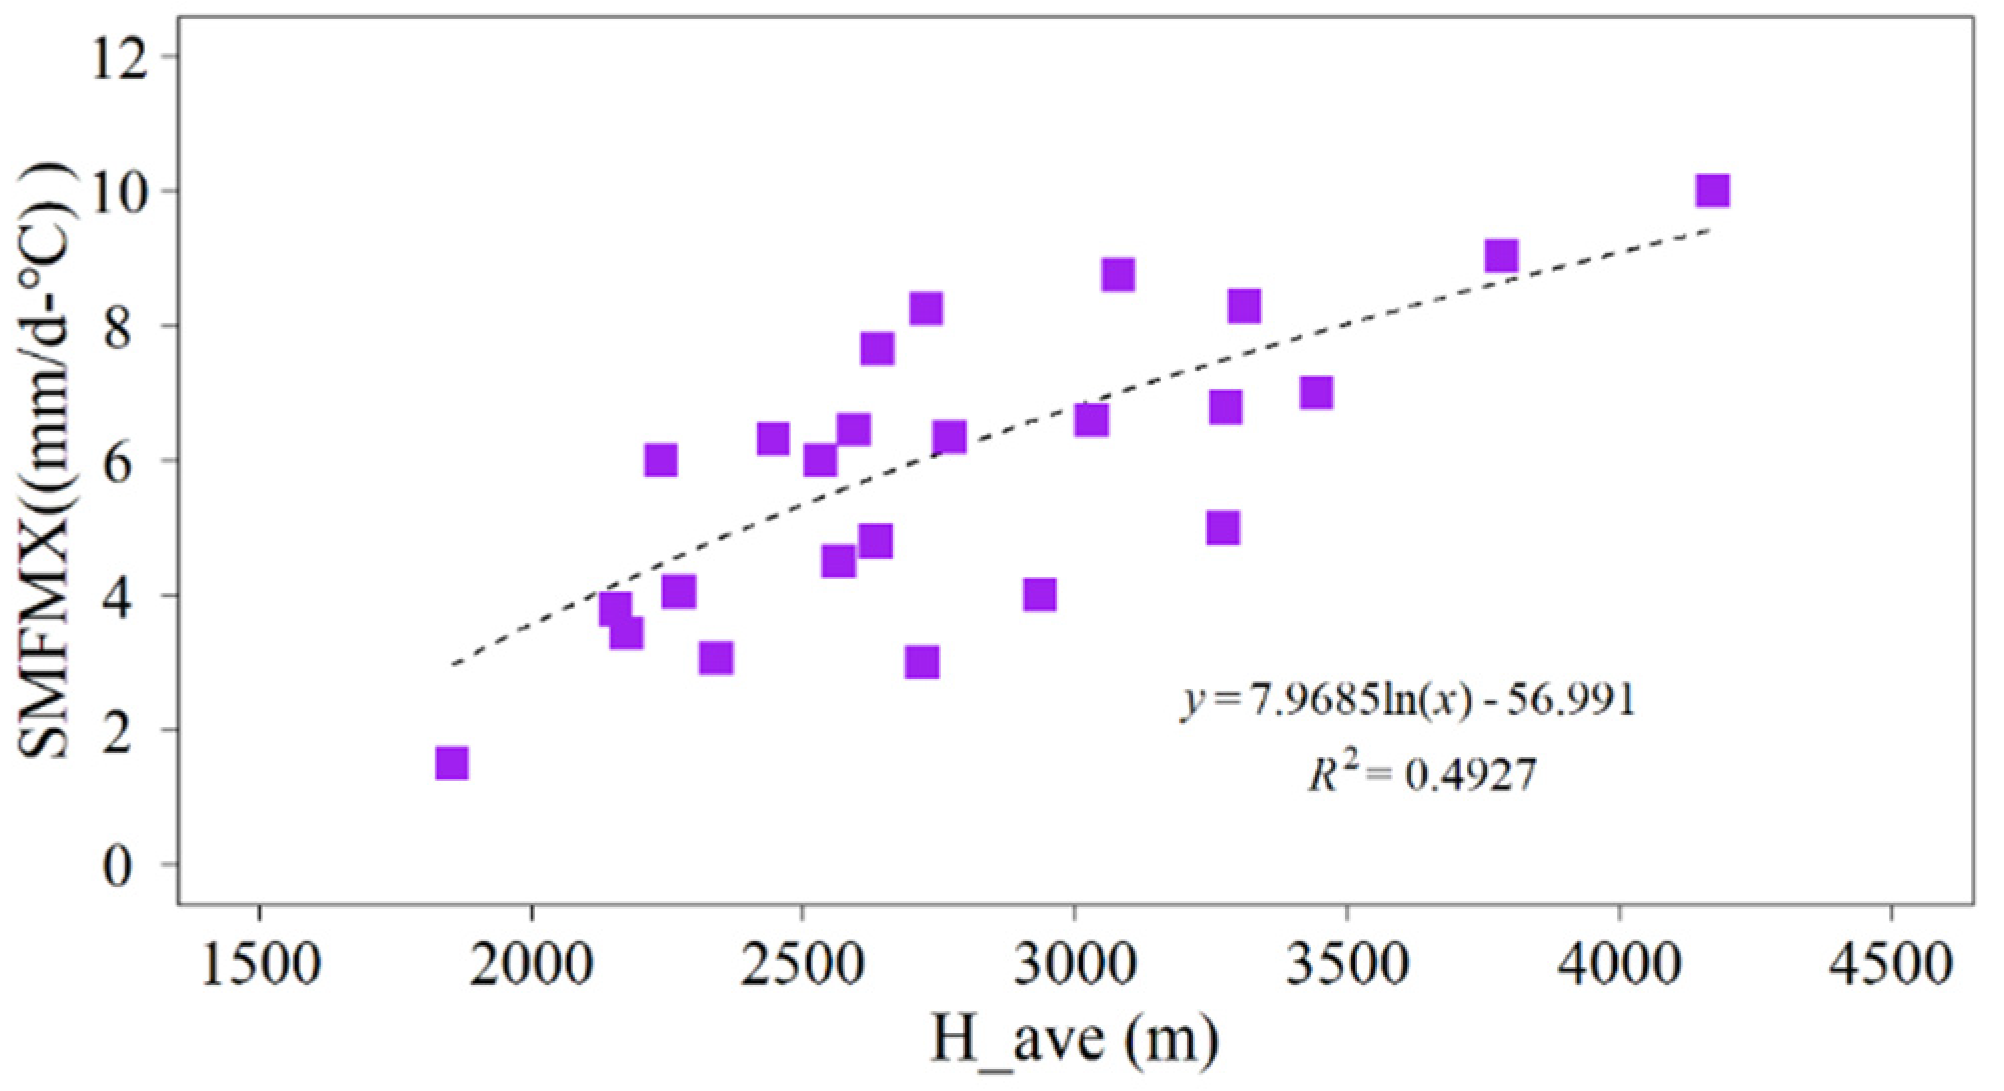
3.3.2. SMFMX
3.3.3. CH_N2
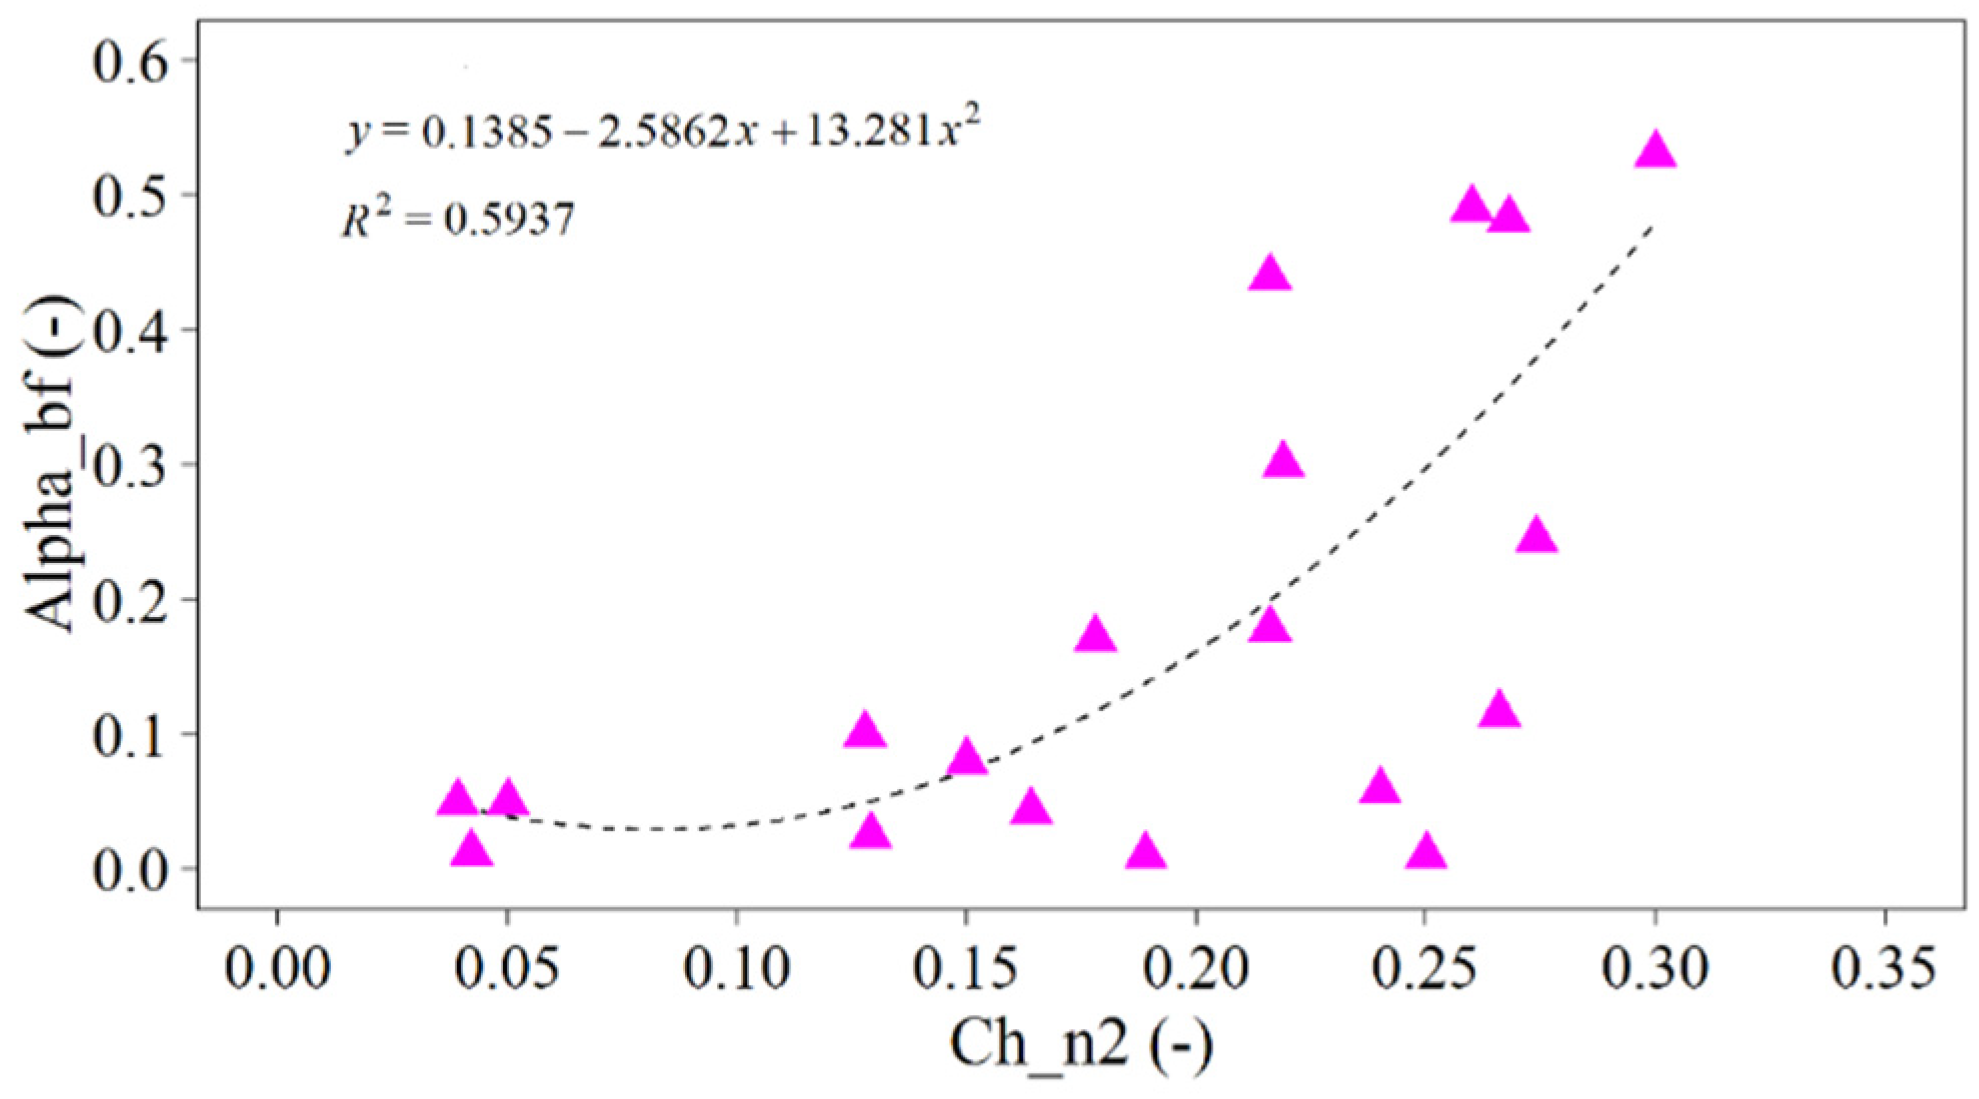
3.3.4. ALPHA_BF
3.3.5. Alternative Model Parameter Transfer Rules
- The DAP method is used to initially select 2–3 standby donor catchments,
- The ASP method is used to determine the closest attributes of the candidate donor catchments as the donor catchments,
- Correlate the model parameter set of the donor catchment with the closest attributes to the target catchment model,
- According to the average elevation of the donor catchment and target catchment, and TLAPS of the donor catchment, the TLAPS transfer rule of the target catchment is as follows:TLAPS_T = (TLAPS_D / H_ave_D) × H_ave_T,
- According to the average elevation of the donor catchment and target catchment, and PLAPS of the donor catchment, the PLAPS transfer rule of the target catchment is as follows:PLAPS_T = (PLAPS_D / H_ave_D) × H_ave_T,
- According to the average elevation of the target catchment, the SMFMX transfer rule of the target catchment is as follows:SMFMX = 7.9685 × Ln(H_ave) − 56.991,
- According to the river channel length and average slope of the target catchment, the CH_N2 transfer rule of the target catchment is as follows:CH_N2 = 0.873 × (L_reach/Slope_ave)−0.75,
- According to Manning’s “n” value for the main channel of the target catchment, the ALPHA_BF transfer rule of the target catchment is as follows:ALPHA_BF = 13.281 × (CH_N2)2−2.5862 × CH_N2 + 0.1385,
4. Case Study
4.1. Selection of Donor Catchment
4.2. Validation of the Improved Model Parameter Transferability Method
5. Discussion
5.1. Sensitivity Analysis
5.2. The Difference of Model Parameter Transferability Method
6. Conclusions
Supplementary Materials
Author Contributions
Funding
Acknowledgments
Conflicts of Interest
References
- Gitau, M.W.; Chaubey, I. Regionalization of SWAT model parameters for use in ungauged watersheds. Water 2010, 2, 849–871. [Google Scholar] [CrossRef]
- Yao, C.; Zhang, K.; Yu, Z.; Li, Z.; Li, Q. Improving the flood prediction capability of the Xinanjiang model in ungauged nested catchments by coupling it with the geomorphologic instantaneous unit hydrograph. J. Hydrol. 2014, 517, 1035–1048. [Google Scholar] [CrossRef]
- Li, H.; Zhang, Y.; Chiew, F.H.; Xu, S. Predicting runoff in ungauged catchments by using Xinanjiang model with MODIS leaf area index. J. Hydrol. 2009, 370, 155–162. [Google Scholar] [CrossRef]
- Gumindoga, W.; Rientjes, T.; Haile, A.; Dube, T. Predicting streamflow for land cover changes in the Upper Gilgel Abay River Basin, Ethiopia: A TOPMODEL based approach. Phys. Chem. Earth Parts A B C 2014, 76, 3–15. [Google Scholar] [CrossRef]
- Xue, L.; Yang, F.; Yang, C.; Wei, G.; Li, W.; He, X. Hydrological simulation and uncertainty analysis using the improved TOPMODEL in the arid Manas River basin, China. Sci. Rep. 2018, 8, 1–12. [Google Scholar] [CrossRef] [Green Version]
- Abbaspour, K.C.; Rouholahnejad, E.; Vaghefi, S.; Srinivasan, R.; Yang, H.; Kløve, B. A continental-scale hydrology and water quality model for Europe: Calibration and uncertainty of a high-resolution large-scale SWAT model. J. Hydrol. 2015, 524, 733–752. [Google Scholar] [CrossRef] [Green Version]
- Meng, F.; Liu, T.; Wang, H.; Luo, M.; Duan, Y.; Bao, A. An alternative approach to overcome the limitation of HRUs in analyzing hydrological processes based on land use/cover change. Water 2018, 10, 434. [Google Scholar] [CrossRef] [Green Version]
- Duan, Y.; Meng, F.; Liu, T.; Huang, Y.; Luo, M.; Xing, W.; De Maeyer, P. Sub-daily simulation of mountain flood processes based on the modified soil water assessment tool (swat) model. Int. J. Environ. Res. 2019, 16, 3118. [Google Scholar] [CrossRef] [Green Version]
- Prabhanjan, A.; Rao, E.; Eldho, T. Application of SWAT model and geospatial techniques for sediment-yield modeling in ungauged watersheds. J. Hydrol. Eng. 2015, 20, C6014005. [Google Scholar] [CrossRef]
- Qi, J.; Li, S.; Bourque, C.P.-A.; Xing, Z.; Meng, F.-R. Developing a decision support tool for assessing land use change and BMPs in ungauged watersheds based on decision rules provided by SWAT simulation. Hydrol. Earth Syst. Sci. 2018, 22, 3789–3806. [Google Scholar] [CrossRef] [Green Version]
- Jodar-Abellan, A.; Valdes-Abellan, J.; Pla, C.; Gomariz-Castillo, F. Impact of land use changes on flash flood prediction using a sub-daily SWAT model in five Mediterranean ungauged watersheds (SE Spain). Sci. Total Environ. 2019, 657, 1578–1591. [Google Scholar] [CrossRef] [PubMed]
- Khadka, D.; Babel, M.S.; Shrestha, S.; Tripathi, N.K. Climate change impact on glacier and snow melt and runoff in Tamakoshi basin in the Hindu Kush Himalayan (HKH) region. J. Hydrol. 2014, 511, 49–60. [Google Scholar] [CrossRef]
- Sturm, M.; Goldstein, M.A.; Parr, C. Water and life from snow: A trillion dollar science question. Water Resour. Res. 2017, 53, 3534–3544. [Google Scholar] [CrossRef]
- Sivapalan, M.; Takeuchi, K.; Franks, S.; Gupta, V.; Karambiri, H.; Lakshmi, V.; Liang, X.; McDonnell, J.; Mendiondo, E.; O’connell, P. IAHS Decade on Predictions in Ungauged Basins (PUB), 2003–2012: Shaping an exciting future for the hydrological sciences. Hydrol. Sci. J. 2003, 48, 857–880. [Google Scholar] [CrossRef] [Green Version]
- Rojas-Serna, C.; Lebecherel, L.; Perrin, C.; Andréassian, V.; Oudin, L. How should a rainfall-runoff model be parameterized in an almost ungauged catchment? A methodology tested on 609 catchments. Water Resour. Res. 2016, 52, 4765–4784. [Google Scholar] [CrossRef] [Green Version]
- Wu, B.; Li, X.; Ao, T.; Fan, Y.; Wang, X. Study of SWAT model based on parameter transfer method in data scarce catchment for non-point source pollution simulation. J. Sichuan Univ. Eng. Sci. Ed. 2015, 47, 9–16. [Google Scholar]
- Cheng, Y.; Ao, T.; Li, X.; Wu, B. Runof simulation by SWAT model based on parameters transfer method in ungauged catchments of middle reaches of Jialing River. Trans. Chin. Soc. Agric. Eng. 2016, 32, 81–86. [Google Scholar]
- Li, H.; Zhang, Y.; Ao, T.; Zhang, X. Comparison of regionalization approaches for runoff prediction in free of observational data catchments. J. Yangtze River Sci. Res. Inst. 2010, 27, 11–15. [Google Scholar]
- Roth, V.; Nigussie, T.K.; Lemann, T. Model parameter transfer for streamflow and sediment loss prediction with SWAT in a tropical watershed. Environ. Earth Sci. 2016, 75, 1321. [Google Scholar] [CrossRef] [Green Version]
- Pan, J.; Hu, Z.; Gu, H.; Yan, H.; Shao, F. Runof simulation in ungauged basins in coastal zone of liaoxi corridor based on SWAT model. J. China Hydrol. 2009, 29, 62–64. [Google Scholar]
- Yokoo, Y.; Kazama, S.; Sawamoto, M.; Nishimura, H. Regionalization of lumped water balance model parameters based on multiple regression. J. Hydrol. 2001, 246, 209–222. [Google Scholar] [CrossRef]
- Duan, Q.; Koren, V.; Koch, P.; Schaake, J. Use of NDVI and soil characteristics data for regional parameter estimation of hydrologic models. Eos. Agu 1996, 77, 138. [Google Scholar]
- Gibbs, M.S.; Maier, H.R.; Dandy, G.C. A generic framework for regression regionalization in ungauged catchments. Environ. Model. Softw. 2012, 27–28, 1–14. [Google Scholar] [CrossRef]
- Heuvelmans, G.; Muys, B.; Feyen, J. Regionalisation of the parameters of a hydrological model: Comparison of linear regression models with artificial neural nets. J. Hydrol. 2006, 319, 245–265. [Google Scholar] [CrossRef]
- Oudin, L.; Andréassian, V.; Perrin, C.; Michel, C.; Le Moine, N. Spatial proximity, physical similarity, regression and ungaged catchments: A comparison of regionalization approaches based on 913 French catchments. Water Resour. Res. 2008, 44. [Google Scholar] [CrossRef]
- Gusev, E.M.; Ayzel, G.V.; Nasonova, O.N. Runoff evaluation for ungauged watersheds by SWAP model. 1. Application of artificial neural networks. Water Resour. 2017, 44, 169–179. [Google Scholar] [CrossRef]
- Grabowski, Z.J.; Watson, E.; Chang, H. Using spatially explicit indicators to investigate watershed characteristics and stream temperature relationships. Sci. Total Environ. 2016, 551–552, 376–386. [Google Scholar] [CrossRef] [Green Version]
- Athira, P.; Sudheer, K.P.; Cibin, R.; Chaubey, I. Predictions in ungauged basins: An approach for regionalization of hydrological models considering the probability distribution of model parameters. Stoch. Environ. Res. Risk Assess. 2015, 30, 1131–1149. [Google Scholar] [CrossRef]
- Luo, M.; Liu, T.; Meng, F.; Duan, Y.; Bao, A.; Xing, W.; Feng, X.; De Maeyer, P.; Frankl, A. Identifying climate change impacts on water resources in Xinjiang, China. Sci. Total Environ. 2019, 676, 613–626. [Google Scholar] [CrossRef]
- Luo, M.; Liu, T.; Frankl, A.; Duan, Y.; Meng, F.; Bao, A.; Kurban, A.; De Maeyer, P. Defining spatiotemporal characteristics of climate change trends from downscaled GCMs ensembles: How climate change reacts in Xinjiang, China. Int. J. Climatol. 2018, 38, 2538–2553. [Google Scholar] [CrossRef]
- Luo, M.; Meng, F.; Liu, T.; Duan, Y.; Frankl, A.; Kurban, A.; De Maeyer, P. Multi–model ensemble approaches to assessment of effects of local Climate Change on water resources of the Hotan River Basin in Xinjiang, China. Water 2017, 9, 584. [Google Scholar] [CrossRef]
- Luo, M.; Liu, T.; Meng, F.; Duan, Y.; Huang, Y.; Frankl, A.; De Maeyer, P. Proportional coefficient method applied to TRMM rainfall data: Case study of hydrological simulations of the Hotan River Basin (China). J. Water Clim. Chang. 2017, 8, 627–640. [Google Scholar] [CrossRef] [Green Version]
- Ling, H.; Xu, H.; Fu, J.; Liu, X. Surface runoff processes and sustainable utilization of water resources in Manas River Basin, Xinjiang, China. J. Arid Land 2012, 4, 271–280. [Google Scholar] [CrossRef]
- Meng, F.; Liu, T.; Huang, Y.; Luo, M.; Bao, A.; Hou, D. Quantitative detection and attribution of runoff variations in the Aksu River Basin. Water 2016, 8, 338. [Google Scholar] [CrossRef] [Green Version]
- Wortmann, M.; Krysanova, V.; Kundzewicz, Z.W.; Su, B.; Li, X. Assessing the influence of the Merzbacher Lake outburst floods on discharge using the hydrological model SWIM in the Aksu headwaters, Kyrgyzstan/NW China. Hydrol. Process. 2014, 28, 6337–6350. [Google Scholar] [CrossRef]
- Ye, B.; Ding, Y.; Kang, E.; Li, G.; Han, T. Response of the snowmelt and glacier runoff to the climate warming-up in the last 40 years in Xinjiang Autonomous Region, China. Sci. China Ser. D Earth Sci. 1999, 42, 44–51. [Google Scholar] [CrossRef]
- Stocker, T.F.; Qin, D.; Plattner, G.-K.; Tignor, M.; Allen, S.K.; Boschung, J. IPCC (2013) Climate Change 2013: The Physical Science Basis. Contribution of Working Group I to the Fifth Assessment Report of the Intergovernmental Panel on Climate Change; Cambridge University Press: Cambridge, UK, 2013. [Google Scholar]
- Huntington, T.G. Evidence for intensification of the global water cycle: Review and synthesis. J. Hydrol. 2006, 319, 83–95. [Google Scholar] [CrossRef]
- Xu, C.; Chen, Y.; Yang, Y.; Hao, X.; Shen, Y. Hydrology and water resources variation and its response to regional climate change in Xinjiang. J. Geogr. Sci. 2010, 20, 599–612. [Google Scholar] [CrossRef]
- Duan, Y.; Liu, T.; Meng, F.; Luo, M.; Frankl, A.; De Maeyer, P.; Bao, A.; Kurban, A.; Feng, X. Inclusion of modified snow melting and flood processes in the swat model. Water 2018, 10, 1715. [Google Scholar] [CrossRef] [Green Version]
- Shen, Y.; Su, H.; Wang, G.; Mao, W. The responses of glaciers and snow cover to climate in Xinjiang (I). J. Glaciol. Geocryol. 2013, 35, 513–527. [Google Scholar]
- Arnold, J.G.; Srinivasan, R.; Muttiah, R.S.; Williams, J.R. Large area hydrologic modeling and assessment part I: Model development 1. Jawra J. Am. Water Resour. Assoc. 1998, 34, 73–89. [Google Scholar] [CrossRef]
- Me, W.; Abell, J.M.; Hamilton, D.P. Effects of hydrologic conditions on SWAT model performance and parameter sensitivity for a small, mixed land use catchment in New Zealand. Hydrol. Earth Syst. Sci. 2015, 19, 4127–4147. [Google Scholar] [CrossRef] [Green Version]
- Duan, Y.; Liu, T.; Meng, F.; Yuan, Y.; Luo, M.; Huang, Y.; Xing, W.; Nzabarinda, V.; De Maeyer, P. Accurate simulation of ice and snow runoff for the mountainous terrain of the kunlun mountains, China. Remote Sens. 2020, 12, 179. [Google Scholar] [CrossRef] [Green Version]
- Dhami, B.; Himanshu, S.K.; Pandey, A.; Gautam, A.K. Evaluation of the SWAT model for water balance study of a mountainous snowfed river basin of Nepal. Environ. Earth Sci. 2018, 77. [Google Scholar] [CrossRef]
- Kim, S.B.; Shin, H.J.; Park, M.; Kim, S.J. Assessment of future climate change impacts on snowmelt and stream water quality for a mountainous high-elevation watershed using SWAT. Paddy Water Environ. 2014, 13, 557–569. [Google Scholar] [CrossRef]
- Andrianaki, M.; Shrestha, J.; Kobierska, F.; Nikolaidis, N.P.; Bernasconi, S.M. Assessment of SWAT spatial and temporal transferability for a high-altitude glacierized catchment. Hydrol. Earth Syst. Sci. 2019, 23, 3219–3232. [Google Scholar] [CrossRef] [Green Version]
- Yang, J.; Reichert, P.; Abbaspour, K.C.; Xia, J.; Yang, H. Comparing uncertainty analysis techniques for a SWAT application to the Chaohe Basin in China. J. Hydrol. 2008, 358, 1–23. [Google Scholar] [CrossRef]
- Li, S.; He, D.; Zhang, Y. Temporal and Spatial Variation of Precipitation in the Vertical Ridge and Valley and Its Regional Differentiation. Chin. Sci. Bull. 2007, 52, 51–63. [Google Scholar]
- Luo, M.; Liu, T.; Meng, F.; Duan, Y.; Frankl, A.; Bao, A.; De Maeyer, P. Comparing bias correction methods used in downscaling precipitation and temperature from regional climate models: A case study from the Kaidu River Basin in Western China. Water 2018, 10, 1046. [Google Scholar] [CrossRef] [Green Version]
- Arnold, J.; Kiniry, J.; Srinivasan, R.; Williams, J.; Haney, E.; Neitsch, S. SWAT 2012 Input/Output Documentation; Texas Water Resources Institute: College Station, TX, USA, 2013. [Google Scholar]
- Fang, G.; Yang, J.; Chen, Y.; Li, Z.; Ji, H.; De Maeyer, P. How hydrologic processes differ spatially in a large basin: Multisite and multiobjective modeling in the tarim river basin. J. Geophys. Res. Atmos. 2018. [Google Scholar] [CrossRef]
- Dakhlalla, A.O.; Parajuli, P.B. Assessing model parameters sensitivity and uncertainty of streamflow, sediment, and nutrient transport using SWAT. Inf. Process. Agric. 2019, 6, 61–72. [Google Scholar] [CrossRef]
- Qi, J.; Li, S.; Jamieson, R.; Hebb, D.; Xing, Z.; Meng, F.-R. Modifying SWAT with an energy balance module to simulate snowmelt for maritime regions. Environ. Model. Softw. 2017, 93, 146–160. [Google Scholar] [CrossRef]
- Zimmer, M.A.; McGlynn, B.L. Bidirectional stream-groundwater flow in response to ephemeral and intermittent streamflow and groundwater seasonality. Hydrological Processes. 2017, 31, 3871–3880. [Google Scholar] [CrossRef]
- Tuozzolo, S.; Langhorst, T.; de Moraes Frasson, R.P.; Pavelsky, T.; Durand, M.; Schobelock, J.J. The impact of reach averaging Manning’s equation for an in-situ dataset of water surface elevation, width, and slope. J. Hydrol. 2019, 578, 123866. [Google Scholar] [CrossRef]
- Attari, M.; Hosseini, S.M. A simple innovative method for calibration of Manning’s roughness coefficient in rivers using a similarity concept. J. Hydrol. 2019, 575, 810–823. [Google Scholar] [CrossRef]
- Kim, T.B.; Yang, J.S. Contribution of baseflow during dry spells in irregular channel cross section. Hydrol. Process. 2017, 31, 1161–1173. [Google Scholar] [CrossRef]
- Cho, J.; Lowrance, R.R.; Bosch, D.D.; Strickland, T.C.; Her, Y.; Vellidis, G. Effect of Watershed Subdivision and Filter Width on SWAT Simulation of a Coastal Plain Watershed1. Jawra J. Am. Water Resour. Assoc. 2010, 46, 586–602. [Google Scholar] [CrossRef]
- Samadi, S.Z. Assessing the sensitivity of SWAT physical parameters to potential evapotranspiration estimation methods over a coastal plain watershed in the southeastern United States. Hydrol. Res. 2017, 48, 395–415. [Google Scholar] [CrossRef]


| Parameter | Physical Meaning of Parameters | Ranges | t-stat | p-value |
|---|---|---|---|---|
| PLAPS | Precipitation lapse rate (mm H2O/km) | −1000~1000 | −12.41 | 0.005 |
| TLAPS | Temperature lapse rate (°C/km) | −10~10 | −3.49 | 0.006 |
| SMFMX | Melt factor for snow on June 21(mm H2O/°C-day) | 0~20 | 2.88 | 0.007 |
| ALPHA_BF | Baseflow alpha factor (1/days) | 0~1 | −2.51 | 0.012 |
| CH_N2 | Manning’s “n” value for the main channel | −0.01~3 | −2.29 | 0.026 |
| CH_K1 | Effective hydraulic conductivity in tributary channel alluvium (mm/hr) | 0~300 | 1.9 | 0.058 |
| CN2 | Initial SCS runoff curve number for moisture condition II | 35~98 | −1.76 | 0.088 |
| GWQMN | Threshold depth of water in the shallow aquifer required for return flow to occur (mm H2O) | 0~5000 | 1.57 | 0.126 |
| SURLAG | Surface runoff lag coefficient | 0.05~24 | 1.48 | 0.156 |
| SNOCOVMX | Minimum snow water content that corresponds to 100% snow cover, SNO100 (mm H2O) | 0~500 | −1.36 | 0.190 |
| REVAPMN | Threshold depth of water in the shallow aquifer for “revap” or percolation to the deep aquifer to occur (mm H2O) | 0~500 | −1.27 | 0.215 |
| SOL_K | Saturated hydraulic conductivity (mm/hr) | 0~2000 | −1.21 | 0.248 |
| EPCO | Plant uptake compensation factor | 0~1 | −1 | 0.313 |
| SMFMN | Melt factor for snow on December 21(mm H2O/°C-day) | 0~20 | 0.98 | 0.333 |
| LAT_TTIME | Lateral flow travel time (days) | 0~180 | −0.96 | 0.332 |
| GW_REVAP | Groundwater “revap” coefficient | 0.02~0.2 | −0.93 | 0.359 |
| SOL_AWC | Available water capacity of the soil layer (mm H2O/mm soil) | 0~1 | 0.89 | 0.379 |
| TIMP | Snow pack temperature lag factor | 0~1 | 0.79 | 0.468 |
| ESCO | Soil evaporation compensation factor | 0~1 | 0.68 | 0.473 |
| SHALLST | Initial depth of water in the shallow aquifer (mm H2O) | 0~50000 | 0.66 | 0.532 |
| RCHRG_DP | Deep aquifer percolation fraction | 0~1 | −0.48 | 0.565 |
| SMTMP | Snow-melt base temperature (°C) | −20~20 | −0.48 | 0.593 |
| CH_K2 | Effective hydraulic conductivity in main channel alluvium (mm/hr) | −0.01~500 | −0.46 | 0.636 |
| GW_DELAY | Groundwater delay time (days) | 0~500 | 0.22 | 0.716 |
| CH_N1 | Manning’s “n” value for the tributary channel | 0.01~30 | 0.19 | 0.778 |
| SFTMP | Snowfall temperature (°C) | −20~20 | −0.11 | 0.791 |
| OV_N | Manning’s “n” value for overland flow | 0.01~30 | 0.11 | 0.813 |
| River | Distance (km) | Catchment Area (km²) | Average Slope (°) | Average Elevation (m) | Average Annual Precipitation (mm) | Average Annual Temperature (°C) | |
|---|---|---|---|---|---|---|---|
| KU | - | 1967.14 | 20.70 | 2540.94 | 220.16 | 5.32 | - |
| KL | 159.50 | 2359.87 | 20.18 | 2429.38 | 206.29 | 5.29 | 26.87 |
| KA | 38.61 | 1624.98 | 15.75 | 2200.04 | 222.38 | 5.48 | 66.11 |
| Target Catchment—KU River | ||||
|---|---|---|---|---|
| Distance Proximity | Attribute Similarity | |||
| Donor catchment | KA river (DAP) | 1 | 2 | 0.27/0.55 |
| KL river (ASP) | 2 | 1 | 0.36/0.65 | |
| Parameter Transfer Scheme | Evaluation Indicator | |
|---|---|---|
| KL river catchment model parameters (ASP) | 0.36 | 0.65 |
| KA river catchment model parameters (DAP) | 0.27 | 0.55 |
| Modified KL river catchment model parameters (IMPTM) | 0.69 | 0.85 |
© 2020 by the authors. Licensee MDPI, Basel, Switzerland. This article is an open access article distributed under the terms and conditions of the Creative Commons Attribution (CC BY) license (http://creativecommons.org/licenses/by/4.0/).
Share and Cite
Meng, F.; Sa, C.; Liu, T.; Luo, M.; Liu, J.; Tian, L. Improved Model Parameter Transferability Method for Hydrological Simulation with SWAT in Ungauged Mountainous Catchments. Sustainability 2020, 12, 3551. https://doi.org/10.3390/su12093551
Meng F, Sa C, Liu T, Luo M, Liu J, Tian L. Improved Model Parameter Transferability Method for Hydrological Simulation with SWAT in Ungauged Mountainous Catchments. Sustainability. 2020; 12(9):3551. https://doi.org/10.3390/su12093551
Chicago/Turabian StyleMeng, Fanhao, Chula Sa, Tie Liu, Min Luo, Jiao Liu, and Lin Tian. 2020. "Improved Model Parameter Transferability Method for Hydrological Simulation with SWAT in Ungauged Mountainous Catchments" Sustainability 12, no. 9: 3551. https://doi.org/10.3390/su12093551
APA StyleMeng, F., Sa, C., Liu, T., Luo, M., Liu, J., & Tian, L. (2020). Improved Model Parameter Transferability Method for Hydrological Simulation with SWAT in Ungauged Mountainous Catchments. Sustainability, 12(9), 3551. https://doi.org/10.3390/su12093551