Article

Assessment of the Agricultural Water Use in Jericho Governorate Using Sefficiency

1
CTAC, University of Minho, Azurem Campus, 4800-058 Guimarães, Portugal
2
Civil Engineering Department, Kano University of Science & Technology, Wudil 713281, Nigeria
*
Author to whom correspondence should be addressed.
Sustainability 2020, 12(9), 3634; https://doi.org/10.3390/su12093634
Submission received: 25 March 2020 / Revised: 28 April 2020 / Accepted: 29 April 2020 / Published: 1 May 2020
(This article belongs to the Section Environmental Sustainability and Applications)

Abstract

:
Addressing water use efficiency in the Middle East is challenging due to the geopolitical complexity, climatic conditions and a variety of managerial issues. Groundwater is the dominant water resource for Palestinians, while aquifers are shared with their neighbours. We assessed in this study the efficiency of the agricultural water use in Jericho, which we defined as the Water Use System (WUS), and its impact on the main source, the Eastern Aquifer Basin (EAB), using the Sustainable Efficiency (Sefficiency) method. The assessment considered the objectives’ difference between the farmers in the region and the water managers. As Sefficiency requires, the analysis also considered in addition to the quantities of the different water path types within our WUS, their quality and beneficial weights. The results highlighted efficiency improvement potentials, a substantial number of unreported abstractions and an impact of the use of chemical substances on the main source. In addition, through hypothesizing four scenarios, we demonstrated that: 1. Improving the quality of returns has a great positive impact. 2. Increasing water abstractions is not beneficial if it is not linked to an increase in yield production. 3. Precipitation rates can influence water use efficiency. 4. More careful treatment of the unwanted plants and a selection of high socio-economic value crops would enhance Sefficiency.

1. Introduction

Water issues in Palestine extend beyond being a scarce resource. Other factors contribute to the water crisis in that region. Those factors include, but are not limited to: climate change impacts [1,2,3,4]; the exponential population growth [5,6]; and that the major freshwater resources are mostly transboundary with political complexity [7,8]. Furthermore, the absence of official strategic water policies and the low level of unconventional resources (e.g., wastewater reuse and desalination) development [9,10] are critical components of the crisis.
West Bank is one of the two main areas (the other is Gaza Strip) included in the international geographic recognition of Palestine [11]. As Palestinians have no access to the Jordan River since 1967 [12], which is their only conventional surface water resource, groundwater is the primary freshwater source and provides more than 95% of all supplies [13]. There are two main aquifer systems in Palestine: the Mountain Aquifer (for West Bank) and the Costal Aquifer (for Gaza Strip). The Mountain Aquifer, which is a high quality freshwater resource in the region, has three basins: the Western Aquifer Basin (WAB), the North-Eastern Aquifer Basin (NEAB) and the Eastern Aquifer Basin (EAB) [14]. EAB has an area of 2896 km2, which is a little more than 51% of the total area of the West Bank, and a long-term average recharge of 125–197 million cubic meter (Mm3) [15]. As per the Palestinian Water Authority (PWA), which is the governing body of water resources for Palestinians, the annual yield abstracted from EAB by Palestinians tends to increase: 23 Mm3 in 2003 [6], 42 Mm3 in 2011 [16], 53 Mm3 in 2012 [15], up to 64.8 Mm3 in 2015 (latest published PWA update) [13].
Israelis also abstract from EAB their allocation (40 Mm3) according to the Oslo II Agreement in 1995 (a follow-up agreement to the Declaration of Principles known as Oslo I, which both sides signed in 1993). The Palestinian’s share in the agreement is set to be 54 Mm3 per year, while “an additional 78 Mm3 are to be developed” [17]—presumably by both sides. PWA claims that the Israeli side abstracts from EAB an estimated additional 100 Mm3 [16], exceeding the agreed 78 Mm3 while preventing Palestinians from developing any further abstractions there. On the other hand, the Israeli Water Authority reports Palestinian undesirable practices, including the drilling of 300 unauthorized wells until 2011, the disposal of untreated wastewater, and the dereliction of developing unconventional sources [18,19].
The Palestinians have been placing their efforts into expanding access to the available resources and exploring the potentials to develop additional resources. An extensive review of the governmental reports exposes a clear absence of strategic planning and management insights apart from the aforementioned efforts. For instance, the PWA Strategic Water Resource and Transmission Plan [20] and the Water Sector Reform Plan 2016–2018 [21] tackle filling the water gap mainly through reallocation. There is absence of discussion about enhancing efficient use practices, facilities rehabilitation and demand management, however, multiple scholars have suggested the latter two approaches as viable options to address water shortage in the region [22,23,24]. Studies about assessments of water use efficiency in Palestine are rare, apart from a few but important publications that come across efficient irrigation techniques to maximize local crop yields, e.g., [25]. Other attempts [26,27] assessed the efficiency of local irrigation methods and the relative efficiencies of water supply systems at the municipal level as water management strategies. However, their assessments are based on an outdated efficiency evaluation approach (Classical Efficiency).
Classical Efficiency (CE) is defined as the ratio of the water beneficially used to total water applied. As simple and basic as it may appear, there is a fundamental flaw behind CE, which is the absence of water balance. Many researchers [28,29,30,31,32] highlighted the CE’s inability to address critical elements such as irrigation water recovery, water reuse, water quality and to distinguish between water consumption and water use. They emphasized the necessity of improving the definition of water use efficiency using a more comprehensive approach. Among the efforts to address this issue, some scholars introduced Effective Efficiency (EE) considering water quality as a component in efficiency evaluation [33]. Subsequent work led to the development of EE models based on water quantity and quality, taking water reuse and the environmental interactions into account [34].
Sustainable Efficiency (Sefficiency), which Haie and Keller first introduced in 2012 [35], is a multi-level (macro, meso, and micro-efficiency) efficiency assessment approach based on water balance. It incorporates, along with water quantity and quality, the beneficence of water use defined by the system’s stakeholders—whether it was economic, environmental, social or any other benefit(s). As evident in many cases, active stakeholders’ involvement in an integrated water resources management strategy is a key to achieve its sustainability [36,37,38]. Public participation of local communities in Palestine as an approach to prioritize their needs is a trending practice amid the limited funds allocated. Nongovernmental organisations (NGOs) conduct most of such activities since the international donors often require that. Despite the trend and having studies stressing the need for public participation in the decision making [39,40], no evidence of active stakeholders participation in water resources management in Palestine is available.
This paper will use Sefficiency as an approach to assess the agricultural water use efficiency in the Palestinian part of Jordan Valley during the 2010/2011 season. We selected this season in particular because it is the most recent season for which the Palestinian official sources provide a complete data set that fits the purpose of this study. Jericho governorate, which constitutes more than 70% of the Valley’s area, used more than 62% of the total Palestinian EAB’s abstractions [16] making the governorate’s agricultural sector the main user of EAB. It represents the major economic activity in the region due to its yearlong favourable climatic conditions. Although the area under consideration falls entirely within the West Bank, it is part of a region where Israel produces 80% of its dates and 45% of its bananas [41]. In addition, the Jordan Valley contains 50% of their agricultural lands in the West Bank, being responsible for 60% of the Palestinian’s total vegetable production [42].

2. Methods and Materials

2.1. Sefficiency Method

Sefficiency is a composite indicator to estimate efficiency using the law of mass conservation (water balance), considering two types of total flows: total inflow and total consumption. The preliminary steps are to characterize a water use system (WUS), whether that system was a farm, basin, region, city, or something else. WUS characterization in Seffeciency is to locate WUS boundaries; distinguish between the different inflow and outflow water path types (WPTs) (Figure 1); and define the associated attributes, namely: quality and benefits—the useful dimension.
Water path instances (WPIs) are the real water instances flowing in or out of the system. Any WPT can potentially consist of zero, one or more WPIs.
As shown in Figure 1, there are two categories of WPTs based on the instance’s flow direction, namely, inflow and outflow pathways. Inflow paths can be of three types:
  • VA: Volume of abstracted water from the main source or alternatively, VU: the level of aquifer at the beginning of the period;
  • PP: Precipitation; and
  • OS: Volume of water from other sources (e.g., purchased water)
Outflow paths can be of four types:
  • RF: Return flow to the main source or alternatively, VD: the level of aquifer at the end of the period);
  • ET: Evapotranspiration;
  • RP: Potential return (the water returned to the environment, but not the main source, hence, aquifer replenishment is considered as RF not RP); and
  • NR: Nonreusable, water consumption (e.g., evaporation resulting from non-agricultural activities).
Useful remarks about the distinction between these WPTs are available in [30].
The change in storage over the analysis period (for example annually) should sum to zero, thus: total inflow = total outflow. Translating water balance:
(VA + OS + PP) − (ET + RP + RF + NR) = 0
It is important to bear in mind the consistency of flow units, e.g., Mm3.
The (VA + OS + PP) part of the equation is the total inflow, which will be denoted by index i . (inflow models), and subtracting ET and NR from the total inflow ( VA + OS + PP RF RP ) represents the WUS effective consumption, which will be denoted by index c . (consumption models). i and c . are binary indices with values 0 or 1, where i + c = 1 , in order to differentiate between the two models. To clarify, Equation (1) can be rewritten to include these two types of totals:
[(VA + OS + PP) − c(RF + RP)] − [(ET + NR) + i(RF + RP)] = 0
For example, giving the values i = 1 and c = 0 in Equation (2) will result in Equation (1). The significance of considering these two totals is a result of their association with real-water saving mechanisms, whether it was consumptive or abstraction savings. Further details about the link between the two totals and the saving mechanisms can be found in the method’s development publications [34,35].
Sefficiency considers two dimensions for making a variable useful: beneficial dimension, b, and quality dimension, q. Having both dimensions defined, then, the useful dimension of a WPI = X is Xs:
X q = W q X × X X b = W b X × X W s X = W b X × W q X X s = W s X × X
where:
  • X q : the quality dimension of X.
  • X b : the beneficial dimension of X.
  • W q X : the quality weight of X.
  • W b X : the beneficial weight of X.
  • W s X : the usefulness weight of X.
Weights are between zero and one with zero being the poorest. The quality weight of a water instance can be quantified based on its physical and chemical characteristics. While its beneficial weight, however, can be quantified according to a stakeholder participation process.
Sefficiency assesses the WUS’s performance at three different levels: macro-, meso-, and micro-Efficiencies (3ME). Macro-Efficiency ( M a c r o E ) assesses the impact of a WUS on the main source. Meso-Efficiency ( M e s o E ) relates to a situation between micro and macro levels indicating, for example, the impact of return instances generated by a WUS. Micro-Efficiency ( M i c r o E ) is about the internal efficiency of a WUS, i.e., no consideration of its returns nor impact on the main source [30,35,43].
M a c r o E is more suitable for a larger (transboundary) scale assessment that is centred on the aquifer. It would require measures of water table level at the beginning and end of the analysis period to replace VA and RF with VU and VD, respectively. M i c r o E , on the other hand, ignores the impact of the return flow on the main source, which is an important objective for this work. Therefore, the assessment in this study will focus on the efficiency at meso level in order to reflect on the interaction between the useful outflow and total flow. A proper application would be the impact of return instances the system generates. Such application examines, among different aspects, the impact of the WUS on the downstream users, including the ecosystem.
To calculate the efficiency of a WUS at the meso level, we use the following equation given [35] its proof:
MesoE = [ ET + NR + i ( RF + RP ) VA + OS + PP c ( RF + RP ) ] s
The presence of i or c before the efficiency level indicates the model, i.e., i M e s o E means M e s o E calculated as in full inflow model, while c M e s o E means meso-efficiency calculated as in consumption model. Full inflow M e s o E gives the percentage of total useful inflow that is useful outflow, whereas consumptive M e s o E provides the percentage of effective consumption that is useful consumption.

2.2. Study Area

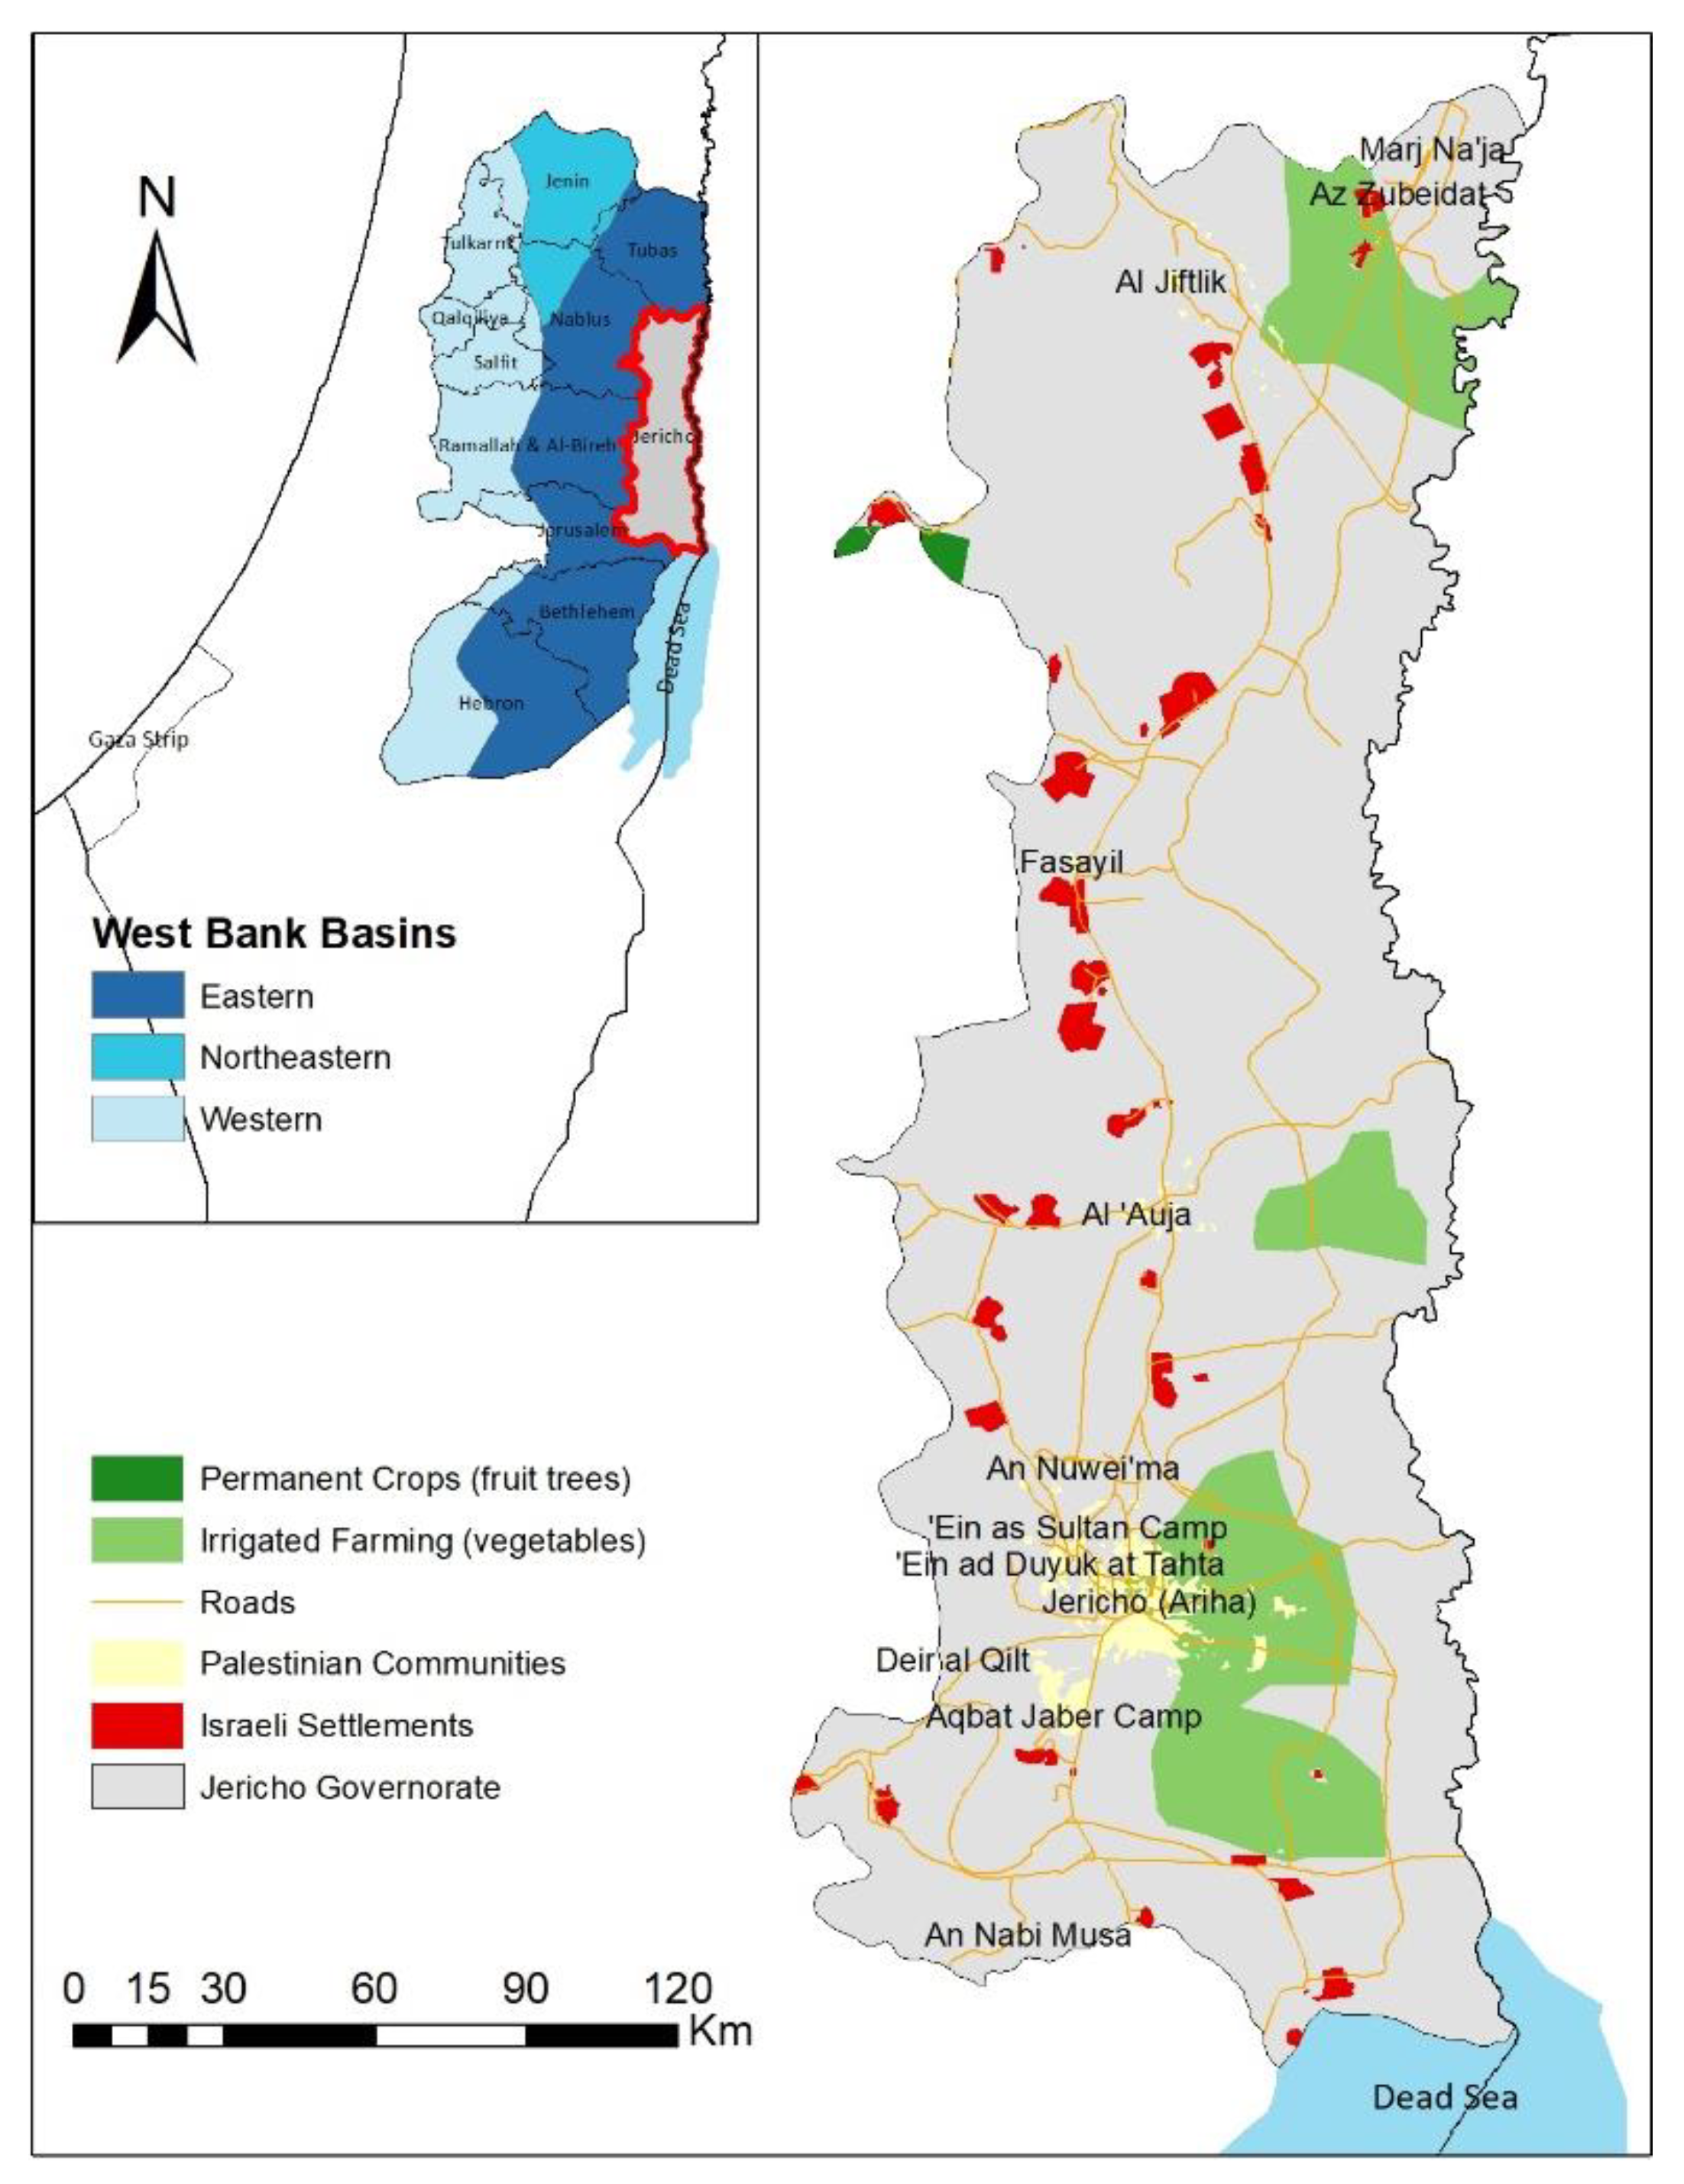
The Jordan Valley extends between the Nablus, Jerusalem and Hebron Mountains chain (known in Israeli sources as Judaean and Samaria Mountains) in the west and northwestern Jordanian highlands in the east. The Palestinian part of the valley has an estimated area of 845 km2 [44]. Administratively, two Palestinian governorates share the vast majority of the valley: the entire Jericho and Al-Aghwar Governorate (in short, Jericho) and the eastern half of Tubas and the Northern Valleys Governorate (in short, Tubas). The area under consideration for this study is Jericho Governorate (Figure 2) since it constitutes more than 70% of the total area (592.9 km2), has a weather station providing metrological data, and uses more water from EAB than any other governorate including Tubas (26 out of 41.7 Mm3 [16]).
Elevations vary from around 300 m above to 400 m below sea level (elevation tends to decrease heading southeastward closer to the Dead Sea). The area is generally characterized as arid and the soil classification ranges from clay loam to sandy loam [44]. Meteorological characteristics of Jericho are summarized in Table 1. Weather conditions are suitable for growing fruits and vegetables, including dates, banana, tomato and cucumber. In addition, the typical Jordan Valley’s warmer winters enable farmers to have early harvest seasons, which is economically advantageous, especially for exports.
Precipitation rates vary within a short distance from up to 300 mm per year in the north, down to less than 100 mm per year close to the Dead Sea [45]. The 25-year-average of annual precipitation recorded by the Jericho weather station is 147 mm. These precipitation rates accompanied with high evaporation records result in a greater dependence on irrigation. The Palestinian Central Bureau of Statistics (PCBS) reported in 2011 that 97% of the cropland area was irrigated [46].
Regarding water supplies, as mentioned earlier, Palestinians rely on groundwater for 95% of their supplies. Purchased water from Israel, treated wastewater and desalination constitute the remaining 5%. The primary use of the purchased water from the Israeli national water company Mekorot is for municipal uses only. In addition, the level of wastewater treatment is below the standards for direct reuse in municipal and agricultural uses. Last, the desalinated Mediterranean Sea water is a source that is only available in Gaza Strip. In 2011, all PWA reports suggested that Palestinians in Jericho solely depended on abstracted water from EAB for their agricultural activities [13,15,16,21].
According to the latest PCBS census in 2017, the population of Jericho is 50,001, which accounts for 1.1% of Palestine’s population and makes it the least populous governorate [47]. The main reason behind this low population density is due to constraints that are limiting the economic development, especially in agriculture as suggested by multiple local, Israeli and international reports [12,48,49]. That is of no surprise considering the geopolitical complexity of this specific part of West Bank. The Oslo Accords I and II come in interest once more. The agreement designed the territorial jurisdiction dividing the West Bank into areas A, B and C. Palestinians have control over areas A and B, but substantial restrictions in regards to land access, infrastructure and water resource development in area C [50]. 87% of the Palestinian part of Jordan Valley falls within Area C [45], making the sustainability of the Palestinian agricultural activities in that area very difficult. According to an economic monitoring report to the Ad Hoc Liaison Committee of The World Bank [51], agriculture´s contribution to the Palestinian GDP dropped from 9.3% in 1999 to 4% in 2012.
Considering the aforementioned complexity and the involvement of various parties in the region, including both sides’ governments, international bodies, academic institutions, and a wide range of NGOs and local research centres, data collection is a challenging task. For the quantitative characterisation of our WUS, we prioritized the official PWA and PCBS published data for 2010/2011 as it is the latest documented season [16,46]. In addition, in order to acquire the stakeholder and public participation data, we interviewed the Director General of Water Resources Management at PWA, Eng. Theeb Abdelghafour, and surveyed a random sample of 40 local farmers. The selection of farmers considered both population density and geographic distribution across the study area. For instance, 30% of the sample were farmers from Jericho city, which is the area of highest density, another 30% from the northern villages (green areas in the north of Jericho in Figure 2) and the remaining 40% were from the remaining villages across the governorate.

2.3. WUS Characterisation Data

2.3.1. Water Instances Quantities

Considering the hypothetical schematic in Figure 1, the three main inflows are water abstractions from EAB, precipitation and other sources. The total abstracted water from the Eastern Aquifer Basin for agricultural use during the 2010/2011 season was 24.19 Mm3 [16] (VAPWA). Precipitation inflow during the same season (PP) was remarkably low, with a total of 99 mm, which is 48 mm below the 25-year-average. In fact, multiple Palestinian sources refer to 2010/2011 as a drought season. Finally, as there was no water supplied from other sources than EAB, OS was assumed to be negligible. In the opposite direction, outflow numbers suggest that there must be additional inflows to satisfy the law of water balance. Due to the absence of any further data in regards to water supplies, thus we will need to consider an inflow slack variable for water balance.
The four main outflows are evapotranspiration (ET), aquifer basin recharge (RF), other return types replenishing any area or source other than the aquifer (RP), and what flows out without replenishment potentials within the system itself or its neighbor(s) (NR).
In regards to ET, or alternatively the total crop water demand (CWD), we used the CROPWAT model, which is based on Penman–Monteith method [52]. Metrological data from the Jericho station were used to estimate the reference crop evapotranspiration (ETo) per growing period. The growing period and the crop coefficient (kc) for each of the different crop types was estimated based on the extensive local research work in this field conducted by the Applied Research Institute—Jerusalem (ARIJ) in 1998 [53]. Then, we utilized kc in order to estimate the actual crop evapotranspiration (ETc) per the growing period of each crop. Irrigated areas in the governorate for each crop were acquired from the 2010 agricultural census [46].
In order to estimate RF, RP and NR we analyzed the spatial characteristics and the used irrigation methods in the region. The soil classification of the area under consideration ranges from clay loam to sandy loam. In addition, the entire sample of farmers who participated in our survey mentioned that they use drip irrigation as their only irrigation technique, which confirms the PCBS and Ministry of Agriculture 2010 agricultural census results shown in Table 2.
Despite the common perception among farmers that drip irrigation’s non-beneficial water consumption is nearly negligible, scholars have been less keen on this idea. A number of studies such as [54] demonstrated that classic (surface) drip irrigation could produce non-beneficial consumption in evaporation. Moreover, one of the main issues of drip irrigation is the high potential of excess deep percolation [55], which can occur as a result of applying the total crop water demand to a relatively small soil surface area.
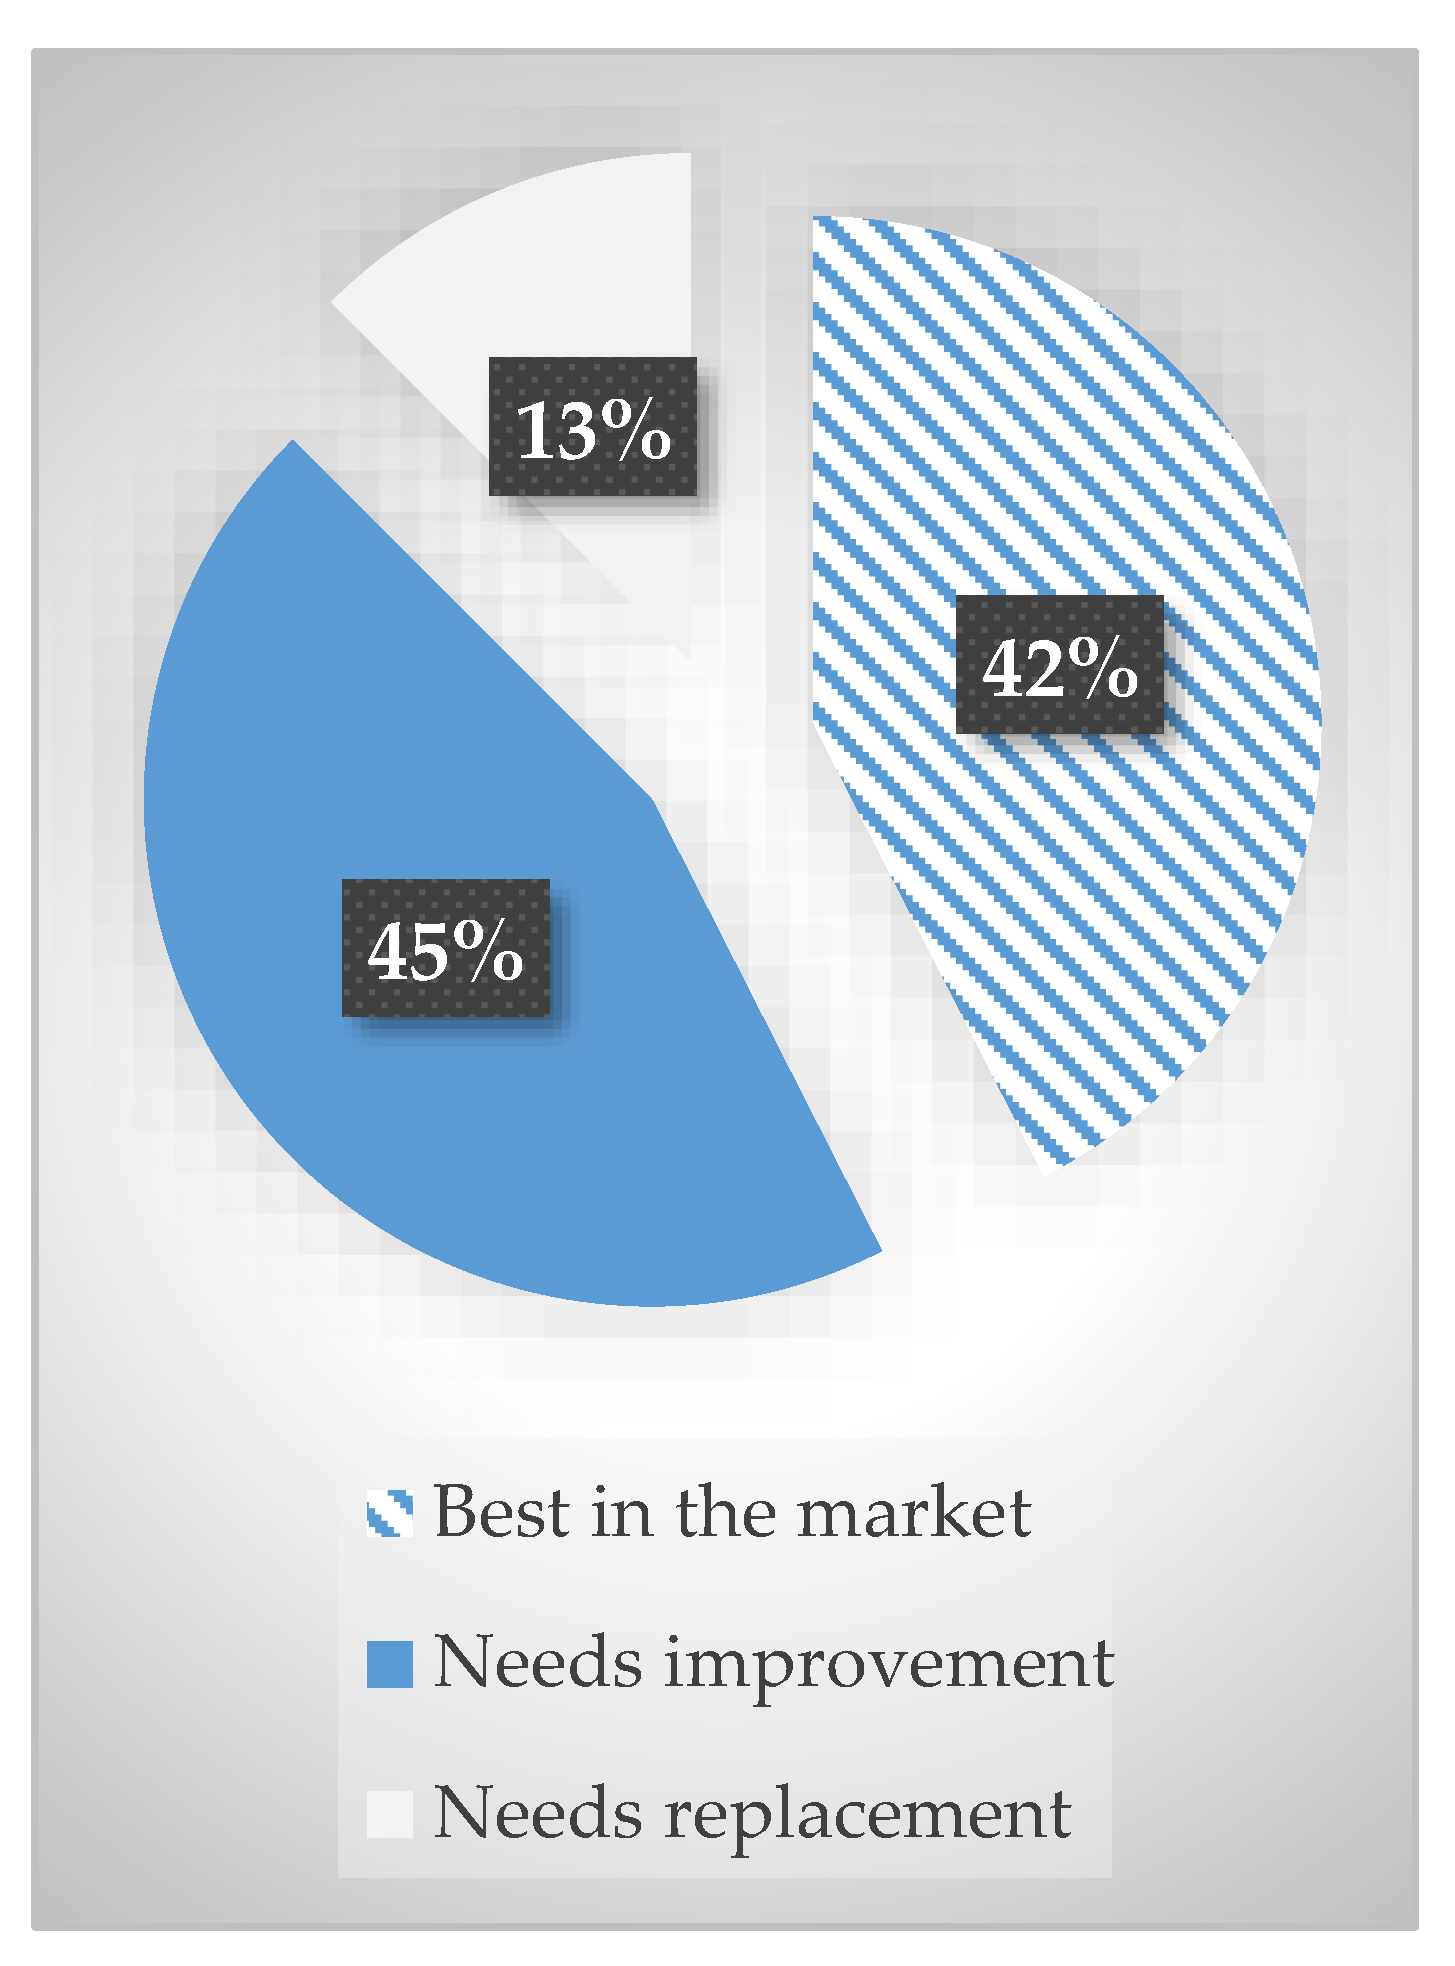
We have asked the farmers to assess the drip irrigation systems they use in terms of technical quality. Survey results in Figure 3 indicate 42% of farmers use the best available drip irrigations options in the market, while 45% and 13% use systems that need improvements or require replacement, respectively. Although drip irrigation systems’ design imperfections and technical malfunctions are beyond the scope of this paper, we understand that such issues lead to a higher percentage of water consumed in non-beneficial forms for the farmers.
On a different note, we asked the farmers about the time interval of their irrigation application, which helps in understanding the direction of these non-beneficially consumed quantities. Irrigation application during warm times of the day could lead to higher evaporation, while application during the cold times of the day potentially generates higher infiltration rates. The entire surveyed sample reported they irrigate during the cold periods, in either mornings, evenings or a combination of both.
To summarize, we are assessing the agricultural water use of an area that has precipitation in low intensity and frequency, high permeable soil types, semi-arid to arid weather conditions all-year-long and a dominance of irrigated farmlands via drip irrigation. Based on the available data and survey results, it was estimated that 15% of the applied irrigation from abstraction were flowing into directions other than satisfying CWD, which agrees with previous studies, e.g., [56]. Thus:
RF Eq + NR Eq = 0.15 × VA
where:
  • RF Eq : Infiltration back to EAB due to irrigation equipment shortcomings.
  • NR Eq : Evaporation caused by irrigation equipment shortcomings.
Similarly, we cannot anticipate that the crop will benefit from the entire rainfall quantity to achieve its water demand under the aforementioned circumstances. Following the FAO guidelines about effective rainfall [52,57], if the monthly precipitation rate is lower than 17 mm, the effective rainfall is negligible, meaning that the crop will get none of this rain to meet its water demand. In only 3 months (December, January and February), the precipitation exceeded the 17 mm/month threshold by a small margin, which indicates that only 8 mm of effective precipitation out of the 99 mm total precipitation was available over the entire growing season.
The remaining 91 mm, therefore, flows into other directions. Due to soil type, low intensity and quantity of rain events and weather conditions, it was assumed that the surface runoff was negligible. Thus, RP = zero and:
RF PP + NR PP = 91   mm × Area
where:
  • RF PP : Infiltration back to EAB after rainfall events.
  • NR PP : Evaporation after rainfall events.
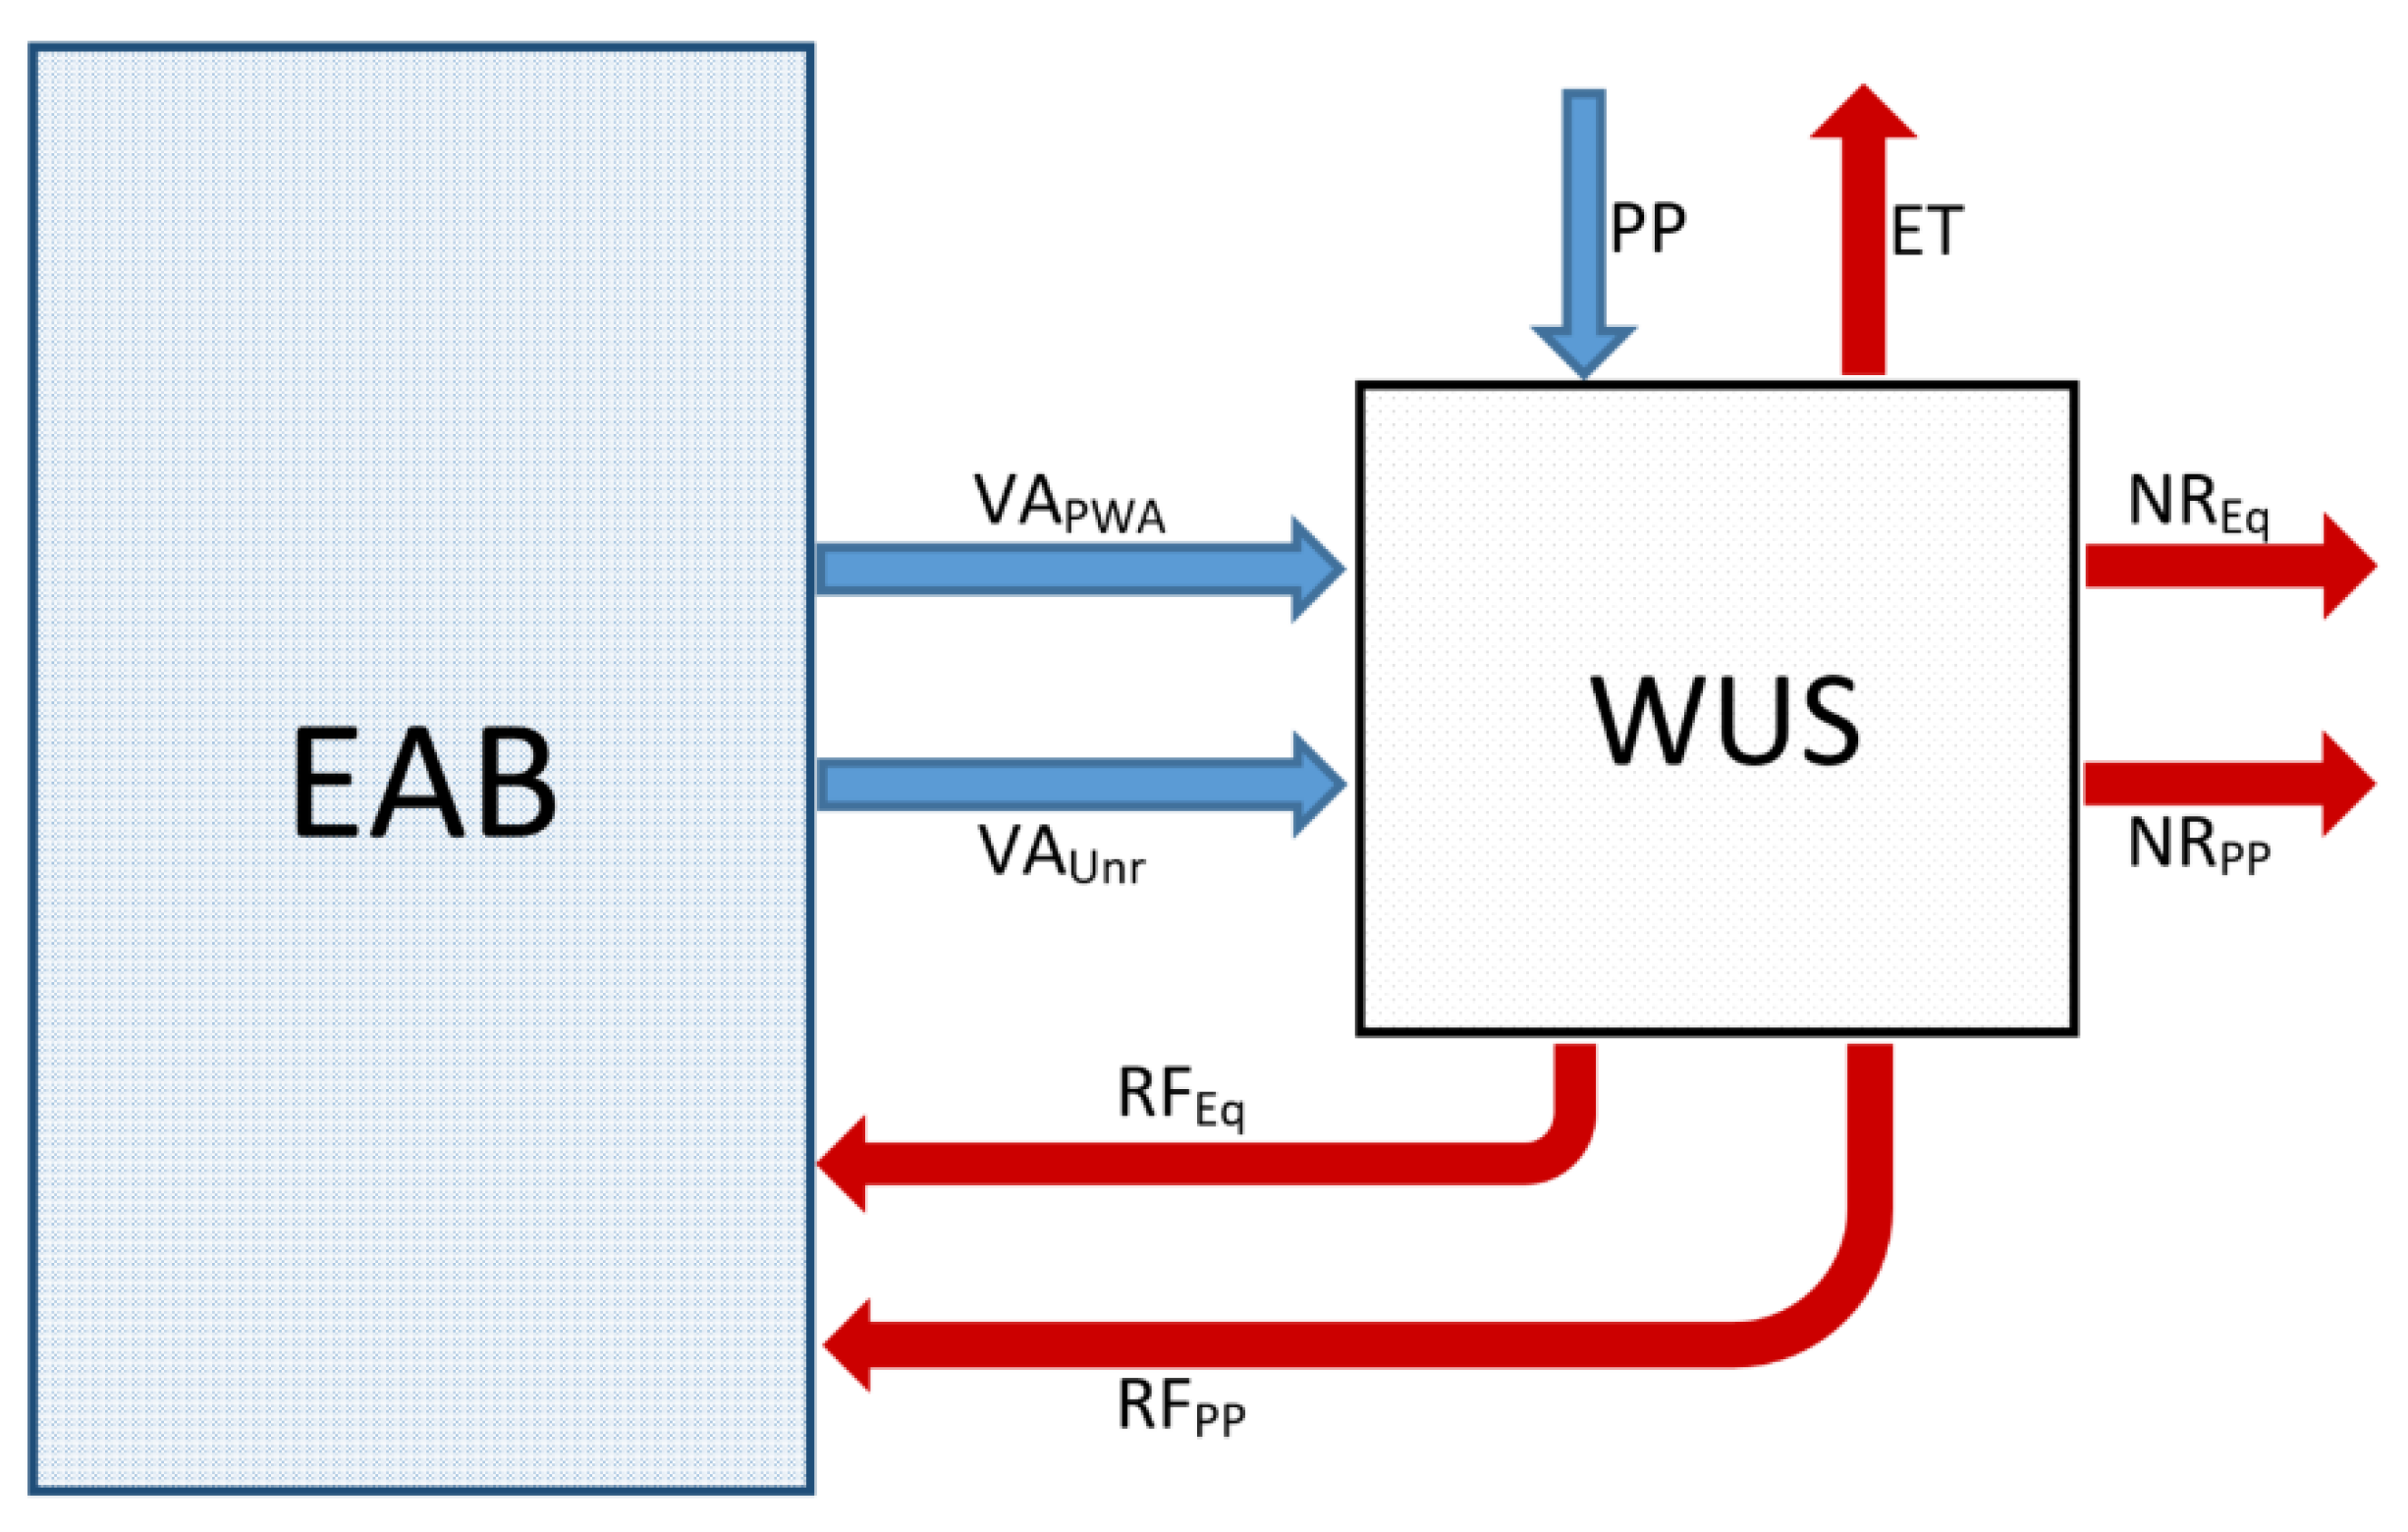
Applying water balance (Equation (1)) of the quantities calculated thus far indicates an excess of water flowing out of the system compared to inflows from groundwater withdrawal and precipitation. According to local agricultural experts, there are no other water resources available, hence, the difference is compensated through unreported abstractions from local wells or springs (VAUnr). Engineer Theeb Abdelghafour confirmed this conclusion during our interview. He also explained that a substantial number of unreported wells and springs are old and family inherited properties, which farmers do not report in fear of closure.
Therefore, and in order to reflect the actual flows in and out of the WUS, Equation (1) was adapted to:
VA PWA + VA Unr + PP = ET + RF Eq + NR Eq + RF PP + NR PP
As a result, the hypothetical WUS schematic in Figure 1 can be transformed to represent the actual water flow instances depicted in Figure 4.

2.3.2. Quality Weights

Water quality variables are of a high complexity due to the variety of conditions and characteristics under consideration. Moreover, the quality dimension is not only about the quality of water and the system that water flows through, but also about the level of toleration for a design quality [35]. For instance, PWA reported around 45% of EAB wells’ abstraction in 2011 from shallow layers of poor water quality (i.e., brackish). Therefore, the quality weight should reflect that (being less than 1). This becomes more noticeable among the springs’ abstraction, especially the closer we move towards the Dead Sea area. Yet, if farmers used such water for planting high tolerance crops, such as dates, that should mitigate the impact of salinity on the quality weight.
As farmers adapt their practices to the available level of water quality, it was assumed that the quality of the water abstracted would be as high as 0.9. Note that, as Eng. Abdelghafour confirmed, the PWA applies some basic level of treatment on the abstracted quantities, hence, we could not set this value to be 1.
In regard to the precipitation, evapotranspiration, and the nonreuseables, since they are WPTs of pure water forms, their quality values were assumed to be 1 for each.
The nitrate concentration results of the PWA-tested samples of randomly selected wells in the region between 2005 and 2009 (Figure 5) indicate an increase trend. It is important to note here that: 1. FAO guidelines for interpretations of water quality for irrigation suggest a slight to moderate degree of restrictions on use at 5–30 mg/l nitrate concentration range [58], which includes 3 of the 5 tested wells and provides a sense of controllability. 2. Nitrate is not the only parameter that defines water quality. Despite these two facts, the aim here is not to assess the water quality itself but to estimate the impact weight of the WUS’s return flow on the main source. Although this trend is more apparent in certain wells than others, it indicates a considerable intensity of agricultural activities, especially between 2007 and 2009. Consequently, the quality weight of the return flow would be significantly low. We assumed this weight to be 0.2, and then made part of the scenario analysis later.

2.3.3. Beneficial Weights

Sefficiency reflects on the system’s objectives of each of the stakeholders via quantifying the benefit of a water use accordingly. Typically, the different interests of stakeholders vary from being economic, social, environmental and even political. The key here is to realize the differences in objectives and in water management and efficiency perceptions between farmers and the Palestinian Water Authority (PWA).
From the survey conducted, farmers clearly expressed their main objective from using the abstracted water is to maximize their yield. While 4 out 10 farmers expressed difficulty in getting access to the water they need, around 58% mentioned they will expand their agricultural activity if they get access to more water.
From the decision makers’ perspective, the Director General of Water Resources Management at PWA, Eng. Theeb Abdelghafour, mentioned that their main objective is, on the one hand, to keep a balance between satisfying the high demand, which is vital for the economy and, on the other hand, to preserve the aquifer from its steady state of deterioration. He added that the PWA plans to do that through getting access to other resources, mainly unconventional resources such as wastewater treatment, in order to mitigate the pressure on the EAB system. In fact, 70% of the surveyed farmers indicated they were willing to use treated wastewater in irrigation.
When it comes to the beneficial weight for all forms of inflow, both sides agree to set the beneficial weights for these instances at relatively high values. Although this is true for the abstracted water instances (VAPWA and VAUnr), our analysis of the effectiveness of rainfall events for crop demand suggests that the beneficial weight of PP cannot be as high. Based on that analysis, we estimated the beneficial weight of PP for both managers and farmers as equal to 0.6.
For the outflow instances, however, managers consider preserving the long-term level of the basin, while farmers do not share such concerns. Thus, the beneficial value for RF is quite different between the two parties. Engineer Abdelghafour confirmed that all returned quantities to the aquifer are essential, hence we set the beneficial values of RF instances to be as high as 1 for managers. On the other hand, only 2 out of every 10 farmers expressed interest or showed awareness about the significance of these quantities, thus we set the W b RF value for farmers to be 0.2. Note that the aforementioned 70%, who are willing to use treated wastewater, were referring to the planned PWA projects of municipal wastewater treatment plants.
The NR instances are non-useful by definition. Neither the interviewed manager nor the surveyed farmers expressed any interest in it. Therefore, we assumed the beneficial weight values of NR instances to be as low as 0.1 for both stakeholders. We could have assumed this weight to be 0 as well, nevertheless, the influence of such difference (0 or 0.1) on the final results is negligible.
In regard to ET’s beneficial value, which represents the yield, although the entire WUS is designed to maximize it, in reality, it cannot be set to the highest possible value. This is because of the unwanted plants (weed) issue. In the survey, 47.5% of farmers claimed they treat these plants proactively using pesticides and do not suffer this issue. The remaining 52.5% of farmers estimate the size of these plants as a percentage of their total farmlands: two-third estimated 15%, while the other third estimated 10%. Based on these estimates, the beneficial weight value of ET was set to 0.92.

3. Results and Discussion

3.1. WUS Characterisation Results

For the inflow quantities, PWA reported that main source abstraction (VAPWA) was 24.19 Mm3. PCBS surveyed 36.28 km2 of irrigated farmland in the area [46], hence, the 99 mm precipitation produced 3.59 Mm3 (PP). For the outflow quantities, the CROPWAT model estimated ETo and the actual crop evapotranspiration (ETc) for each crop according to its respective kc. The final estimated value of the total crop water demand was 33.09 Mm3 for 2010/2011 season. Table 3 shows CWD modelling results for the top five planted crops of each category (categorized into trees, vegetables and field crops following the baseline of PCBS).
Applying Equations (5), (6) and (7) resulted in the values of RFEq, NREq, RFPP, NRPP and VAUnr, taking into consideration that VAUnr is the slack variable in order to maintain water balance as explained in Section 2.3.1. Table 4 summarizes the full characteristics of our water use system, including the WFIs quantities, quality and beneficial weights.

3.2. Sefficiency Results and Scenario Analysis

The efficiency assessment at meso level ( M e s o E ) will help us understand the WPIs’ impact on the aquifer and the potential downstream users with respect to the WUS’s objectives, which differ between the stakeholders. The M e s o E results were calculated based on Equation (4). It distinguishes between the full inflow model ( i M e s o E ) that reflects on the percentage of total useful inflow that is useful outflow, and the consumptive flow model ( c M e s o E ) that reflects on the percentage of effective consumption that is useful consumption. We also assessed the performance according to the classical efficiency approach for comparison.
The results in Figure 6 show that the WUS’s efficiency in season 2010/2011 considering farmers and managers objectives for both inflow and consumption models was 84% and 86%, respectively. It is not surprising to see that the efficiency results are higher with respect to the managers’ objectives since the assessment considers the return flow. On the other hand, CE results indicate lower efficiency percentages regardless the system’s objectives since it does not consider the return flows. It is evident here that neglecting the other water path types, even if relatively small, could reflect significantly (around 13 percentage points in this case) on the assessment.
From the management perspective, there is a small difference between i M e s o E s and c M e s o E s as the low quality of return flow (RF) in the inflow model reduces the efficiency nearly as much its beneficence does in the consumption model. In order to illustrate this, we assessed the difference between i M e s o E b and c M e s o E b values, where the quality weights were excluded (all set to be one) and only the beneficial weights were considered, and thus the percentage difference became wider. Another trend is the difference between M e s o E b and M e s o E s (especially in the inflow model). This is a clear evidence of the heavy agricultural activities’ impact in the area and the excessive use of chemical substances (Figure 5).
From the farmers’ perspective, the changes are minor between the inflow and consumptive meso efficiencies due to their low interest in any type of returns (beneficial weights for these instances are very low). The impact of low interest in RF, which is a system objective, is clearer in the values of i M e s o E b and c M e s o E b . While the efficiency from a managers’ perspective slightly improved when we excluded the quality weight, it decreased significantly on the farmers’ side.
One key variable does not directly appear in the efficiency percentages, but it appears in the water balance equation (Equation (7)). That is the high value of VAUnr. We estimate that farmers get at least 37% of their supplies from channels that PWA does not monitor nor report. Such an anomaly makes PWA’s efforts to manage the available resources, develop future supplies and manage the demand imperfect.
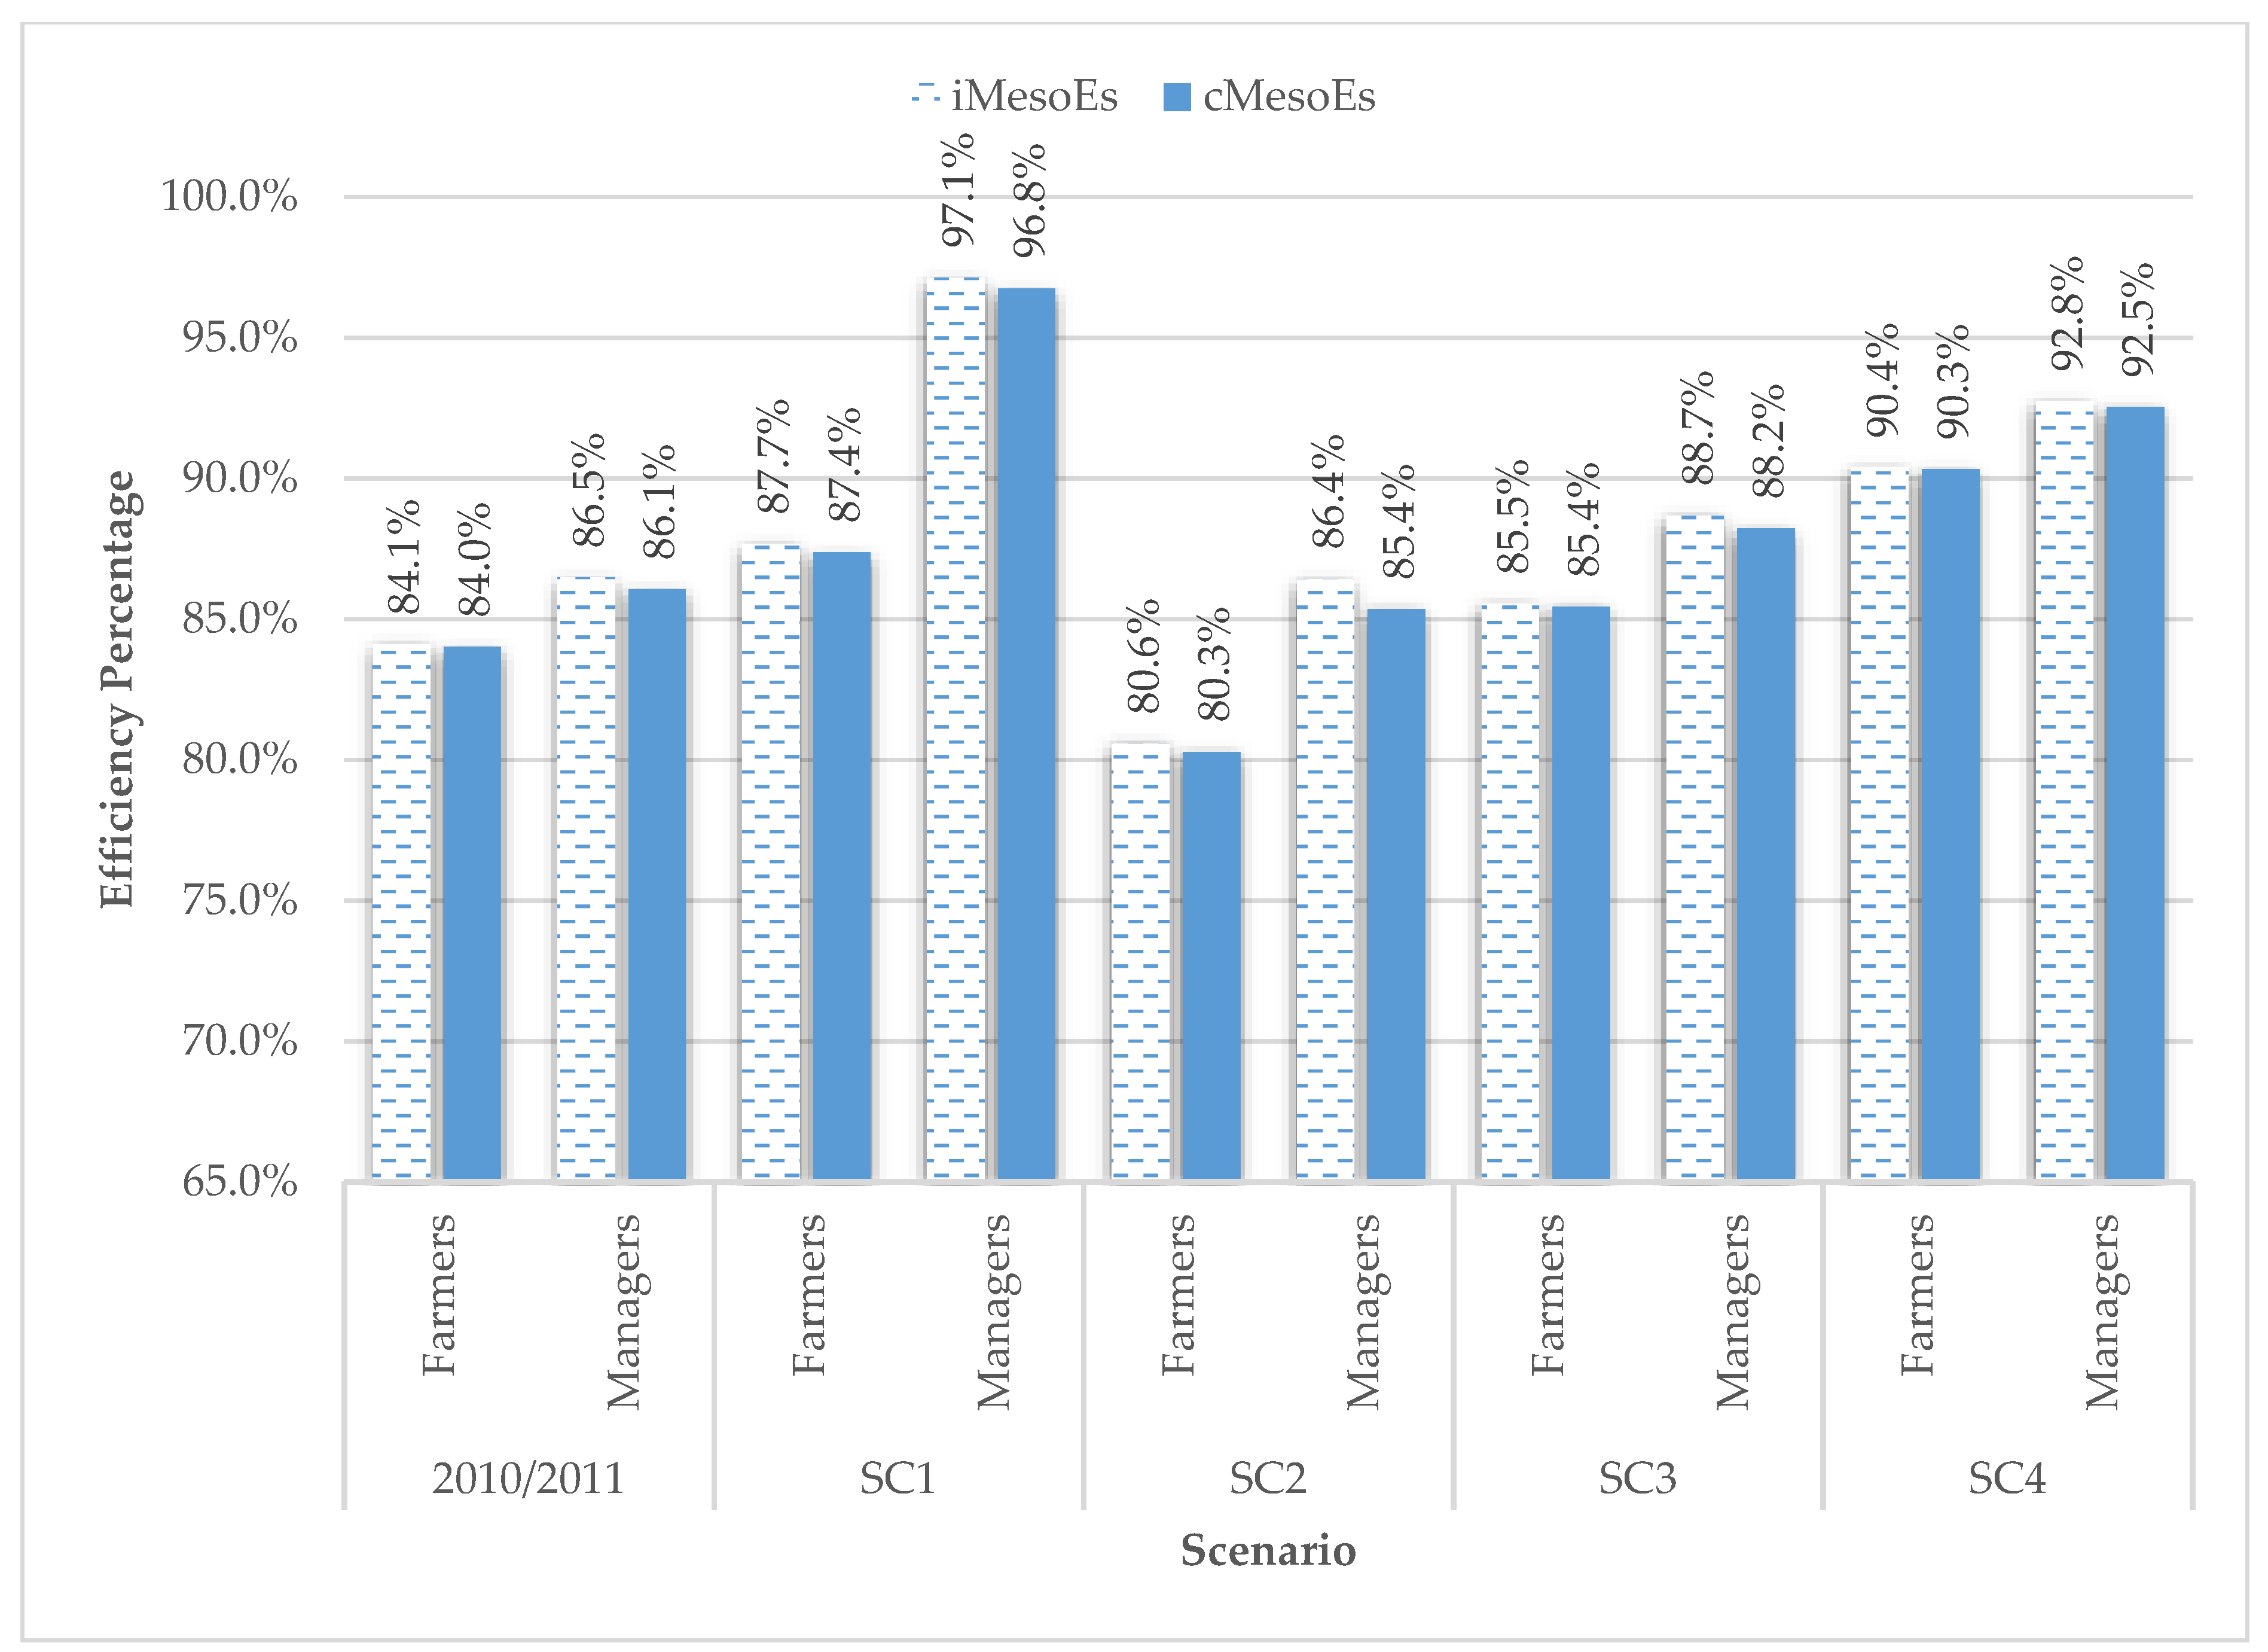
In a water scarce region, improvements are necessary. In order to help understanding what changes could lead to improvements, we hypothesized four scenarios (Figure 7):
SC1: Improving the quality of the returns from 0.2 to 0.8.
SC2: Increasing the reported abstractions by 10% for the same yield production.
SC3: Increasing the precipitation to reach the 25-year-average (147 mm).
SC4: Increasing the beneficial weight of ET to 0.99.
In the first scenarios SC1, we have only changed the value of W q X . of both RF instances (RFEq and RFPP) to be 0.8 while keeping all of the other variables and weights as they were. Such a change, in reality, can take place as a result of one or a combination of activities such as reducing the use of chemical substances in agriculture and reusing the agricultural wastewater. Although the values of RF are relatively small, results in Figure 7 show the hypothesized increase in its quality can potentially lead to more than a nine percentage point increase in the overall meso efficiency from the management perspective in both inflow and consumption models. Such high efficiency from the managers’ perspective (around 97%) in this case actually makes sense because the high quality of returns satisfies an important system objective for managers, which is the ecological sustainability of the resource.
SC2 represents the consistent PWA efforts to increase the Palestinian water share of EAB withdrawals. This will arguably lead to an increase in the agricultural activities in the regions as confirmed by 58% of the surveyed farmers who stated that if they get access to more water, they would expand their business. In order to perform sensitivity analysis on efficiency results, we hypothesized a 10% increase in the reported withdrawals (VAPWA) and maintained the current size of agricultural activities unincreased. Such an increase will result in a series of changes in the system. First, as we have to maintain water balance, the additional inflow should appear in the outflow as well. In numbers, 10% increase in VAPWA will result 26.61 Mm3 total reported abstraction, and assuming no changes in ET values, the added quantity will flow out of the system via RFEq and NREq. Consequently, W b X for the three variables and W q X for VAPWA and NR by definition should not change, but W q R F should. As RFEq showed a 42% increase in high-quality water in its volume, its quality weight will increase as result to 0.5.
The results of SC2 are discouraging for both managers and farmers because, despite supplying more water into the system, that did not have any positive impact on the overall efficiency. There was not even an increase in the efficiency from managers’ perspective despite the increased quality of RF that we saw in SC1. In fact, for better judgement under this scenario, we will have to understand if and how much the agricultural activities will actually increase, if more water become available. The argument we are making here, however, is that stakeholders have to consider any increase in supply carefully.
Furthermore, the results of SC2 scenario reflect on the consequences in case we underestimated the unreported abstractions. As proven in this scenario, if the unreported abstractions were higher, the efficiency will consequently be lower. This conclusion underlines the necessity for the water authorities in Palestine to tackle this matter as it occurs in the core efficiency assessment of the system under their management.
SC3 demonstrates how the efficiency results would change if our season had a PP value equals to the 25-year-average of annual precipitation (147 mm), which helps us understand the inter-annual variability of the water use efficiency. As mentioned earlier, PP of season 2010/2011 was 33% lower than the 25-year-average. In fact, between 1996 and 2018, there were two other dry seasons: 1998/99 with 48.7 mm and 2016/17 with 45.8 mm. On the contrary, 1996/97 and 2014/15 seasons with 224.6 mm and 200.5 mm [59,60], respectively, may be considered as relatively wet.
Assuming no changes in the size of agricultural activities, an increase in PP, similar to the increase in VAPWA in SC2, will lead to a sequence of changes in the quantity and quality of the return flow. In addition, we needed to account for the changes in the effective precipitation values in order to estimate the values of RF PP and NR PP . In numbers, PP volume increased to 5.33 Mm3. Quantity of RF PP increased 30%, and thus its quality weight increased from 0.2 to 0.3 (with no significant changes in NR PP ). Moreover, as precipitation increased, the effective PP ratio had also increased; hence, we can deduct that value (0.85 Mm3) from VAUnr.
The efficiency results of SC3, in contrast to SC2, show an improvement in Seffeciency for both managers and farmers. This is an indication of the positive impact of PP since its effective portion directly contributes to the abstraction savings and the other portion improves the quality of returns.
The fourth scenario SC4 results demonstrate that a 7% increase in a single weight ( W b E T ) led to a significant improvement in the overall efficiency results (6% increase in i M e s o E b and c M e s o E b for both farmers and managers). The beneficial weight of ET could increase by actions from both stakeholders. Farmers could contribute to a higher value of W b E T , if they treat the unwanted plants at higher rates. It is important to carefully consider the treatment method, especially the use of pesticides. An additional increase in the nitrate levels in Figure 5, would affect the sustainability of EAB’s water quality. Hence, classic methods such as mulching, had-digging and solarizing, are more advantageous. Likewise, managers could also contribute through establishing policies and programs that enhance the selection of high socio-economic value crops. Since yield production is the center of this WUS, the results of this scenario show a significant increase in the system performance with such a change. The performance of both farmers’ and managers’ objectives increased significantly in both models.

4. Conclusions

In regions such as Palestine, the question of water scarcity expands beyond the availability or accessibility of water. Water use systems and the assessment of their efficiency are complex due to the nature of their variables’ dynamics. This study proved that a simple change in these dynamics could lead to a substantial impact on the overall WUS’s performance.
Through analyzing the water path instances of the agricultural water use in Jericho Governorate, we highlighted areas of improvement that are worthy of the Palestinian Water Authorities’ attention. On the one hand, the efficiency results, the significant number of unreported abstractions and the need for more water to expand agriculture in the region are three conclusions supporting the PWA demand for a larger share of EAB withdrawals. However, we have demonstrated that an increase in supply without a planned and coordinated expansion of the agricultural activities could have no positive impact on the system’s performance.
The WUS’s efficiency results at meso level ( M e s o E ) indicate a potential for improvement on the impact of return flow quality. Although we do not count for the Israeli side’s use in the scope of this paper, which is reportedly higher, the meso level and sensitivity analysis results demonstrated the impact of the use of chemical substances on the basin. Putting politics aside, for the sustainability of EAB, joint managerial efforts to assess the performance and impact of the regional water use systems on EAB are crucially important.
Finally, the relationship between the different WUS’s variables is not linear, especially when considering the quality and beneficence dimensions of those variables. A water balance-based assessment approach is fundamental to reach a thorough understanding of the system’s nature and conclusion about its performance. Furthermore, active participation of all stakeholders involved within the WUS’s boundaries, which constructs a clear definition of water use objectives, enhances the sustainability of our available resources.

Author Contributions

Conceptualization, N.T.; investigation, N.T.; writing—original draft preparation, N.T.; formal analysis, N.T.; methodology, M.T.A.; writing—review and editing, N.H.; supervision, N.H. All authors have read and agreed to the published version of the manuscript.

Funding

This research received no external funding.

Acknowledgments

The authors thank the Territory, Environment and Construction Center (CTAC) at the University of Minho for the logistic support. Special thanks to the farmers who participated in the survey and for the management of the Palestinian Water Authority for their unlimited support in providing materials and interviews.

Conflicts of Interest

The authors declare no conflict of interest.

References

  1. Mizyed, N. Impacts of Climate Change on Water Resources Availability and Agricultural Water Demand in the West Bank. Water Resour. Manag. 2008, 23, 2015–2029. [Google Scholar] [CrossRef]
  2. La Jeunesse, I.; Cirelli, C.; Aubin, D.; Larrue, C.; Sellami, H.; Afifi, S.; Bellin, A.; Benabdallah, S.; Bird, D.; Deidda, R.; et al. Is climate change a threat for water uses in the Mediterranean region? Results from a survey at local scale. Sci. Total Environ. 2016, 543, 981–996. [Google Scholar] [CrossRef] [PubMed]
  3. Chenoweth, J.; Hadjinicolaou, P.; Bruggeman, A.; Lelieveld, J.; Levin, Z.; Lange, M.A.; Xoplaki, E.; Hadjikakou, M. Impact of climate change on the water resources of the eastern Mediterranean and Middle East region: Modeled 21st century changes and implications. Water Resour. Res. 2011, 47. [Google Scholar] [CrossRef]
  4. Sowers, J.; Vengosh, A.; Weinthal, E. Climate change, water resources, and the politics of adaptation in the Middle East and North Africa. Clim. Chang. 2010, 104, 599–627. [Google Scholar] [CrossRef]
  5. Chenoweth, J. Will the water resources of Israel, Palestine and Jordan remain sufficient to permit economic and social development for the foreseeable future? Hydrol. Res. 2010, 13, 397–410. [Google Scholar] [CrossRef] [Green Version]
  6. Lautze, J.; Kirshen, P. Water allocation, climate change, and sustainable water use in Israel/Palestine: The Palestinian position. Water Int. 2009, 34, 189–203. [Google Scholar] [CrossRef]
  7. Lowi, M.R. Bridging the Divide: Transboundary Resource Disputes and the Case of West Bank Water. Int. Secur. 1993, 18, 113–138. [Google Scholar] [CrossRef]
  8. Gleick, P.H. Water and Conflict: Fresh Water Resources and International Security. Int. Secur. 1993, 18, 79–112. [Google Scholar] [CrossRef]
  9. Özerol, G.; Haddad, M.; Judeh, T. Assessment of water governance in the West Bank, Palestine. Int. J. Glob. Environ. Issues 2017, 16, 119. [Google Scholar] [CrossRef]
  10. Haddad, M. Sustainable water demand management versus developing new and additional water in the Middle East: A critical review. Hydrol. Res. 2001, 3, 143–163. [Google Scholar] [CrossRef]
  11. Ronen, Y. Israel, Palestine and the ICC—Territory Uncharted but not Unknown. J. Int. Crim. Justice 2014, 12, 7–25. [Google Scholar] [CrossRef]
  12. UNCTAD. The Besieged Palestinian Agricultural Sector; United Nations Conference on Trade and Development: Geneva, Switzerland, 2015. [Google Scholar]
  13. PWA. Groundwater Resources—Utilization 2015. Available online: http://www.pwa.ps/page.aspx?id=NL8EMVa2547842781aNL8EMV (accessed on 03 October 2019).
  14. Lazarou, E. Briefing—Water in the Israeli-Palestinian Conflict; European Parliamentary Research Service: Brussels, Belgium, 2016. [Google Scholar]
  15. PWA. Status Report of Water Resorces in the Occupied State of Palestine—2012; Palestinian Water Authority: Ramallah, Palestine, 2013. [Google Scholar]
  16. PWA. Annual Status Report on water resources, Water Supply, and Wastewater in the Occupied State of Palestine 2011; PWA: Ramallah, Palestine, 2012. [Google Scholar]
  17. Shamir, U. Water Agreements Between Israel and Its Neighbors. In Transformations of Middle Eastern Natural Environments: Legacies and Lessons; Bernhardsson, M., Albert, J., Kenna, R., Eds.; Yale School of Forestry and Environmental Studies, Yale University: Haven, CT, USA, 1998. [Google Scholar]
  18. Israel Water Authority. The Water Issue Between Israel and the Palestinians—Main Facts; Israel Water Authority: Tel Aviv, Israel, 2012. [Google Scholar]
  19. Tal-Spiro, O. Israeli-Palestinian Cooperation on Water Issues; Center for Research and Information Kiryay Ben Gurion: Jerusalem, Israel, 2011. [Google Scholar]
  20. PWA. Strategic Water Resource and Transmission Plan; PWA: Ramallah, Palestine, 2014. [Google Scholar]
  21. PWA. Water Sector Reform Plan 2016–2018; PWA: Ramallah, Palestine, 2016. [Google Scholar]
  22. Bursche, A. Agricultural Water Demand Management in the Palestinian Territories; Albert-Ludwigs-University Freiburg: Breisgau, Germany, 2011. [Google Scholar]
  23. Shevah, Y. Chapter Six—Challenges and Solutions to Water Problems in the Middle East, in Chemistry and Water; Ahuja, S., Ed.; Elsevier: Amsterdam, The Netherlands, 2017; pp. 207–258. [Google Scholar]
  24. Haddad, M. Planning Water Supply under Complex and Changing Political Conditions: Palestine as a Case Study. Water Policy 1998, 1, 177–192. [Google Scholar] [CrossRef]
  25. Rahil, M.; Qanadillo, A. Effects of different irrigation regimes on yield and water use efficiency of cucumber crop. Agric. Water Manag. 2015, 148, 10–15. [Google Scholar] [CrossRef]
  26. Alsharif, K.; Feroz, E.H.; Klemer, A.; Raab, R. Governance of water supply systems in the Palestinian Territories: A data envelopment analysis approach to the management of water resources. J. Environ. Manag. 2008, 87, 80–94. [Google Scholar] [CrossRef]
  27. Al-Juneidi, F.; Isaac, J. An Assessment of Irrigation Efficiency in the Palestinian West Bank; Applied Research Institute - Jerusalem (ARIJ): Bethlehem, Palestine, 2000.
  28. Jensen, M.E.; Harrison, D.S.; Korven, H.C.; Robinson, F.E. The Role of Irrigation in Food and Fiber Production; American Society of Agricultural Engineers.: St. Joseph, MA, USA, 1980; pp. 15–41. [Google Scholar]
  29. Jensen, M.E. Beyond irrigation efficiency. Irrig. Sci. 2007, 25, 233–245. [Google Scholar] [CrossRef]
  30. Haie, N.; Keller, A.A. Macro, meso, and micro-efficiencies and terminologies in water resources management: A look at urban and agricultural differences. Water Int. 2013, 39, 35–48. [Google Scholar] [CrossRef]
  31. Pereira, L.S.; Cordery, I.; Iacovides, I. Improved indicators of water use performance and productivity for sustainable water conservation and saving. Agric. Water Manag. 2012, 108, 39–51. [Google Scholar] [CrossRef]
  32. Willardson, L.S.; Allen, R.G.; Frederiksen, H.D. Elimination of Irrigation Efficiencies. In Proceedings of the 13th Technical Conference, USCID, Denver, CO, USA, 19–22 October 1994; USCID—United States Committee on Irrigation and Drainage: Denver, CO, USA, 1994. [Google Scholar]
  33. Keller, A.A.; Keller, J. Effective Efficiency: A Water Use Efficiency Concept for Allocating Freshwater Resources; Center for Economic Policy Studies: Arlington, VA, USA, 1995. [Google Scholar]
  34. Haie, N.; Keller, A.A. Effective Efficiency as a Tool for Sustainable Water Resources Management1. JAWRA J. Am. Water Resour. Assoc. 2008, 44, 961–968. [Google Scholar] [CrossRef]
  35. Haie, N.; Keller, A.A. Macro, Meso, and Micro?Efficiencies in Water Resources Management: A New Framework Using Water Balance1. JAWRA J. Am. Water Resour. Assoc. 2011, 48, 235–243. [Google Scholar] [CrossRef]
  36. Ahmad, M.T.; Haie, N.; Yen, H.; Tuqan, N.A.S. Sefficiency of a Water Use System: The Case of Kano River Irrigation Project, Nigeria. Int. J. Civ. Eng. 2017, 16, 929–939. [Google Scholar] [CrossRef]
  37. Zhou, Q.; Deng, X.; Wu, F.; Li, Z.; Song, W. Participatory Irrigation Management and Irrigation Water Use Efficiency in Maize Production: Evidence from Zhangye City, Northwestern China. Water 2017, 9, 822. [Google Scholar] [CrossRef] [Green Version]
  38. Priscoli, J.D. What is Public Participation in Water Resources Management and Why is it Important? Water Int. 2004, 29, 221–227. [Google Scholar] [CrossRef]
  39. Haddad, M.; Bakir, A. An Evaluation of Public Concerns About Water Management in the Palestinian Territory Pre, During, and Post the National Uprising. Water Resour. Manag. 1998, 12, 359–374. [Google Scholar] [CrossRef]
  40. Haddad, M. Future water institutions in Palestine. Hydrol. Res. 2005, 7, 181–200. [Google Scholar] [CrossRef]
  41. Israeli Ministry of Agriculture. The Jordan Valley District. 2019. Available online: https://www.moag.gov.il/ar/%D9%88%D8%AD%D8%AF%D8%A7%D8%AA%20%D8%A7%D9%84%D9%88%D8%B2%D8%A7%D8%B1%D8%A9/mekcozot_misrad/machoz_amaqim/Pages/default.aspx (accessed on 09 October 2019).
  42. WAFA. Palestinian Part of Jordan Valley. 2015. Available online: http://info.wafa.ps/ar_page.aspx?id=9663 (accessed on 13 November 2019).
  43. Haie, N. Sefficiency (sustainable efficiency) of water–energy–food entangled systems. Int. J. Water Resour. Dev. 2015, 32, 721–737. [Google Scholar] [CrossRef]
  44. Palestinian Ministry of Planning and International Cooperation. p. GIS ArcMap Shapefiles Produced by the Ministry of Planning and International Cooperation in 1998 and Made Available for Public Use; Palestinian Ministry of Planning and International Cooperation: Ramallah, Palestine, 1998. [Google Scholar]
  45. EcoPeace Middle East. Regional NGO Master Plan for Sustainable Development in the Jordan Valley; EcoPeace Middle East: Tel Aviv-Yafo, Israel, 2015. [Google Scholar]
  46. PCBS. Agricultural Census 2010 Final Results – Jericho & Al Aghwar Governorate; Palestinian Central Bureau of Statistics and Ministry of Agriculture: Ramallah, Palestine, 2012.
  47. PCBS. Preliminary Results of the General Census of Population, Housing and Establishments 2017, in Census 2017; Palestinian Central Bureau of Statistics: Ramallah, Palestine, 2018.
  48. ARIJ. Opportunities and Challenges of Palestinian Development actions in Area; Ghattas, C.R., Ghattas, C.R., Rishmawi, K., Isaac, J., Zboun, I., Hilal, J., Abu Zahra, A., Khalifeh, I., Eds.; ARIJ: Bethlehem, Palestine, 2016.
  49. Kadman, N. Acting the Landlord: Israel’s Policy in Area C, the West Bank; Kadman, N., Stein, Y., Eds.; B’Tselem: Jerusalem, Israel, 2013. [Google Scholar]
  50. World Bank. Assessment of Restrictions on Palestinian Water Sector Development; World Bank: Washington, DC, USA, 2009. [Google Scholar]
  51. World Bank. Fiscal Crisis, Economic Prospects—The Imperative for Economic Cohesion in the Palestinian Territories, in Economic Monitoring Report to the Ad Hoc Liaison Committee; World Bank: Washington, DC, USA, 2012. [Google Scholar]
  52. Smith, M. CROPWAT: A Computer Program for Irrigation Planning and Management; Food and Agriculture Organization of the United Nations: Rome, Italy, 1992. [Google Scholar]
  53. Isaac, J.; Sabbah, W. Water Resources and Irrigated Agriculture in the West Bank; ARIJ: Bethlehem, Palestine, 1998.
  54. Burt, C.; Mutziger, A.J.; Allen, R.G.; Howell, T.A. Evaporation Research: Review and Interpretation. J. Irrig. Drain. Eng. 2005, 131, 37–58. [Google Scholar] [CrossRef] [Green Version]
  55. Schwankl, J.L.; Hanson, L.R. Surface Drip Irrigation, in Developments in Agricultural Engineering; Lamm, F.R., Ayars, J.E., Nakayama, F.S., Eds.; Elsevier: Amsterdam, The Netherlands, 2007; pp. 431–472. [Google Scholar]
  56. Martinez, J.; Reca, J. Water Use Efficiency of Surface Drip Irrigation versus an Alternative Subsurface Drip Irrigation Method. J. Irrig. Drain. Eng. 2014, 140, 04014030. [Google Scholar] [CrossRef]
  57. Brouwer, C.; Heibloem, M. Irrigation Water Needs, in Irrigation Water Management; FAO: Rome, Italy, 1986. [Google Scholar]
  58. Ayers, S.R.; Westcot, D.W. Water Quality for Agriculture; FAO—Food and Agriculture Organization of the United Nations: Rome, Italy, 1985. [Google Scholar]
  59. PCBS. Metrological Tables—Year 2009; PCBS: Ramallah, Palestine, 2010.
  60. PCBS. Annual Rainfall Quantity (mm) in the West Bank by Station Location and Year, 2010–2018. 2019. Available online: http://www.pcbs.gov.ps/Portals/_Rainbow/Documents/Metrological-2018-04E.html (accessed on 27 April 2020).
Figure 1. Hypothetical water use system (WUS) schematic including all water path types.
Sustainability 12 03634 g001
Figure 2. Location of Study Area.
Sustainability 12 03634 g002
Figure 3. Farmers’ assessment of their drip irrigation systems’ quality.
Sustainability 12 03634 g003
Figure 4. Schematic of the actual water path instances (WPIs) flowing in and out of water use system (WUS).
Sustainability 12 03634 g004
Figure 5. Annual average nitrate content in selected wells in the Jordan Valley.
Sustainability 12 03634 g005
Figure 6. Sefficiency results at meso level considering farmers and managers objectives. i M e s o E s : inflow meso-efficiency; c M e s o E s : consumptive meso-efficiency; i M e s o E b : inflow meso efficiency without considering quality; c M e s o E b : consumptive meso efficiency without considering quality; CE: Classical Efficiency.
Sustainability 12 03634 g006
Figure 7. Scenarios analysis results of SC1, SC2, SC3 and SC4.
Sustainability 12 03634 g007
Table 1. Meteorological characteristics of study area extracted from Jericho weather station. Weather conditions data cover years 1972–1997. Evaporation and precipitation data cover years 1988–2012. Source: Palestinian Meteorological Department—Ministry of Transport.
MonthJanFebMarAprMayJunJulAugSepOctNovDec
Avg. high Temp. (°C)19.120.924.329.333.736.737.837.636.132.326.420.5
Avg. low Temp. (°C)7.48.310.514.217.620.422.122.421.217.912.99
Mean Temp. (°C)13.214.617.421.725.628.529.93028.625.119.614.7
Avg. relative humidity (%)706557453838404447516070
Avg. daily sun (h)5.55.97.79.39.411.811.711.610.58.76.55.6
Avg. atm pressure (mbar)104810461044104110401037103410351039104210461048
Avg. wind speed (km/h)4.55.26.58.17.97.787.46.34.743.8
Avg. evaporation (mm)71741281822592882942742251489662
Avg. precipitation (mm)36292091100061728
Table 2. Area under different irrigation methods (km2). Source: [46].
Crop TypeSurface Irrigation Drip IrrigationSprinklers Irrigation
Field Crops0.171.910.07
Vegetables1.2824.650.37
Trees0.435.460.06
Total (%)1.88 (5.5%)32.01 (93.0%)0.51 (1.5%)
Table 3. Evapotranspiration (ET) modelling results for the top 5 planted crops of each category.
CropArea (km2)ETo (mm/period)kcETc (mm/period)CWD (Mm3/y)
TreesDate4.7916680.93515597.47
Banana1.1113300.87211601.29
Lemon0.2516680.79613270.33
Grape0.2516680.5098500.22
Valencia Orange0.1416680.67811320.16
VegetablesSquash7.609830.9048886.75
Eggplant3.8815040.75111304.38
Maize3.838060.7205802.22
Tomato2.388060.8326701.59
Jew’s Mallow0.7116680.83213880.98
Field CropsWheat0.669250.8407770.51
Sorghum1.182570.7201850.22
Dry Onion0.1011450.91610490.10
Mint0.0416680.83213880.05
Barley0.292400.7151710.05
Table 4. WUS full characteristics.
Variable X (Mm)3 W q X W b X Farmers W b X Manags X s   Mm 3 Farmers X s   Mm 3 Managers
PP3.5910.60.62.152.15
VAPWA24.190.91121.7721.77
VAUnr14.400.91112.9612.96
ET33.0910.920.9230.4430.44
RFEq3.470.20.210.140.69
NREq2.3210.10.10.230.23
RFPP 1.980.20.210.080.40
NRPP1.3210.10.10.130.13