Article

Wave Energy Potential and Simulation on the Andaman Sea Coast of Thailand

by
Chutipat Foyhirun
,
Duangrudee Kositgittiwong
* and
Chaiwat Ekkawatpanit
Department of Civil Engineering, Faculty of Engineering, King Mongkut’s University of Technology Thonburi, Bangkok 66, Thailand
*
Author to whom correspondence should be addressed.
Sustainability 2020, 12(9), 3657; https://doi.org/10.3390/su12093657
Submission received: 31 March 2020 / Revised: 23 April 2020 / Accepted: 24 April 2020 / Published: 1 May 2020
(This article belongs to the Section Energy Sustainability)

Abstract

:
Ocean wave energy is an interesting renewable energy because it will never run out and can be available all the time. If the wave energy is to be used, then the feasibility study of localized wave potential has to be studied. This goal is to study the potential of waves in the Andaman Sea. The Simulating WAves Nearshore (SWAN) model was used to calculate the significant wave heights, which were validated with the measurement data of the Jason-2 satellite. The coastal area of Phuket and Phang Nga provinces are suitable locations for studying wave energy converters because they have high significant wave height. Moreover, this study used computational fluid dynamics (CFD) for the simulation of wave behavior in accordance with wave parameters from the SWAN model. The wave height simulated from CFD was validated with linear wave theory. The results found that it was in good agreement with linear wave theory. It can be applied for a simulation of the wave energy converter.

1. Introduction

The population growth and development of both the economy and society of developing countries are main factors that affect the steadily increasing energy consumption. Electricity consumption in Thailand also tends to increase according to the gross domestic product (GDP). The electricity demand between 2002 and 2014 continuously increased by an annual average rate of 4–5% [1]. In 2016, Thailand had an electricity consumption of 183 TWh, which was ranked 23rd in the world [2]. Currently, the electricity in Thailand is generated by 67% natural gas, 18% coal, 0.5% oil, 8% electricity import, 2% hydropower, and 5% renewable energy [3]. To reduce fuel consumption and electricity import, the Ministry of Energy in Thailand has prepared a long-term plan for energy use called the Thailand Integrated Energy Blueprint (TIEB), which includes the Thailand Power Development Plan (PDP), Energy Efficiency Development Plan (EEP), Alternative Energy Development Plan (AEDP), Natural Gas Supply Plan, and Petroleum Management Plan [4]. The main target of PDP, EEP, and AEDP is to use renewable energy to substitute natural gas for electric power generation. Ocean wave energy, which is a renewable energy source, is interesting because it is a large energy resource and because waves move almost all the time. It can generate electricity all the time. Thailand is bordered by the Gulf of Thailand and Andaman Sea. However, using ocean wave energy needs high investment. Therefore, the feasibility and potential of wave energy should be preliminarily studied. The development of technologies for electric power generation should be considered in the next step.
Numerical wave models are widely used such as WAve Model (WAM), WaveWatch 3 (WW3), Simulating WAves Nearshore (SWAN) model, and MIKE21-SW. WAM and WW3 are used for oceanic scale or large area, while SWAN and MIKE21-SW are applied to shallow water and coastal or small areas. These numerical models have different methods for action balance density equation solution with various components of source terms. The numerical model selection can be considered from the region, type of study, computational resource, etc. [5]. One of the most used numerical wave models is the SWAN model because it is a stable numerical scheme [6]. The SWAN model has been studied to evaluate wave parameters at various sea states. Akpinar et al. [6] studied the calibration and validation SWAN model in the Black Sea, and the results were compared with buoy measurements and the results of previous studies. The model parameters obtained depend on the relationship between the growth of JONSWAP (Joint North Sea Wave Project). The results of this study show agreement between observed and simulated data from the SWAN model, and the results from the SWAN model were rather better than the results from the WAM (from previous studies). Akpinar et al. [7] evaluated the potential of ocean wave energy in the Black Sea based on 15-year numerical hindcast data by using the SWAN model. The numerical setup on this study was non-stationary mode with spherical coordinates. The boundary condition was zero energy at sea state as an initial condition because the Black Sea is an enclosed area. The results of this study found that the highest significant wave height was 1.2 m and that the maximum wave power was 7 kW/m. The minimum significant wave height and wave power were 0.5 m and 0.9 kW/m, respectively. Appendini et al. [8] studied the wave energy potential in the Caribbean, which is an enclosed area, using 30 years of wave hindcast data. In this study, the wave hindcast information is validated with measured data (altimetry and buoy). The comparison results between wave information with altimetry and buoys show a satisfactory agreement. The numerical results suggest that the Caribbean Low-Level Jet is appropriate for the installation of wave power devices at a wave power of 8–14 kW/m. Wannawong et al. [9] studied the wave energy at the Gulf of Thailand in 2011 by a numerical model. This study found that the highest significant wave height was 2.6 m and that the maximum wave power was 0.485 kW/m in September at station S11. Thanathanphon et al. [10] applied the SWAN model to study wave characteristics in the Gulf of Thailand during Typhoon Muifa. These results show a good agreement with satellite data. Thanathanphon et al. [11] developed an operational wave forecast system for the Gulf of Thailand using the SWAN model. The results show that the different mean significant wave height was 0.45 m. There were satisfied agreements between the SWAN model and measured data.
Wave energy converters have been continuously developed [12]. There are currently several types of wave energy converters. The wave energy converters are categorized by the location of installation and types of power take-off systems. There are three locations for the installation of the wave energy converter, which are the shoreline, nearshore, and offshore. The oscillating columns of water, underwater pneumatic systems, wave dragon systems, and oscillating bodies systems can be installed in all locations, which are based on the design of the wave energy converters [13]. Thus, these systems are presented in the form of devices that are divided by the location of installation. At the shoreline location, the wave energy converters are installed at the shore or in shallow water (10–15 m). The benefits of this location are easy installation, maintenance, and transportation of wave power [14,15]. However, this location has less wave power because of interaction with the seabed [15]. Wave energy converters. such as the Oscillating Water Column, Pendulum System, and Limpet WaveGen, are located at the shoreline. The nearshore location is positioned a few hundred meters from the shore in moderate water depth (15–25 m). The benefits of this location are similar to the shoreline location [14,15]. Wave energy converters, such as the Oyster Aquamarine, Oceanlix Energetch, Wave Star, Waveplane, and Wave, are located at the nearshore. The last type is the offshore location, where the wave energy converters are installed in deep water, which is more than 50 m, far from the shore. The wave energy converters are mostly built in floating or submerged structures moored to the seabed [15]. The disadvantages of these locations are the confusing maintenance and transportation of expensive wave power [14,15]. The advantage of these locations is high wave power [14]. Wave energy converters, such as the Wave Dragon, Pelamis wave energy converter, Power Buoy, and OE Buoy, are installed offshore. The wave energy converter in Thailand was studied by Phomkaeo and Punyasompun [16]. It was installed to test at the Sirindhorn International Environmental Park Phetchaburi and Ao Manao Narathiwat, Thailand. The wave energy converter was designed to be 1.5 m wide, 1.4 m long, and 1.5 m high, and in front, it has a buoy to floating up and down the wave height. The dimension of the buoy is 1 m wide, 1.4 m long, and 0.2 m high, and the alternator is installed with the buoy to generate electricity. The results found that the generator started generating electricity at a wave height of 0.1 to 0.6 m. The highest electric power was 32.5 Watts in the case of a load of receiving 50 Watts. In the case of no load, the electric power was 217.56 Watts. The study of wave energy converter with a physical prototype has a high cost. It is necessary to study the physical prototype with a numerical model by using computational fluid dynamics (CFD), which reduces the costs and time of the study. Numerical Wave Tank (NWT) has been used for simulation of free surface waves, and it is also used as a numerical tool for studying wave energy converters [17]. Wave simulation using models often has wave reflection problems downstream of NWT [18]. Thus, for NWT, the appropriate boundary condition and method to simulate the most realistic wave before simulating wave energy converter have to be determined.
The theoretical wave energy in the coastal zone of Thailand was studied. The research includes two numerical models. The significant wave height and wave energy in the coastal zone of Thailand are simulated by the SWAN model. The CFD model is employed to simulate the wave. The wave parameters from the SWAN model are used to simulate waves in the CFD model. The results of wave simulation from CFD will be compared with significant wave heights from the SWAN model. The results of this study are the preliminary significant wave height study, possibly an appropriate location for installing a wave energy converter, and preliminary wave simulation in CFD before simulating a wave energy converter.

2. The Study Area and Data

2.1. The Study Area

Thailand is bordered by the Gulf of Thailand and the Andaman Sea. This study focused on the Andaman Sea. The Andaman Sea borders the south of Myanmar, west of Thailand, northwest of the Malay Peninsula, north of Sumatra, and east of the Andaman Islands, India (Figure 1).

2.2. Bathymetry Data

The bathymetry data in this study were provided by the National Geophysical Data Center by the National Oceanic and Atmospheric Administration (NOAA) at Colorado, US. The bathymetry data in this study were obtained from ETOPO1 and are the reanalysis data at 1 arcminute resolution, or approximately 1.85 km. The format of ETOPO1 is used as an ASCII file which is converted by using the FORTRAN program in order that the SWAN model can read the data. The bathymetry of the Andaman Sea covers latitude 5 °N to 17 °N and longitude 90 °E to 99 °E.

2.3. Wind Data

The Navy Global Environmental Model (NAVGEM) in 2014, which replaced the Navy Operational Global Atmospheric Prediction System (NOGAPS) in 2013, was used as input to the SWAN model. The wind data were collected from the 3-h data of the u and v wind components at 10 m above the water surface. The resolution of the wind data is 0.5 degrees or approximately 55 km. The NAVGEM is provided in GRIB format. This data are changed and compiled into a text format by WGIB program. It is reformatted by FORTRAN program in order that the SWAN model can read the data.

2.4. Wave Data

The SWAN model was validated with the observed data, which were collected from the satellite information. This study used data from the Jason-2 satellite, which received data from NASA’s Physical Oceanography Distributed Active Archive Center. The Jason-2 satellite is a satellite that explores the characteristics of the oceans; the orbit of the Jason-2 satellite has a circular form non-sun-synchronous orbit and an approximately 10-day repeat observed in the same orbit. The Jason-2 operates using two different radar frequencies. The Jason-2 operates using Ku-band (13.6 GHz) and C-band (5.3 GHz) frequencies. The Ku-band is the most commonly used frequency for wave model validation [19]. The observed data from the Jason-2 satellite with track numbers of 27, 90, and 166 passed through the Andaman Sea.

3. Numerical Wave Model

The SWAN model was chosen for this study. The SWAN model can estimate the wave parameters in the seas, coastal areas, lakes, and estuaries from wind, bottom, and current conditions. The evolution of the wave energy is considered in predefined cells within every grid cell of size Δx, Δy and Δt. The SWAN model is based on the action balance equation for shallow water as shown in Equation (1):
N t + ( c x N ) x + ( c y N ) y + ( c σ N ) σ + ( c θ N ) θ = S ( x , y , σ , θ , t ) σ
where N is the action density spectrum, σ is the frequency, θ is the wave direction, and t is the time. cx and cy are the velocities in directions x and y, respectively. cσ and cθ are the propagation velocity in σ-space and θ-space, respectively.
The rate of change of action in time is represented by the first term of Equation (1). The propagation of action in the x and y directions is represented by the second and third terms of Equation (1), respectively. The frequency shift and refraction due to depth and current are represented by the fourth and fifth terms of Equation (1), respectively. The source of S ( x , y , σ , θ , t ) represents the effects of generation, dissipation, and nonlinear wave–wave interactions. The term S ( σ , θ ) is term of energy density as shown in Equation (2):
S ( σ , θ ) = S i n p ( σ , θ ) + S b r k ( σ , θ ) + S f r c ( σ , θ ) + S w c p ( σ , θ ) + S n l 3 ( σ , θ ) + S n l 4 ( σ , θ )
where Sinp is atmospheric input, Sbrk is depth-induced wave breaking, Sfrc is bottom friction, Swcp is white-capping dissipation, Snl3 is triad nonlinear wave–wave interaction, and Snl4 is nonlinear quadruplet interactions.

3.1. Numerical Setup in SWAN Model

The SWAN cycle III version 41.01 was used for wave simulations in this study. The model was executed in non-stationary mode with Cartesian coordinates. The rectangular computational grid was executed with a grid resolution of 0.0167° and 0.0167° (1.85 km × 1.85 km) in both latitude and longitude. The direction number is 36 in the 360 ° rose, and the lowest and highest frequencies are equal to 0.042 and 0.041 Hz, respectively [20]. These numbers were used to study significant wave height at Gulf of Thailand by using the WAM model. The spectrum shape at the computational grid boundary was the JONSWAP spectrum. The SWAN model was simulated without current in this study. The dissipation due to depth-induced wave breaking, bottom friction, and white-capping was considered in the simulation. Triad–wave interactions were also considered as nonlinear interactions for shallow water.

3.2. Wave Power

The wave energy is the combination of potential energy ( E p ¯ ) due to the displacement of the water mass from mean sea level and kinetic energy due to the orbital motion of the water column. These two energy densities will be the total wave energy per unit area, which is called specific energy or energy density ( E ¯ ), as shown in Equation (3):
E ¯ = E p ¯ + E p ¯ = 1 16 ρ g H 2 + 1 16 ρ g H 2 = 1 8 ρ g H 2
where ρ is the water density, g is the gravitational acceleration, and H is the wave height (H = 2a for a sinusoidal wave). In physical oceanography, the significant wave height is used instead of the wave height in order to use the calculation of wave energy. The significant wave height is usually defined as H s = 4 σ 2 [21]. The water surface elevation time series variance for sinusoid waves is σ 2 = ( 1 / 2 ) a 2 = H 2 / 8 and then H s = 4 H 2 / 8 = 2 H / 2 and H = 2 H s / 2 . Substituting into Equation (3) gives the energy density in terms of the significant wave height according to Equation (4).
E ¯ = 1 16 ρ g H s 2
The wave energy flux or wave power ( P ¯ ) is shown in Equation (5).
P ¯ = E ¯ g T 4 π
Equation (4) can be substituted by Equation (5). If the density of seawater is 1025 kg/m3, the equation for shallow water can be shown as Equation (6).
P ¯ 0.5 H s 2 T
where P ¯ is the wave energy flux per unit of wave-crest length (kW/m).

4. Computational Fluid Dynamics (CFD)

Computational fluid dynamics (CFD) is a numerical method that can be used to solve complex fluid mechanics problems. The finite volume method (FVM) is used to solve the governing equations. In the finite volume method, the governing partial differential equations are adjusted in a conservative form and are solved for discrete control volume.

4.1. Computational Domain and Numerical Setup in CFD

The results of wave characteristics from the SWAN model are used as the wave parameters in the CFD model. The results of significant wave height from SWAN showed that the highest significant wave height was found in August. In this study, the wave characteristics in August were selected for the wave behavior simulation and include a wave period (T) of 6 s, wave height (H) of 3.36 m, and water depth (h) of 20 m. This study has wave simulation using an NWT which has the water depth as the same location as the SWAN model so the wave parameter from SWAN is also chosen for use in the CFD model. The NWT domain in two dimensions can be seen in Figure 2, where the length of the NWT is 5L m, and the height (HT) of the NWT is 30 m. The wavelength (L) can be obtained from the relationship between the wavelength, wave period, and wave height, as shown in Equation (7). The grid of the domain is used in wave simulation as a structure. The grid in the wave height has a finer grid resolution than other areas because it is the area that changes the wave according to time and position. The small grid size in wave height is used as 0.001 m.
L = g T 2 2 π tanh ( 4 π 2 h T 2 g )
The left-side boundary of the NWT in Figure 2 represents the inlet of the wave, which is defined as the velocity inlet in conjunction with the Open Channel Wave Boundary Condition (OCWBC) in order to generate waves. The right side of the NWT in Figure 2 represents the outlet of the wave, which is considered to be the pressure outlet. The top and bottom of the NWT in Figure 2 are defined as the pressure outlet and the wall with a no-slip boundary condition, respectively.
The reflected waves typically occur at the downstream of the NWT, which is the outlet for waves. If the reflected waves occur downstream of the NWT, the wave reflections can interfere with the incident oncoming waves. The patterns of interference depend on how the peaks and troughs of waves are matched up, i.e., constructive or destructive interference. Furthermore, the reflected waves give inaccurate results. Therefore, a damping zone is defined at the far end of the NWT to avoid wave reflection at the downstream, as shown in Figure 2. This is completed by adding a damping sink term (S) in the momentum equation as follows:
S = [ C 1 ρ V + 1 2 C 1 ρ | V | V ] f ( z ) f ( x )
f ( z ) = 1 z z f s z b z f s
f ( x ) = x x s x e x s
where C1 and C2 are damping coefficients, V is the velocity, and Zfs and Zb are the free-surface and bottom coordinates, respectively. Xs and Xe are the start and end positions of the damping zone in the x-direction, respectively. If the damping coefficients are defined as too much or too little damping, it could cause reflections. Thus, the damping coefficients should be appropriately defined so that the reflected waves can be completely damped.
The volume of fluid (VOF) method is the multiphase numerical model used to solve the fluid flow problem with two or more phases [22]. For the VOF formulation, all phases are defined, and the volume occupied by one phase cannot be occupied by the others. The free surface can be identified by the volume fraction (α) concept. Only two phases are used in our case, which are water and air. In each cell, if α = 1, the cell is full of water; when α = 0, the cell is empty (contain only air); and if the value α is between 0 and 1, the cell contains the interface between water and air [23].

4.2. Linear Wave Theory

The linear wave theory is used to validate with CFD results in this study. The linear wave theory can be explained by the equation that assumes that the wave is similar to a sinusoidal wave. The free surface of the wave or wave elevation are illustrated by Equation (11) as a function of time (t) and horizontal distance (x).
η ( x , t ) = H 2 cos ( k x ω t )
where η is the free surface, H is the wave height, ω is the wave angular velocity, and k is the wave number.

5. Results and Discussion

5.1. Wave Comparison

The results from the SWAN model were compared with Jason-2 data from February to April in 2014 in the area of the Andaman Sea. The wind data of NAVGEM have been collected since March 2013. The SWAN model was validated from February to April, which are not monsoon season in the Andaman Sea. The wind data from 2014 were used in this study. The dashed line in the map in Figure 3a shows the moving line of the satellite from point 1 to point 41 on 14 February 2014. Figure 3b,c shows the comparison of significant wave height results from the SWAN model and wind speed from the NAVGEM model with observed data from the Jason-2 satellite on 14 February 2014, respectively. Figure 3b shows that the results of the comparison of significant wave height from the SWAN model are in good agreement with the satellite data. Figure 4a shows the moving line of the satellite from point 1 to point 41 on 18 March 2014. Figure 4b,c shows the comparison of significant wave height results from the SWAN model and wind speed from the NAVGEM model with the observed data from the Jason-2 satellite on 18 March 2014, respectively. The results of the comparison of significant wave height from the SWAN model and wind speed from the NAVGEM model are likely similar to the Jason-2 satellite data. Figure 5a shows the moving line of the satellite from point 1 to point 41 on 17 April 2014. Figure 5b,c shows the comparison of significant wave height results from the SWAN model and wind speed from the NAVGEM model with the observed data from the Jason-2 satellite on 17 April 2014, respectively. The results of significant wave height from the SWAN model and wind speed from the NAVGEM model have a similar trend with satellite data. However, the results of the comparison of significant wave height show some different results.

5.2. Analysis of Data Validation

In this study, the root mean square error (RMSE), bias parameter, and correlation coefficient (R) are used to evaluate the accuracy of the model. The equations of RMSE, Bias, and R are Equations (12)–(14), respectively.
R M S E = 1 N i = 1 N ( P i O i ) 2
B i a s = i = 1 N 1 N ( P i O i )
R = i = 1 N ( ( P i P ¯ ) ( O i O ¯ ) ) ( i = 1 N ( P i P ¯ ) 2 ) ( i = 1 N ( O i O ¯ ) 2 )
where Pi is the predicted value, Oi is the observed value, P ¯ and O ¯ are the average values of predicted and observed values, respectively, and N is the number of data.
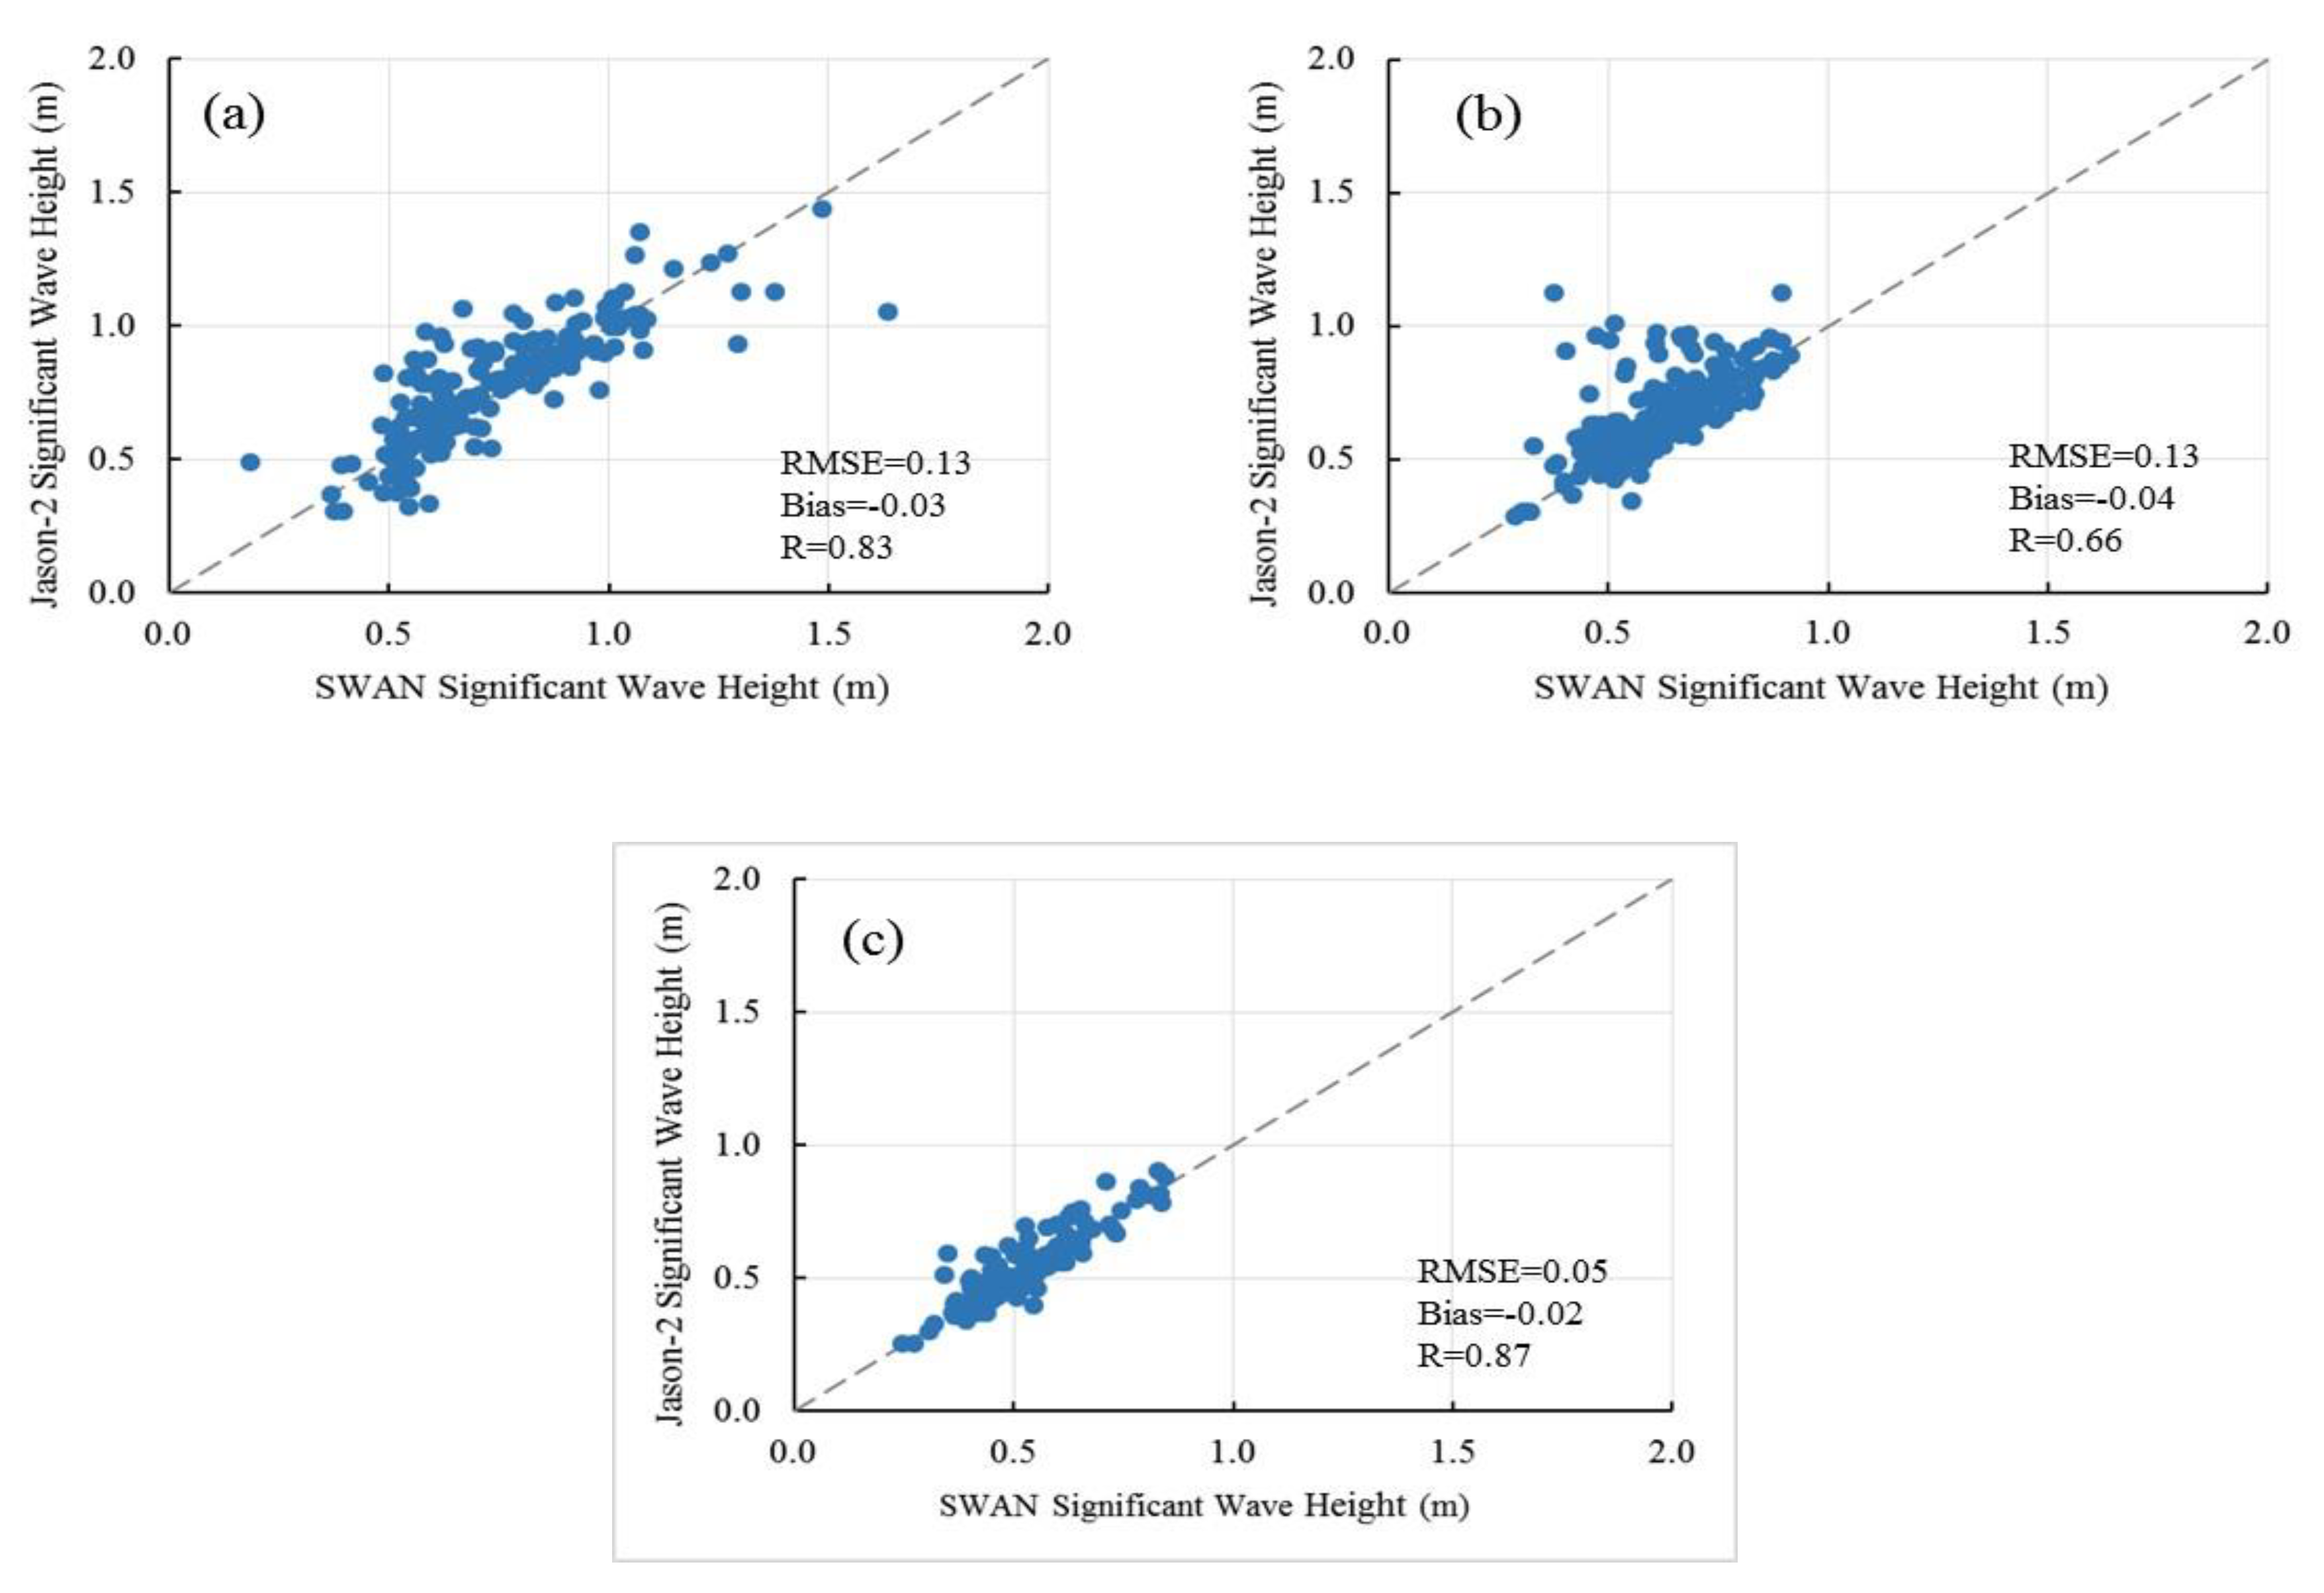
The significant wave height from the SWAN model was calibrated with Jason-2 satellite data in February, March, and April 2014. Figure 6 shows the relation of significant wave height between the SWAN model and Jason-2 satellite data in February, March, and April 2014. The RMSE of significant wave height in February is 0.14 m and Bias = −0.02 m, which means that the significant wave height from the SWAN model is slightly smaller than the satellite data. The R of 0.80 shows that the results from the SWAN model are in good agreement with the satellite data. The RMSE of significant wave height in March = 0.17 m and Bias = −0.08 m, which means that results from the SWAN model are slightly smaller than the satellite data. The R of 0.56 shows that the results from the SWAN model are in good agreement with the satellite data. The RMSE of significant wave height in April is 0.21 m and Bias = −0.07 m, which means that the results from the SWAN model are slightly smaller than the satellite data. The R of 0.68 shows that the results from the SWAN model are in good agreement with the satellite data. The terms of RMSE, Bias, and R in all 3 months indicate the good performance of the SWAN model.
The validation of significant wave height from the SWAN model was executed in October, November, and December 2014. The result of validation found that RMSE is 0.13, 0.13, and 0.05 m of October, November, and December, respectively. These values of RMS illustrate that the significant wave height from the SWAN model has quite similar results with the observation data. Bias values of October, November, and December are −0.03, −0.04, and −0.02 m, respectively. They have the same result with calibration, meaning that the significant wave height from the SWAN model is smaller than observation data. R values of October, November, and December are 0.83, 0.66, and 0.87, respectively. The values of R are high, indicating that the significant wave height is consistent with the observation data. Figure 7 shows the relation of significant wave height between the SWAN model and Jason-2 satellite data in October, November, and December 2014. From the calibration and validation of the SWAN model, it can be applied to assess the significant wave height.

5.3. Significant Wave Height

This study is a preliminary study; therefore, the SWAN model is used to determine the significant wave height at the Andaman Sea in 2014. The assessment of potential wave energy should study at least 10 years. In this study, the study points were set to evaluate the significant wave height and wave energy and to find a suitable location for installing the wave energy converter. Stations S1 to S8 are located nearshore or in transitional water zones, where the ratio of the depth per wavelength (H/L) is less than or equal to 0.5, because most of the technology for wave energy converter was designed in a transitional water zone. Furthermore, the transmission of energy from a wave energy converter uses less time and causes less energy loss. The locations of S1 to S8 in the Andaman Sea are as shown in Figure 8.
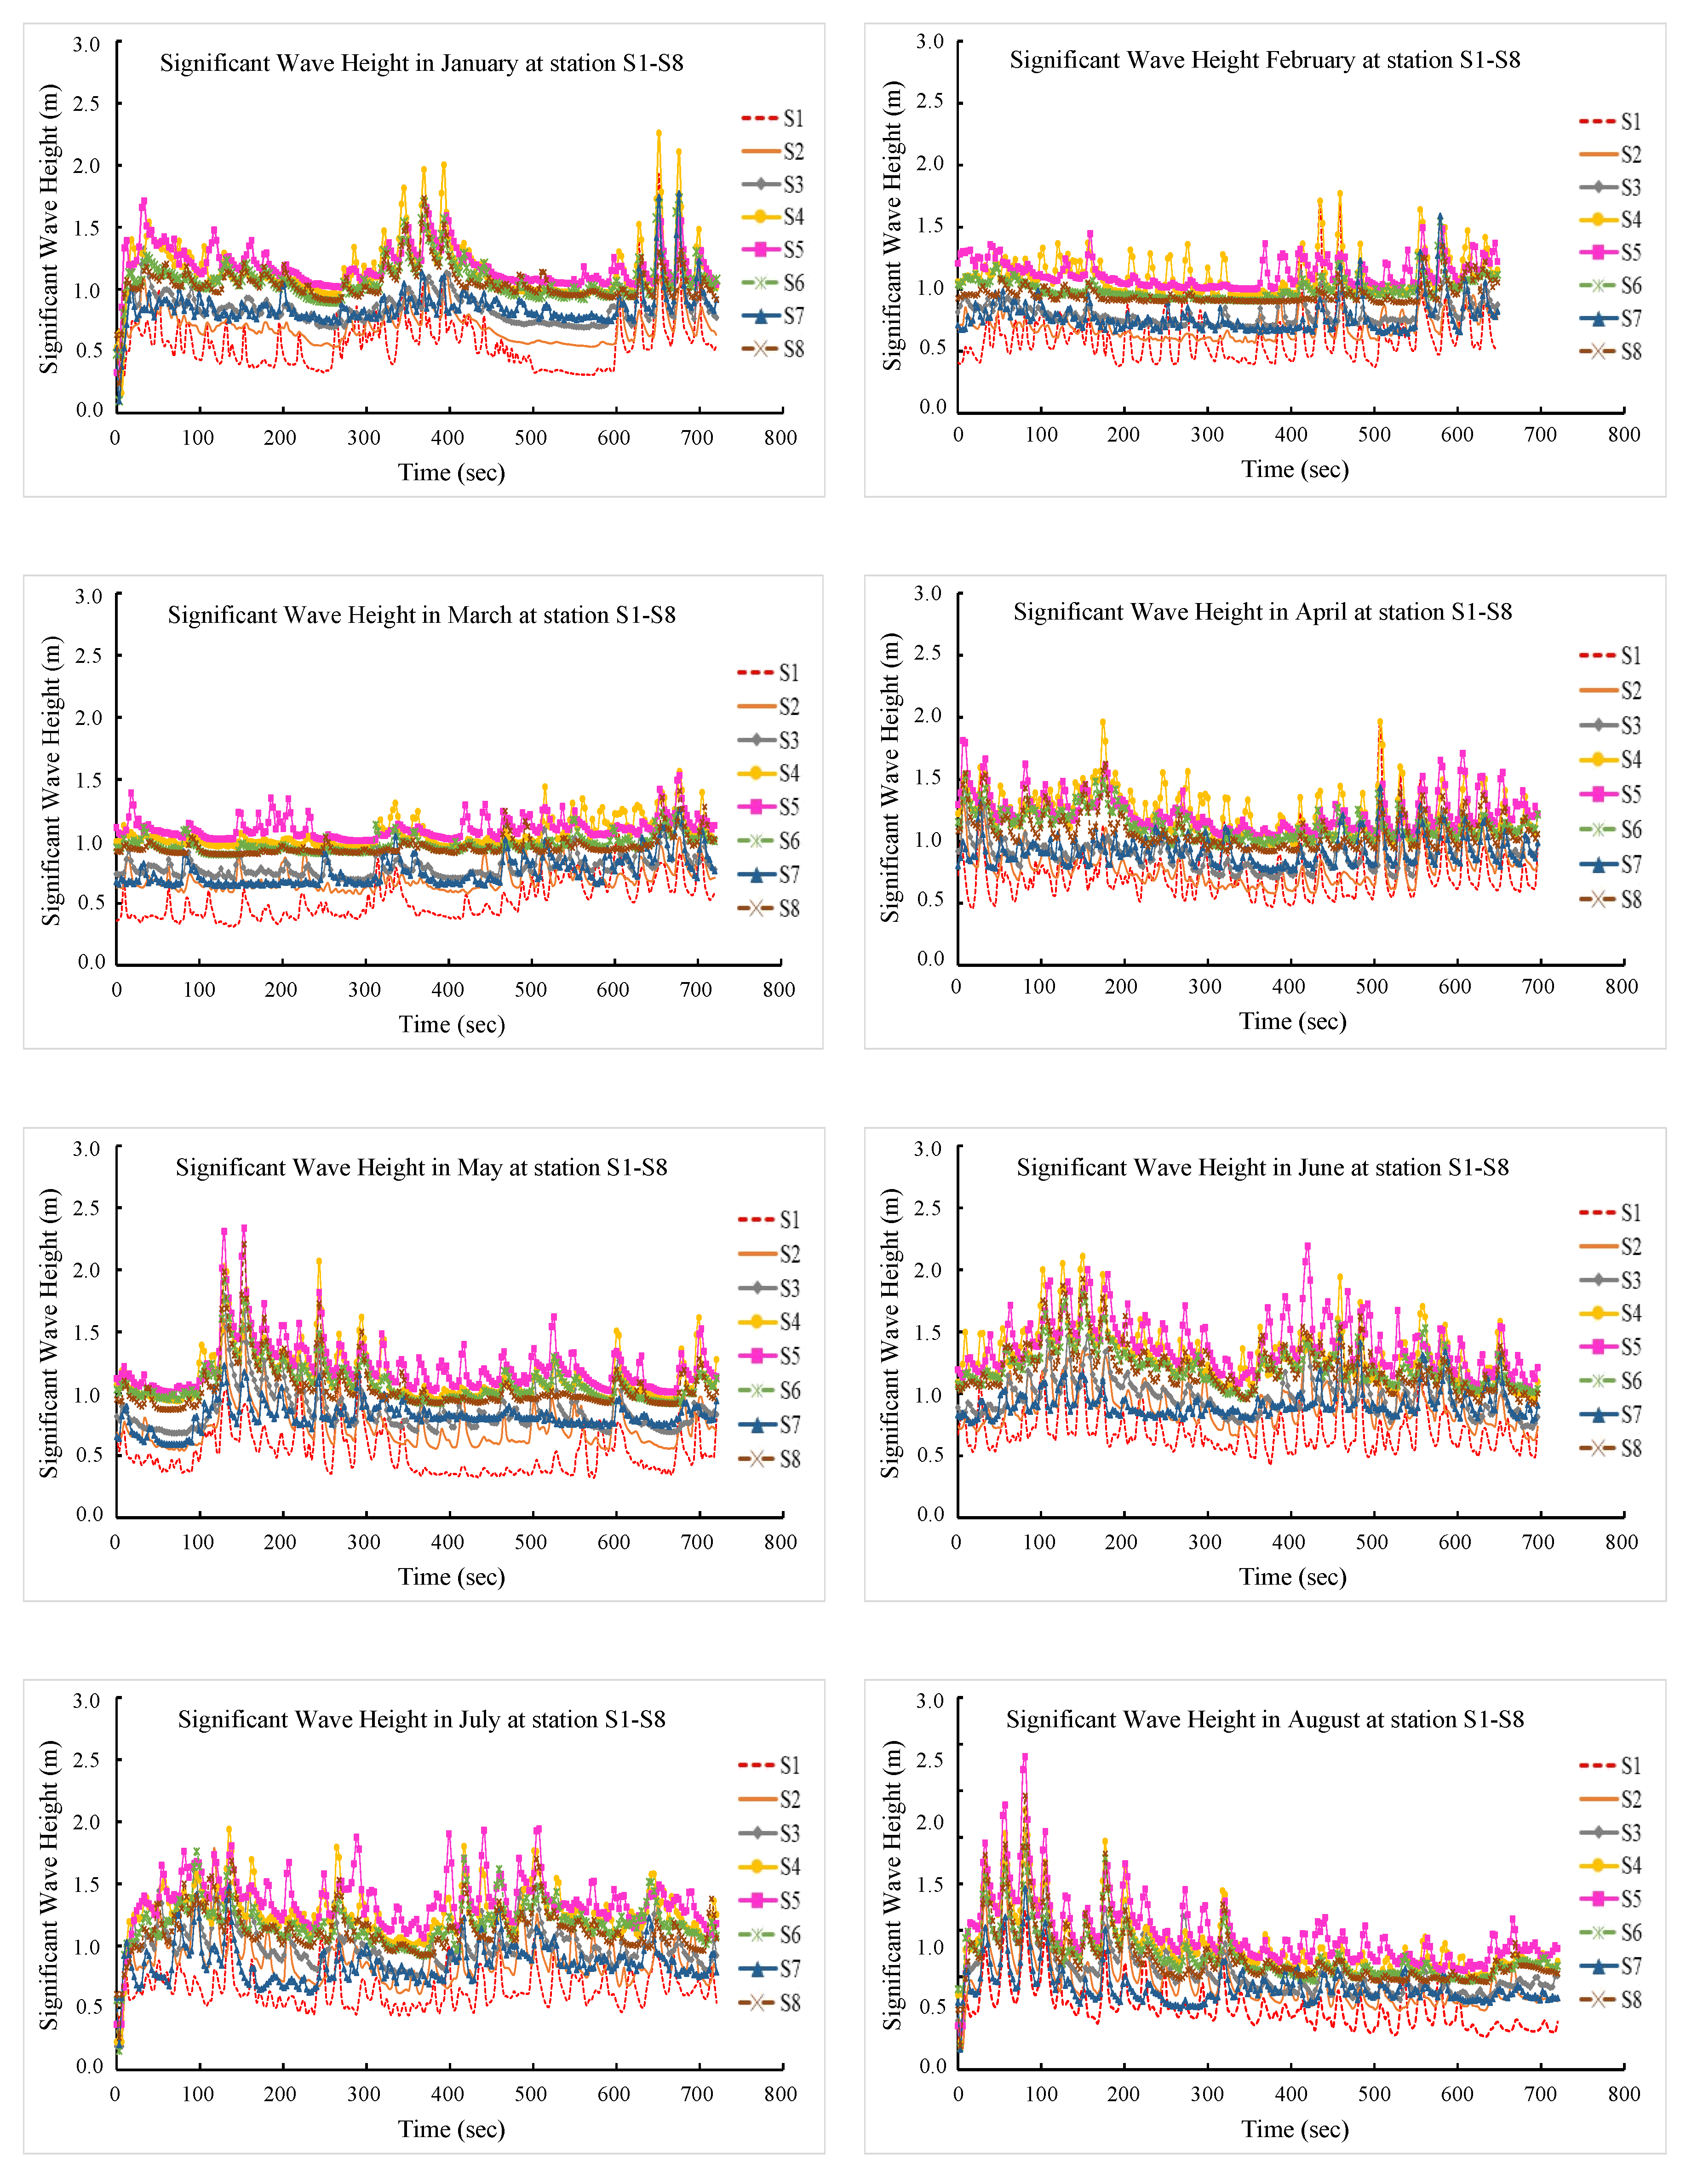
Figure 8 shows the significant wave heights of stations S1–S8 from January to December 2014. The results of significant wave height from Figure 9 can be summarized as the highest and lowest significant wave height of each month, as shown in Table 1. The highest significant wave height is 3.36 m at station S5 in August 2014. The lowest significant wave height is 0.20 m at station S3 in July 2014. From Table 1, the highest significant wave height in each month is often found at station S4, and the second rank is at station S5. The lowest significant wave height is usually at station S1. Stations S4 and S5 are the best locations of the eight locations. The nearest mainland shore to station S4 is Khao Lampi-Hat Tai Mueang National Park (Khao Lampi is named for the park section containing the Lampi mountain range, and Hat Tai Mueang is the beach section of the park) in the Tai Mueang District, Phang Nga Province. Hat Tai Mueang represents the natural beach forest within a national park, which covers the coastal area between Tap Lamru and Tai Mueang District, as shown in Figure 10. The nearest mainland shore to station S5 is Sirinat National Park in Thalang District, Phuket Province. The Sirinat National Park is 1 km away from Phuket International Airport. This location includes four main beaches, which are Hat Nai Thon, Hat Nai Yang, Hat Mai Khao, and Hat Sai Kaeo. Figure 10 shows Sirinat National Park. The shoreline of Thailand is normally a tourist destination and used for fishery, ship transport, etc. For this reason, the national park is selected for installing the wave energy converter because this area will not be disturbed from shoreline activity. Moreover, Thailand has a problem of coastal erosion; hence, the structure is to be built to protect from coastal erosion. The energy transportation can be difficult because it is blocked by the structure along the coast.

5.4. Wave Power

The highest and lowest wave powers are calculated by the highest and lowest significant wave heights of each month, respectively. The highest and lowest wave powers in 2014 are shown in Table 2. The highest wave power is 10.19 kW/m in August at station S5, and the lowest wave power is 0.44 kW/m in July at station S3. It is concluded that the wave power varies with the significant wave height. The wave power of the SWAN model can be calculated by the general wave power equation, while the use of ocean wave energy is converted into electricity by a wave energy converter. The wave power from a wave energy converter may not be equal to the wave power of the SWAN model. There are many types of wave energy converters, which can be categorized by the installation location of the wave energy generator and power take-off system. Each wave energy converter is constructed for working at maximum efficiency within a specific range of wave periods and heights. The efficiency of a wave energy converter is good within this range. However, the efficiency of wave power will decrease within other ranges of wave periods and heights. Therefore, it is necessary to select a wave energy converter to suit the location, wave period, and significant wave height.

5.5. Wave Energy Potential in Thailand

Thailand’s policy is to expedite the study to determine the sources and technologies that may be applied to wave energy. It includes assessing the potential and preparing for the development of the project in Thailand. There is expectation that coastal areas of Phuket province in Andaman Sea and around Ko Samui–Ko Phangan in the Gulf of Thailand may have potential for wave energy [24]. The highest significant wave height and wave power of this study are found at station S5 in Phuket province which is the same area as expected. The significant wave height and power were high during the southwest monsoon from May to October. This study had the same result as the study of Kompor et al. [25] showing the high significant wave height and wave power during the southwest monsoon. Moreover, their results indicated that the significant wave height in the Andaman Sea is higher than that of the Gulf of Thailand. The wave energy can be generated more than it can from the Gulf of Thailand. The study in the central and southern regions of the China Sea and the studies of Zheng and Zhuang [26] and Mirzaei et al. [27] indicated that the wave energy in the Gulf of Thailand is relatively low. The Gulf of Thailand has lower significant wave height than other areas in the South China Sea due to the reduction of bathymetry and shadowing effect of the Indo-China continent. The wave power development must consider the efficiency of a wave energy converter, investment, and environment of the selected site [28]. The Pelamis, Aqua Buoy, Wave Dragon, and Oyster were used to study the possibility of wave energy converter in the South China Sea [27]. The selected site in the Gulf of Thailand was Ko Sumui. The result of the wave energy converter at Ko Sumui found that Wave Dragon had the highest average electric power than other wave energy converter. Wave Dragon, which is a wave energy converter for moderate water depth, can generate an average of 206 kW of electric power per year [27]. The wave energy potential assessment in the Caribbean Low Level Jet (CLLJ) of Appendini [8] had a value range of 8 to 14 kW/m, which is low wave energy potential. Their conclusion is that CLLJ can produce the energy. The wave energy potential in Thailand is sufficient for energy conversion, although Thailand has low wave energy potential. From the study, the Andaman Sea is more suitable than the wave potential in the Gulf of Thailand, and the Andaman Sea is satisfactory for converting wave energy. If the wave energy converters are developed, which is increasingly important in low wave energy potential areas, it will encourage the wave energy to be used more efficiently.

5.6. Wave Simulation by CFD

The wave simulation with the SWAN model is a preliminary study to determine the appropriate boundary conditions of a CFD model. The wave characteristics of station S5 are simulated by using CFD. CFD is based on the Navier–Stokes equation for viscous, incompressible flow, and VOF. The wave simulation results show that wave height had a gradual dissipation of propagating waves at 36–42 s (Figure 11). The result of simulation at point 5L/2 (x) = 140 m at times of 0–42 s is compared with the linear wave theory (Figure 12). The dotted and solid lines represent the wave elevation from the CFD result and linear wave theory, respectively. The CFD result is in good agreement with linear wave theory. The result of wave height from CFD is consistent with the wave height from the SWAN model. The result had no wave reflection because the downstream is defined as a damping zone. This NWT and boundary condition is appropriate for wave simulation using CFD.

6. Conclusions

The results of the SWAN model were used to determine the wave characteristics for wave simulation and locate the suitable location to study wave energy converters in the Andaman Sea. It can be seen that the highest significant wave height and wave energy in 2014 are 3.36 m and 10.19 kW/m at the coastal area of Phuket Province (at station S5). Considering the significant wave height in 2014, stations S4 and S5 also provided high wave power. These stations frequently showed the highest significant wave height very month. Stations S4 and S5 are the appropriate locations to study and install the wave energy converter. From these results, it is found that Thailand does not have not much high potential for wave energy compared tothe other area. However, there is still some potential of wave energy which shows that wave energy can be used as renewable energy in Thailand.
The CFD model was used for wave simulation in the Andaman Sea. The wave characteristics of station S5, which is the highest significant wave height station, are used for the simulation to determine the highest wave energy from wave power generation. The downstream of this domain is designated as the pressure outlet boundary condition and has a damping zone. The results showed that wave reflection cannot be found in CFD. The wave height of the model is in good agreement with linear wave theory. Thus, the CFD result indicates that the damping scheme is quite complete for the damping, and this boundary condition is suitable for studying the performance of a wave energy converter and efficiently designing the device.

Author Contributions

Conceptualization, methodology and visualization and writing—review & editing, C.F., C.E., and D.K.; Data management and Formal analysis, C.F. and D.K.; Writing-original draft, C.F. and D.K. Supervision, C.E. and D.K. All authors have read and agreed to the published version of the manuscript.

Funding

This research was funded by the Institutional Research Capability Development Grant from Thailand Research Fund (TRF), Thailand and King Mongkut’s University of Technology Thonburi (KMUTT), Thailand grant number IRG5980002.

Acknowledgments

The authors would like to acknowledge the Institutional Research Capability Development Grant from Thailand Research Fund (TRF), Thailand and King Mongkut’s University of Technology Thonburi (KMUTT), Thailand.

Conflicts of Interest

The authors declare no conflict of interest.

References

  1. Hirunwong, P.; Singhaseni, S. The future electricity of Thailand sufficient but risky. In Focused and Quick (FAQ) Issue 102; Bank of Thailand: Bangkok, Thailand, 2015. (in Thai) [Google Scholar]
  2. Enerdata, Global Energy Statistical Yearbook 2017. Available online: https://yearbook.enerdata.net (accessed on 3 August 2015).
  3. Energy Policy and Planning Office (EPPO). Energy Statistics of Thailand Year 2016; Ministry of Energy: Bangkok, Thailand, 2017.
  4. Energy Policy and Planning Office (EPPO), Overview of Thailand Integrated Energy Blueprint (TIEB); Ministry of Energ: Bangkok, Thailand, 2015.
  5. Lavidas, G.; Venugopal, V. Application of numerical wave models at European coastlines: A review. Renewabe Sustain. Energy Rev. 2018, 92, 489–500. [Google Scholar] [CrossRef] [Green Version]
  6. Akpinar, A.; Vledder, G.; Komurcu, M.; Ozger, M. Evaluation of the numerical wave model (SWAN) for wave simulation in the Black Sea. Cont. Shelf Res. 2012, 50, 80–99. [Google Scholar] [CrossRef]
  7. Akpinar, A.; Komurcu, M. Assessment of wave energy resource of the Black Sea based on 15-year numerical hindcast data. Appl. Energy 2013, 101, 502–512. [Google Scholar] [CrossRef]
  8. Appendini, C.M.; Urbano-Latorre, D.P.; Figuerroa, B.; Dagua-Paz, C.J.; Torres-Freyermuth, A.; Salles, P. Wave energy potential assessment in the Caribbean low level jet using wave hindcast information. Appl. Energy 2015, 137, 75–84. [Google Scholar] [CrossRef]
  9. Wannawong, W.; Ekkawatpanit, C.; Kositgittiwong, D. Assessment of wave energy resource from the deep sea to the coastal area of Gulf of Thailand. In Proceedings of the International Conference Grand Renewable Energy, Tokyo, Japan, 27 July–1 August 2014. [Google Scholar]
  10. Thanathanphon, W.; Nakapakorn, K.; Phoomjamnong, N.; Luang-aram, W. Application of SWAN model for Investigate Save Characteristics in the Gulf of Thailand During Typhoon Muifa. J. Sci. Technol. 2011, 3, 40–50. [Google Scholar]
  11. Thanathanphon, W.; Wannawong, W.; Srisomporn, P.; Boonya-aroonnet, S. Development of an operational wave forecasting system for the Gulf of Thailand by using Simulating WAves Nearshore (SWAN) Model. In Proceedings of the Conference 20th National Convention on Civil Engineering, Khon Kaen, Thailand, 14–16 May 2014. [Google Scholar]
  12. Hong, Y.; Waters, R.; Bostrom, C.; Eriksson, M.; Engstrom, J. Review on electrical control strategies for wave energy converting systems. Renew. Sustain. Energy Rev. 2014, 31, 329–342. [Google Scholar] [CrossRef]
  13. Leao, R. Wave power conversion systems for electrical energy production. In Proceedings of the International Conference of Renewable Energy and Power Quality (ICREPQ), Santander, Spain, 12–14 March 2008. [Google Scholar]
  14. Drew, B.; Plummer, A.R.; Sahinkaya, M.N. A review of wave energy converter technology. Proceedings of the Institution of Mechanical Engineerings. Part A J. Power Energy 2009, 223, 887–902. [Google Scholar] [CrossRef] [Green Version]
  15. Lopez, I.; Andreu, J.; Ceballos, S.; De Alegria, I.M.; Kortabarria, I. Review of wave energy technologies and the necessary power-equipment. Renew. Sustain. Energy Rev. 2013, 27, 413–434. [Google Scholar] [CrossRef]
  16. Phomkaeo, K.; Punyasompun, S. Study of electric power generation from coast wave. Princess Naradhiwas Univ. J. 2013, 5, 37–46. [Google Scholar]
  17. Tanizawa, K.; Naito, S. A study on parametric roll motions by fully nonlinear numerical wave tank. In Proceedings of the 7th International Offshore and Polar Engineering Conference, Honolulu, HI, USA, 25–30 May 1997. [Google Scholar]
  18. Connell, K.O.; Cashman, A. Development of a numerical wave tank with reduced discretization error. In Proceedings of the International Conference on Electrical, Electronics, and Optimization Techniques (ICEEOT), Chennai, Tamilnadu, Indian, 3–5 March 2016. [Google Scholar]
  19. Dimitrova, M.; Kortcheva, A.; Galabov, V. Validation of the operational wave model WAVEWATCH III against altimetry data from Jason-2 satellite. Bul. J. Meteo Hydro 2013, 18, 4–17. [Google Scholar]
  20. Kanbua, W.; Supharatid, S.; Tang, I.M. Ocean Wave Forecasting in the Gulf of Thailand during Typhoon Linda 1997: WAM and Neural Network Approaches. Sci. Asia 2005, 31, 243–250. [Google Scholar] [CrossRef]
  21. Ochi, M.K. Ocean Waves: The Stochastic Approach; Cambridge University Press: Cambridge, UK, 1998. [Google Scholar]
  22. Hirt, C.W.; Nichols, B.D. Volume of fluid (VOF) method for the dynamics of free boundaries. J. Comput. Phys. 1981, 39, 201–255. [Google Scholar] [CrossRef]
  23. Srinivasan, V.; Salazar, A.J.; Saito, K. Modeling the disintegration of modulated liquid jets using volume-of-fluid (VOF) methodology. Appl. Math. Modeling 2011, 35, 3710–3730. [Google Scholar] [CrossRef]
  24. Energy Policy and Planning Office (EPPO). Alternative Energy Development Plan (AEDP); Ministry of Energy: Bangkok, Thailand, 2015.
  25. Kompor, W.; Ekkawatpanit, C.; Kositgittiwong, D. Assessment of ocean wave energy resource potential in Thailand. Ocean Coast. Manag. 2018, 160, 64–74. [Google Scholar] [CrossRef]
  26. Zheng, C.W.; Zhuang, H.; Li, X.Q. Wind energy and wave energy resources assessment in the East China Sea and South China Sea. Sci. China Technol. Sci. 2012, 55, 163–173. [Google Scholar] [CrossRef]
  27. Mirzaei, A.; Tangang, F.; Juneng, L. Wave energy potential assessment in the central and southern regions of the South China Sea. Renew. Energy 2015, 80, 454–470. [Google Scholar] [CrossRef]
  28. Teillant, B.; Costello, R.; Weber, J.; Ringwood, J. Productivity and economic assessment of wave energy project through operational simlations. Renew Enegy 2012, 48, 220–230. [Google Scholar] [CrossRef] [Green Version]
Figure 1. The Andaman Sea.
Sustainability 12 03657 g001
Figure 2. The Numerical Wave Tank (NWT) domain.
Sustainability 12 03657 g002
Figure 3. The comparison of significant wave height and wind speed between model and satellite data at the Andaman Sea on 14 February 2014, 1710UTC. (a) moving line of the satellite (b) comparison of significant wave height results from the SWAN model with observed data (c) comparison of wind speed from the NAVGEM model with observed data.
Sustainability 12 03657 g003
Figure 4. The comparison of significant wave height and wind speed between model and satellite data at the Andaman Sea on 18 March 2014, 2200UTC. (a) moving line of the satellite (b) comparison of significant wave height results from the SWAN model with observed data (c) comparison of wind speed from the NAVGEM model with observed data.
Sustainability 12 03657 g004
Figure 5. The comparison of significant wave height and wind speed between model and satellite data at the Andaman Sea on 17 April 2014, 1555UTC. (a) moving line of the satellite (b) comparison of significant wave height results from the SWAN model with observed data (c) comparison of wind speed from the NAVGEM model with observed data.
Sustainability 12 03657 g005
Figure 6. The relation of significant wave height between the Simulating WAves Nearshore (SWAN) model and Jason-2 satellite data at the Andaman Sea in (a) February, (b) March, and (c) April.
Sustainability 12 03657 g006
Figure 7. The relation of significant wave height between the SWAN model and Jason-2 satellite data at the Andaman Sea in (a) October, (b) November, and (c) December.
Sustainability 12 03657 g007
Figure 8. Location of stations S1–S8 in the Andaman Sea.
Sustainability 12 03657 g008
Figure 9. The significant wave heights of stations S1 to S8 in the Andaman Sea in 2014.
Sustainability 12 03657 g009aSustainability 12 03657 g009b
Figure 10. Location of station S4 and S5, (a) Khao Lampi–Hat Tai Mueang National Park and (b) Sirinat National Park.
Sustainability 12 03657 g010
Figure 11. Wave surface at t = 6, 12, 18, 24, 30, 36, and 42 s.
Sustainability 12 03657 g011
Figure 12. Surface elevation history at point x = 140 m.
Sustainability 12 03657 g012
Table 1. The highest and lowest significant wave heights from January to December 2014.
MonthThe Highest Significant Wave HeightThe Lowest Significant Wave Height
Significant Wave Height (m)StationSignificant Wave Height (m)Station
January2.26S40.30S1
February1.77S40.37S1
March1.56S40.31S1
April1.97S40.46S1
May2.34S50.32S1
June2.19S50.43S1
July1.94S50.20S3
August3.36S50.23S2
September2.25S40.42S1
October2.04S40.41S1
November2.59S40.42S2
December2.02S50.38S1
Table 2. The highest and lowest wave power from January to December 2014.
MonthThe Highest Wave PowerThe Lowest Wave Power
Wave Power (kW/m)StationWave Power (kW/m)Station
January5.54S40.77S1
February4.35S40.93S1
March3.49S40.74S1
April4.08S40.91S1
May6.08S50.74S1
June5.26S50.75S1
July4.54S50.44S3
August10.19S50.53S2
September5.40S41.02S1
October4.63S40.98S1
November6.60S40.86S2
December4.73S50.74S1