Abstract
Research has shown a strong correlation between the performance and health of young students and teachers, and the indoor environmental quality (IEQ) of their schools. A post occupancy evaluation (POE) of a school’s IEQ can help stakeholders understand the current conditions of the building and their impact on occupant wellbeing and productivity. It can also provide pathways for building performance upgrades and resource allocation for school administrations. However, current research on POE in schools frequently omits the contexts of young students during evaluations. Furthermore, there is limited research on guidelines for performing POE and measurements in school facilities. This study adopted the National Environmental Assessment Toolkit (NEAT) and tailored qualitative methods to evaluate eight schools over an eight-year period. The methodology was refined throughout the study to develop a protocol for robust investigation of IEQ conditions in schools. The NEAT was developed by Carnegie Mellon University’s Centre for Building Performance and Diagnostics for measuring the IEQ of office buildings. The paper addresses the challenges that may occur during POE and measurements (POE+M) and the differences between POE+M for offices and schools. It also determines how the POE+M process can be efficiently implemented to include all primary stakeholders in order to improve data collection for IEQ and energy efficiency analysis.
1. Introduction
In the United States, students in elementary and high school spend, on average, 1400 hours in school buildings every year [1] learning, playing, eating, and interacting with one another. When considering that young children, teenagers, and adults all congregate in school buildings for these many hours a year, there is growing concern on the quality of the environment in which they are exposed. School facilities exist to provide students a productive learning experience, but poor facility conditions have a tremendous impact on students’ health and performance. Decaying environmental conditions such as peeling paint, crumbling plaster, nonfunctioning toilets, poor lighting, inadequate ventilation, and inoperative heating and cooling systems can affect the learning as well as the health and morale of staff and students.
Many of the schools that currently exist were built before 1984, [2,3,4] and most of them have systems and assemblies in deteriorating condition [2,3,5]. Air circulation, which is important for Indoor Air Quality (IAQ) and occupant health, may be affected by these old and deteriorating systems. IAQ can be affected by gases (including carbon monoxide and volatile organic compounds), particulates, microbial contaminants (mold, bacteria, etc.), or any mass or energy stressor that can induce adverse health conditions. Hence, good ventilation is vital for schools because compared to adults, children breathe a greater volume of air in proportion to their body weight [6]. In addition, schools have much less floor space per person than found in most office buildings [7].
Research within the last 10 years has shown that approximately 8.5% of children have asthma [8,9,10], which has led to over 13 million missed school days [8]. Furthermore, asthma and other respiratory illnesses have been linked to the indoor environment and indoor air quality (IAQ). The presence of particulates such as NO2, PM10, and PM2.5, or excessive moisture in the indoor environment from inadequate ventilation has triggered asthma attacks in children [11,12,13]. Ventilation systems allow for the removal and dilution of breathing air contaminants such as CO2 and CO that build up within enclosed spaces over time. However, with old building systems or malfunctioning systems, the efficiency and regulation of indoor air quality is compromised. Moreover, research studies such as [14,15] have shown a correlation between low indoor air quality, and reduced student attendance. In a 2004 multiple-building study of 436 classrooms in 22 elementary schools in Washington and Idaho, Shendell et al. of Lawrence Berkeley National Laboratory (LBNL)determined that a 1000 ppm increase in net (indoor minus outdoor) classroom CO2 concentration is associated with an average 0.7% decrease in annual average daily student attendance, indicating that attendance may be improved by an increased ventilation rate and lower CO2 concentrations [15].
Beyond air quality, achieving optimal indoor environmental quality (IEQ) in schools requires full assessment of lighting, acoustics, thermal, and spatial conditions. One of the most critical physical characteristics of the classroom is lighting. Depending on the building orientation, site characteristics, local climate, and latitude, the amount of daylight that schools receive can be drastically different. The level of daylight in a classroom is vital as there can be significant visual problems if there is too little or too much daylight. Proper daylighting in classrooms provides multiple benefits including a reduction in the building’s energy consumption and heat gain, improved academic performance, and improved sleep and cognitive functions. Several studies identify strong correlations between daylighting access in classrooms and improvements in student test scores. A 1999 Heschong Mahone Group research study of multiple school districts in Seattle, Washington, and Fort Collins, Colorado showed that students “in classrooms with the most day lighting were found to have 7% to 18% higher scores than those with the least” [16,17].
In addition, an optimal acoustical environment will support a good listening space for students and a good acoustic venue for teachers. Proper acoustical support is crucial to young children because their auditory and language faculties are still developing. According to the Acoustical Society of America, “developmental status, linguistic and cognitive proficiency, temporary hearing impairments, and early receptive and expressive language disorders” are all factors that affect the greater susceptibility of young children to background noise and reverberation. [18]. A good acoustical environment should enhance the teacher’s voice and have a very subdued level of reverberation or late-arriving echoes. It should also prevent the intrusion of unwanted sound from the building’s mechanical systems, adjacent spaces, and sources such as children, lawnmowers, roadways, trains, and airports [19]. The presence of excessive noise or reverberation will lead to a greater percentage of missed words during classroom instruction. Poor acoustical conditions in the classroom impede the teaching–learning process and could lead to a progressive deficit in students’ academic performance. In addition to the cumulative negative impact of poor acoustics on pupil learning, excessive noise or reverberation can lead to supplementary stress and physiological harm for teachers.
Unhealthy and unsafe school conditions may also impair the quality of teaching and learning, which could lead to poor student attendance and performance rates, and in turn, reduce teacher and staff retention. A research study by [20] has indicated that teachers have “higher asthma prevalence than other non-industrial worker groups”. According to [21], the high asthma rates in teachers could be attributed to a school building’s reduced ability to maintain indoor relative humidity (RH), which increases allergens and irritants that are worsened by humidity. A survey of Chicago and Washington DC teachers by Schneider (2002) indicated that “30% of Chicago teachers and over 40% of teachers in Washington (DC) report[ed] that their rooms were uncomfortable”; this same study further identified a potential for increased teacher turnover due to undesirable indoor environmental conditions [21].
Lastly, temperature and relative humidity can affect the indoor environmental quality of classrooms tremendously not only because they help determine the thermal comfort of the students, but also because they promote the growth of bacteria and mold, which can trigger allergic responses and become harmful in a classroom environment. Maintaining thermal conditions and air quality are important for HVAC in schools, yet efficient heating, ventilation, and air conditioning (HVAC) systems may be absent in some of these older school buildings. At present, most schools lack HVAC systems that respond to occupant behavioral patterns such as occupant density and their activities [21]. The presence of these systems in schools would not only help improve occupant comfort, it can also reduce energy consumption.
Multiple case studies also show that older facilities without sustainable features or building upgrades have an impact on energy use due to their building attributes. The 2003 Commercial Building Energy Consumption Survey (CBECS) identified in Table B8 that over 60% of U.S. education facilities are 45 years old or older [22]. High energy costs within these buildings may be exacerbated due to poor lighting and space heating, which when combined make the highest energy uses in buildings [23,24]. However, facility managers are faced with shrinking budgets, which affects allocation of funds that could be used to update building systems and make sustainable upgrades. With rising energy costs and increasing building population, resources for renovations and building upgrades can be further limited.
Every year, K-12 schools spend over $6 billion on energy, which is more than the US spends on textbooks and computers combined [25]. As a result of the U.S. recession in December 2007, capital spending needed by States and Localities to renovate schools with modern systems and assemblies went down [26]. Elementary and high schools (K-12) in the United States had their budget reduced by $28 billion between the fiscal years of 2008 and 2013 [26]. Hence, improving energy and water efficiency in urban schools can have a major impact on improving resource allocation in school maintenance and upgrades and can also potentially improve climate conditions in cities. These benefits are reflected in utility cost savings for the school district and in reduced power demands for the region, which decreases harmful airborne emissions.
To achieve optimal IEQ, energy improvement goals, and determine resource allocation in school facility management, school facilities need to evaluate their building conditions and determine occupant comfort and satisfaction in their environment through post occupancy evaluation (POE). POE is the process of systematically assessing a building and evaluating its energy, thermal, acoustic, visual, spatial, and ergonomic performances after it has been built and occupied [27,28]. POE relies on the subjective surveys of IEQ variables, i.e., visual quality, air quality, thermal quality, acoustic quality [28,29], and spatial quality, which impacts ergonomics. It also relies on objective IEQ measurements from the technical attributes of building systems (TABS) to determine how the systems impact the indoor environment and compare the results to subjective results of user satisfaction [28,30]. POE is an invaluable tool to reveal the gaps between the design intent and the current state of building operations. An evaluation of a building’s systems and performance can serve as a springboard for effective retrofit and user-customized recommendations. POE can be used as a design aid through ‘feed-forward’ design charettes and support decision making for strategies and systems to implement in energy efficiency, occupancy comfort, and resource allocation. POE as a feedback tool can also be used in tandem with energy audits to support management of existing building systems by ensuring systems are working properly and as intended. In addition, personnel management can be improved as building performance has been linked to better performance through ergonomics and overall occupant health and wellbeing.
In practice, POE has been applied to numerous commercial and residential projects. The literature on commercial projects, especially for office spaces and educational facilities, is growing. Multiple research studies including [28,30,31] have shown the multiple benefits of conducting POEs in office environments, which include energy efficiency and increased occupant productivity, comfort, and wellbeing. These studies used a combination of qualitative and quantitative methods, which consists of surveys and field measurements, to evaluate IEQ. The research study by [28] further provided guidelines for conducting evaluations in office spaces regardless of building use or type, and these guidelines have been applied to many POEs of office buildings.
However, although there are numerous studies on the benefits of POE in schools [32,33,34], they primarily focus on questionnaire-based methods. Furthermore, despite the growing number of post occupancy evaluations in schools, there is no consensus on how to conduct one to get data on all the important variables. The POE process has not been streamlined for easy replication by non-academic personnel. Many studies also focus primarily on teachers’ input; nevertheless, investigating the perceptions of students in their spaces increases the robustness of retrofit recommendation.
There has been growing interests for rigorous and detailed evaluation of learning spaces in research [35,36,37,38], however this cannot be achieved by only evaluating teachers and staff contexts. A larger view of learning spaces should come from both the learning and teaching perspectives. Although teachers have great overviews of students’ IEQ conditions because they are the main points of contacts in school buildings, robust POE should include students’ perspectives. The studies by [38,39] use integrated stakeholder POE frameworks to determine whole-school information and insights on sustainability management, occupant comfort, and occupant health and wellbeing. While they aimed for the same outcomes, both studies used different approaches. One research study [39] used a method adapted from Photovoice to include students in the POE process in green schools, whereas [38] adopted participatory action research (PAR) methods to determine the individual relationships of all types of occupants to their school buildings.
In addition to the differences in methods and approaches to conducting comprehensive POE in schools, school facilities also pose further complications. School building types vary, building ages can create uncertainties on building systems information, and natural environment conditions are constantly changing (including environmental pollution). Ultimately, the primary aim of this research was to develop a unified protocol for POE and measurements (+M) of critical indoor environmental quality variables in school facilities regardless of unknowns and building types.
POE+M combines user satisfaction questionnaires with physical measurements as well as ‘as-built’ records on the conditions of each building system. The evaluation process goes beyond the conventional performance measurements, and recognizes the interrelated nature of spatial, thermal, air, acoustics, and visual qualities, promoting occupants as sensors and controllers. This comes from the understanding of critical linkages between occupant satisfaction, environmental conditions, and the technical attributes of building systems to health, productivity, and life cycle costs.
A secondary aim of the research was to present the importance of all stakeholders in providing data that can be tailored to fit all their needs. Ideally, an IEQ team should include facility management and administrative staff, teachers, custodians, school nurses, school boards, contract service providers, parents, and students to ensure a broad range of valuable input is considered. The paper will illustrate the process for rigorous yet efficient data collection that will help school facilities make building maintenance and upgrade decisions. The protocol considers real-world circumstances of multiple objectives of stakeholders in decision making.
The POE methods described in this paper was informed by Park et al. [28] guidelines for commercial office IEQ tests and field measurements using the National Environmental Assessment Toolkit (NEAT). This research recognized the differences between office buildings and school facilities and used the analysis of eight school facilities over an eight-year period to design a protocol more suited for schools.
2. Materials and Methods
A longitudinal POE+M study was conducted at eight schools between 2012 and 2019. All participants gave their informed consent for inclusion in the study prior to measurements at their schools. The schools selected were either undergoing renovations, had plans for expansions, or requested evaluations due to their IEQ monitoring initiatives. Quantitative and qualitative data collection occurred in the form of advanced indoor environmental quality monitoring measurements and occupancy surveys and interviews. Data collection was performed using the NEAT developed by the Center for Building Performance and Diagnostics (CBPD) at Carnegie Mellon University (CMU) with support from the US General Services Administration (GSA). The NEAT was established 20 years ago and has been deployed in 1600 workstations in over 60 office buildings [28].
Qualitative data collection during the research study involved the distribution of a specific brand of occupant satisfaction surveys called Cost-effective Open Plan Environments (COPE) surveys, which was established over 10 years ago by the National Research Council Canada (NRC). COPE is a paper-based survey that has been used in post occupancy evaluation of commercial building projects in several research studies including [28,40]. The qualitative technique also involved meetings with facility managers to determine the state of the building systems. The quantitative technique included environmental monitoring and space metrics using two tools: The TABS and IEQ measurements from the students’ and teachers’ workstations/desks.
2.1. Differences between Post Occupancy Evaluation and Measurement in Schools and Office Spaces
There are significant differences between how POE+M are conducted in schools and office spaces. In schools, the nature of the occupants and their spaces present more dynamic considerations of occupant age, spatial use, and measurement times. The study identified seven differences in methodology and recognized the importance of these differences on accurate data collection for schools. The protocol was developed to respond to these eight differences and evaluators should consider these in their own contexts when applying the protocol to their projects.
- Varied desk heights: Desk heights in schools vary across different types of spaces, such as classrooms, studios, and labs. The heights may also vary within a multipurpose space, for example, common areas such as recreational spaces and student lounges, whereas in office spaces, the majority of tasks are performed at a workstation that is primarily fixed. Table heights also change with the age of students because of their growing heights. Schools with multiple education levels, i.e., kindergarten, elementary, and middle schools will have multiple desk heights. However, in offices, there are often only one or two desk heights that evaluators need to account for during measurements.
- Increased metabolic rate, activity, and movement: During school hours, students tend to be very active. This is supported by sports or physical activity programs, classroom changes for new subjects, and collaborative work during classes. On average, children also have higher metabolic rates compared with adults. In contrast, office spaces tend to be more sedentary.
- Spot measurements: A ‘spot’ is considered a point in a space such as the classroom. A spot may be a workstation/desk, or a location in the center of a room. Spot measurements indicate tests conducted at either a workstation or pre-defined point in a space. In the study by Park et al. [28] of 64 office buildings, one spot measurement was taken at each office. However, due to the dynamic environment at schools, this is not ideal. More spot measurements are needed per space (classroom) in order to accommodate for the increased movement of students and teachers.
- Dynamic workstations: The locations of workstations may also vary throughout the day. This is commonly directed by the course agenda or teaching style. For example, through conversations with homeroom teachers during the study, floor-based learning, especially in elementary schools, was found to be common practice. Lower grade classrooms contained multiple seating arrangements with dynamic layouts that change throughout the day. In a single class, children can sit at their desk, then move to the floor for a special activity, or arrange their chairs in a circle away from desks. In this case, the protocol for spot measurements of variables such as air quality needed to be modified to accommodate floor level testing and increased testing in the classroom.
- Acoustic interferences: Schools tend to be noisier than office spaces. There are greater noise interferences from students, and increased background noise, from traffic in hallways, music labs, outdoor and recreational spaces, mechanical and electrical equipment, cafeterias, and breakrooms. Background noises can be more distracting for children since the ability to distinguish background sounds and comprehend spoken words improves with age.
- Young occupants: Students in primary and secondary schools are predominantly minors (under 18 years old). As a result, the protocol for administering post occupancy surveys differs. Unlike in offices where user satisfaction surveys are distributed to all occupants in the spaces being measured, the surveys are typically only administered to teachers and staff. At the discretion of the teachers or supervising adults, specially designed surveys are given to students. The surveys are modified to reflect the respondents age, maturity, and level of understanding of building features.
- Data entry: The protocol for data entry also differs for schools than offices. For example, for lighting spot measurements data entry for office spaces, there is a data input cell for ‘Light Level – Task Off’ and a cell for ‘Light Level – Task On’. However, for classrooms there are no task lights at students’ desks although there may be a single task light at the teacher’s desk. In school facilities, it is important to identify the various lighting types and sources within a single classroom and note the location of the classroom furniture at the time of the measurements due to the dynamic nature of the furniture.
2.2. Indoor Environmental Quality Variables
Environmental quality goals vary based on the specific activities performed in a space. The study identified 14 main goals that improve a schools IEQ by considering both students and teachers contexts. The goals were determined by identifying activities that are common to K-12 schools, which include frequent movement of occupants, computer use, music, gym, and group learning. The study also identified indicators that should be measured to support these goals. The unique NEAT cart provides instruments for data collection and measurement of the indicators for each variable, as shown in Table 1.

Table 1.
Indoor environmental quality assessment indices and indicators for testing.
The study considered the fact that noise criteria (NC) and room criteria (RC) are both widely recognized criteria used for evaluating indoor sound levels when mechanical equipment is operated in buildings. The NC and RC curves define a range of noise levels from levels that are quiet enough for sleeping to noise levels in noisy work areas where speech communication is difficult [41]. The lower the NC and RC ratings, the quieter the space.
The Illuminating Engineering Society of North America (IESNA) sets illumination levels by task considering electric lighting is used. IESNA recommends that the minimum horizontal illuminance at desks for students and teachers should be around 50-foot candles (500 lux) for reading and performing other desk-based tasks or 3-foot candles (30 lux) if facilities are using video display terminals (VDTs) [42]. IESNA also recommends that the vertical illuminance for white boards should be 5-foot candles (50 lux) and a chalk board should be 50-foot candles (500 lux). Illuminance is often confused with brightness; however, brightness is a subjective perception of light in a space.
High concentrations of CO2 can pose a health risk to both teachers and students. The Occupational Safety and Health Administration (OSHA) established a permissible exposure limit (PEL) of 5000 ppm averaged over an 8-hour workday for CO2 [43]. Furthermore, the American Conference of Governmental Industrial Hygienists (ACGIH) recommends an 8-hour threshold limit of 5000 ppm and a ceiling exposure limit of 30,000 ppm for a 10-min period [43].
Gasoline-powered equipment, unvented gas space heaters, and central heating systems (furnaces and flues) that are not regularly inspected and maintained can generate CO in a building. The National Institute for Occupational Safety and Health (NIOSH) established a recommended exposure limit (REL) of 35ppm over an 8-hour period for CO, and 200ppm as a ceiling limit [44].
Lastly, the study considered the type of air particulates that may be found in schools. In schools, a certain amount of sub micrometer particles may be generated during cleaning or during the operation of the school cafeteria [45]. Particles may even be imported into classrooms when children enter their school buildings from outdoors after breaks, or at the beginning of the day [46]. People may also carry viruses, bacteria, pollen, and pollutants such as dust mites into their school buildings via their shoes, clothing, and other personal belongings.
2.3. Field Test Process
This research was conducted at eight kindergarten to high school (K-12) educational facilities in Western Pennsylvania. At each school, 15-30 teachers, staff, and students were surveyed and interviewed. The field measurements were performed at different seasons during the school year and data were collected to help school administrations, architects, and other building key stakeholders explore the correlation between occupants within the spaces, the technical attributes of the building systems, and indoor environmental quality of the spaces that were measured. A summary of the physical attributes of the schools and locations measured is provided in Table 2.
Table 2.
Characteristics and building attributes of the eight schools evaluated and measured.
2.3.1. Spatial Quality
Spatial quality is an indication of a functioning space. Spatial quality represents the height of ceilings, layout of the room (open plan, closed layout, individual spaces), furnishing, furniture, and the room organization. As a result, field tests for spatial quality rely on ethnographic methods, primarily observations with occasional note taking, sketching, and photography.
The research study investigated the types of spaces within the buildings, such as individual group meeting spaces, lounges, meeting rooms, cafetorium, and conference rooms. The investigation helped support the correlation between space type and ergonomics during analysis. The study also used observations to determine the quality of furnishings and furniture. These methods supplemented with findings from the survey and assessments of the space were used to determine the spatial quality of measured rooms in the schools.
2.3.2. Thermal Quality and Visual Quality
Thermal and visual quality measurements, which last at least five minutes, were taken at four or five spots in classrooms. It was determined through the longitudinal study that there was a need to increase the number of spot measurements to account for the increased active environment in classrooms. Ideally, when measuring for horizontal and vertical radiant temperature and relative humidity, the NEAT cart (Figure 1b) is utilized. In each room measured, the NEAT cart is placed in the position of the teacher or students chair for approximately 15 min. The NEAT cart has indoor air quality sensors and an air temperature sensor at 60 cm from the floor (desk level), and additional air temperature sensors at 110 cm (head level) and 10 cm (floor level). This set-up method is used to imitate the body height positions of an occupant when seated at a desk/workstation. Based on the differences between schools and office spaces such as varying desk heights, the study adopted a supplemental method for using the NEAT instruments at the field.
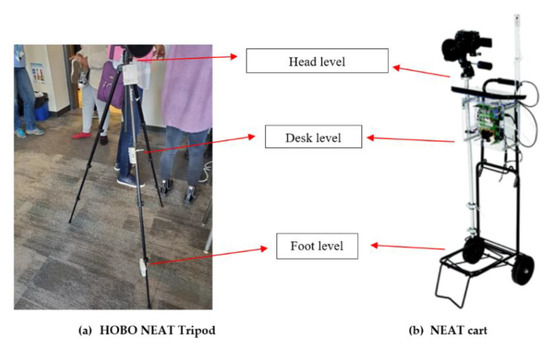
Figure 1.
(a) The adjustable National Environmental Assessment Toolkit (NEAT) instruments set up on a tripod in image and (b) Carnegie Mellon University’s (CMU’s) National Environmental Assessment Toolkit™ cart in image.
During measurements at the schools with multiple educational levels, including A, B, C, and E, three HOBO sensors were attached to a tripod with zip ties at the respective heights that depict head, desk, and foot levels (Figure 1a).
The tripod is easier to adjust to fit the changing height levels of younger students, in comparison to the NEAT cart (Figure 1b). Furthermore, the makeshift ability of the tripod makes it valuable as a temporary substitute for the NEAT cart. For example, instruments may break when being used in the field. In such situations, it is easy to build a makeshift ‘cart’ with the HOBO air temperature and relative humidity sensors.
Visual quality is also measured on the NEAT cart and can be measured with the HOBO NEAT tripod. A camera with fish-eye lens (Figure 2a) is fixed slightly above head level of either the NEAT cart or HOBO NEAT tripod to capture the occupant’s vision field when they are sitting. The visual quality of the workstation was measured by taking high-quality photos with the thermal graphic camera lenses as shown in Figure 2a. The images were stitched together, and illuminance and glare were determined during post processing (Figure 2b).
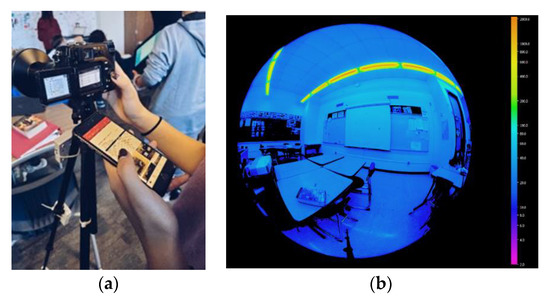
Figure 2.
Glare and illuminance measurement and post-processing. (a) Team member taking photos at head level to measure glare and illuminance; (b) post-processing for luminance ratio [47].
Lastly, due to differences between schools and offices, the protocol for measuring lighting was modified to accommodate the new set of conditions in the classroom. Light level measurements (lux) were taken at desks with the electric lights switched on and off to fit the two different tasks light levels. At most times, the light level in the classroom was measured for only daylight conditions because there were no tasks lights.
2.3.3. Air Quality and Acoustic Quality
As children are more active—especially in the lower tier classes—their inhale and exhale rates are high. When they run and stay active, the CO2 levels in the space tend to be higher. Findings from the surveys indicated that these high CO2 levels led to ‘stuffy’ indoor environments for students and teachers. Also, considering that students have activities on the floor, particulate matter may affect their respiratory health.
To measure air quality, the air quality sensors are placed at the “breathing zone” of workstations/desks in the classroom at about 60 cm from floor level. The air quality variables measured are concentration levels of CO2, CO, particulates (PM0.3, PM0.5, PM1.0, PM2.5, PM5.0, and PM10), and Total Volatile Organic Compounds (TVOC). The particle matter meter placed on the table (Figure 3b) records particulates and logs the data for analysis, while the air quality sensor in Figure 3a measures and logs air quality. The air quality sensor can also be placed at the floor level to check for PM2.5, PM10, and other air contaminants. When teachers employ ‘floor learning’, the protocol dictates measurements at both the desk and floor levels.
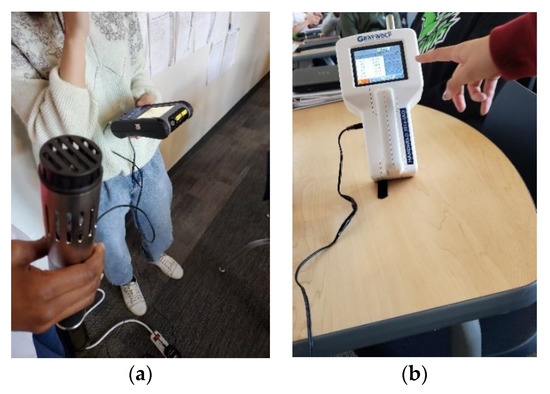
Figure 3.
Air quality measurement devices are used to measure air quality variables such as CO, CO2, PM2.5, and TVOC for spot and continuous measurements. (a) Air quality sensor and data logger; (b) particulate matter meter.
The increased spot measurements for schools are also beneficial for acoustic quality. Schools are typically very noisy due to the flurry of activities during school hours, and student learning may be affected by background noise from building systems, machinery, and other classes. In this study, acoustics in libraries, swimming pools, classrooms, and labs were tested through a handheld portable sound meter (Figure 4) and supplemented with occupant surveys.
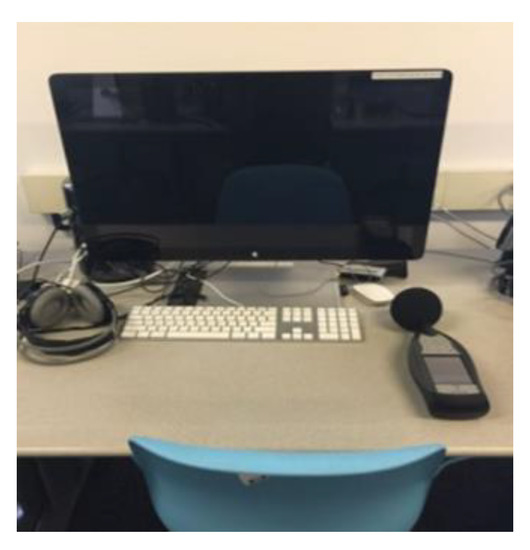
Figure 4.
Handheld acoustic meter to measure background noise level from heating, ventilation, and air conditioning (HVAC) equipment at desk level [47].
2.3.4. Occupant Satisfaction Surveys
The paper-based COPE survey measures user satisfaction in workspaces. It is a standardized methodology for studying building performance from the occupants’ point of view, in order to provide feedback to building designers, owners, and operators. COPE questions cover both short- and long-term issues and include 7-point and 5-point options, in addition to yes/no questions. The COPE survey covers 29 questions related to demographics, control of IEQ variables in an occupant’s space, control of the occupant’s space and workstation, and perception of IEQ impacts such as glare from lighting and stuffiness from minimal air flow. To fit the school context, a simplified version for younger kids was developed with a 3-point scale. Figure 5 and Figure 6 compare the 3-point and 7-point scales of a survey given to young students and adults at one of the eight schools. A question on lighting quality was asked to adults only.
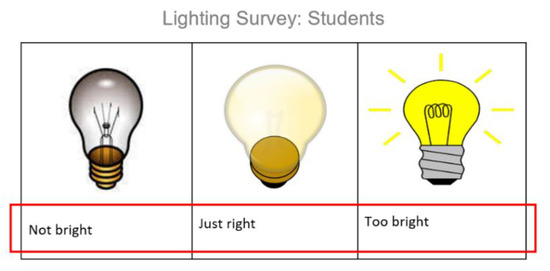
Figure 5.
Three-point lighting question for students [48].
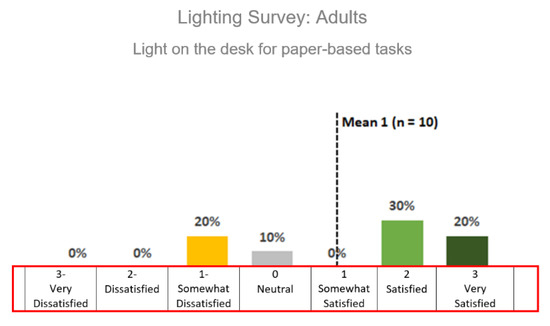
Figure 6.
Seven-point lighting question for adults [48].
How do you feel about the light on the desk for paper-based tasks (reading & writing)?
The same question was modified for students in grades 5, 4, and 3 that were between the ages of 8–11 years old.
How do you feel about the light in your classroom? Circle one
2.3.5. TABS and Facility Manager Interview
The Center for Building Performance and Diagnostics developed four expert walkthrough sheets for analysis of both the workstation and building floors/zones of the building. The sheets cover spatial and ergonomic TABS, acoustic TABS, lighting TABS, and thermal and air quality TABS. These sheets are used to collect data on the state of building systems that affect the IEQ variables. This is done to ensure the data collected from subjective occupant responses, and objective physical measurements are consistent with the technical attributes of the building systems found within the building.
In addition to using the sheets as guides to record attributes of building systems such as the enclosure, mechanical systems, lighting, and amenities/interior conditions of the space; the sheets also guided facility management interviews. Each sheet has a list of items to cover based on its technical attributes; however, there are some systems that cannot be easily identified either because there is no access provided to the field team, or because it is not available. Other attributes require further insight from an expert involved with facility management of the school. Some of these attributes include:
- Thickness of partition walls;
- Type of insulation present within the walls;
- Level of maintenance conducted for HVAC system and pollution source management plan (if applicable);
- Data on energy use in each floor/zone, per fuel type and use (if sub-metered) and complaint date (if applicable).
3. Protocol for Conducting Post Occupancy Evaluation and Measurements in Schools
Based on the ongoing research efforts from CMU’s CBPD, a robust indoor environmental quality evaluation and measurement protocol for schools was developed and tested in the field over the eight-year period between 2012 and 2019.
3.1. Protocol for IEQ Post Occupancy Evaluation and Measurement in Schools
A detailed manual is written to define the steps involved in consistent data collection. The protocol for measuring and evaluating indoor environmental quality in schools is summarized in Table 3. This table highlights the phases that constitute a POE+M in schools, i.e., pre-test, during test, and post-test. It also lists the tasks involved in each phase, instruments required to complete the tasks, and if occupants should be present in the room during each task.
Table 3.
Summary of indoor environmental quality (IEQ) post occupancy protocol for schools.
3.1.1. Pre-Test Phase
- Ethical Procedures: Due to the nature of the POE+M, and the presence of minors in the schools, it is advised that ethical procedures relevant to the POE+M team are followed. This includes obtaining permission from a research integrity and compliance board or organization such as an institutional review board (IRB). There is no physical contact with any minors during the POE+M process, and a supervising adult representing the school must be present during measurements; however, to ensure ethical practice, the following steps are recommended based on the protocol that guided the research teams within this study.
- Field personnel should complete training per the applicable/relevant IRB guidelines.
- All surveys should be reviewed by the IRB before utilized at the schools.
- Measurements in the classrooms or spaces with students should be approved by the school principal, or other applicable head of school administration.
- In cases where students in the schools are involved in either the survey, measurements, or their likeness/pictures are used within reports, then explicit permission should be provided from a guardian.
- Supervisor of field team such as a professor should have all state and federal background check clearances current. Additionally, it is advised that the supervisor have undergone risk management training for working with minors.
- Early Decision-making: Due to limited manpower and specific measurement requirements, building layout and floor plans are collected during the pretest stage. Using these floor plans, initial details on the technical attributes, and concerns in the space, decisions are made with respect to location of testing and the process. The work area is divided into perimeter zones, interior zones, and core zones. For each school evaluation, it is recommended that at least 40% of the frequently used spaces are measured. The goal is to conduct testing that is holistic, hence it is important to choose zones (spaces) that are on different floors, and situated in different corners, i.e., spaces that were facing different cardinal directions, which has implications on daylight, radiant temperature, wind, etc. It is also suggested to choose zones with wider array of functions such as the gym, cafeteria, thinking lab, music lab, and classrooms in order to increase the quality of the data collected. The sampling of rooms/spaces should follow these guidelines:
- Representative room type sampling: Sample a proportional number of classrooms, offices, and common spaces to those in the entirety of the building
- Floor sampling: Ensure equal distribution of rooms/spaces measured across total number of building floors.
- Building Orientation sampling: Include rooms/spaces with unique orientation and adequate representation of north, south, east, and west sides of the building.
- Unique condition sampling: Measure unique spaces that might have variations in conditions.
Specific room requests by school administrations should also be mixed in with the selection of zones. Early decision making will impact how rigorous the measurement will be and data pulled.
- Prepare field measurement plan: Prior to performing the field measurement and administering the survey, it is recommended that the field team prepare a workplan to guide the process. Based on findings from the research study, the workplan contributed to increased efficiency and productivity of the field measurements. Additionally, measurements occurred with minimal disruption to the students and teachers in the classrooms when it is both quick and calculated. The workplan includes a brief introduction of the measurement planned, how it will be performed, and the team members participating in the measurement. Members of the team with specific skills or expertise, may be positioned to measure IEQ variables relevant to their skillsets. A workplan template was developed and used by the different research teams in this study, to run scenarios on the field measurement and allocate tasks amongst their team members. Table 4 provides a sample of the spot measurements within the workplan used by one of the research teams.
Table 4. Workplan sample for nine workstations conducted by four team members (TMs).
Each team member (TM) was assigned a work assignment that was to be conducted at each assigned spot and at the conclusion of field measurements. Examples of these work assignments include.
- TM #1
- Record time team entered and left each space/room;
- Record real time air quality data including TVOC, CO2, CO, relative humidity, and temperature using IAQ meter;
- Measure brightness at keyboard, monitor, and desk projector screen for each workstation using Illuminance meter;
- Interpret IAQ and radiant temperature results.
- TM #2
- Record the occupant’s workstation condition and take photographs for each workstation;
- Use the PPM meter to record the particulate matter concentration;
- Measure radiant temperature by using radiant temperature meter for the ceiling, floor, interior, and exterior;
- Collate COPE occupant satisfaction survey data and NEAT data for the server;
- Analyze the data from both the PM meter and Illuminance meter.
- TM #3
- Instruct, distribute, and collect COPE occupant satisfaction survey;
- Gather information about the schools TABS;
- Analyze problems observed from TABS;
- Summarize site information.
- TM #4
- Setup fisheye-lens camera and take photographs for illuminance analysis;
- Use HOBO sensors to gather and analyze indoor temperature and relative humidity data;
- Analyze acoustic level in the rooms;
- Record and analyze the temperature and the condition of the building using the thermographic camera;
- Analyze the data of fisheye photographs and process them using Photolux software.
- Observations: Observations should be made at the beginning of the field analysis, and these observations should be recorded for room and zone/floor analyzed. Observations should be conducted using ethnographic techniques including photography, sketching, and note-taking.
- Measurement Instruments: The tools shown in Table 5 were used for this study and will support accurate field measurements. However, evaluators can utilize any brand of these tools. For specifications of the tools and instruments used, refer to Table 1.
Table 5. Tools for IEQ field measurements.
- Calibrate Instruments: Instruments with sensors should be calibrated before the field visit for sensor stabilization. The IAQ meter and RH sensors require additional time to set-up before they run, and therefore should be set up early in the field measurement process. These instruments may also require test-runs to ensure they are working efficiently. Efficiency of the tools can be further checked by identifying anomalies in the data collected. As suggested by manufacturers, all instruments should also undergo factory calibration at least once a year.
3.1.2. During Test Phase
- Test during occupancy: The evaluation of the building requires obtaining feedback from the end-users on the outcomes of the building design intents, and therefore evaluation should occur while it is occupied. The field tests should be conducted during normal school hours and when occupants utilizing the spaces being tested are present. However, certain IEQ variables such as radiant temperature and interior spatial quality may be measured in unoccupied spaces because they are minimally influenced by active human factors and behavior. In addition, spaces with minimal activity such as hallways tend to be unoccupied during testing, this was shown to have minimal impact on results. However, in order to have a robust measurement, occupant satisfaction within the space based on these variables should also be evaluated.
- Measurement Time: A priority of conducting IEQ field measurements in schools is performing the measurements with minimal disruption to students and teachers in the classrooms. Based on over 1700 tests and measurements throughout the course of the longitudinal study and ongoing measurements from other CBPD POE+M studies, optimal times for each process were determined. These times are ideal for performing each measurement and serve as guidelines for overall assessment of school facilities. However, these times may differ depending on crew size and size of spaces that are being measured. Figure 7 illustrates the time that should be allocated for preparation, measurement, and data entry. Using an average team of four, 3–5 min can be spent on preparation and spot measurements can be performed within 5–10 min, depending on the task. The NEAT cart takes on average 10 min to load up and calibrate, and other tasks such as measuring visual quality variables can be executed within this load time.
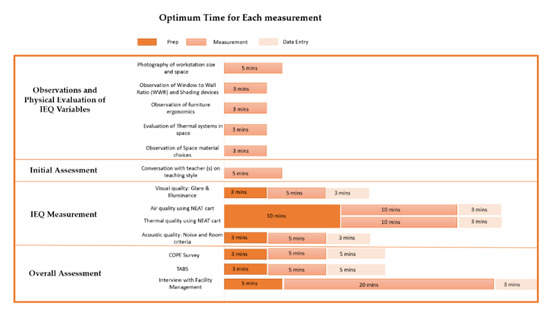 Figure 7. Optimum time for school post occupancy field measurements.
 - NEAT field test: The NEAT field test comprises of both spot and continuous measurements.
- NEAT Spot measurements: Spot measurements are short-term measurements of IEQ variables. Spot measurements take on average 20 min to perform (Figure 7). In classrooms, a teacher’s desk is considered one spot measurement and the number of teachers in a classroom should help dictate the number of spots to measure. Classroom surveys are primarily completed by the teachers; hence, it is necessary to take spot measurements at the teachers’ desks in order to get the best depiction of air quality within the room. However, regarding visual quality, the student spot measurements at student’s desks will properly depict the conditions of glare and illumination within the classroom. This is because students who are facing the whiteboards or projector screen are more impacted by glare.
- Continuous measurements: Continuous measurements involve calibrating and leaving the tools in a room/space over 24 hours to record data. Continuous measurements, though rare, may occur in situations where anomalies were detected after a spot measurement was performed. It may also be beneficial to perform a continuous in response to further investigation of IEQ results. This is usually performed at locations such as a kitchen or cafeteria, where fluctuations in IAQ measurement numbers could occur, because activities and number of occupants change throughout the day. Furthermore, CO needs to be monitored especially at cafeteria or locations close to kitchens.
- Cost-effective Open Plan Environments: Evaluators may not have access to COPE or may find that the COPE questions do not suit their context. Evaluators are advised to develop questions to fit their goals using COPE [28] as a guide or template. Illustrations can be utilized to increase comprehension of questions and can be requested as a means for occupants to respond to questions as shown in Figure 8.
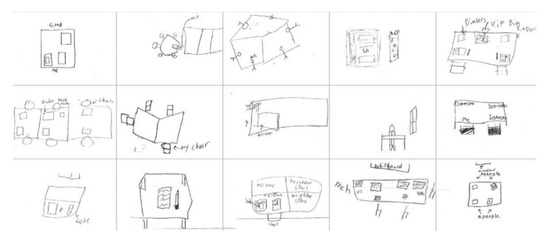 Figure 8. Hand-drawn responses by young students in response to the question: Draw a picture of what your desk usually looks like. Are you next to a window, is your neighbor close by, do you have anything that stays on your desk? [48]
 - Technical Attributes of Building System: All indoor environmental quality variables are considered in TABS [28]. In POE studies, evaluators fail to collect information about building systems, which adds to understanding of the occupants’ perception of their indoor environment. This information, in addition to COPE and NEAT measurements, is used to enhance the richness of the POE. TABS measures spatial features such as the location of the classroom and the type of room it is, i.e., gymnasium, classroom, etc. TABS also measure the types of building systems used in the facility, i.e., HVAC, mechanical, lighting, furniture, and furnishings. The TABS worksheets help record baseline physical attributes or quality differences of systems and/or spaces at each floor or zone. There are two worksheets that were designed by the CBPD, i.e., TABS for workstation (1 page) and TABS for at the floor level (four pages). TABS for workstation is used for recording the presence and condition of systems and appliances in relevant workstations. These systems and appliances are within four areas. There is an extensive list of systems, attributes, or items that could contribute to IEQ inefficiencies included in the worksheet. Listed below are a few of these systems within each area.
- Thermal/IAQ stressors: The list includes a fan, heater, laser printer, cleaning fluid;
- Visual/Light stressors: The list includes plants, artifacts, direct glare, and covered windows;
- Acoustical stressors: The list includes headphones, printer, noisy-co-worker, and noisy open meeting area;
- Spatial stressors: The list includes ergo keyboard, ergo chair, backrest, and old computer.
- Interview with facility manager: Questions related to building maintenance, building system attributes, and energy performance within the building should be directed to facility management team via an interview process. The interview should address history of the building and its systems, and query maintenance schedules, IAQ management plans, and information on malfunctioning systems.
- Question anomalies on site: Observations and preliminary analysis can draw concern to anomalies during measurement. Findings from the field measurements revealed anomalies for indicators of at least one IEQ variable at each of the schools evaluated. Anomalies are concluded when measurements are out of range per IEQ standards from ASHRAE, OSHA, NIOSH, NAAQS, EPA, and IESNA. This should lead to discussions with staff and administration, as it could indicate further concerning issues or draw correlations to data.
3.1.3. Post-Test Phase
- Analyze data for results: Each workstation measured on site is given a unique space ID. This space ID is linked to its individual thermal, air, visual, acoustic, and spatial quality survey data gotten from the field measurements. At the end of the measurements, there should be user satisfaction variables, building system variables, and IEQ measurement variables analyzed in a statistical program such as MySQL or excel.
- Provide Report: A report is the end-product of the data collection from site and the analysis of the results. The report should include results from the analysis of IEQ variables from the quantitative assessment and the correlation to qualitative assessment of each IEQ variable. There should also be a link to results from building systems attributes. The report should also include feasible suggestions for improvements with alternatives. It is necessary to provide this to the school facility department or school administration, in order to inform retrofits, maintenance, or stakeholder briefing.
4. Discussion
Findings from POE+M of the eight schools have shown that school administrations are able to find complications they did not know existed. POE+M provides in depth investigation of IEQ variables and provides directions on modifications and improvements, which would otherwise be difficult. For example, the existence of IEQ and energy efficiency problems in school buildings can be inferred without measurements if certain conditions exist. Foul smells, glare, and loud equipment that distract occupants indicate that there are problems with air, light, and noise quality within a space, and those variables should be investigated. However, other indicators such as CO2 and air temperature may be difficult to ascertain. High levels of CO2 present in a room is difficult to determine because CO2 is odorless.
In addition, identifying the best temperature range in schools with K-12 students can be challenging as there is a wide variation in the age of students and a significant difference in metabolic rates. However, performing field measurements in many spots and at different locations will determine temperature variations in the space. This can guide optimal temperature ranges for classrooms per age groups. It is also difficult to determine the presence and location of air leakages in the building envelope without POE+M. Locating air leakages in the building envelope can lead to retrofit actions including upgrading window layers and roofing to improve air tightness.
Lighting has also remained a critical issue in the design of buildings for centuries, which is evident from the inclusion of daylighting in ancient architecture. Different configurations of illumination including daylight can be used to stimulate productivity and creativity among students in schools [49]. Poor or inappropriate lighting can affect students’ health and performance as shown during the longitudinal studies. The robust observations, occupancy evaluation, and measurements helped provide in-depth insight to facility managers on IEQ problems.
Factors that contributed to effectiveness of the POE+M process in schools in the study included observations, workplan and field measurement manual, time mapping, and conversations with facility managers. Findings from conducting field measurements revealed that observations made at the beginning of the field measurements closely reflected data results. Observations are key to highlighting anomalies in data collection, supporting assessments at the early phase of field testing, and directing the selection of spot measurements. Locations for spot measurements can also be directed by observing air and thermal quality indicators such as the presence of dehumidifiers. Indicators of three IEQ variables can be easily observed; these variables include acoustics, thermal, and visual quality. For example, the presence of shading devices in a room can be determined by simple observation. This finding can direct the specificity of lighting and visual variables because the absence of shading devices indicates the presence of glare. This is also evident if there is no shading device, but there have been efforts made to block out the sun with makeshift items such as papers taped to windows.
Preliminary conclusions can also be made about the acoustics in the room by looking at the material choices for floor, ceiling, and wall surfaces, such as carpeting and tiling for the floors, and acoustical ceiling tiles (ACT) for the ceilings. Observations on school activities and background sounds can also support preliminary conclusions. In school E measurements in 2012, non-classrooms including corridors and other common areas displayed smaller deviation from the recommended NC limits of 35–40 (Figure 9a) compared to that of the classrooms (Figure 9b).
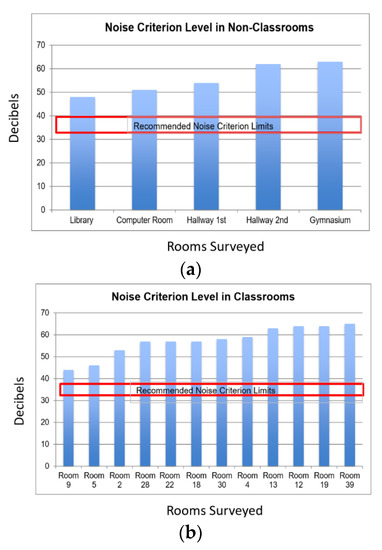
Figure 9.
(a) Noise criterion levels in non-classrooms [50]. (b) noise criterion levels in classrooms [50].
Although the variance for the non-classrooms were lower, all the non-classroom spaces displayed much higher NC levels than recommended. This indicated that there was a pervasive issue with noise control in all spaces. The spaces with highest NC levels for non-classrooms were the gymnasium and second floor hallway. Two of the four walls in the gymnasium were external walls, which contributed to the background noises. Observations made prior to measurements highlighted that teachers were often found to be raising their voices to control the students, in some cases being very emotionally charged. This may be due to the high level of background noise as indicated in the field measurements, but also the inefficiency in the acoustical conditions to control student behavior.
Another important factor that pertains to increased POE+M efficiency is information. Collecting relevant, detailed, and extensive information on the building systems’ attributes and history will help fill gaps during analysis and clarify trends or explain preliminary results during field measurements. In addition, the combination of observation and the facility management interview would lead to optimum data collection.
Lastly, the POE process can also be effectively implemented when a workplan is prepared prior to the start of a field measurement. In a bid to stay closely within these optimum times, advance workflow preparation and even a mock field test are strongly advised. It is expected that errors may occur during the field measurements, such as recalibration of tools, thus advance preparation will help to keep the process brief. Having a team of at least four members also aids in time efficiency during the field tests. During the study, a four-person team mapped out their workflow allocating ten minutes to each measurement and planned to perform 10 measures in 110 min. The team spent an additional 25 min setting up the instruments at the various points of each location, and 10 more minutes on travel time.
Another factor that could cause time inefficiencies is instrument sharing. Some field team members noted that in measuring larger schools, waiting on instruments put them significantly behind their planned times and increased the duration of their measurement. Thus, for evaluation with larger teams, more instruments would be required for each team to successfully conduct their evaluation simultaneously. The instruments used with this study were part of the NEAT cart, however interested evaluators can use any tool with the same purpose (see Table 1) for their school measurements. Furthermore, COPE and TABS shown in [28] were also specifically used in this study, however evaluators can design their own occupant surveys and building attribute worksheets using the guidelines in the protocol.
The protocol for evaluating and measuring IEQ metrics within schools needs to be constantly updated, as guidelines and standards for IEQ keep changing based on new research. Areas of the protocol such as occupant satisfaction surveys and techniques for data collection need constant refining to increase clarity and efficiency in user adoption. Future work includes testing out the applicability of automated user satisfaction surveys in a school context in terms of the user friendliness, and the impact of automation on data collection and analysis. It also includes targeting more schools in urban, peri-urban, and rural locations to evaluate and measure in a bid to develop a more varied protocol.
5. Conclusions
Setting priorities for repairs and upgrades can often be complex. It is important for school management to maintain good communication and build consensus amongst priority stakeholders before utilizing school resources. Occupancy evaluation and site measurement data can help stakeholders’ decision-making on resource allocation.
The goal of this research was to develop and design a protocol to support POE+M of critical indoor environmental quality variables in school facilities. POE+M are important for facility managers and school administrations to identify which variables have direct or indirect impact on the occupants’ perceived satisfaction regarding the air, spatial, thermal, visual, and acoustic qualities; all of which are valuable in student learning. Important recommendations came from POE+M at these schools, many of which included consultations with mechanical and electrical experts. For example, improving IAQ recommendations included using source control, filtration, and ventilation to dilute contaminants.
There has not been a clear universal protocol for POE, especially in school facilities, but this paper provides a clearer picture on the process for data collection, analysis, and reporting of post occupancy IEQ metrics in schools. Results of post occupancy evaluation and measurements can help tackle the cost and budget challenges school administrations currently face and provide the many benefits of POE in design, management, and benchmarking of school buildings.
Through the study of these eight schools, it has been determined that post occupancy evaluation can be performed at schools using tools and techniques for data collection that can be easily replicated. The three-step protocol of pretest, testing, and post-test will help source valuable data from the field, support analysis, and provide reports that will serve as first steps towards building upgrades and facility management.
Author Contributions
Conceptualization, E.C.H.; data curation, E.C.H. and B.K.-O.; investigation, E.C.H.; methodology, E.C.H. and B.K.-O.; project administration, E.C.H.; resources, E.C.H. and Y.J.S.; supervision, E.C.H.; validation, E.C.H. and Y.J.S.; visualization, E.C.H. and B.K.-O.; writing—original draft, B.K.-O.; writing—review and editing, E.C.H., B.K.-O., and Y.J.S. All authors have read and agreed to the published version of the manuscript.
Funding
This research received no external funding.
Acknowledgments
The authors would like to thank Vivian Loftness and Azizan Abdul-Aziz, Professors at the Center for Building Performance and Diagnostics in the School of Architecture at Carnegie Mellon University, for their work on NEAT and Post Occupancy Evaluation protocol for offices. The authors would also like to thank Waku Ken-Opurum for supporting the review and edit of the paper; and Ashwini Arun, Coral Pais, and a host of students in the Fall 2018 and Fall 2019 Indoor Environmental Quality course at Carnegie Mellon University, who supported data acquisition, processing, analysis, and reporting.
Conflicts of Interest
The authors declare no conflict of interest.
References
- National Center for Education Statistics. State Education Reforms (SER). 2018. Available online: https://nces.ed.gov/programs/statereform/tab5_14.asp (accessed on 8 July 2019).
- How Old Are America’s Public Schools? 1999. Available online: https://nces.ed.gov/pubs99/1999048.pdf (accessed on 14 January 1999).
- Earthman, G.I. School Facility Conditions and Student Academic Achievement; UCLA/IDEA Publication Series Document wws-rr008-1002; Virginia Polytechnic Institute and State University: Blacksburg, VA, USA, 2002. [Google Scholar]
- DIANE Publishing. Americas Children and the Environment: Measures of Contaminants, Body Burdens, and Illnesses; DIANE Publishing: Collingdale, PA, USA, 2004; p. 104. [Google Scholar]
- Council of the Great City Schools. Reversing the Cycle of Deterioration in the Nation’s Public School Buildings. Reversing the Cycle of Deterioration in the Nation’s Public School Buildings; Council of the Great City Schools: Washington, DC, USA, 2014; pp. 1–78. Available online: https://www.cgcs.org/cms/lib/DC00001581/Centricity/Domain/87/FacilitiesReport2014.pdf (accessed on 20 April 2020).
- Environmental Protection Agency. Why Indoor Air Quality is Important to Schools; EPA: Washington, DC, USA. Available online: https://www.epa.gov/iaq-schools/why-indoor-air-quality-important-schools (accessed on 25 October 2018).
- Crawford, G.N. Going straight to the source. Am. Sch. Univ. 1998, 70, 26–28. [Google Scholar]
- Asthma Statistics: AAAAI. Available online: https://www.aaaai.org/about-aaaai/newsroom/asthma-statistics (accessed on 20 April 2020).
- American Lung Association. Asthma and Children Fact Sheet. Available online: https://www.lung.org/lung-health-and-diseases/lung-disease-lookup/asthma/learn-about-asthma/asthma-children-facts-sheet.html (accessed on 23 May 2018).
- U.S. Environmental Protection Agency. Asthma Facts. 2018. Available online: https://www.epa.gov/sites/production/files/2018-05/documents/asthma_fact_sheet_0.pdf (accessed on 20 April 2020).
- Matsui, E.C.; Abramson, S.L.; Sandel, M.T. Indoor Environmental Control Practices and Asthma Management. Pediatrics 2016, 138. [Google Scholar] [CrossRef] [PubMed]
- Golden, R.; Holm, S. Indoor Air Quality and Asthma. Dose-Response 2017, 1–9. [Google Scholar] [CrossRef] [PubMed]
- Breysse, P.N.; Diette, G.B.; Matsui, E.C.; Butz, A.M.; Hansei, N.N.; McCormack, M.C. Indoor Air Pollution and Asthma in Children. Am. Thorac. Soc. 2010, 7, 102–106. [Google Scholar] [CrossRef] [PubMed]
- Cochran, E. The Impact of School Building Occupancy, Facility Characteristics and Neighborhood Attributes on Student Academic Performance and Health Outcomes. Ph.D. Thesis, Carnegie Mellon University, Pittsburgh, PA, USA, 2014. [Google Scholar]
- Shendell, D.; Prill, R.; Fisk, W.; Apte, M.; Blake, D.; Faulkner, D. Associations between classroom CO2 concentrations and student attendance in Washington and Idaho. IndoorAir 2004, 14, 333–341. [Google Scholar] [CrossRef] [PubMed]
- Heschong Mahone Group, Inc. Daylighting in schools-PG&E. Retrieved September 2008, from An Investigation into the Relationship between Daylighting and Human Performance. 1999. Available online: http://www.h-m-g.com/projects/daylighting/summaries%20on%20daylighting.htm#Daylighting%20in%20Schools%20–%20PG&E%201999 (accessed on 1 September 2008).
- Heschong Mahone Group, Inc. Windows and Classrooms: A Study of Student Performance and the Indoor Environment; P500-03-082-A-7; California Energy Commission: Fair Oaks, CA, USA, 2003.
- American National Standard: Acoustical Performance Criteria, Design Requirements, and Guidelines for Schools. Available online: http://citeseerx.ist.psu.edu/viewdoc/download?doi=10.1.1.196.5704&rep=rep1&type=pdf (accessed on 16 March 2020).
- Wolfram, E.P. The Classroom Acoustical Environment is Critical to Student Learning and Academic Performance; Scott R. Riedel & Associates, Ltd.-Consultation, Design and Technical Services for Acoustics, Architecture, Organs and Sound Systems. Available online: http://www.riedelassociates.com/classroomacousticalenvironment.htm (accessed on 6 March 2020).
- Angelon-Gaetz, K.A.; Richardson, D.B.; Marshall, S.W.; Hernandez, M.L. Exploration of the effects of classroom humidity levels on teachers’ respiratory symptoms. Int. Arch. Occup. Environ. Health 2016, 89, 729–737. [Google Scholar] [CrossRef] [PubMed]
- Cochran Hameen, E.; Ken-Opurum, B.; Priyadarshini, S.; Lartigue, B.; Pisipati, S. Effects of School Facilities Mechanical and Plumbing Characteristics and Conditions on Student Attendance, Academic Performance and Health. Int. Conf. Green Build. 2020. Available online: https://www.researchgate.net/publication/338698507_Effects_of_School_Facilities_Mechanical_and_Plumbing_Characteristics_and_Conditions_on_Student_Attendance_Academic_Performance_and_Health (accessed on 6 March 2020).
- CBECS U.S Energy Information Administration. Retrieved February 2011, from Commercial Buildings Energy Consumption Survey. 2003. Available online: http://www.eia.gov/emeu/cbecs/ (accessed on 18 April 2020).
- U.S. Energy Information Administration-EIA-Independent Statistics and Analysis. Available online: https://www.eia.gov/consumption/commercial/reports/2012/lighting/ (accessed on 22 November 2019).
- United States Department of Energy. Quadrennial Technology Review: An Assessment of Energy Technologies and Research opportunities. Quadrennial Technology Review: An Assessment of Energy Technologies and Research Opportunities (pp. 143–181). Available online: https://www.energy.gov/sites/prod/files/2017/03/f34/qtr-2015-chapter5.pdf (accessed on 6 December 2017).
- Energy Star. Enhancingthevalueofschoolprojectswithenergystarqualifiedproducts. Retrieved April 2014, from EPA Energy Star. Available online: http://www.epa.gov/statelocalclimate/documents/pdf/arra_schools.pdf (accessed on 1 September 2010).
- Leachman, M.; Albares, N.; Masterson, K.; Wallace, M. Most States Have Cut School Funding, and Some Continue Cutting. Available online: https://www.cbpp.org/research/state-budget-and-tax/most-states-have-cut-school-funding-and-some-continue-cutting (accessed on 6 December 2017).
- Preiser, W. Learning from Our Buildings: A State-of-the-Practice Summary of Post-Occupancy Evaluation; National Academy Press: Washington, DC, USA, 2001; p. 1. [Google Scholar]
- Park, J.; Loftness, V.; Aziz, A. Post-Occupancy Evaluation and IEQ Measurements from 64 Office Buildings: Critical Factors and Thresholds for User Satisfaction on Thermal Quality. Buildings 2020, 8, 156. [Google Scholar] [CrossRef]
- Mendell, M.J.; Fisk, W.J.; Kreiss, K.; Levin, H.; Alexander, D.; Cain, W.S.; Milton, D.K. Improving the health of workers in indoor environments: Priority research needs for a national occupational research agenda. J. Inf. 2002, 92, 1430–1440. [Google Scholar] [CrossRef] [PubMed]
- Loftness, V.; Aziz, A.; Hartkopf, V.; Lam, K.P.; Lasternas, B. Humans and Nature in the Loop: Integrating occupants & natural conditioning into advanced controls for high performance buildings. Healthy Intell. Resilient Build. Urban Environ. 2018. [Google Scholar] [CrossRef]
- Stazi, F.; Naspi, F.; Bernardini, G.; D’Orazio, M. Comparing real and predicted window use in offices. A POE-based assessment. Energy Procedia 2017, 134, 141–150. [Google Scholar] [CrossRef]
- Baker, L. What School Buildings Can Teach Us: Post-Occupancy Evaluation Surveys in K-12 Learning Environments. Center Built Environ. 2011, 1–19. Available online: https://doi.org/https://pdfs.semanticscholar.org/7872/90d9b5919bee11c4bd02394bfe124b56550b.pdf?_ga=2.263367820.1481254183.1585972596-112854364.1556510428 (accessed on 18 April 2020).
- Nkpite, B.-E.S.; Wokekoro, E. Post Occupancy Evaluation of Rivers State Government Model Primary Schools. Int. J. Soc. Sci. Humanit. Invent. 2017, 4. [Google Scholar] [CrossRef]
- Soccio, P. A New Post Occupancy Evaluation Tool for Assessing the Indoor Environment Quality of Learning Environments. Eval. Learn. Environ. 2016, 195–210. [Google Scholar] [CrossRef]
- Acton, R.; Riddle, M.; Sellers, W. A Review of Post-Occupancy Evaluation Tools. School Space Occupation. 2018. [Google Scholar] [CrossRef]
- Cleveland, B.; Fisher, K. The evaluation of physical learning environments: A critical review of the literature. Learn. Environ. Res. 2013, 17, 1–28. [Google Scholar] [CrossRef]
- Oblinger, D.; Hunley, S.; Schaller, M. Chapter 13. Assessing Learning Spaces. In Learning Spaces; Essay, EDUCAUSE: Boulder, CO, USA, 2006. [Google Scholar]
- Wheeler, A.; Malekzadeh, M. Exploring the use of new school buildings through post-occupancy evaluation and participatory action research. Archit. Eng. Des. Manag. 2015, 11, 440–456. [Google Scholar] [CrossRef]
- Marley, J.; Nobe, M.C.; Clevenger, C.M.; Banning, J.H. Participatory Post-Occupancy Evaluation (PPOE): A Method to Include Students in Evaluating Health-Promoting Attributes of a Green School. Child. Youth Environ. 2015, 25, 4. [Google Scholar] [CrossRef]
- Aziz, A.; Park, J.; Loftness, V.; Cochran, E. Field measurement Protocols for Evaluating Indoor Environmental Quality and User Satisfaction in Relation to Energy Efficiency U.S. DOE; The Energy Efficient Buildings Hub, Department of Energy: Washington, DC, USA, 2012.
- Guyer, J.P. An Introduction to Noise Control in Buildings; Continuing Education and Development: Stony Point, NY, USA, 2009. [Google Scholar]
- IESNA. Lighting Handbook, 10th ed.; Illuminating Engineering Society of North America: New York, NY, USA, 2011. [Google Scholar]
- USDA FSIS. FSIS Environmental, Safety and Health Group. Available online: https://www.fsis.usda.gov/wps/wcm/connect/bf97edac-77be-4442-aea4-9d2615f376e0/Carbon-Dioxide.pdf?MOD=AJPERES (accessed on 10 April 2020).
- Carbon Monoxide’s Impact on Indoor Air Quality. Available online: https://www.epa.gov/indoor-air-quality-iaq/carbon-monoxides-impact-indoor-air-quality (accessed on 25 October 2018).
- Heudorf, U.; Neitzert, V.; Spark, J. Particulate matter and carbon dioxide in classrooms–the impact of cleaning and ventilation. Int. J. Hyg. Environ. Health 2009, 212, 45–55. [Google Scholar] [CrossRef] [PubMed]
- Guo, H.; Morawska, L.; He, C.; Gilbert, D. Impact of ventilation scenario on air exchange rates and on indoor particle number concentrations in an air-conditioned classroom. Atmos. Environ. 2018, 42, 757–768. [Google Scholar] [CrossRef]
- Khushalani, J.; Balasubramanian, S.; Mody, R.; Saxena, U.; Walsh, P. Indoor Environmental Quality and Energy Assessment Report. In 48768—Indoor Environmental Quality (IEQ) Energy, Health and Productivity; Carnegie Mellon University: Pittsburgh, PA, USA, 2019. [Google Scholar]
- Yezioro, A.; Postnikov, N.; Mayorga, A.; Guturu, M. Indoor Environmental Quality and Energy Assessment Report. In 48768—Indoor Environmental Quality (IEQ) Energy, Health and Productivity; Carnegie Mellon University: Pittsburgh, PA, USA, 2019. [Google Scholar]
- Ruck, N.C. Building Design and Human Performance. 1989. Available online: https://www.osti.gov/biblio/7157413-building-design-human-performance (accessed on 10 April 2020).
- Cosgro, T.; Kothari, R.; Magnuson, K.; Nam, J.; Shiau, D. Indoor Environmental Quality and Energy Assessment Report. In 48768—Indoor Environmental Quality (IEQ) Energy, Health and Productivity; Carnegie Mellon University: Pittsburgh, PA, USA, 2012. [Google Scholar]


© 2020 by the authors. Licensee MDPI, Basel, Switzerland. This article is an open access article distributed under the terms and conditions of the Creative Commons Attribution (CC BY) license (http://creativecommons.org/licenses/by/4.0/).