Article

Dynamic Energy Performance Gap Analysis of a University Building: Case Studies at UAE University Campus, UAE

1
Department of Architectural Engineering, United Arab Emirates University, Al Ain 15551, UAE
2
Department of Architecture, Faculty of Design, Arkin University of Creative Arts and Design, Kyrenia 99300, Cyprus
*
Author to whom correspondence should be addressed.
Sustainability 2021, 13(1), 120; https://doi.org/10.3390/su13010120
Submission received: 1 December 2020 / Revised: 22 December 2020 / Accepted: 22 December 2020 / Published: 24 December 2020
(This article belongs to the Special Issue ZEMCH International Research 2020)

Abstract

:
As a result of an increasing demand for energy-efficient buildings with a better experience of user comfort, the built environment sector needs to consider the prediction of building energy performance, which during the design phase, is achieved when a building is handed over and used. There is, however, significant evidence that shows that buildings do not perform as anticipated. This discrepancy is commonly described as the ‘energy performance gap’. Building energy audit and post occupancy evaluation (POE) are among the most efficient processes to identify and reduce the energy performance gap and improve indoor environmental quality by observing, monitoring, and the documentation of in-use buildings’ operating performance. In this study, a case study of UAE university buildings’ energy audit, POE, and dynamic simulation were carried out to first, identify factors of the dynamic energy performance gap, and then to identify the utility of the strategy for reducing the gap. Furthermore, the building energy audit data and POE were applied in order to validate and calibrate a dynamic simulation model. This research demonstrated that the case study building’s systems were not operating as designed and almost a quarter of the cooling energy was wasted due to the fault of the building facility management of the mechanical systems. The more research findings were discussed in the paper.

1. Introduction

More than a third of global energy consumption and CO2 emission are associated with the building sector [1]; and awareness of the importance of buildings’ energy performance related with CO2 emissions has increased worldwide. The International Energy Agency (IEA) describes energy efficiency as the “first fuel” [2] and may be more important than any energy-generating technologies. Furthermore, Cullen et al. stated that one of the greatest potentials for improving energy efficiency and reducing CO2 emission lies in the building sector [3]. However, as the demand for buildings has become increasingly complex, with design criteria such as multi-purpose plans, larger sizes and higher standards for services and user comfort in terms of Heating, Ventilation, Air Conditioning (HVAC), lighting, acoustic, and data processing [4], the analysis and evaluation of the energy performance of buildings have become more intricate than ever before. With the introduction of the first building regulations in the 1970s, energy conservation in general and later the interest in building energy consumption and its energy efficiency have increased multifold into the late 1990s and 2000s [5]. This strong interest and necessity have led to the development of a wide range of methodologies for predicting, analyzing, evaluating, and validating the energy performance of buildings. To date, numerous studies have shown that while in use, buildings usually do not perform as predicted [6,7,8,9,10,11,12,13]. This discrepancy is referred to as the ‘Energy Performance Gap’ and is typically demonstrated through an energy audit exercise. This is even more critical, given the global call to reach Zero Energy Buildings, i.e., a building that combines passive building designs and highly energy efficient systems to minimize the heating, cooling, ventilation, lighting and electricity demand and consumption with on-site energy generation system, such as PVs, combined heat and power (CHP), wind turbines to recover the energy demand and consumption from the building to achieve the energy balance [14]. Regardless of how energy-efficient a building is designed to be and an efficient system being applied, zero energy buildings cannot be achieved if there is an energy performance that is different from the plan in the operation stage of the building, which further heightens the need to underhand the reason behind the energy performance gap in order to better control it.
The main purpose of an energy audit is to identify opportunities to improve the energy efficiency of a building and it typically takes a whole building assessment approach from building envelope to mechanical systems, operations and maintenance, and building schedules. Therefore, wholesale building audits provide the most accurate picture of existing conditions as well as an understanding of energy savings’ opportunities in buildings. The American Society of Heating, Refrigerating and Air-Conditioning Engineers (ASHRAE) defines three levels of audit to assess the building inside and out. They are: Level 1: Site assessment or preliminary audits, Level 2: Energy survey and engineering analysis audits, and Level 3: Detailed analysis of capital-intensive modification audits [15]. The aim of post occupancy evaluation (POE) is to assess the performance of a building after it is occupied and to address any performance and energy gap issues. It will also help the designers with valuable feedback on its actual performance as opposed to its assumed one and to improve the building mechanical design process. Moreover, by using the POE study data to predict the energy performance of the in-use building, it will help calibrate a building energy model to actual operating conditions [11]. Detailed dynamic simulation models (DSMs) are able to obtain more accurate predictions of energy performance/consumption in buildings. The DSMs are more often used in the study of commercial buildings’ performance because they allow the collection of extensive input data, and a database for materials and systems [16]. Nonetheless, it must be recognized that despite these attributes and many other additional features, there are still significant differences between the expected and actual energy consumption of non-domestic buildings.
In this case study, a university building’s energy audit and a POE assessment were carried out. The results were analyzed to identify the underlying factors of the energy performance gap. In addition, the energy audit data and POE analysis were used to calibrate and validate a dynamic simulation model. Finally, a gap reduction achievement after the energy audit and POE analysis was evaluated using a dynamic simulation. Through this research, it shows, first, that the energy audit is an effective way to identify the underlying causes of the dynamic energy performance gap, and second, that the POE is able to produce more accurate dynamic energy simulation models with an indication for the potential increase in the indoor environmental quality, especially users’ thermal comfort. The research findings will be implemented to reduce the energy consumption while improving user comfort for case study building under study as well as in other university buildings.

2. The Energy Performance Gap

2.1. The Energy Performance Gap Review Status

A number of studies show that in-use buildings do not necessarily perform as designed [6,7,8,9,10,11,12,13]. Findings from the PROBE studies (post occupancy review of buildings and their engineering) addressed that actual energy consumption when in-use could be twice as much as predicted [9]. Low Carbon Building Programme and Carbon Trust’s Low Building Accelerator have studied that in-use energy consumption could be up to five times higher than prediction [11].
Figure 1 shows that the energy performance gaps in between prediction and actual electricity consumption in three building sectors in the UK: schools, general offices and university buildings. The value of energy consumption was averaged for each sector. As it can be seen in Figure 1, the actual electricity consumption could be 60–70% higher than predicted in schools and general offices, and even over 85% higher in university campuses [17]. Another study by Chris et al. [18] is summarized in Table 1, which gathered the reported case studies of the discrepancies in the energy usage in different types of buildings which are located in different climates, different building types with an average performance gap between the predicted and actual energy consumption. It also confirms that gaps between the design/prediction and actual buildings energy consumption have become a matter of fact.
Again, Figure 1 and Table 1 show the energy performance gap average from different studies and building types. In order to satisfy Zero Energy Building/Net Zero Energy Building (ZEB/NZEB), it seems really important to reduce the energy performance gap that occurs in the actual operation of the building. Without reducing this gap, well planned buildings to reduce energy consumption and renewable energy technologies planned to cover the reduced energy would be meaningless. Therefore, reducing the gap between the design/prediction and actual buildings’ energy consumption needs to be considered.

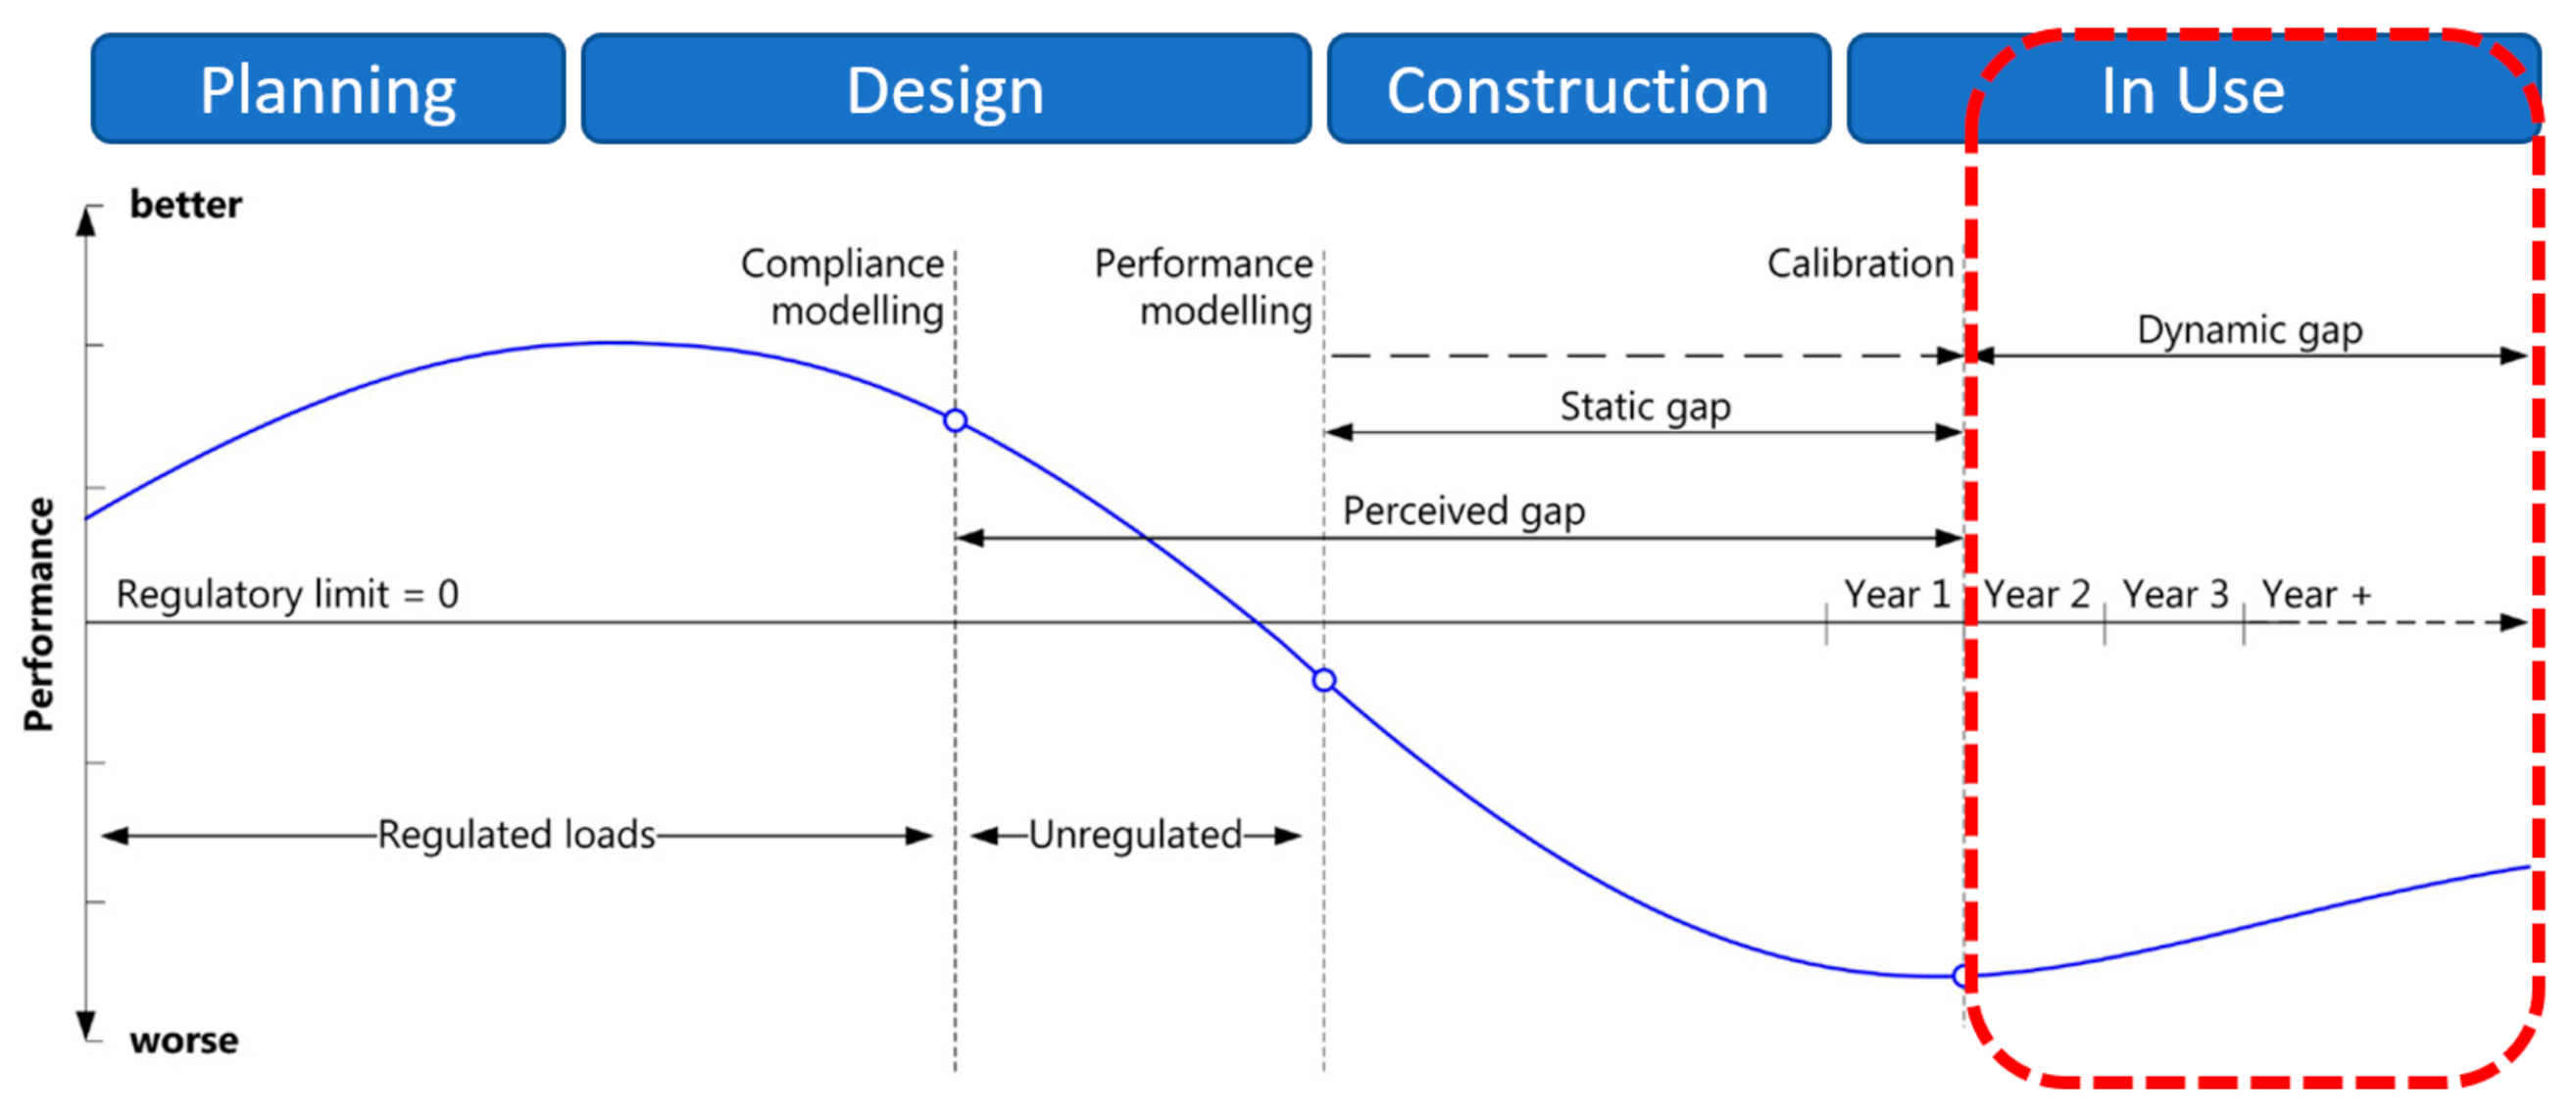
2.2. Classification of the Gap

Figure 2 shows an overview of the common root causes of performance discrepancies that exist at each stage of a building’s life cycle. Based on the S-curve visualization of a building performance proposed by Bunn and Burman [19], the performance gap can be classified in three categories: ‘Perceived gap’, ‘Static gap’, and ‘Dynamic gap’ [18]:
  • Perceived gap: compares predictions from compliance modeling to performance modeling energy consumption;
  • Static gap: compares predictions from performance modeling to measured energy use; and
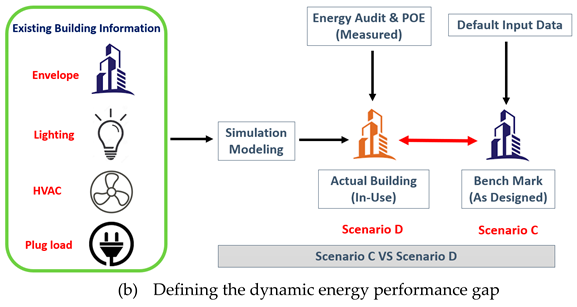
  • Dynamic performance gap: utilizes calibrated predictions from performance modeling with measured energy use taking a longitudinal perspective to diagnose underlying issues and their impact on the performance gap.
These classifications can help identify the underlying causes of the energy performance gaps throughout the life cycle of a building and highlights specifically in each phase of the building’s life the potential needs to reduce the performance gaps. In this research, the ‘Dynamic performance gap’ has been adopted to identify the underlying cause of the gaps as described below.

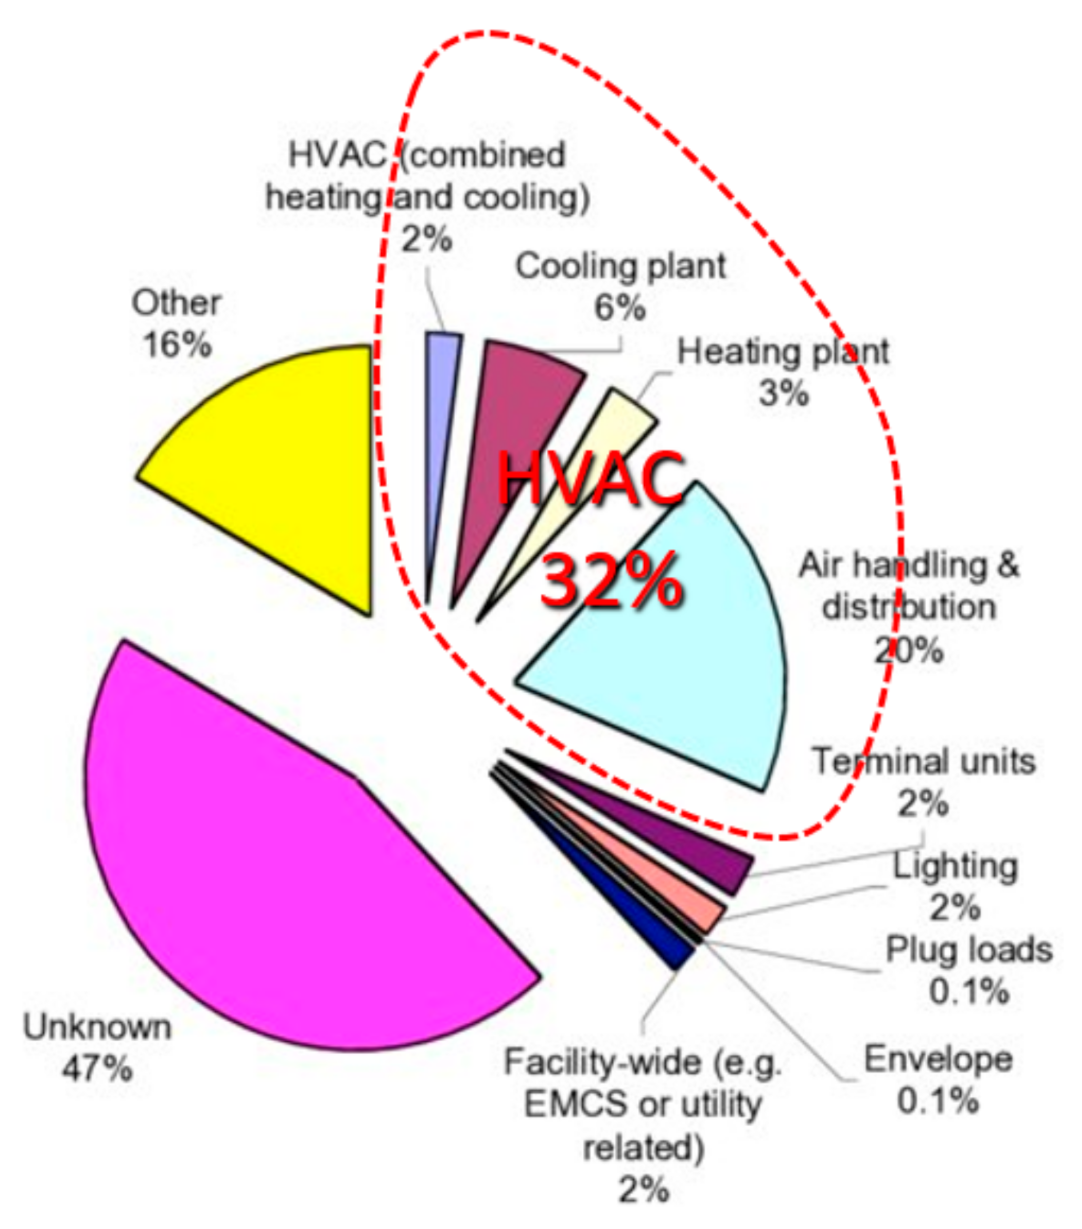
2.3. Sources of the Daymic Performance Gap

The dynamic performance gap between the predicted and actual energy performance in buildings results from several causes. Causal factors for prediction and actual performance aside, the current predictions tend to be unrealistically low, while the actual energy performance is generally unnecessarily high. This can ultimately be associated with the lack of feedback for the actual use and operation of the building and its associated energy consumption. Currently, there is a great lack of information on the actual energy performance of existing building sectors [20]. Such a great lack of information leads to an increase in the gap between prediction and in-use, and an evident failure to achieve the reducing energy performance gaps in the built environment [21].
The study by the Lawrence Berkeley National Laboratory studied 85 commercial buildings in the US and listed over 3500 deficiencies from the case study buildings and 53% of them were related with the dynamic performance gap and 32% to the overall HVAC system (Figure 3) [22]. The most common deficiencies in the case study buildings were modifications of set-points, scheduling, control sequences, calibration, mechanical fixes and equipment replacements. This shows that operation and control, and management and maintenance, need focusing to reduce the dynamic performance gap during the in-use phase of life cycle of the buildings.

3. Materials and Methods

Taking a case study approach, this research analyzes the energy performance of a university building in the United Arab Emirates University (UAEU), located in Al Ain, UAE. As discussed earlier, this research was guided by ASHRAE Building Energy Audit Level 1 methodology, followed by POE monitoring study. Results from the energy audit and POE monitoring data were used to calibrate and validate the dynamic energy simulation model, aiming to produce more accurate predictions of energy consumption and finding the source of discrepancy of dynamic energy performance gap to reduce the gap with the objective to propose recommendations for an improved indoor environmental quality.

3.1. Case Study Building Description

The case study building is known as the ‘F1 Building’ (Figure 4) and is located in the male side campus of UAEU. The current building houses three colleges and 13 departments located in three wings of three floors each (e.g., College of Engineering, College of Science, and College of Food & Agriculture) with over 600 occupants and a total building area of 21,360 m².
It was planned and constructed as an energy efficient building and was completed in 2011. The building is fully air-conditioned by 13 rooftop Air Handling Units (AHUs) which provide cooling and fresh air to all floors and atrium. Variable Air Volume systems (VAVs) were part of the design strategy to save energy when the building is not fully occupied during weekends, holidays and vacations (Table 2).

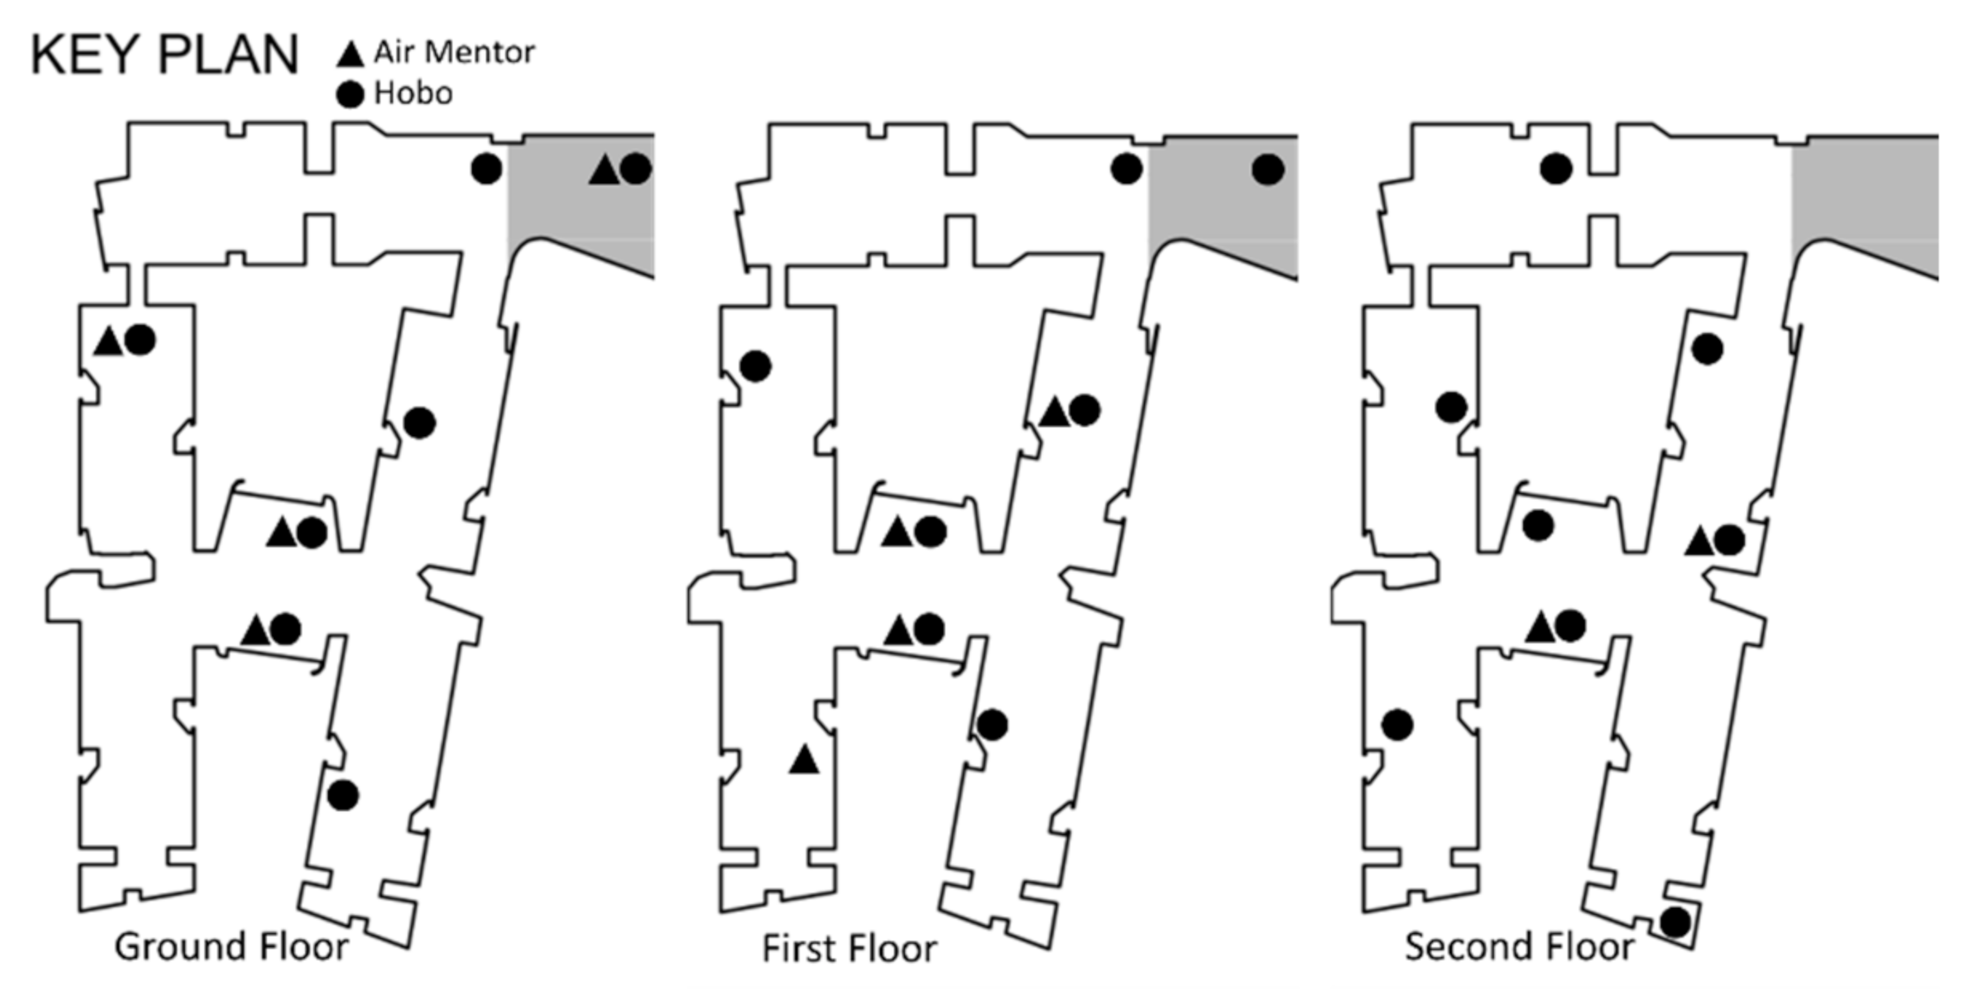
3.2. Energy Audit and POE Monitoring

ASHRAE Energy Audit Level 1, which is ‘Site Assessment or Preliminary Audits, was carried out to assess the case study building. Typically, energy audits take a whole building approach by examining the building envelope, building systems, operations and energy consumption, especially the electricity usage. The energy data were provided by the Facility Management department but only monitored total electricity consumption.
The monitoring of POE data was conducted for one calendar year from January to December 2019 via walkthrough inspections with hand-carrying devices to measure the Lux and noise level, and the fixed unit measuring data logger for measuring temperature, Relative Humidity (RH), noise (Db), lighting (lux), CO2, Particulate Matter (PM) 2.5, PM 10 and Total Volatile Organic Compounds (TVOCs) on every floor (Figure 5). Table 3 shows the details of the energy audit and POE study in this research. The energy audit data were used for making an accurate energy simulation model that reflects the actual state of the building, such as the building envelope information (U-value and construction details), HVAC systems, level of airtightness, and building operation and schedule, and it shows in Table 4. In the case of POE data, it was being used to implement the indoor environment of the actual building in the simulation model. Internal temperature, RH, and lighting data especially will be used to define the input data for the simulation model, such as set the indoor target temperature and lighting power density according to the operating schedule. Both the energy audit and POE were used for identifying the dynamic performance gap, management problems, and other aspects that may have negative impacts on indoor environmental quality.

3.3. Dynamic Energy Simulation

A dynamic simulation energy model was developed for the case study building based on the findings generated by the energy audit and POE study. The simulation model was calibrated with the actual performance including indoor environmental condition, HVAC operation, airtightness and lighting schedule. To define the energy performance gap in case study buildings, four different simulation models were developed and each of the models was named as the baseline model as based on ASHRAE Standard 90.1–2007, Abu Dhabi code, the as-designed model for prediction and in-use model for current building. Each model’s specifications and input data are shown in Table 4. The input data and building specifications for in-use model were based on the energy audit and POE data analysis results.
In this research, the dynamic performance gap due to the operation method of the building system and management was investigated. In order to investigate the dynamic energy performance gap, the Scenario C and D’s basic building external envelopes’ thermal performance, lighting power density, and HVAC system were modeled in the same way (Table 4). Basically, the energy consumption of the building due to changes in the operation method of the HVAC system from VAV to Constant Air Volume (CAV), with the internal temperature setting from 24 to 21 °C during occupied hours—with the operation schedule of the lighting equipment in the corridor and the remaining entrance doors open—was investigated. All these operational and managing changes were based on the energy audit and POE studies.
To perform the dynamic energy simulation, this study used the Trane TRACE 700 v 6.1 which was designed to simulate the building energy performance check, especially the detailed HVAC systems. The TRACE 700 complies with ASHRAE Standard 90.1–2007 and 2010 Appendix G for the performance rating method for Leadership in Energy and Environmental Design (LEED) analysis. The Trace 700 is validated by ASHRAE Standard 140–2011 and 2014 for using the dynamic simulation to study the energy consumption of whole building with a detailed energy consumption breakdown of HVAC systems and plants [23]. A computer model for dynamic energy simulation was created using REVIT 2017, which was converted to a gbXML file and imported into TRACE700. The computational model and the interface of TRACE 700 is shown in Figure 6.
In the case of the simulation model, it was largely divided into the conditioned zone and unconditioned zone. In the case of the conditioned zone, it was defined as the area cooled/conditioned by HVAC systems such as offices, corridors and stairs, storages and toilets. For the unconditioned zoned, it was defined as the area not conditioned by HVAC systems such as the emergency stairs and emergency exits in this paper. As can be seen in Figure 4 and Figure 5, the simulation study was considered as a whole building simulation. A baseline model was developed based on ASHRAE Standard 90.1–2007 Appendix G method and this baseline was used to evaluate the expected energy performance of the case study building in international standards. The American Society of Heating, Refrigerating and Air-Conditioning Engineers (ASHERAE) standard, which was in effect when the building was designed, was the latest version in 2007. Therefore, the ASHRAE version used to create the baseline in this study was 2007. The benchmark model is the ‘as-designed model’ which was not a calibrated model, by adapting the energy audit and POE data for calibration. After calibrating with the energy audit and POE data, which is the ‘in-use model’, it shows the actual building energy performance. To compare the ‘as-designed model’ against the ‘in-use model’, it is able to identify the dynamic performance gap in the case study building during the in-use life cycle phase (Table 5).

4. Results and Discussion

The energy audit and POE were conducted for one calendar year from January to December 2019, and a dynamic simulation was carried out for an annual energy consumption study. From these studies, several deficiencies of energy performance gap were found in the case study building and are reviewed below.

4.1. Energy Audit Analysis

Through several stages of energy audit, four major deficiencies were found. One was during HVAC operation and performance check, the AHU fans were operated as CAV (constant air volume) rather than VAV (variable air volume), which would increase the operation time and the energy consumption from a supply air fan. These fans continuously work with full power and supply air sets air temperature between 11.5 and 13.2 °C, which was also quite low due to satisfying the internal setting temperature during occupied hours (measured at 21.5 °C), and even during unoccupied hours (measured at 23.8 °C). Similar problems were indicated in lighting controls and scheduling. The lighting remained turned on during the daytime in the corridors.
The light fixtures are located next to the curtainwall in the case study building (Figure 7d) and it is almost 13% of the circulation lighting. Another similar operation and maintenance problem was the exit doors located in the exterior envelope. These doors remained widely open during occupied hours (Figure 7a,b), with the expected loss of airtightness and return air to AHUs for maintaining mixed air temperature with indoor target temperature. Figure 5 shows some examples of IR images of the current situation.
Table 6 shows that the location of the open doors and images taken by the IR camera and how much conditioned air escaped from the exterior building doors. This building has a total thirteen air conditioners installed on the roof of the building and supply 203,557 cubic feet per minute (CFM), about 30% (59,350 CFM) of which is supplied from the outside air, and the remaining 70% (144,200 CFM) is reused. To measure the escaped air from the doors, TESTO 440 dp was used and every 15 min an average CFM was measured at three of the doors which, all year round, remained open during the occupied hours. Based on the measurement, it is noticed that 10% (21,072 CFM) of supply air could escape from the building and 15 and 36% of the return air and the outside air, respectively. This direct air leakage from the doors affects the cooling energy consumption of the building and it can also affect on operating hours and energy consumption for AHU fans. These measurement data were used to calibrate the simulation model (Scenario C) to increase the model accuracy for validating the simulation model’s (Scenario D) airtightness rate from 0.6 to 1.5 ACH which corresponds to the actual building.

4.2. POE Study Anlysis

Table 7 summarizes the results collected by the mobile and fixed monitoring data logger and devices. During the occupied hours, the indoor temperature was around 21.5 °C in both enclosed and open-plan offices. The monitored indoor temperatures were significantly lower than the ASHRAE Standard 55-recommended temperatures, which are 24 °C for occupied hours and 28 °C for unoccupied hours. This indoor setting temperature could have an effect on the energy performance gap in the case study building. To define the level of performance gap by setting the different indoor temperatures between as-designed model and in-used model, the monitored indoor temperatures were applied as indoor setting temperatures for in-use simulation model and ASHRAE-recommended temperatures for the as-designed simulation model. Except for the indoor temperature, the rest of the air quality measures such as noise, lighting, CO2, TVOCs, PM 2.5 and PM 10 are within the comfort and safe ranges based on the WELL Building Standard recommendation.

4.3. Energy Performance Gap in the Case Study Building

The overall energy consumption with end-use results for each simulation model is illustrated in Figure 8. This indicates that the baseline model, which used the ASHRAE 90.1 Appendix G method, was the most energy consumed and the best case/benchmark was the as-designed model. To compare the energy consumption between the baseline model and the Abu Dhabi code, which showed a 7.4% lesser consumption per the Abu Dhabi code, where the reduction was mainly related to enhanced building envelopes only.
To improve the accuracy of the energy simulation models, the in-use model was calibrated with energy audit analysis and POE data such as internal target temperature, HVAC supply air fans operation method, corridor lighting schedule, and airtightness. After calibrating the model, in-use building consumed almost 25% more energy than the as-designed model (Figure 8). From this comparison study, it was noted that the dynamic performance gap could not be ignored as part of the life cycle of the buildings. The main discrepancies from this study were mainly related to operation and management issues such as doors remaining open, lights kept on during daytime, VAVs working as CAVs, and these issues can be solved without increasing the cost or extra investment to update the existing mechanical and operating systems.
After finding the dynamic energy performance gaps from the case study building through the series of simulation scenarios, it was simulated with a detailed dynamic simulation to investigate the degree of dynamic energy performance gaps of each end-use in the case study building. The energy consumption was increased by 29.7% for lighting use due to failing to operate the correct lighting schedules in the corridors, by 39% for fan power due to operating the VAV systems as CAV systems, and by 24.8% increased by cooling energy consumption and it was associated with an incorrect internal temperature setting, an incorrect operation of the HVAC systems and the failure to secure the airtightness of the case study building (Figure 9). A previous study from Papadopoulos et al. also found one major operational issue in the university building which was related to the thermostat setpoints [24] and showed the same recommendation found in this study.
The comparison between the total dynamic energy performance gap in the as-designed model and the in-use model was confirmed by the fact there was almost 25% of the gap. This shows that a building system with the correct operation with schedule, and careful management scheme would certainly reduce the energy consumption to bring it closer to the as-design level, and at the same time, it could improve the indoor environmental quality of the building.

5. Conclusions

More than a third of global energy consumption and CO2 emission is generated by the building sector and the awareness of the importance of buildings’ energy performance related to CO2 emissions has increased worldwide. Improving energy efficiency is one of the key policy directions for the UAE government to tackle energy security, energy conservation, and climate change. As a direct response, to increase energy efficiency in the building sector in the UAE, substantial steps have been taken in recent decades such as setting up the minimum levels of U-values for building envelopes, introducing building rating systems, and improving HVAC systems’ efficiency. However, there is still an extensive evidence which shows that the buildings usually do not perform as well as predicted whilst in-use and this discrepancy is commonly referred to as the “energy performance gap”.
The focus area of this research is using the building energy audit data and the POE and to reduce the dynamic energy performance gap in one of the university buildings in the UAEU, UAE. To achieve the main objective of this study, the energy audit data and the POE, followed by a detailed dynamic simulation method, were applied to several simulation scenarios. Identifying the cause of discrepancies between the as-designed and actual building, and to increase the accuracy of the simulation model, POE and energy audit data were used for calibrating the simulation model (Scenario C) to validate (Scenario D).
The research clearly indicated that the case study building in-use condition was not operated as designed and almost a quarter of the cooling-related energy was wasted by mismanaged and poorly understood building’s active system operations and management. This type of performance gap is commonly found in the UAE and can be easily solved without increasing the cost or extra investment for systems upgrade. This method is able to use the calibration of the actual conditions of the building with a computer-generated energy simulation model to improve the accuracy of the simulation model, and efforts to identify the underlying causes of the gap between numerical/computational predictions and actual usage as well. This research method is very cost effective, and less than one year of the return of investment could be achievable. It also shows that the energy audit and POE study are possible to reduce the dynamic energy performance gaps in the building sector by improving the indoor environment quality, especially after the buildings are occupied as in-use phase.

Author Contributions

Y.K.K. conceived the presented idea and developed the theory and performed the computations. Y.K.K. and L.B. verified the analytical methods. K.A.T.A. and H.A. encouraged Y.K.K. to investigate the POE study and supervised the findings of this work. All authors have read and agreed to the published version of the manuscript.

Funding

This research was funded by the UAEU, grant name and numbers: 2018 Start-UP (31N380).

Institutional Review Board Statement

Not applicable.

Informed Consent Statement

Not applicable.

Data Availability Statement

The data presented in this study are available on request from the corresponding author. The data are not publicly available due to the case study building is governmental facility.

Acknowledgments

The authors would like to thank the UAEU for supporting the study and allowing for the measurements to take place.

Conflicts of Interest

The authors declare no conflict of interest and the funders had no role in the design of the study; in the collection, analyses, or interpretation of data; in the writing of the manuscript, or in the decision to publish the results.

References

  1. International Energy Agency. Total Energy Use in Buildings Analysis and Evaluation Methods. International Energy Agency, 2016. Available online: https://www.iea-ebc.org/Data/publications/EBC_PSR_Annex53.pdf (accessed on 24 December 2020).
  2. International Energy Agency. Capturing the Multiple Benefits of Energy Efficiency. International Energy Agency, 2014. Available online: https://webstore.iea.org/capturing-the-multiple-benefits-of-energy-efficiency (accessed on 24 December 2020).
  3. Cullen, J.M.; Allwood, J.M.; Borgstein, E.H. Reducing energy demand-What are the practical limits. Environ. Sci. Technol. 2011, 45, 1711–1718. [Google Scholar] [CrossRef] [PubMed]
  4. Pérez-Lombard, L.; Ortiz, J.; Pout, C. A review on buildings energy consumption information. Energy Build. 2008, 40, 394–398. [Google Scholar] [CrossRef]
  5. Davies, H. Tracing the Continuing Development of Part L. Modern Building Services, 2013. Available online: http://www.modbs.co.uk/news/fullstory.php/aid/12062/Tracing the continuing development of Part L.html (accessed on 24 December 2020).
  6. Demanuele, C.; Tweddell, T.; Davies, M. Bridging the gap between predicted and actual energy performance in schools. In Proceedings of the World Renewable Energy Congress XI, Abu Dhabi, UAE, 25–30 September 2010. [Google Scholar]
  7. Bordass, B.; Cohen, R.; Field, J. Proceedings of the International Conference on Improving Energy Efficiency in Commercial Buildings, Frankfurt, Germany, 19–20 April 2004.
  8. Probe Archive Held by the Usable Buildings Trust (UBT). Available online: http://www.usablebuildings.co.uk/Pages/UBProbePublications1.html (accessed on 15 December 2020).
  9. Bordass, B.; Cohen, R.; Standeven, M.; Leaman, A. Assessing building performance in use 3: Energy performance of probe buildings. Build. Res. Inform. 2001, 29, 114–128. [Google Scholar] [CrossRef]
  10. Carbon Trust. Closing the Gap-Lessons Learned on Realising the Potential of Low Carbon Building Design CTG047; Carbon Trust: London, UK, 2011. [Google Scholar]
  11. Menezes, A.C.; Cripps, A.; Bouchlaghem, D.; Buswell, R. Predicted vs actual energy performance of non-domestic buildings: Using post-occupancy elvaluation date to reduce the performance gap. Appl. Energy 2012, 97, 355–364. [Google Scholar] [CrossRef] [Green Version]
  12. Burman, E.; Mumovic, D.; Kimpain, J. Towards measurement and verification of energy performance under the framework of the European directive for energy performance of buildings. Energy 2014, 77, 153–163. [Google Scholar] [CrossRef] [Green Version]
  13. Cohen, R.; Bordass, B. Mandating transparency about building energy performance in use. Build. Res. Inform. 2015, 43, 534–552. [Google Scholar] [CrossRef]
  14. Igor, S.; Assunta, N.; Karsten, V. Net zero energy buildings: A consistent definition framework. Energy Build. 2012, 48, 220–232. [Google Scholar]
  15. U.S. Department of Energy. Energy Efficiency & Renewable Energy Building Technologies Program: A Guide to Energy Audits. Pacific Northwest National Laboratory, 2011. Available online: https://www.pnnl.gov/main/publications/external/technical_reports/PNNL-20956.pdf (accessed on 15 December 2020).
  16. Raslan, R.; Davies, M.; Doylend, N. An analysis of results variability in energy performance compliance verification tools. In Proceedings of the Eleventh International IBPSA Conference, Glasgow, Scotland, UK, 27–30 July 2009. [Google Scholar]
  17. Hamilton, I.; Steadman, P.; Bruhns, H. CarbonBuzz-Energy Data Audit; UCL Energy Institute: London, UK, 2011. [Google Scholar]
  18. van Dronkelaar, C.; Dowson, M.; Burman, E.; Spataru, C.; Mumovic, D. Review of the Energy Performance Gap and Its Underlying Causes in Non-Domestic Buildings. Front. Mech. Eng. 2016, 1, 17. [Google Scholar] [CrossRef] [Green Version]
  19. Bunn, R.; Burman, E. S-curves to model and visualize the energy performance gap between design and reality-first steps to a practical tool. In Proceedings of the CIBSE Technical Symposium, London, UK, 17 April 2015. [Google Scholar]
  20. Lowe, R.; Oreszczyn, T. Regulatory standards and barriers to improved performance for housing. Energy Policy 2008, 36, 4475–4481. [Google Scholar] [CrossRef]
  21. Oreszczyn, T.; Lowe, R. Challenges for energy and buildings research: Objectives, methods and funding mechanisms. Build. Res. Inform. 2010, 38, 107–122. [Google Scholar] [CrossRef]
  22. Evan., M.; Hannah., F.; Tehesia., P.; Norman., B.; David., C.; Tudi., H.; Mary., A.P. The Cost-Effectiveness of Commercial-Building Commissioning: A Meta-Analysis of Energy and Non-Energy Impacts in Existing Buildings and New Construction in the United States; Lawrence Berkeley National Laboratory: Berkeley, CA, USA, 2004. [Google Scholar]
  23. Trane TRACE 700. Available online: https://www.trane.com/commercial/north-america/us/en/products-systems/design-and-analysis-tools/trace-700.html (accessed on 15 December 2020).
  24. Sokratis., P.; Constantine., E.K.; Alex., V.; Elie., A. Rethinking HVAC temperature setpoints in commercial buildings: The potential for zero-cost energy savings and comfort improvement in different climates. Build. Environ. 2019, 155, 350–359. [Google Scholar]
Figure 1. CarbonBuzz median electrical consumption per-sector: predicted vs. actual (Source: [11]).
Sustainability 13 00120 g001
Figure 2. Three possible performance gaps throughout the life cycle of a building (s-curve visualization was adapted from [19]).
Sustainability 13 00120 g002
Figure 3. Number (%) of deficiencies identified by in-use building system (Source: [22]). EMCS: Energy Management Control System.
Sustainability 13 00120 g003
Figure 4. Floor plan and a view of the case study building, UAEU Campus (Source: Author).
Sustainability 13 00120 g004
Figure 5. Floor plan and a view of the case study building, UAEU Campus (Source: author).
Sustainability 13 00120 g005
Figure 6. Energy simulation model and TRACE 700 interface.
Sustainability 13 00120 g006
Figure 7. Deficiencies from energy audit.
Sustainability 13 00120 g007
Figure 8. Dynamic energy simulation results.
Sustainability 13 00120 g008
Figure 9. Energy performance gap by deficiencies.
Sustainability 13 00120 g009
Table 1. Discrepancy in different buildings.
Building TypeGap AverageTotal Number of
Reported Cases
Office16%25
School67%11
Multipurpose45%8
University67%3
Laboratory32%2
Restaurant31%2
Retail37%2
Supermarket−10%2
Library8%2
Table 2. Detail of the case study building.
NameTotal Number of
Reported Cases
ArchitectureSiteAl-Ain, UAE
ProgramsOffices, laps and lecture rooms
Building area7120 m²
GFA (Gross Floor Area)21,360 m²
Mechanical Cooling plantCampus District cooling
Cooling system13 AHUs on rooftop
System controlVAVs
ElectricalLighting T5 flounce lamp (offices, laps, lecture rooms), energy efficient light bulbs (circulation)
Target illumination400–500 Lux (Offices), 200–300 Lux (circulation)
RenewableN/A
Table 3. Detail of the energy audit and post occupancy evaluation (POE) study.
MeasurementsDevisesMonitoringImage
Energy AuditBuilding envelops HVAC system and operation
Energy consumption
Testo 872
Testo 440 dp
-
-
Surface temperature
Airleakage
MEP CAD files with FM team interviews
2019 energy consumption was provided by FM team
Sustainability 13 00120 i001
POE StudyThermal comfortHOBOTemperature (°C)
RH (%)
Lighting (lux)
Every 15 min
Sustainability 13 00120 i002
Acoustic and lightingPRECISION GOLD Environment MeterAcoustic (dB)
Lighting (lux)
Spot measurement
Sustainability 13 00120 i003
Indoor Air Quality (IAQ)Air Mentor ProTemperature (°C)
RH (%)
PM 2.5 (μg/m³)
PM 10 (μg/m³)
CO2 (ppm)
TVOC (ppb)
Every 15 min
Sustainability 13 00120 i004
MEP CAD: Mecahnica, Electrical, Pluming Comupter-aided Design; FM: Facility Management; PM: Particulate Matter; TVOC: Total Volatile Organic Compounds
Table 4. Simulation models’ specifications and input data.
Baseline Model
(ASHRAE 90.1)
Abu Dhabi Code
(National Code)
As-Designed Model
(Prediction)
In-Use Model
(Current)
Wall
Roof
Floor
Window
0.705 (W/m²·K)
0.360 (W/m²·K)
1.986 (W/m²·K)
6.81 (SHGC 0.25)
0.329 (W/m²·K)
0.329 (W/m²·K)
1.823 (W/m²·K)
2.2 (SHGC 0.25)
0.537 (W/m²·K)
0.403 (W/m²·K)
1.423 (W/m²·K)
2.2 (SHGC 0.25)
0.537 (W/m²·K)
0.403 (W/m²·K)
1.423 (W/m²·K)
2.2 (SHGC 0.25)
HVACPackage Rooftop DX, CAV (System 3)Package Rooftop DX, CAVPackage Rooftop DX, VAVPackage Rooftop DX, CAV **
Cooling Set Temp24 °C (28 °C *)24 °C (28 °C *)24 °C (28 °C *)21 °C **(23 °C *)
Airtightness0.6 ACH0.6 ACH0.6 ACH1.5 ACH **
Lighting 9.7 W/m²9.7 W/m²9.7 W/m²9.7 W/m² ***
* cooling setback temperature (ASHREAE Standard 55); ** input data from the energy audit and POE studies; *** lighting power density remains the same for all cases. However, the in-use model’s schedule is set as ‘24 h on’; CAV: Constant Air Volume; AHC: Air Change Hour.
Table 5. Dynamic simulation scenario.
ScenariosPurpose
SimulationA: BaselineDefine the level of energy consumption at international level.
B: National CodeDefine the level of energy consumption at current national level.
C: BenchmarkDefine the level of energy consumption at as-designed level.
D: Actual BuildingTo identify the dynamic performance gap in actual building.
Sustainability 13 00120 i005
Sustainability 13 00120 i006
Table 6. Infiltration of air from the opened doors.
Supply AirReturn AirOutside AirEscape Air
CFM203,557144,20059,35021,072
Sustainability 13 00120 i007
Table 7. Summary of Indoor Environment Quality (IEQ) data from the POE study.
Temperature (°C)RH (%)
RangeWhole AverageOccupied
Average
RangeWhole AverageOccupied
Average
East enclosed/private? Office19.9–23.120.820.944.9–9.952.653.5
East open-plan offices21.2–23.322.322.339.9–53.547.548.4
West private? Office21.2–23.822.221.939.7–55.949.150.9
West open-plan offices20.2–23.221.521.140.9–59.351.153.3
Corridor20.9–23.721.621.545.6–58.852.753.8
Publisher’s Note: MDPI stays neutral with regard to jurisdictional claims in published maps and institutional affiliations.

