Article

Application and Comparison of Multiple Models on Agricultural Sustainability Assessments: A Case Study of the Yangtze River Delta Urban Agglomeration, China

Department of Environmental Science and Engineering, Fudan University, Shanghai 200433, China
*
Author to whom correspondence should be addressed.
Sustainability 2021, 13(1), 121; https://doi.org/10.3390/su13010121
Submission received: 1 December 2020 / Revised: 19 December 2020 / Accepted: 22 December 2020 / Published: 24 December 2020

Abstract

:
Operationalization of sustainability assessments is necessary to promote the sustainable development of agroecosystems. However, primarily, focus has been on the development of sustainability assessment tools with less attention on whether these are suitable for adoption and implementation in specific areas. This drawback could lead to inappropriate management guidance for agricultural practices. Hence, three extensively used models, i.e., the Driver–Pressure–State–Impact–Response (DPSIR) framework, ecological footprint (EF), and emergy analysis (EMA), were applied to quantify the sustainability performance of the agroecosystems in 27 cities in the Yangtze River Delta Urban Agglomeration (YRDUA), China, in 2016. The models were compared using the Pearson correlation analysis and natural break method, to determine a more adaptive method for agricultural sustainability assessments. The level of agricultural sustainable development of each city varied according to the methodology considered for its calculation. Compared with the EMA model, the DPSIR and EF models showed a better relationship (Pearson correlation coefficient of 0.71). The DPSIR model more accurately represented regional rankings of the agricultural sustainability at the municipality level due to its comprehensive consideration of multiple dimension factors and significance for policy making. However, each methodology has its own contribution depending on the study objectives. Hence, different models should be used for adequate determination of agricultural sustainable development at different regional scales; this would also enable better implementation of agricultural practices as well as policies in any given agricultural area for promoting the sustainable development of agroecosystems.

1. Introduction

Agriculture is the foundation of human survival and development, which provides multiple ecosystem services, such as a food supply, environmental conditioning, and cultural education, among others [1]. In the past half century, grain production has increased significantly, mainly resulting from greater inputs of artificial auxiliary energy and other technologies originating from the “Green Revolution” [2], which unfortunately have major global environmental impacts: land clearing and habitat fragmentation threaten biodiversity, while global greenhouse gas (GHG) emissions and fertilizer application can harm marine, freshwater, and terrestrial ecosystems, among other factors [3]. The agroecosystem itself also faces challenges due to climate change, population explosions, and ecosystem degradation [4]. Agricultural sustainability is defined as practices that meet current and future societal needs for food and fiber, for ecosystem services, and for healthy lives, and that do so by maximizing the net benefit to society when all costs and benefits of the practices are considered [2]. Agricultural practice likes the Reduce–Reuse–Recycle (“3R”) principle is encouraged for sustainable development of agroecosystem, e.g., a small low-pressure irrigation network, recycling of waste resources, and the use of clean energy and crop straw for fermenting biogas [5]. As the embodiment of sustainable development ideas in the agricultural field, sustainable agriculture has been increasingly highlighted in both policy agendas and the capital market in recent years [6].
Research on agricultural sustainability assessments can benefit both farming practices and agricultural policy making, which are also conducive to promoting regional economic and social development [7]. Comprehensive quantification methods based on composite indicators, which refer to multi-dimensional (i.e., social, economic, and ecological) and multi-functional (e.g., food security, biodiversity, natural resources conservation, and landscape maintenance) perspectives, are widely used for sustainability assessments in agriculture, aiming to implement integrative analysis and explore the actual status of agricultural sustainability [8]. These methods include the Sustainability Assessment of Food and Agriculture Systems Framework (SAFA) [9], Sustainability Assessment Adaptive and Low-input Tool (SALT) [10], and Sustainability Assessment of Farming and the Environment framework (SAFE) [11], among others. The Driver–Pressure–State–Impact–Response (DPSIR) framework was developed in the late 1990s and adopted by the Organization of Economic Co-operation and Development (OECD) [12]. As the most popular conceptual indicator framework, DPSIR has yielded valuable contributions in terms of organizing environmental indicators based on causality and providing beneficial references to decision makers [13]. DPSIR has also been widely utilized to analyze the interacting processes of human–environmental systems, including its application for the assessment of agricultural sustainability and policy making [14,15]. The Emergy method (EMA), originally developed by system ecologist H.T. Odum and followers in the late 1980s, is now becoming more popular for its biophysical perspective of a complex ecosystem [16]. The basic idea behind EMA is to quantify all forms of resources by applying a common metrological reference, referred to as the solar equivalent energy [17]. Until now, various systems have been evaluated by EMA including agroecosystems. Additionally, the emergy ratios and indices of EMA have been introduced to assess various aspects of the sustainability for farming systems [18], e.g., evaluations of food security and sustainable agriculture [19], comprehensive evaluations and optimizations of agricultural systems [5], and assessments of the efficiency and sustainability of wheat production systems [20], among others. Another widely used method for sustainability assessment is the ecological footprint (EF), which was originally proposed by Rees and later developed by Wackernagel et al. [21]. The EF model allows for the assessment of the impact that human beings have on the environment in terms of an ecologically productive area, which is necessary to sustain their lives and activities [22]. Numerous studies have assessed the environmental sustainability of national cropping systems [23], cropland use sustainability [24], and the supply and demand balance of the ecological carrying capacity for arable land [25].
Method optimization and model integration for a more accurate sustainability analysis are also a current research focus. The localization of the yield factor [26] and equalization factor [27] in the EF model can more effectively evaluate research objects at different spatio-temporal scales. Previous studies have used the Net Primary Production (NPP) as a substitute for the agricultural output to solve difficulties associated with statistical data collection and further improve the application performance of the EMA method [28]. The DPSIR and EMA models have been integrated with Geographic Information System (GIS) to investigate the environmental impacts and sustainability of high-altitude agriculture [29]. The emergy EF model introduces the concept of emergy density and translates the production and consumption of different types of resources into a common unit area, offering a true measure of the carrying capacity of the EF, as well as providing a clear outline of the human impact on Earth and the consumption of natural capital [30].
A wide variety of methods have been developed and improved to assess the sustainability of agroecosystems [31]. However, the following doubts arise: which approach can be considered more robust and suitable to reveal the agricultural sustainability for the specific research objects? Can these tools provide an accurate explanation for the sustainable performance of specific areas? To address these questions, the focus of this study was to assess the agricultural sustainability of the Yangtze River Delta Urban Agglomeration (YRDUA), with comparisons of the results obtained by three widely used models, i.e., the DPSIR framework, EF, and EMA, aiming to identify a more accurate method to reveal the true status of the sustainable level of the agroecosystem. In addition, to ensure that practical outcomes were achieved through the different models, we attempted to enhance the accuracy and overcome uncertainties previously reported during the calculations. The agricultural ecosystem of the YRDUA was considered as a case study due to its strategic importance as one of the main producing areas of bulk agricultural products in China.
The remainder of this paper is presented as follows. Section 2 presents the materials and methods. Section 3 describes the results, which are discussed in Section 4. Finally, the main conclusions of this study are presented in Section 5.

2. Materials and Methods
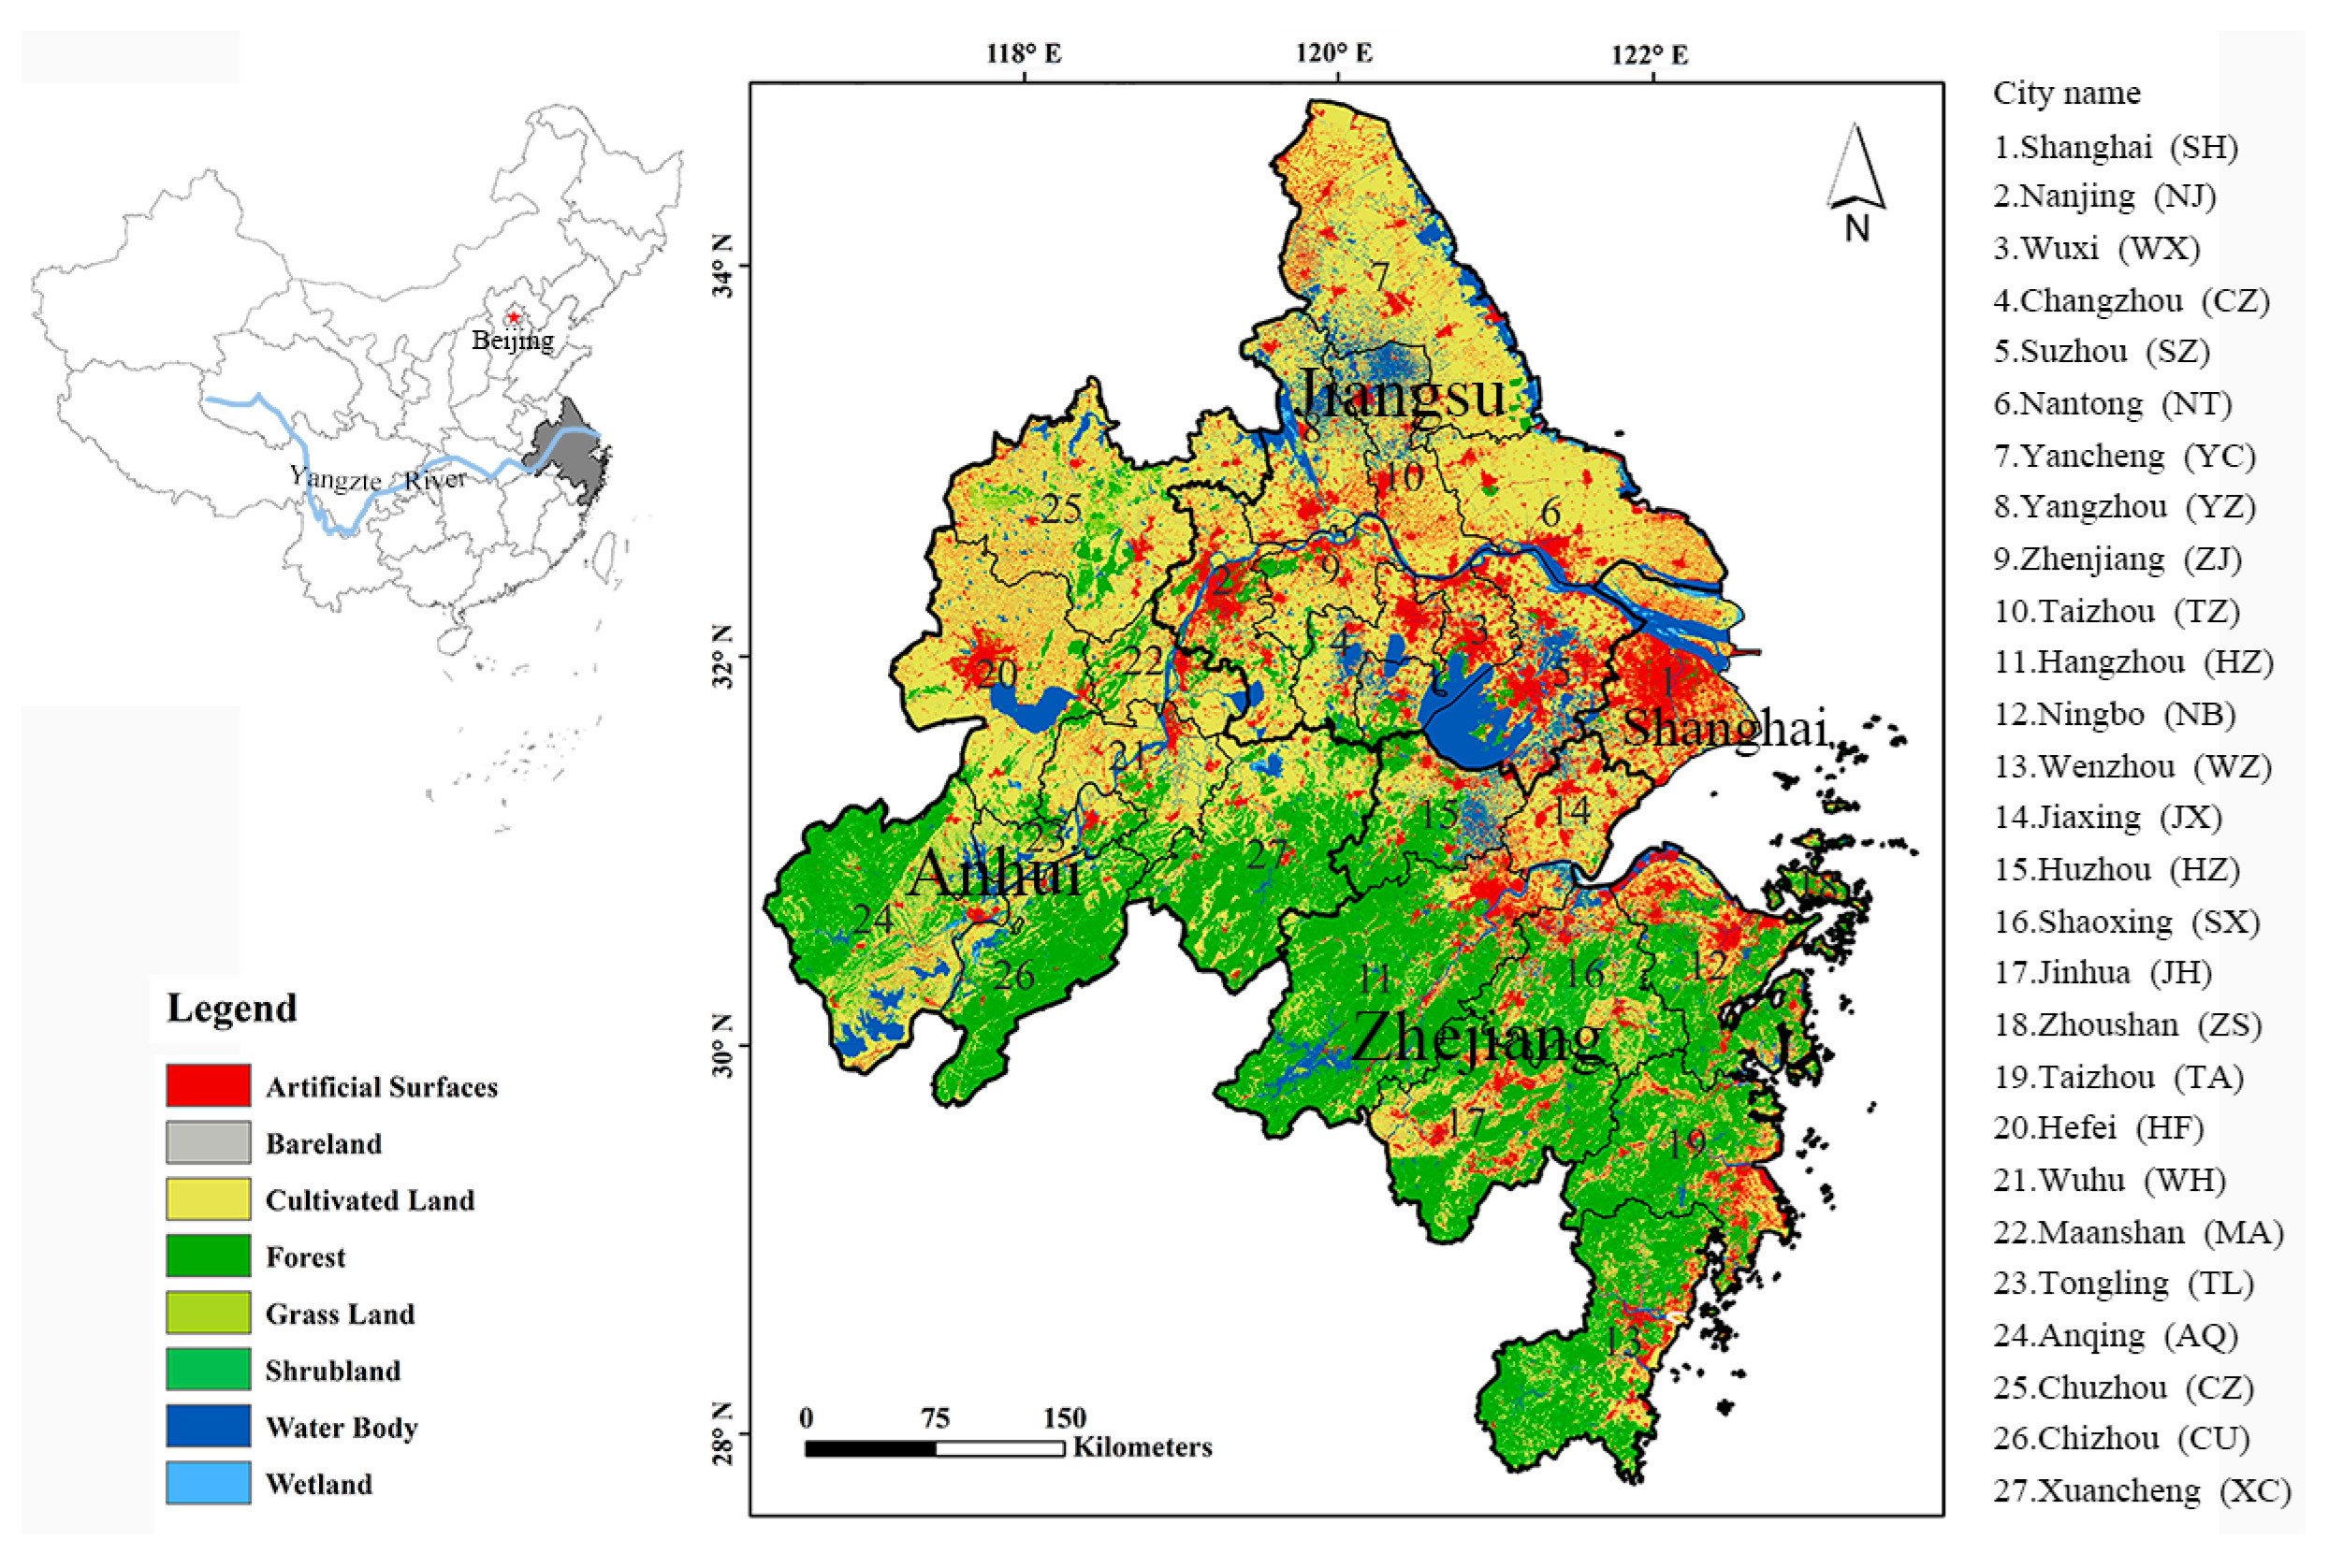
2.1. Study Area

The YRDUA, located downstream of the Yangtze River and characterized by a subtropical monsoon climate zone, is one of the regions with the most dynamic economy, highest degree of openness, and strongest innovation ability in China (Figure 1). The YRDUA has a total area of 225,000 km2 and encompasses 27 cities, including Shanghai, nine cities in Jiangsu Province, nine cities in Zhejiang Province, and eight cities in Anhui Province. As an important region in the middle and lower Yangtze River floodplain, the abundant natural resources and sound agricultural infrastructure have allowed the YRDUA to become a major grain-producing area and agricultural commodity base; in addition, the YRDUA is also of great significance and strategic importance to ensure national food security in China. In the study area, the majority of crop planting is grain, mainly including rice, wheat and maize, oil crops represented by rape, and vegetables, which are also characterized by large-scale planting.

2.2. Model Description and Data Preparation

Most of the data available used in this study were obtained from the Statistical Yearbook, Bulletin of the Third National Agricultural Census, and Bulletin of Ecological Environment, which were compiled by the central government and subordinate Chinese ministries.
The Third National Agricultural Census was conducted in 2016; compared with the Statistical Yearbook, it provides more detailed statistical data referring to agricultural practices, such as the level of high-efficient water-saving irrigation, the quality of agricultural labor, and the level of facility agriculture, among others, which can reflect the comprehensive status of agricultural sustainability in the YRDUA. Based on this, we selected 2016 as the time period for our study.

2.2.1. DPSIR Model

The indicator selection and determination of the weight coefficient are the fundamental considerations for an appropriate sustainability assessment [32]. Several indicator selection criteria were provided in the literature. The fundamental consideration for the indicator selection and assignment was the causal relationships between the DPSIR sectors, i.e., the basic causal chain linkages from drivers to response and back to the drivers. Additionally, we considered indicator representativeness, independence, data availability, adaptability, and measurability [33,34]. In this study, a total of 24 indicators were selected from multi-dimensions, including economic–social–ecological aspects, to establish a comprehensive framework for assessing the performance of agricultural sustainability (Table 1).
Indicators should be standardized before the data are analyzed to eliminate the effects caused by different dimensions and ensure accurate analysis [35]. We standardized the indicators between 0 to 1. The transfer functions are as follows:
y = x min ( x ) max ( x ) min ( x )
y = max ( x ) x max ( x ) min ( x )
where y is the normalized value of a participating indicator x ; max ( x ) and min ( x ) are the maximum and minimum values of a participating indicator, respectively. For a positive and a negative indicator, Equations (1) and (2) were used for calculation, respectively.
To determine the indicator weight, a subjective weight calculated using the analytic hierarchy process (AHP) and an objective weight calculated by using the entropy weight method were combined. The results were synthesized according to the minimum relative information entropy principle to obtain a more reasonable weight of each indicator.
The main idea of the AHP is to decompose complex problems into sub-problems and then classify these sub-problems by dominance relationship and construct an orderly hierarchy. The AHP makes it possible to facilitate multicriteria decision-making with respect to various assessments and convert qualitative judgments into numerical values [36]. The following judgment matrix was used to calculate the priorities of the indicator:
A = [ a i j ] = [ 1 a 12 a 1 n a 21 1 a 2 n a n 1 a n 2 1 ] = [ 1 a 12 a 1 n 1 / a 12 1 a 2 n 1 / a 1 n 1 / a 2 n 1 ]
where a i j is the pairwise comparison rating between indicator i with indicator j .
To estimate the relative weights of the indicator in this matrix, the priority of the indicator was estimated by computing the eigenvalues and eigenvectors as follows:
A · W = λ max · W
where W is the eigenvector of the matrix A , and λ max is the largest eigenvalue of the matrix A .
The consistency of the matrix A was achieved by examining the reliability of judgments in the pairwise comparison. The consistency index C I and the consistency ratio C R are defined as Equations (5) and (6), respectively.
C I = ( λ max n ) / ( n 1 )
C R = C I / R I
where n is the number of indicators being compared in this matrix, and R I is the random index.
After examination, the C R value of the matrix A set in this research was less than 0.1, which is considered to be in good agreement (Table 2).
Entropy indicates the extent of the uncertainty of a system, and it is suited for measuring the relative importance of the contrast indicator to represent the average intrinsic information transmitted for decision-making; hence, the entropy value can be used to calculate the objective weights of the index system [37].
Assume that there are m objects for evaluation and each has n evaluation indicators, which form raw data matrix R , the matrix as follows:
R i j = [ x 11 x 12 x 1 m x 21 x 22 x 11 x n 1 x n 2 x n m ]
where j = 1, 2, …, m ; i = 1, 2, …, n .
The matrix R was normalized for each indicator by Equations (1) and (2), and decision matrix Y was obtained, the matrix is as follows:
Y i j = [ y 11 y 12 y 1 m y 21 y 22 y 11 y n 1 y n 2 y n m ]
The entropy H i of each indicator y i was calculated using Equation (9); the values f i j were calculated using Equation (10). The entropy weight w 2 i of each indicator y i was calculated by Equation (11).
H i = k j = 1 n f i j ln f i j
f i j = y i j / j = 1 m y i j
w 2 i = 1 H i n i = 1 n H i
where k = 1 / ln m .
The entropy-weight method emphasizes the objective weights of the index system, while the AHP may be highly subjective because of the knowledge and experience limitations of the designated experts. The two weights computed using the AHP and entropy weight method, respectively, can be synthesized according to the minimum relative information entropy principle to obtain a more reasonable weight of each indicator [38]. The final combined weight was calculated as follows:
W i = ( w 1 i w 2 i ) 0.5 i = 1 m ( w 1 i w 2 i ) 0.5
where i = 1, 2, …, m , w 1 i is the indicator weight calculated using the AHP, w 2 i is the indicator weight calculated using the entropy weight method, and W i represents the combined weight of the indicator.
Finally, we introduced the Sustainable Development Index (SDI) to measure the level of agricultural sustainability in the study sites. The SDI was calculated as follows:
S D I j = i = 1 n y j i w i
where S D I j is the agricultural sustainable development index of city j , n the number of evaluation indicators, y j i represents the standardized value indicator i of city j , and w i is the combined weight of the indicator i

2.2.2. EF Model

To understand the consumption of resources in agricultural practices, the EF of production can be evaluated based on a bottom-up approach, which establishes a component-based model of the EF [39]. For plant-based primary agricultural products, the footprint includes two types of components: cultivated land ecological footprint E F 1 and carbon footprint E F 2 . The cultivated land footprint can be computed by the cultivated land footprint coefficient and the output of agricultural products. The carbon footprint can be obtained based on the carbon emissions factor of the agricultural inputs and the material quality of the agricultural inputs. These equations can be expressed as follows:
E F 1 = E F I 1 · H = 1 Y · E Q F · H
E F 2 = M k · E k · v
E F = E F 1 + E F 2
where E F I 1 represents the cultivated land footprint coefficient of a certain type of agricultural product, H is the output of that agricultural product, Y is the average national yield of that agricultural product, E Q F is the equivalence factor, which is a scaling factor required to convert a specific land-use type into a universal unit of a biologically productive area. The methods reported in Liu [27] were adopted to calculate the equivalence factor for the EF in China and its provinces based on the NPP. Here, M represents the material quality of a certain type of agricultural input, k is represents the types of agricultural input, E represents the carbon emissions factor of the agricultural input, and v represents the forest area demand for carbon sequestration when considering the carbon absorption of the ocean; v = 0.2563 ghm2/t CO2 was used in this study.
The agricultural ecological carrying capacity can be defined as the largest supply of natural resources and the capacity of the ecological environment to support sustainable agricultural development within a certain time and space. In our calculations, 12% [40] of the ecological carrying capacity was reserved for the protection of regional biodiversity; based on this, we finally determined the ecological surplus or ecological deficit. The formula can be expressed as follows:
E C = A · r · y
where E C represents the regional agricultural ecological carrying capacity, A is the area of cultivated land, r is the equivalence factor, and y represents the yield factor, which refers to calculations reported in Shi [26].
To assess the ecological carrying capacity supply and demand balance in the agroecosystem, we introduced ecological supply and demand balance index (EI) and classified the cities into different levels of agricultural sustainability [25] (Table 3).

2.2.3. EMA Model

The EMA model measures all forms of energy, resources, and human services based on the solar energy equivalent, which allows an analysis of all aspects of an examined system in an integrated manner, providing a biophysical perspective of various systems [16]. The main analysis steps were as follows. (1) Collect raw data on the natural environment, society, and economy, which are related to agricultural practices in the study area. (2) Set the boundaries of the system, and draw an emergy system diagram of the agroecosystem to identify major flows, which were used to sustain the production and consumption processes within the system (Figure 2). (3) Compile the emergy analysis table and classify the emergy flows into renewable inputs, locally non-renewable input, purchased resources, outputs, and waste emergy (Table 4). In this study, different flows were translated into solar emergy through multiplying by the related unit emergy value (UEV) based on a unified geobiosphere emergy baseline of 12.0 × 1024 sej y−1 from the most recent studies; emergy transformity is mainly based on the studies of Liu [41]. We also follow the suggestions reported in Brown [42] to calculate the global renewable sources, which can prevent double counting. (4) Calculate the related emergy-based indicators to uncover the resource utilization structure and overall sustainability of the system (Table 5).

2.2.4. Results Comparison Analysis

A normalization processing was used to realize the results’ comparability of the three models with Equation (18); the assessment results were mapped to [0,1] and then analyzed by the Pearson correlation test for further investigation, aiming to explore the relationships among the different models.
y = x i i = 1 27 x i
where y represents agricultural sustainability evaluation score after normalization of each city, x i is raw score of agricultural sustainability calculated by the three models, and i is the number of cities.
Finally, for the exploration of the different assessment results, the normalized assessment results of the three approaches are conducted with Pearson correlation analysis based on SPSS 26.0 and cluster analysis by using the natural break method based on ArcGIS 10.2, respectively.

3. Results

3.1. DPSIR Model

Figure 3 shows the Sustainable Development Index (SDI) of the agroecosystem in each city. We observed that, at the municipal level, Huzhou has the highest level of agricultural sustainability, with an SDI value of 0.57. Changzhou, Jiaxing, and Taizhou are also characterized by preferable performance, while Hefei and Tongling show the lowest level, with an SDI value of 0.39. Cities, such as Shanghai, Nanjing, Suzhou, Jinhua, and Ma’anshan, are relatively close with an SDI near to 0.5, which are all characterized by a middle level. At the provincial level, in general, expect for Zhoushan, Zhejiang has the highest overall level of agricultural sustainability, followed by Jiangsu and Shanghai; Anhui was relatively low, apart from Wuhu and Ma’anshan.
DPSIR was proposed to show the cause–effect relationships between the environmental and human systems [20]. For further analysis of this interaction, the scores of the criterion layer of each city were normalized (Z values) to explore the influence that the “Driver–Pressure–State–Impact–Response” has on agricultural sustainability (Figure 4). The “Driver” is the fundamental driving force(s) behind changes in the agroecosystem. Taking Nanjing as an example, urban sprawl may lead to the occupation of cultivated land by artificial surfaces. Moreover, the enlargement of the urban–rural income gap will inevitably accelerate the shift in the labor force from agriculture to the manufacturing and service sectors in urban areas, resulting in a decreasing investment in agriculture. Therefore, the subsystem of “Driver” scores relatively low. “Pressure” reflects the adverse effect that human activities have on the agricultural ecosystem. For examples, cities, such as Wuxi and Shanghai, which have a higher input of industrial auxiliary energy, including pesticides, fertilizers, and plastics film, among others, have placed greater environmental pressure on the agroecosystem. “State” refers to the status of the agricultural resource quality, resource utilization efficiency, and ecological environment, among others. The lower scores for Zhenjiang and Hefei may be attributed to a deficiency of high–medium quality cultivated land and forest coverage. The quality of cultivated land is of great significance for sustainable agricultural development. The forest coverage rate is also important for soil and water conservation. For the “Impact” layer, Zhoushan is an island city; due to its mountain terrain and limited land resources, Zhoushan has a higher level of farmland abandonment and a lower agricultural value added per labor, which partially restricts the development of agriculture. “Response” reflects the feedback measures taken by humans to achieve sustainable agricultural development. In general, Shanghai, Jiangsu, and Zhejiang had a high level of economic development, agricultural modernization, and labor quality, such that the response subsystem scores were also relatively high.

3.2. EF Model

As shown in Figure 5, the results reveal that the agricultural EF of most cities exceeded their ecological carrying capacity, which manifested as an ecological deficit. The value of the agricultural EF in each city is associated with the area of cultivated land. Thus, larger cultivated land areas always result in more demand for the input of pesticides, fertilizers, and agricultural films, among others, which will, in return, generate a high EF. Yancheng shows the highest EF value, which has a total area of 668.2 thousand hectares of cultivated land, followed by Nantong and Taizhou. Moreover, Yangzhou, Hefei, and Chuzhou are relatively close together. However, Chuzhou has a higher ecological carrying capacity value, which indicates that the agricultural sustainability of Chuzhou is the highest among those three cities. As mentioned previously, due to limited cultivated land resources, Zhoushan has the lowest value for both the agricultural EF and ecological carrying capacity.
The EI was calculated to measure the pressure that human activity places on the agricultural ecosystem (Figure 6). There are significant differences in the EI values of each city, especially Chizhou, Tongling, and Anqing, with EI values of less than 0.7, which indicate that these cities are in a state of severe ecological overload. The agricultural practices in these cities have already caused a negative impact on the agroecosystem, such that we must urgently adjust human behavior to implement an environmentally friendly mode of agricultural production. In addition, cities, such as Shanghai, Nanjing, Wuxi, and Suzhou, are characterized by a state of ecological overload, which indicates that the agroecosystem of these cites also faces serious environmental pressure. Moreover, Wenzhou, Wuhu, and Chuzhou show an ecological deficit with EI values between 0.9 and 1.0. In contrast, Hangzhou and Ma’anshan are in a state of ecological balance. However, we note that there are only five cities that show ecological affluence, i.e., Changzhou in Jiangsu and Ningbo, Huzhou, Shaoxing, and Taizhou in Jiangsu. At the provincial level, Zhejiang shows a high overall level of agricultural sustainability, expect for Zhoushan, followed by Jiangsu, Shanghai, and Anhui, which have a relatively low overall sustainable level in the agriculture ecosystem.

3.3. EMA Model

The emergy yield ratio (EYR) is an indicator defined as the total emergy output divided by the total purchased emergy input from outside the system. The EYR represents the economic output capacity of the system. A higher EYR value represents greater system benefits [5]. As shown in Figure 7, there are significant differences in the EYR value of each city. Ma’anshan and Chizhou achieved higher EYR values, reaching 7.2 and 6.8, respectively, followed by Anqing, Zhenjiang, and Taizhou. Hangzhou, Ningbo, Jinhua, and Taizhou have relatively low EYR values, while Zhoushan has the lowest EYR value at 1.1. At the provincial level, compared with Zhejiang and Shanghai, Anhui and Jiangsu have a higher level of EYR. Cities in the northern area of Jiangsu (Subei), such as Taizhou and Yangzhou, have higher EYR values than cities in the southern area (Sunan), such as Nanjing and Suzhou. The EYR of Ma’anshan and Chizhou are also higher than Hefei and Wuhu. The EYR of economically developed cities was relatively low in general; there were also no comparative advantages from agricultural investment and market competitiveness in these cities.
The environmental load ratio (ELR) is the ratio of the total non-renewable resource inputs to the total renewable resource inputs. A higher ELR value indicates a stronger intensity of non-renewable resources utilization and greater environmental pressure faced by the system. When the ELR is higher than 5 for an extended period, the system may exert excessive pressure on the surrounding environment and cause irreversible functional degradation of the environmental system [43]. As shown in Figure 7, Shaoxing has the highest ELR level of over 5.0; Chizhou and Jiaxing are also near the threshold value. Therefore, we must optimize the resource utilization structure to reduce the existing environmental pressure in these cities. Cities, such as Nanjing, Zhenjiang, and Ma’anshan, are in the low ELR group, which indicates their higher dependence on renewable resources in agricultural practice. At the provincial level, Zhejiang has the highest ELR, followed by Anhui, whereas Jiangsu and Shanghai show low ELR values.
The emergy sustainability index (ESI) refers to the ratio of EYR to ELR; it is a key indicator that reflects the sustainable development level of the system. As the ESI is a more comprehensive indicator, it accounts for both the ecological compatibility and economic compatibility [17]. When the ESI is higher than 1.0, the production process of the system is considered sustainable [20]. As shown in Figure 8, Ma’anshan has the highest level of agricultural sustainability, followed by Zhenjiang. The ESI of Nanjing, Nantong, Taizhou, and Chizhou is generally near 2, whereas Zhoushan shows the lowest ESI. Moreover, Taizhou and Jinhua also have lower ESI values of less than 1.0, which indicates the unsustainable development status of the agroecosystem in these cities. At the provincial level, there are significant differences in the ESI; the ranking of the agricultural sustainability is Jiangsu, Anhui, and Zhejiang, with Shanghai at the middle level. The ESI value of most cities in Jiangsu and Zhejiang exceed 1.0, which indicates that these cities show better performance in agricultural sustainability.

3.4. Comparison of the Three Models

For a comparative examination of the three models, the Pearson correlation coefficient analysis using the SPSS 17.0 software and natural breakpoint classification method based on ArcGIS 10.2 were applied to explore the different assessment results. Compared with the EMA model, the EF and DPSIR models exhibited a positive correlation, with a correlation coefficient of up to 0.71 (Table 6), despite adopting entirely different concepts to determine the agricultural sustainability. Furthermore, as shown in Figure 9, the relative difference in the agricultural sustainability among the 27 cities evaluated by the first two models is also smaller than the EMA model.
However, all three models showed partial consistency at reflecting the relative level of agricultural sustainable development of cities in the same province: Huzhou in Zhejiang Province and Ma’anshan in Anhui Province had the highest value in their respective provinces, but this regularity was not significant (Figure 9).
The natural break method is a statistical method based on the numerical statistical distribution law, which can maximize the difference between classes [44] by taking a cluster analysis of the assessment results of each model. The cities were separated into six groups according to the sustainable level of the agroecosystem. The results reveal that the DPSIR and EF models also have better consistency at reflecting agricultural sustainability. Specifically, Zhejiang and Jiangsu showed a high overall level of agricultural sustainability, especially in Changzhou, Huzhou, and Taizhou, with Shanghai at the middle level. Anhui had a low sustainable level, expect for Ma’anshan and Wuhu. However, the EMA model yielded different results; the ranking of the agricultural sustainability was Jiangsu, Anhui, Shanghai, and Zhejiang (Figure 10).

4. Discussion

4.1. Comparative Analysis with the Literature

In comparative studies of sustainability assessment tools, early attempts to compare the EF and EMA models were applied to agricultural sustainability [45], regional sustainable development [46], and carrying capacity evaluations of a city [47]. Although they adopt entirely different concepts to determine the system status, the two methods yield similar results. Different from our study, compared with the environmental sustainability index, which is based on a multi-indicator decision-making integrated framework, the EF and EMA models exhibited better relationships [48]. However, other studies reported different conclusions. The EMA model may be considered more eligible than the EF model to represent the environmental load when assessing agricultural sustainability, because it considers the biosphere as the system boundary and accounts for all natural and human-made sources as supplying resources and absorbing residues [49].
These different conclusions are due to various reasons. First, for the same model, differences in the calculation methods and parameter selection may lead to different results, e.g., using the component-based method or compound method to quantify the EF in the EF model, the choice of UEV in the EMA model, and indicator selection or weight determination in the DPSIR model. In contrast, using an appropriate methodology according to purpose of the research is crucial. For the sustainability assessment of a certain system, the model should reflect comprehensive aspects, such as the integration of ecological and economic dimensions, the long-term resilience of a system, and the consideration of both extensive and intensive properties [50].

4.2. Uncertainty Analysis of the Three Models

DPSIR is a multi-criteria decision-making (MCDM) method that integrates economic, social, and natural systems into a systematic approach. For sustainability assessment based on indicators, its uncertainty partially derives from the indicator selection and weight determination. There are a number of methods for indicator weight determination, such as the analytic hierarchy process (AHP), entropy-weight method, principal component analysis (PCA), and data envelopment analysis (DEA), as well as a combination of these methods for a more reasonable indicator of the weight. The selection of different methods is likely to increase the uncertainty of the assessment results. In contrast, weaknesses, such as focusing on the causal chain, rather than addressing complex interrelationships in the real world and ignoring temporal and spatial scale issues have also been areas of criticism for the DPSIR model [51].
The EF model is based on the comparison of “consumption” versus “resources” to identify the sustainable status of the research objectives. It has been used extensively by numerous societies and the scientific community mainly due to its easy-to-understand manner of expressing the final results: hectares of land. The EF model has also been simultaneously criticized for its simplicity and non-use of sub-indicators. The equivalence and yield factors are important parameters in the EF model and their accuracy directly affects the reliability of the calculation. The localization of the two parameters can better reflect the true status of regional agricultural sustainable development. However, one evident imperfection in the EF model is the minimal use of information associated with the sustainability [48].
The ability to assess energy, matter, and information in equal terms renders EMA an attractive tool to perform sustainability evaluation of all types of systems. However, its acceptance still faces several challenges and criticism. A database with transformity values is not available, such that different studies assume different transformity values for the same resource [50]. The EMA model also presents other limitations to its use, some of which are intrinsic to its nature. The ESI prefers more renewable resources input, such as rain, wind, and sun, which are essential for agricultural production and natural vegetation to perform photosynthesis. However, the current monetary market does not account for these resources, as they are considered free and have not yet reached the status of scarcity [49]. The EMA model also ignores the differences in the scientific and technological levels, and land productivity, such as the education level of the labor force and technological investments in crop seeds [52]. Moreover, emergy analysts have recently devalued the importance of uncertainty analysis in the EMA model, which will inevitably impact its validity [53].
Another weakness of these three models is that none of them considered different resources used in agriculture, e.g., botanical pesticides or chemical pesticides, organic fertilizers, or synthetic fertilizers. The different ways of producing these sources may influence the agricultural impact on environment. Organic agriculture has often been promoted as more sustainable than conventional agriculture [5]. Additionally, all the three approaches fail to quantify the indirect effects of agricultural impacts. E.g., water pollution by chemical pesticides, global greenhouse gas (GHG) emissions, and freshwater eutrophication result from excessive use of chemical fertilizers [3]. These indirect factors affect the sustainability of the agroecosystem.

4.3. Adaptability Analysis of the Three Models

Existing studies on agricultural sustainability assessments in the YRDUA indicate that, compared with Anhui Province, Zhejiang, Jiangsu, and Shanghai provinces had relatively high overall levels of agricultural sustainability [54,55], which is consistent with assessment results of the EF and DPSIR models. The Zhejiang Academy of Agricultural Sciences has evaluated the agricultural modernization level of all cities in Zhejiang based on the Evaluation Index System of Agricultural Modernization, whose results showed that Huzhou had the highest level of agricultural modernization and sustainable development, which is similar to the results obtained by the three models applied in this study. However, the relative level of agricultural sustainability of each city in Zhejiang is more similar to the assessments obtained by the DPSIR model [56].
In this study, various effects were employed to improve the accuracy of the three models and reduce uncertainties from the models themselves. For the EMA model, the calculations reported in Brown [42] for global renewable resources was utilized to prevent double counting; all UEVs were transferred based on the latest emergy baseline of 12.0 × 1024 sej y–1. However, the EMA model fails to consider some important variables, including stakeholders, agricultural science, technology input, and government policy, among others [48]. For the EF model, a component-based method was adopted to derive the footprint values, which is a “bottom-up” analytical approach that can better reflect the consumption of the agricultural practice. Compared with the traditional compound method, which uses regional per capita ecological footprint data, the application of the direct component approach is more suitable for the assessment of the agricultural EF, especially considering that Shanghai and Zhejiang are the main grain-consuming areas in China; these areas have, on average, above a 30% gap in the grain supply–demand balance [57]. Therefore, per capita food consumption cannot effectively reflect the EF and environmental pressure faced by an agroecosystem. However, there are still some deficiencies in the EF model in this study. Considering the limitations of data availability, we were unable to calculate a large number of EFs, including the agricultural labor consumption, GHG emissions, and livestock fecal production, which will lead to a slight decrease in the EF value.
Agricultural sustainability is a fundamentally multi-dimensional concept determined by various factors, e.g., cultivated land quality, agricultural science and technology, stakeholders, and societal demands [58,59]. The DPSIR model accounts for more aspects related to the sustainable development of agriculture. DPSIR also allows decision makers to adjust the weights of indicators, which renders it more applicable to different research purposes. In addition, government departments prefer to apply indicators to set sustainable goals for subordinate departments in China; therefore, the DPSIR model based on multi-indicators has better performance with respect to policy guidance and decision-making.
Considering the available data, methodologies, assessment results, and significance for policy makers obtained in this study, we suggest that all three tools provide indicators that reveal the agroecosystem performance for different aspects. However, the DPSIR model can better represent the level and ranking of the agricultural sustainability of cities in the YRDUA, while the EF and EMA models are effective supplements for interpretations of the agroecosystem status. For example, the EF model indicated that the agricultural EF of most cities exceeds their ecological carrying capacity, which is manifested as an ecological deficit. The EMA model showed that the ELR of some cities exceeded the threshold value; their agroecosystems face serious environmental pressure. The EYR of economically developed cities was relatively low, which indicated that there is no comparative advantage in terms of agricultural investment and market competitiveness in those cities.
Finally, several limitations in this study require further interpretation. (1) The majority of the raw data applied for the calculations was derived from official statistical data from various provinces and cities; the accuracy of these data has a direct influence on the results of each model. (2) In the calculation of the DPSIR model, we simply adopted a minimum relative information entropy method to determine the combined weight of the subjective and objective evaluation method, failing to provide further discussion on other weight combination methods. (3) Only static panel data for 2016 were assessed for the agroecosystems; we did not include a time-series analysis, such that we did not provide observations of the trends in agricultural sustainability in the YRDUA.

5. Conclusions

The DPSIR, EF, and EMA models were applied in the present study to assess the agricultural sustainability in the YRDUA. We then conducted a comparative analysis of the three models. Based on this, the suitability and uncertainty of each model were discussed. The DPSIR and EF models have better consistency at reflecting agricultural sustainability, with a Pearson correlation coefficient of 0.71. Specifically, compared with Shanghai and Anhui, Zhejiang and Jiangsu showed a high overall level of agricultural sustainability. While, the EMA model yielded different results, the ranking of the agricultural sustainability was Jiangsu, Anhui, Shanghai, and Zhejiang. However, all three models showed partial consistency at reflecting the relative level of agricultural sustainable development of cities in the same province: Huzhou in Zhejiang Province and Ma’anshan in Anhui Province had the highest value in their respective provinces, but this regularity was not significant. Additionally, the cluster analysis based on the natural break method also reveal similar results. The DPSIR model can better reflect the relative level of agricultural sustainable development in the study area, while the EF and EMA models are effective supplements for the interpretation of regional agricultural sustainability.
Based on the observations, following recommendations can be provided to improve the sustainable development of agriculture in the YRDUA. (1) A collaborative and integrated platform should be built to utilize the agricultural comparison superiority and optimize the allocation of agricultural production factors in the YRDUA, especially the integration and complementarity of superiority between labor forces, cultivated land resources in Anhui and Subei, advanced agricultural technology, and capital markets in Zhejiang and Shanghai. (2) Over the past decade, the high input of industrial auxiliary energy to obtain a high yield has resulted in increasingly severe environmental problems; comprehensive measures should be taken to prevent damages. All measures, including the implementation of zero-growth action in terms of chemical fertilizers and pesticides, control of agricultural non-point source pollution, and restoration of contaminated farmland, will benefit the sustainability and resilience of the agroecosystem. (3) Agricultural science and technology are fundamental for modern agricultural production; propelling innovation-driven development to improve modern agriculture is of great significance, including agricultural water-saving irrigation technology, soil testing, formula fertilization, and crop straw resource utilization, among others. (4) Cultivated land resources are the basis of agricultural sustainability. However, the rapid urbanization of the YRDUA has led to conflicts in ecological–production–living spaces, with cultivated land largely occupied by artificial surfaces. Therefore, we must urgently take action to protect cultivated land.

Author Contributions

Conceptualization, X.G.; methodology, X.G.; software, X.G. and D.Z.; validation, X.G., D.Z., and C.L.; formal analysis, X.G. and C.L.; investigation, X.G. and Y.L.; resources, X.G. and Y.L.; data curation, X.G. and D.Z.; writing—original draft preparation, X.G.; writing—review and editing, X.G. and X.W.; visualization, X.G. and D.Z.; supervision, X.W.; project administration, Y.L. and J.H.; funding acquisition, X.W. All authors have read and agreed to the published version of the manuscript.

Funding

This research was funded by the National Key Research and Development Program of China (grant numbers 2016YFC0502705); and the National Social Science Major Foundation of China (grant number 14ZDB140).

Informed Consent Statement

Informed consent was obtained from all subjects involved in the study.

Data Availability Statement

The data presented in this study are available on request from the corresponding author. The data are not publicly available due to restrictions on right of privacy.

Acknowledgments

Acknowledgement for the land use rater maps data support from “National Earth System Science Data Sharing Infrastructure, National Science and Technology Infrastructure of China (http://www.geodata.cn)”.

Conflicts of Interest

The authors declare no conflict of interest.

References

  1. Shah, S.M.; Liu, G.; Yang, Q.; Wang, X.; Casazza, M.; Agostinho, F.; Lombardi, G.V.; Giannetti, B.F. Emergy-based valuation of agriculture ecosystem services and dis-services. J. Clean. Prod. 2019, 239, 1–7. [Google Scholar] [CrossRef]
  2. Tilman, D.; Cassman, K.G.; Matson, P.A.; Naylor, R.; Polasky, S. Agricultural sustainability and intensive production practices. Nature 2002, 418, 671–677. [Google Scholar] [CrossRef] [PubMed]
  3. Tilman, D.; Balzer, C.; Hill, A.; Befort, B.L. Global food demand and the sustainable intensification of agriculture. Proc. Natl. Acad. Sci. USA 2011, 108, 20260–20264. [Google Scholar] [CrossRef] [PubMed] [Green Version]
  4. Godfray, H.C.J.; Beddington, J.R.; Crute, I.R.; Haddad, L.; Lawrence, D.; Muir, J.F.; Pretty, J.; Robinson, S.; Thomas, S.M.; Toulmin, C. Food security: The challenge of feeding 9 billion people. Science 2010, 327, 812–818. [Google Scholar] [CrossRef] [PubMed] [Green Version]
  5. Wang, Q.; Ma, Z.; Ma, Q.; Liu, M.; Yuan, X.; Mu, R.; Zuo, J.; Zhang, J.; Wang, S. Comprehensive evaluation and optimization of agricultural system: An emergy approach. Ecol. Indic. 2019, 107, 1–8. [Google Scholar] [CrossRef]
  6. Jia, H. Agriculture: Science and technology safeguard sustainability. Natl. Sci. Rev. 2019, 6, 595–600. [Google Scholar] [CrossRef]
  7. Quintero-Angel, M.; González-Acevedo, A. Tendencies and challenges for the assessment of agricultural sustainability. Agric. Ecosyst. Environ. 2018, 254, 273–281. [Google Scholar] [CrossRef]
  8. Binder, C.R.; Feola, G.; Steinberger, J.K. Considering the normative, systemic and procedural dimensions in indicator-based sustainability assessments in agriculture. Environ. Impact Assess. Rev. 2010, 30, 71–81. [Google Scholar] [CrossRef]
  9. Soldi, A.; Meza, M.J.A.; Guareschi, M.; Donati, M.; Ortiz, A.I. Sustainability Assessment of Agricultural Systems in Paraguay: A Comparative Study Using FAO’s SAFA Framework. Sustainability. 2019, 11, 3745. [Google Scholar] [CrossRef] [Green Version]
  10. Calleros-Islas, A. Sustainability assessment. An adaptive low-input tool applied to the management of agroecosystems in México. Ecol. Indic. 2019, 105, 386–397. [Google Scholar] [CrossRef]
  11. Van Cauwenbergh, N.; Biala, K.; Bielders, C.; Brouckaert, V.; Franchois, L.; Cidad, V.G.; Hermy, M.; Mathijs, E.; Muys, B.; Reijnders, J.; et al. SAFE—A hierarchical framework for assessing the sustainability of agricultural systems. Agric. Ecosyst. Environ. 2007, 120, 229–242. [Google Scholar] [CrossRef]
  12. OECD. Environmental Indicators—Development, Measurement and Use; Organisation of Economic Co-operation and Development: Paris, France, 2003. [Google Scholar]
  13. Niemeijer, D.; De Groot, R.S. Framing environmental indicators: Moving from causal chains to causal networks. Environ. Dev. Sustain. 2006, 10, 89–106. [Google Scholar] [CrossRef]
  14. Wen, S.; Wen, X.; An, Y. Analysis of Sustainability of the Dryland Farming with Limited Irrigation Based on DPSIR Model in Tongxin, Ningxia Hui Autonomous Region. Res. Soil Water Conserv. 2011, 18, 231–236. [Google Scholar]
  15. Binimelis, R.; Monterroso, I.; Rodríguez-Labajos, B. Catalan agriculture and genetically modified organisms (GMOs)—An application of DPSIR model. Ecol. Econ. 2010, 69, 55–62. [Google Scholar] [CrossRef]
  16. Chen, W.; Geng, Y.; Dong, H.; Tian, X.; Zhong, S.; Wu, Q.; Xu, Y.; Zhang, Q.; Li, S. An emergy accounting based regional sustainability evaluation: A case of Qinghai in China. Ecol. Indic. 2018, 88, 152–160. [Google Scholar] [CrossRef]
  17. Odum, H.T. Emergy and Decision Making; John Wiley: New York, NY, USA, 1996. [Google Scholar]
  18. Scienceman, D.M. Letters to the editor: Emergy definition. Ecol. Eng. 1997, 9, 209–212. [Google Scholar]
  19. Skaf, L.; Buonocore, E.; Dumontet, S.; Capone, R.; Franzese, P.P. Food security and sustainable agriculture in Lebanon: An environmental accounting framework. J. Clean. Prod. 2019, 209, 1025–1032. [Google Scholar] [CrossRef]
  20. Zhao, H.; Zhai, X.; Guo, L.; Liu, K.; Huang, D.; Yang, Y.; Li, J.; Xie, S.; Zhang, C.; Tang, S.; et al. Assessing the efficiency and sustainability of wheat production systems in different climate zones in China using emergy analysis. J. Clean. Prod. 2019, 235, 724–732. [Google Scholar] [CrossRef]
  21. Wackernagel, M. Our Ecological Footprint: Reducing Human Impact on the Earth; New Society Publishers: Gabriola Island, BC, Canada, 1996. [Google Scholar]
  22. Passeri, N.; Borucke, M.; Blasi, E.; Franco, S.; Lazarus, E. The influence of farming technique on cropland: A new approach for the Ecological Footprint. Ecol. Indic. 2013, 29, 1–5. [Google Scholar] [CrossRef]
  23. Passeri, N.; Blasi, E.; Franco, S.; Martella, A.; Pancino, B.; Cicatiello, C. The environmental sustainability of national cropping systems: From assessment to policy impact evaluation. Land Use Policy 2016, 57, 305–312. [Google Scholar] [CrossRef]
  24. Li, M.; Zhou, Y.; Wang, Y.; Singh, V.P.; Li, Z.; Li, Y. An ecological footprint approach for cropland use sustainability based on multi-objective optimization modelling. J. Environ. Manag. 2020, 273, 1–13. [Google Scholar] [CrossRef] [PubMed]
  25. Wang, J.; Hao, J.; Chen, A.; Wang, N. Supply and demand banlance of ecological carrying capacitu in provincial arable land of China. J. China Agric. Univ. 2019, 24, 146–155. [Google Scholar]
  26. Shi, K.; Diao, C.; Sun, X.; Zuo, T. Ecological balance between supply and demand in Chongqing City based on cultivated land ecological footprint method. Acta Ecol. Sin. 2013, 33, 1872–1880. [Google Scholar] [CrossRef]
  27. Liu, M.; Li, W.; Xie, G. Estimation of China ecological footprint production coefficient based on net primary productivity. Chin. Acad. Sci. 2010, 29, 592–597. [Google Scholar]
  28. Wang, C.; Zhang, S.; Yan, W.; Wang, R.; Liu, J.; Wang, Y. Evaluating renewable natural resources flow and net primary productivity with a GIS-Emergy approach: A case study of Hokkaido, Japan. Sci. Rep. 2016, 6, 1–7. [Google Scholar] [CrossRef] [PubMed] [Green Version]
  29. Lin, Y.C.; Huang, S.L.; Budd, W.W. Assessing the environmental impacts of high-altitude agriculture in Taiwan: A Driver-Pressure-State-Impact-Response (DPSIR) framework and spatial emergy synthesis. Ecol. Indic. 2013, 32, 42–50. [Google Scholar] [CrossRef]
  30. Zhao, S.; Li, Z.; Li, W. A modified method of ecological footprint calculation and its application. Ecol. Model. 2004, 185, 65–75. [Google Scholar] [CrossRef]
  31. Talukder, B.; Blay-Palmer, A.; Hipel, K.W.; VanLoon, G.W. Elimination method of multi-criteria decision analysis (MCDA): A simple methodological approach for assessing agricultural sustainability. Sustainability 2017, 9, 287. [Google Scholar] [CrossRef] [Green Version]
  32. De Olde, E.M.; Moller, H.; Marchand, F.; McDowell, R.W.; MacLeod, C.J.; Sautier, M.; Halloy, S.; Barber, A.; Benge, J.; Bockstaller, C.; et al. When experts disagree: The need to rethink indicator selection for assessing sustainability of agriculture. Environ. Dev. Sustain. 2017, 19, 1327–1342. [Google Scholar] [CrossRef] [Green Version]
  33. Wang, W.; Sun, Y.; Wu, J. Environmental warning system based on the DPSIR model: A practical and concise method for environmental assessment. Sustainability 2018, 10, 1728. [Google Scholar] [CrossRef] [Green Version]
  34. Zhang, D.; Wang, X.; Qu, L.; Li, S.; Lin, Y.; Yao, R.; Zhou, X.; Li, J. Land use/cover predictions incorporating ecological security for the Yangtze River Delta region, China. Ecol. Indic. 2020, 119, 1–11. [Google Scholar] [CrossRef]
  35. Wang, Y.; Ding, Q.; Zhuang, D. An eco-city evaluation method based on spatial analysis technology: A case study of Jiangsu Province, China. Ecol. Indic. 2015, 58, 37–46. [Google Scholar] [CrossRef]
  36. Hoang, H.T.T.; Truong, Q.H.; Nguyen, A.T.; Hens, L. Multicriteria evaluation of tourism potential in the central highlands of vietnam: Combining geographic information system (GIS), analytic hierarchy process (AHP) and principal component analysis (PCA). Sustainability 2018, 10, 3097. [Google Scholar] [CrossRef] [Green Version]
  37. Delgado, A.; Romero, I. Environmental conflict analysis using an integrated grey clustering and entropy-weight method: A case study of a mining project in Peru. Environ. Model. Softw. 2016, 77, 108–121. [Google Scholar] [CrossRef]
  38. Li, S.; Wei, H.; Ni, X.; Gu, Y.W.; Li, C. Evaluation of urban human settlement quality in Ningxia based on AHP and the entropy method. Chin. J. Appl. Ecol. 2014, 25, 2700–2708. [Google Scholar]
  39. Simmons, C.; Lewis, K.; Barrett, J. Two feet-two approaches: A component based model of ecological footprinting. Ecol. Econ. 2000, 32, 375–380. [Google Scholar]
  40. Liu, Y.; Ma, Y. Progress and outlook of agricultural ecological footprints. Chin. J. Eco-Agric. 2019, 27, 1115–1123. [Google Scholar]
  41. Liu, G.; Yang, Z. Emergy Theory and Practice: Ecological Economic Accounting and Urban Green Management; Science Press: Beijing, China, 2018; pp. 363–372. [Google Scholar]
  42. Brown, M.T.; Ulgiati, S. Emergy assessment of global renewable sources. Ecol. Model. 2015, 339, 148–156. [Google Scholar] [CrossRef] [Green Version]
  43. Li, S.; Fu, X.; Zheng, D. Emergy analysis for evaluating sustainability of Chinese economy. J. Nat. Resour. 2001, 4, 287–294. [Google Scholar]
  44. Duan, Y.; Liu, Y.; Liu, X.; Wang, H. Identification of polycentric urban structure of central chongqing using points of interest big data. J. Nat. Resour. 2018, 33, 788–800. [Google Scholar]
  45. Yang, Q. The Research of Gansu Agricultural Ecosystem Sustainable Development on the Base of Emergy Theory and Model of Ecological Footprint; Gansu Agricultural University: Gansu, China, 2013. [Google Scholar]
  46. Yuan, H. Research of Regional Sustainable DeveloPment Based on the Emergy Theory and Eeological Footprint Model-Taking Wanzhou District of Chongqing as an Example. Master’s Thesis, Southwest University, Chongqing, China, 2011. [Google Scholar]
  47. Nakajima, E.S.; Ortega, E. Carrying capacity using emergy and a new calculation of the ecological footprint. Ecol. Indic. 2016, 60, 1200–1207. [Google Scholar] [CrossRef]
  48. Siche, J.; Agostinho, F.; Ortega, E.; Romeiro, A. Sustainability of nations by indices: Comparative study between environmental sustainability index, ecological footprint and the emergy performance indices. Ecol. Econ. 2008, 66, 628–637. [Google Scholar] [CrossRef]
  49. Agostinho, F.; Pereira, L. Support area as an indicator of environmental load: Comparison between embodied energy, ecological footprint, and emergy accounting methods. Ecol. Indic. 2013, 24, 494–503. [Google Scholar] [CrossRef]
  50. Kharrazi, A.; Kraines, S.; Hoang, L.; Yarime, M. Advancing quantification methods of sustainability: A critical examination emergy, exergy, ecological footprint, and ecological information-based approaches. Ecol. Indic. 2014, 37, 81–89. [Google Scholar] [CrossRef]
  51. Hou, Y.; Zhou, S.; Burkhard, B.; Müller, F. Socioeconomic influences on biodiversity, ecosystem services and human well-being: A quantitative application of the DPSIR model in Jiangsu, China. Sci. Total. Environ. 2014, 490, 1012–1028. [Google Scholar] [CrossRef]
  52. Cao, J.; Li, H.; Yang, J.; Zhang, Q. Comparison of sustainable development status in Hubei Provice based on traditional ecological footprint method and emerfy ecological footprint method. J. Hubei Univ. (Nat. Sci.) 2011, 33, 313–317. [Google Scholar]
  53. Amaral, L.P.; Martins, N.; Gouveia, J.B. A review of emergy theory, its application and latest developments. Renew. Sustain. Energy Rev. 2016, 54, 882–890. [Google Scholar] [CrossRef]
  54. Zhang, L.; Bao, B.; Yang, S. Spatial exploratory analysis of agricultural sustainable development in China. Econ. Geogr. 2019, 39, 159–164. [Google Scholar]
  55. Luo, Q.; Tang, Q.; Liu, Y.; Gao, M.; Ma, L. Construction of index system evaluating agricultural sustainable development in China. Chin. Agric. Sci. Bull. 2017, 33, 158–164. [Google Scholar]
  56. Agricultural Modernization Process and Development Level of Huzhou Rank First for 5 Consecutive Years in Zhejiang Province. Available online: https://m.sohu.com/a/270519176_167432 (accessed on 23 October 2018).
  57. Yang, D.; Jiang, H. Food security of main grain sales regions in China-based on a gap in balance between grain supply and demand. J. Agric. Sci. Technol. 2017, 19, 1–9. [Google Scholar]
  58. Mili, S.; Martínez-Vega, J. Accounting for regional heterogeneity of agricultural sustainability in Spain. Sustainability 2019, 11, 299. [Google Scholar] [CrossRef] [Green Version]
  59. Hubeau, M.; Marchand, F.; Coteur, I.; Mondelaers, K.; Debruyne, L.; Van Huylenbroeck, G. A new agri-food systems sustainability approach to identify shared transformation pathways towards sustainability. Ecol. Econ. 2017, 131, 12. [Google Scholar] [CrossRef]
Figure 1. Location and land use pattern of the Yangtze River Delta Urban Agglomeration (YRDUA) in 2020.
Sustainability 13 00121 g001
Figure 2. Emergy system diagram of the agroecosystem.
Sustainability 13 00121 g002
Figure 3. Agricultural sustainability assessment based on Driver–Pressure–State–Impact–Response (DPSIR) model in the Yangtze River Delta Urban Agglomeration (YRDUA).
Sustainability 13 00121 g003
Figure 4. Scoring of evaluation factors in criterion layer by Driver–Pressure–State–Impact–Response (DPSIR) model.
Sustainability 13 00121 g004
Figure 5. Ecological footprint and carrying capacity analysis of agroecosystem in the Yangtze River Delta Urban Agglomeration (YRDUA).
Sustainability 13 00121 g005
Figure 6. Agricultural sustainability evaluation based on ecological footprint (EF) model in the Yangtze River Delta Urban Agglomeration (YRDUA).
Sustainability 13 00121 g006
Figure 7. Emergy-based indicators analysis of agroecosystem in the Yangtze River Delta Urban Agglomeration (YRDUA).
Sustainability 13 00121 g007
Figure 8. Agricultural sustainability evaluation based on emergy analysis (EMA) model in the Yangtze River Delta Urban Agglomeration (YRDUA).
Sustainability 13 00121 g008
Figure 9. Result comparison of agricultural sustainability evaluation based on multi-model in the Yangtze River Delta Urban Agglomeration (YRDUA).
Sustainability 13 00121 g009
Figure 10. Clustering analysis of multi-model evaluation results based on natural break point method; Note: “Low” means low level of agricultural sustainability; “High” means high level of agricultural sustainability; Driver–Pressure–State–Impact–Response (DPSIR) model; ecological footprint (EF) model; emergy analysis (EMA) model.
Sustainability 13 00121 g010
Table 1. Application of Driver–Pressure–State–Impact–Response (DPSIR) model to agricultural sustainability assessment in the Yangtze River Delta Urban Agglomeration (YRDUA).
Target LayerCriterion LayerIndicator LayerCombined Weight
Agricultural sustainability assessment of the YRDUADriver (D)1Natural population growth rate (%)0.0247
2Urbanization level (%)0.0298
3Disposable income between urban and rural residents (%)0.0354
4Per capita grain possession (kg)0.0343
Pressure (P)5Level of fertilizer use (kg ha−1)0.0510
6Consumption of pesticides (kg ha−1)0.0583
7Plastics film for agricultural use (kg ha−1)0.0546
8Agricultural water consumption (m3 ha−1)0.0440
9Electricity consumption of per unit of agricultural added value (Kwh yuan−1)0.0354
State (S)10Per capita area of cultivated land (ha per−1)0.0282
11Multiple cropping index (%)0.0399
12Area ratio of high and medium quality of cultivated land (%)0.0641
13Effective utilization coefficient of irrigation water (%)0.0361
14Forest coverage rate of city (%)0.0423
Impact (I)15Grain production of per unit area of cultivated land (kg ha−1)0.0412
16Agricultural added value of per unit area of cultivated land (yuan ha−1)0.0447
17Agricultural value added of per labor (yuan per−1)0.0515
18Farmland abandonment (%)0.0331
Response (R)19Total power of agricultural machinery (Kw ha−1)0.0307
20Rate of cultivated land using water-saving irrigation (%)0.0469
21Application of facility agriculture (%)0.0536
22Level of large-scale modern agriculture (%)0.0454
23Quality of agricultural labor (%)0.0412
24Proportion of R&D investment in agriculture (%)0.0335
Table 2. Test of random consistency.
Criterion LayerDriving LayerPressure LayerState LayerImpact LayerResponse Layer
n 545546
R I 1.120.891.121.120.891.26
C R 0.0040.0030.0120.0740.0090.038
Note: CI is the consistency index; RI is the random index; CR is the consistency ratio, which is used to determine the consistency of the judgment matrix, a CR value of 0.1 or less is considered acceptable; n is the number of indicators.
Table 3. Evaluation criteria for the ecological carrying capacity supply and demand balance for the agroecosystem in the Yangtze River Delta Urban Agglomeration (YRDUA).
TypesAgroecosystem Ecological Carrying SituationEI
Agroecosystem ecological affluentAffluent1.1 < EI
Agroecosystem ecological balanceBalance1 < EI ≤ 1.1
Deficit0.9 < EI ≤ 1.0
Agroecosystem ecological deficitOverload0.7 < EI ≤ 0.9
Severe overloadEI ≤ 0.7
Note: EI is the ecological supply and demand balance index.
Table 4. Emergy analysis table of agroecosystem in the Yangtze River Delta Urban Agglomeration (YRDUA).
ItemsUnitUEV (sej/unit)References for UEV
Global Tripartite
1 Solar emergyj1.00 × 100(Odum, 1996)
2 Earth cycle emergyj4.90 × 103(Odum, 1996)
Sum of Tripartite
Secondary and Tertiary Sources
3 Rain chemical emergyj2.31 × 104(Odum, 1996)
4 Rain geopotential emergyj1.33 × 104(Odum, 1996)
5 Wind emergyj1.24 × 103(Odum, 1996)
Largest of 2nd and 3rd
Renewable Input (R, locally available)
Nonrenewable Input (N0, locally available)
6 Topsoil lossesj9.40 × 104(Brown and Bardi, 2001)
Purchased Renewable Resources (FR)
7 Human labor (10%)sej/h5.72 × 1013(Liu, 2018)
8 Irrigating watersej/kg2.13 × 104(Liu, 2018)
9 Seedg9.07 × 108Coppola(2009)
Subtotal
Purchased Nonrenewable Resources (FN)
10 Human labor (90%)sej/h5.72 × 1013(Liu, 2018)
11 Electricityj2.21 × 105(Liu, 2018)
12 Nitrogen fertilizerg4.83 × 109(Odum, 1996)
13 Phosphate fertilizerg4.95 × 109(Odum, 1996)
14 Potash fertilizerg1.40 × 109(Odum, 1996)
15 Compound fertilizerg3.56 × 109(Odum, 1996)
16 Plastic sheetingg4.83 × 108(Brown and Bardi, 2001)
17 Dieselj8.38 × 104(Odum, 1996)
18 Pesticideg2.03 × 109Lan et al., 2002
19 Capital investment¥9.23 × 10¹¹Zhao et al. (2019)
Subtotal
Output (E)
21 Paddy ricej4.56 × 104Lan et al., 2002
22 Cornj2.70 × 104Ulgiati et al. (1993)
23 Wheatj6.80 × 104Lu et al. (2010)
24 Soybeanj8.30 × 104Ulgiati et al. (1993)
25 Potatoj8.30 × 104Lu et al. (2010)
26 Peanutj8.60 × 104Ulgiati et al. (1993)
27 Rapeseedj8.60 × 104Ulgiati et al. (1993)
29 Cottonj1.90 × 104Ulgiati et al. (1993)
30 Vegetablesj2.70 × 104Lu et al. (2010)
Subtotal
Wastes Emergy (W)
31 Rice strawj4.96 × 104Sui et al. (2006)
32 Corn stalkj4.96 × 104Sui et al. (2006)
33 Wheat stemj4.96 × 104Sui et al. (2006)
34 Soybean stemj4.96 × 104Sui et al. (2006)
35 Rape stemj4.96 × 104Sui et al. (2006)
Subtotal
Table 5. Emergy evaluation indicator system of the agroecosystem.
Emergy IndicatorsEvaluation ExpressionMeaning
Local renewable environmental resourcesRRenewable emergy flows from local resources, such as sunlight, rain, wind, and so on
Local nonrenewable environmental resourcesN0Slow-renewable resources used in a nonrenewable manner such as soil
Purchased renewable resourcesFRRenewable resources and service from artificial input
Purchased nonrenewable resourcesFNNonrenewable resources from artificial input
Total energy inputU = R + N0 + FR + FNEmergy flows of total input
Total energy outputY = E + WTotal energy of products
Emergy yield ratioEYR = Y/(FR + FN)A measure of ecological benefits of agricultural system
Environmental loading rationELR = (N0 + FN)/(R + FR)A measure of the potential stress of the agricultural system on the local environment
Emergy sustainability indexESI = EYR/ELRA measure of the sustainability of the production system
Table 6. Pearson correlation analysis of the results by multi-model.
DPSIR ModelEF ModelEMA Model
DPSIR model1.00 --
EF model0.71 (P < 0.01)1.00-
EMA model0.25 (P = 0.902 > 0.05)−0.28 (P = 0.151 > 0.05)1.00
Note: Driver–Pressure–State–Impact–Response (DPSIR) model; ecological footprint (EF) model; emergy analysis (EMA) model.
Publisher’s Note: MDPI stays neutral with regard to jurisdictional claims in published maps and institutional affiliations.

