Article

Hysteretic Behavior of Reinforced Concrete Coupling Beams According to Volume Fraction of Steel Fiber

1
Department of Architecture, Sahmyook University, Seoul 01795, Korea
2
Department of Architectural Engineering, Hanyang University, Seoul 04763, Korea
3
Department of Digital Architectural and Urban Engineering, Hanyang Cyber University, Seoul 04763, Korea
*
Author to whom correspondence should be addressed.
Sustainability 2021, 13(1), 182; https://doi.org/10.3390/su13010182
Submission received: 16 November 2020 / Revised: 21 December 2020 / Accepted: 23 December 2020 / Published: 27 December 2020

Abstract

:
The purpose of this study was to evaluate the structural performance of steel fiber reinforced concrete (SFRC) coupling beams. Reversed cyclic loading tests were performed with full-scale specimens. The main variable for the tests was the volume fraction ratio of the steel fibers. The results showed that the maximum strength was increased by about 11% with 1% of steel fibers incorporated, and about 24% when the ratio of mixed fibers was doubled to 2%. Because numerous microcracks occurred, decreased crack width due to the bridge effect was observed with the steel fiber reinforcement. Increased diagonal tension crack angles and energy dissipation also appeared as the volume fraction of steel fibers increased. The contribution of shear to the total deformation was decreased while the contribution of rocking was increased as steel fibers were added. Considering the results of these experiments, it can be concluded that steel fiber reinforcement affects the deformation of coupling beams in various ways, and should be considered when estimating the effective stiffness of such beams when SFRC is introduced.

1. Introduction

Shear wall systems with reinforced concrete can effectively resist lateral loads, such as wind loads and seismic loads, and are widely adopted in high-rise buildings due to their high stiffness. However, because of their mechanical or architectural components, the introduction of such systems can lead to the occurrence of openings, which in turn can require the implementation of coupled shear walls that have to be interconnected with coupling beams to transfer the load [1].
Figure 1 shows the behavior of various coupled shear wall systems from their boundary conditions with coupling beams. When a wall and beam are connected with a pin, as in Figure 1a, each wall member resists the lateral load through cantilever behavior. Hence, the stress is imposed on each wall member individually and the position of the neutral axis is the center of each wall. In the case of a fixed connection, as in Figure 1b, the system behaves as a single cantilever member, resisting exterior moment. In this case, stress is distributed linearly through the whole coupled shear wall. Although the coupling beam is designed to interconnect both walls and is expected to behave as a single member, in the actual case shown in Figure 1c, a mid-level behavior appears because a perfectly fixed connection cannot be achieved. Therefore, if the coupling beam has sufficient stiffness when the same lateral load is applied to the coupled shear wall system, less stress is applied to the coupled wall than the system in which the wall and the beam are connected with pins and it has greater resistance to lateral load.
Given that the coupling beam interconnects two wall members, this produces great inelastic displacement. Hence, sufficient ductility and strength must be secured. Paulay [2,3] argued that if the aspect ratio is <2 in a coupling beam, sliding shear or diagonal tension failure can occur, which leads to brittle behavior. Further research on coupling beams with diagonal reinforcement was done by Paulay and Binney [4], who achieved enhanced stiffness and ductility of coupling beams by fixing two intersecting groups of diagonally placed bars. Additionally, the difference in structural performance between diagonally reinforced coupling beams and conventional coupling beams has been demonstrated by Tassios et al. [5] and Galano et al. [6].
However, coupling beams with diagonal reinforcement details are difficult to construct due to interference between the transverse reinforcement and the cross tie. Moreover, according to Seo et al. [7], diagonally reinforced coupling beams should be adopted only in structures that require high transformability; conventional details are appropriate for other cases.
Recently, to secure structural performance while improving the constructability of diagonally reinforced coupling beams, several researchers have applied high-performance concrete to the coupling beams rather than improving the existing reinforcement details. According to Kwon et al. [8], coupling beams with high-performance fiber-reinforced cementitious composites (HPFRCC) can not only replace transverse reinforcement but also improve the strength of the coupling beams. A study by Park et al. [9] used 0.75% steel fibers instead of inner ties to help improve the maximum strength and the chord rotation level at which the maximum strength was reached was brought forward. According to Gaochuang Cai et al. [10], test results showed that those ratios and the aspect ratio of the coupling beam had an effect on the shear strength of the conventionally reinforced coupling beams, and flexural failure occurred when the volume fraction ratio was 2.5% or the aspect ratio was ≥2.5. Lequesne et al. [11] performed reversed cyclic loading tests by fabricating two large-scale four-story specimens for coupling beams and walls using high-performance fiber-reinforced concrete (HPFRC). As a result of the test, the specimen using the HPFRC coupling beam showed higher curvature than that of the RC wall. In addition, shear distortion was relatively decreased for fiber-reinforced concrete.
Steel fiber reinforced concrete (SFRC) has high strength and ductility under tensile stress. Accordingly, for the past 20 years, research on applying steel fiber to reinforced concrete members has been actively conducted. ACI 318 [12] purposed that SFRC can replace the minimum shear reinforcement of beams, but the applicable range is still limited. Since SFRC has higher shear strength and ductility, it is expected to improve strength and ductility when applied to conventional coupling beams. However, most of these studies were on improving the conventional details of diagonally reinforced coupling beams and comparing their structural performance. Since relatively little research exists about the performance improvement of conventional coupling beams, this paper assesses the structural performance improvement of conventional coupling beams with steel fiber reinforcement.

2. Experimental Program

2.1. Test Plan and Specimen Design

The purpose of this study was to assess the structural performance of SFRC coupling beams. The main variable parameter was set as the volume fraction of steel fibers, and three specimens were made to perform the experiment. The size of the specimens was 300 mm × 600 mm × 900 mm, which is the same size of coupling beams applied in actual buildings. The aspect ratio was specified as 1.5 so as not to exceed 2.0, which is the standard-mandated limit of diagonal reinforcements.
The current design standard requires minimum transverse reinforcement spacing, as given in Equation (1) [12,13], to maintain an appropriate confinement effect of transverse reinforcement for coupling beams. We decided to follow the standard and to verify the reinforcing effect of the steel fiber. The nominal shear stress was designed as 0.53 f c k b w d , which exceeded the minimum of 0.33 f c k b w d for applying diagonal reinforcement.
S max = min [ d 4 ,   8 d l ,   24 d t ,   300 ]  
According to ACI 544.4R-88 [14], the volume fraction of steel fiber is regulated from a minimum of 0.75% to a maximum of 2%, to prevent fiber balls. Kim et al. [15] argued that the ratio of the strength increase is not remarkable when the mixing ratio exceeds 1%, even though the shear strength of the specimen is increased as the volume fraction of steel fiber rises. The amount of fibers added to the concrete depends on the type of fiber and target performance, but practical considerations limit the fiber dosage in structural elements to approximately 1.5% by volume [16]. Therefore, we used mixing ratios of 0%, 1%, and 2%. Figure 2 shows the hooked steel fibers that were incorporated into the specimens, of 30 mm length, 0.5 mm diameter, 60 aspect ratio, and 1100 MPa nominal tensile strength.
Table 1 details the parameters of the test specimens. CCB refers to conventional coupling beam, and V f means the volume fraction of steel fiber. The structure of the specimens is shown in Figure 3 as well.

2.2. Material Properties

The specified compressive strength was designed as 40 MPa. The mix proportion of concrete was set as given in Table 2, and three cylindrical specimens Φ100 mm × 200 mm were made for each volume fraction ratio [17]. The compressive strength of each specimen was assessed according to KS F 2405 [18].
Steel fibers are generally more effective in improving concrete tensile strength than concrete compressive strength [19]. Therefore, to assess the increase of tensile strength from steel fiber reinforcement, splitting tensile strength and flexural tensile strength were tested according to KS F 2423 [20] and KS F 2408 [21]. Table 3 shows the results of the tests. The average compressive strength with the 0% volume fraction ratio was about 51.02 MPa and it exceeded the specified compressive strength, which was 40 MPa. As the volume fraction ratio of the steel fibers was changed to 1% and then 2%, the compressive strength was decreased to 80% and 89%, respectively. The flexural tensile strength was increased by about 31% for the 1% volume fraction of steel fiber, and 63% for the 2% steel fiber ratio. The splitting tensile strength was increased by about 21% for the 1% steel fiber ratio and 63% for the 2% steel fiber ratio.
Table 4 shows the results of the experiments. Tensile strength was tested according to KS B 0802 [22]. D25 reinforcing bar was used as the longitudinal reinforcement of the coupling beams. Its yield strength and tensile strength were measured as 493.9 MPa and 624.1 MPa, respectively. D13 reinforcing bar with 400 MPa specified yield strength was used in longitudinal reinforcement other than the D25 rebar, and its yield strength and tensile strength were 483.5 MPa and 589.4 MPa, respectively. Every reinforcing bar exceeded its specified yield strength.

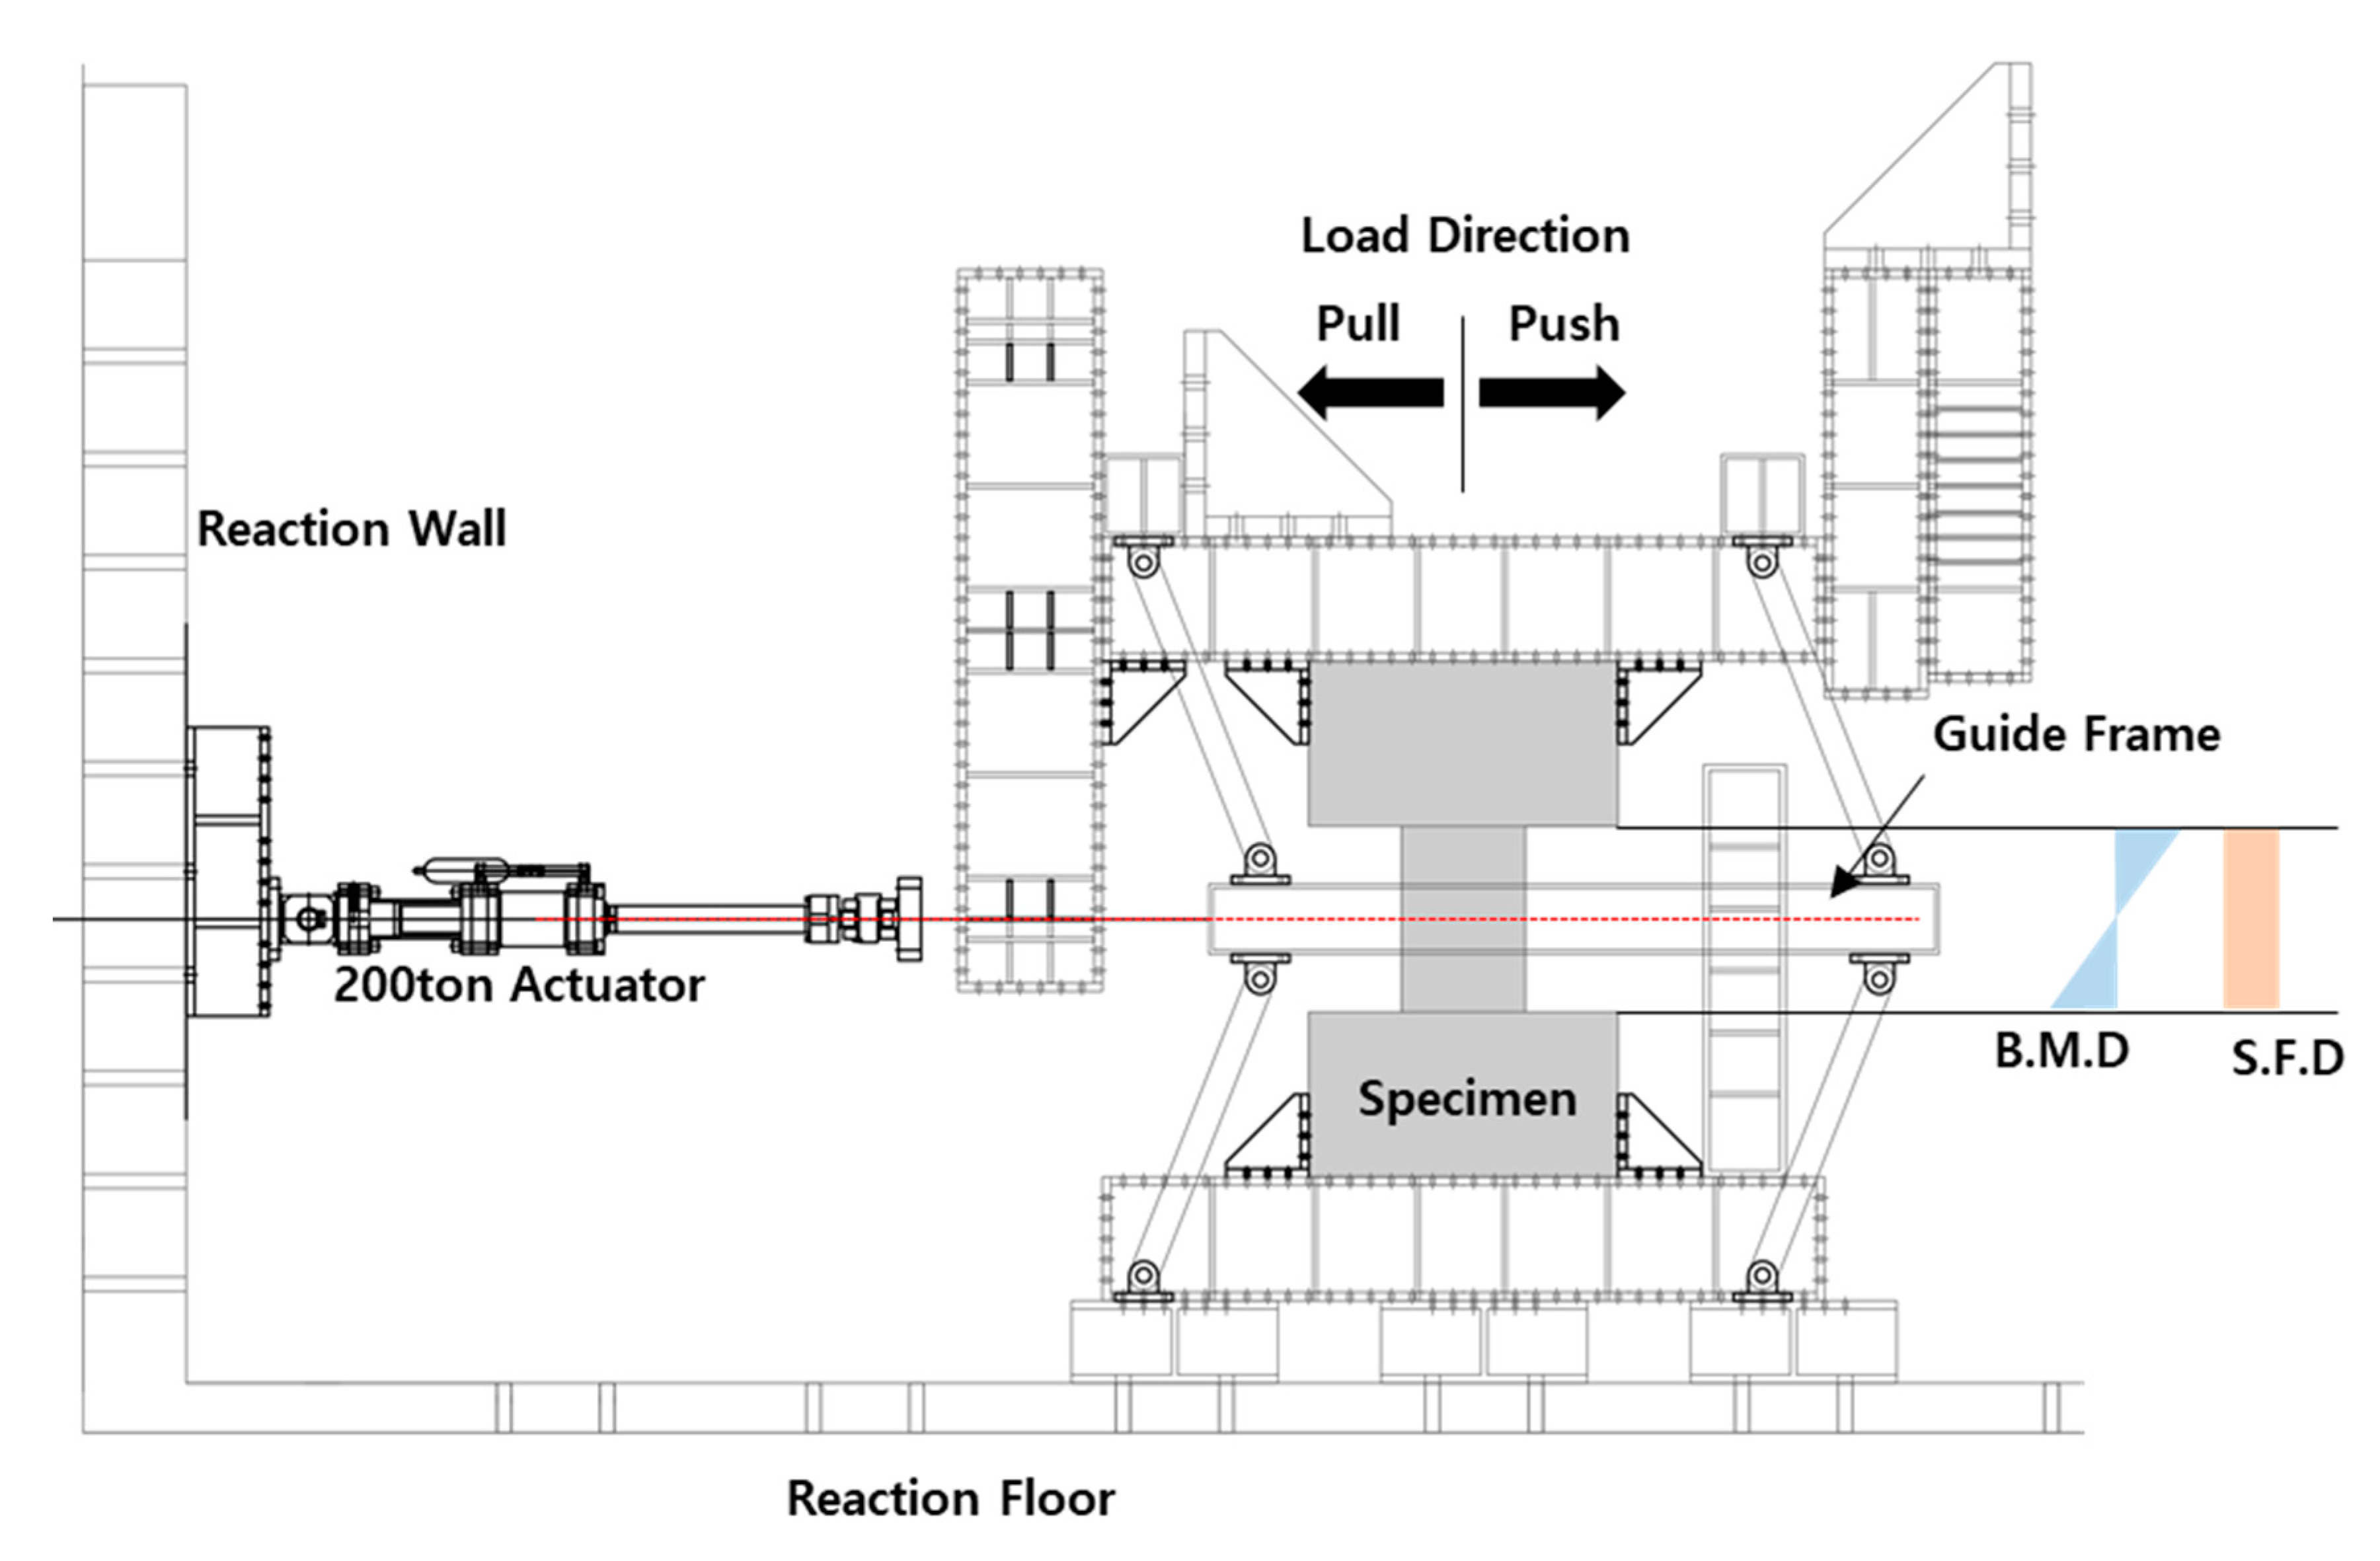
2.3. Test Setup and Loading History

As a shear wall resists the lateral load on the structure of a reinforced concrete shear wall system, a coupling beam is subjected to double curvature. Experimental conditions were set as shown in Figure 4, to impose shear force and moment force, which are equal to the load actually imposed on a real coupling beam. Each specimen had a fixed connection to be subjected to double curvature and to prevent the occurrence of rotation on its edge. A 2000-kN actuator was installed with a connection to an L-shaped frame to make a zero central moment. A guide frame for preventing out-of-plane transformation was also installed.
Every specimen went through the quasi-static reversed cyclic loading experiment. The quasi-static cyclic loading test is an experiment that simulates a dynamic load, but a cyclic load is applied very slowly so that the effects of the inertia force and the damping force acting on the specimen can be ignored. This can simplify the analysis of the specimens subjected to seismic load. Figure 5 shows the loading history. The loading protocol was conducted according to ACI 374.2R-13 [23]. With each coupling beam, three cycles of the same drift were performed due to large energy dissipation, which can occur without a rapid decline in stiffness. The yield drift ratio θ y was assumed to be 0.75%, because ACI 374.2R-13 [23] suggests that the yield drift ratio in a member controlled by shear should be 0.5~0.75%. In the CCB-v0 specimen, which had no steel fiber reinforcement, drift ratio 0.25 θ y was added to assess the initial stiffness due to the expected rapid decrease of strength and stiffness degradation.

3. Test Results

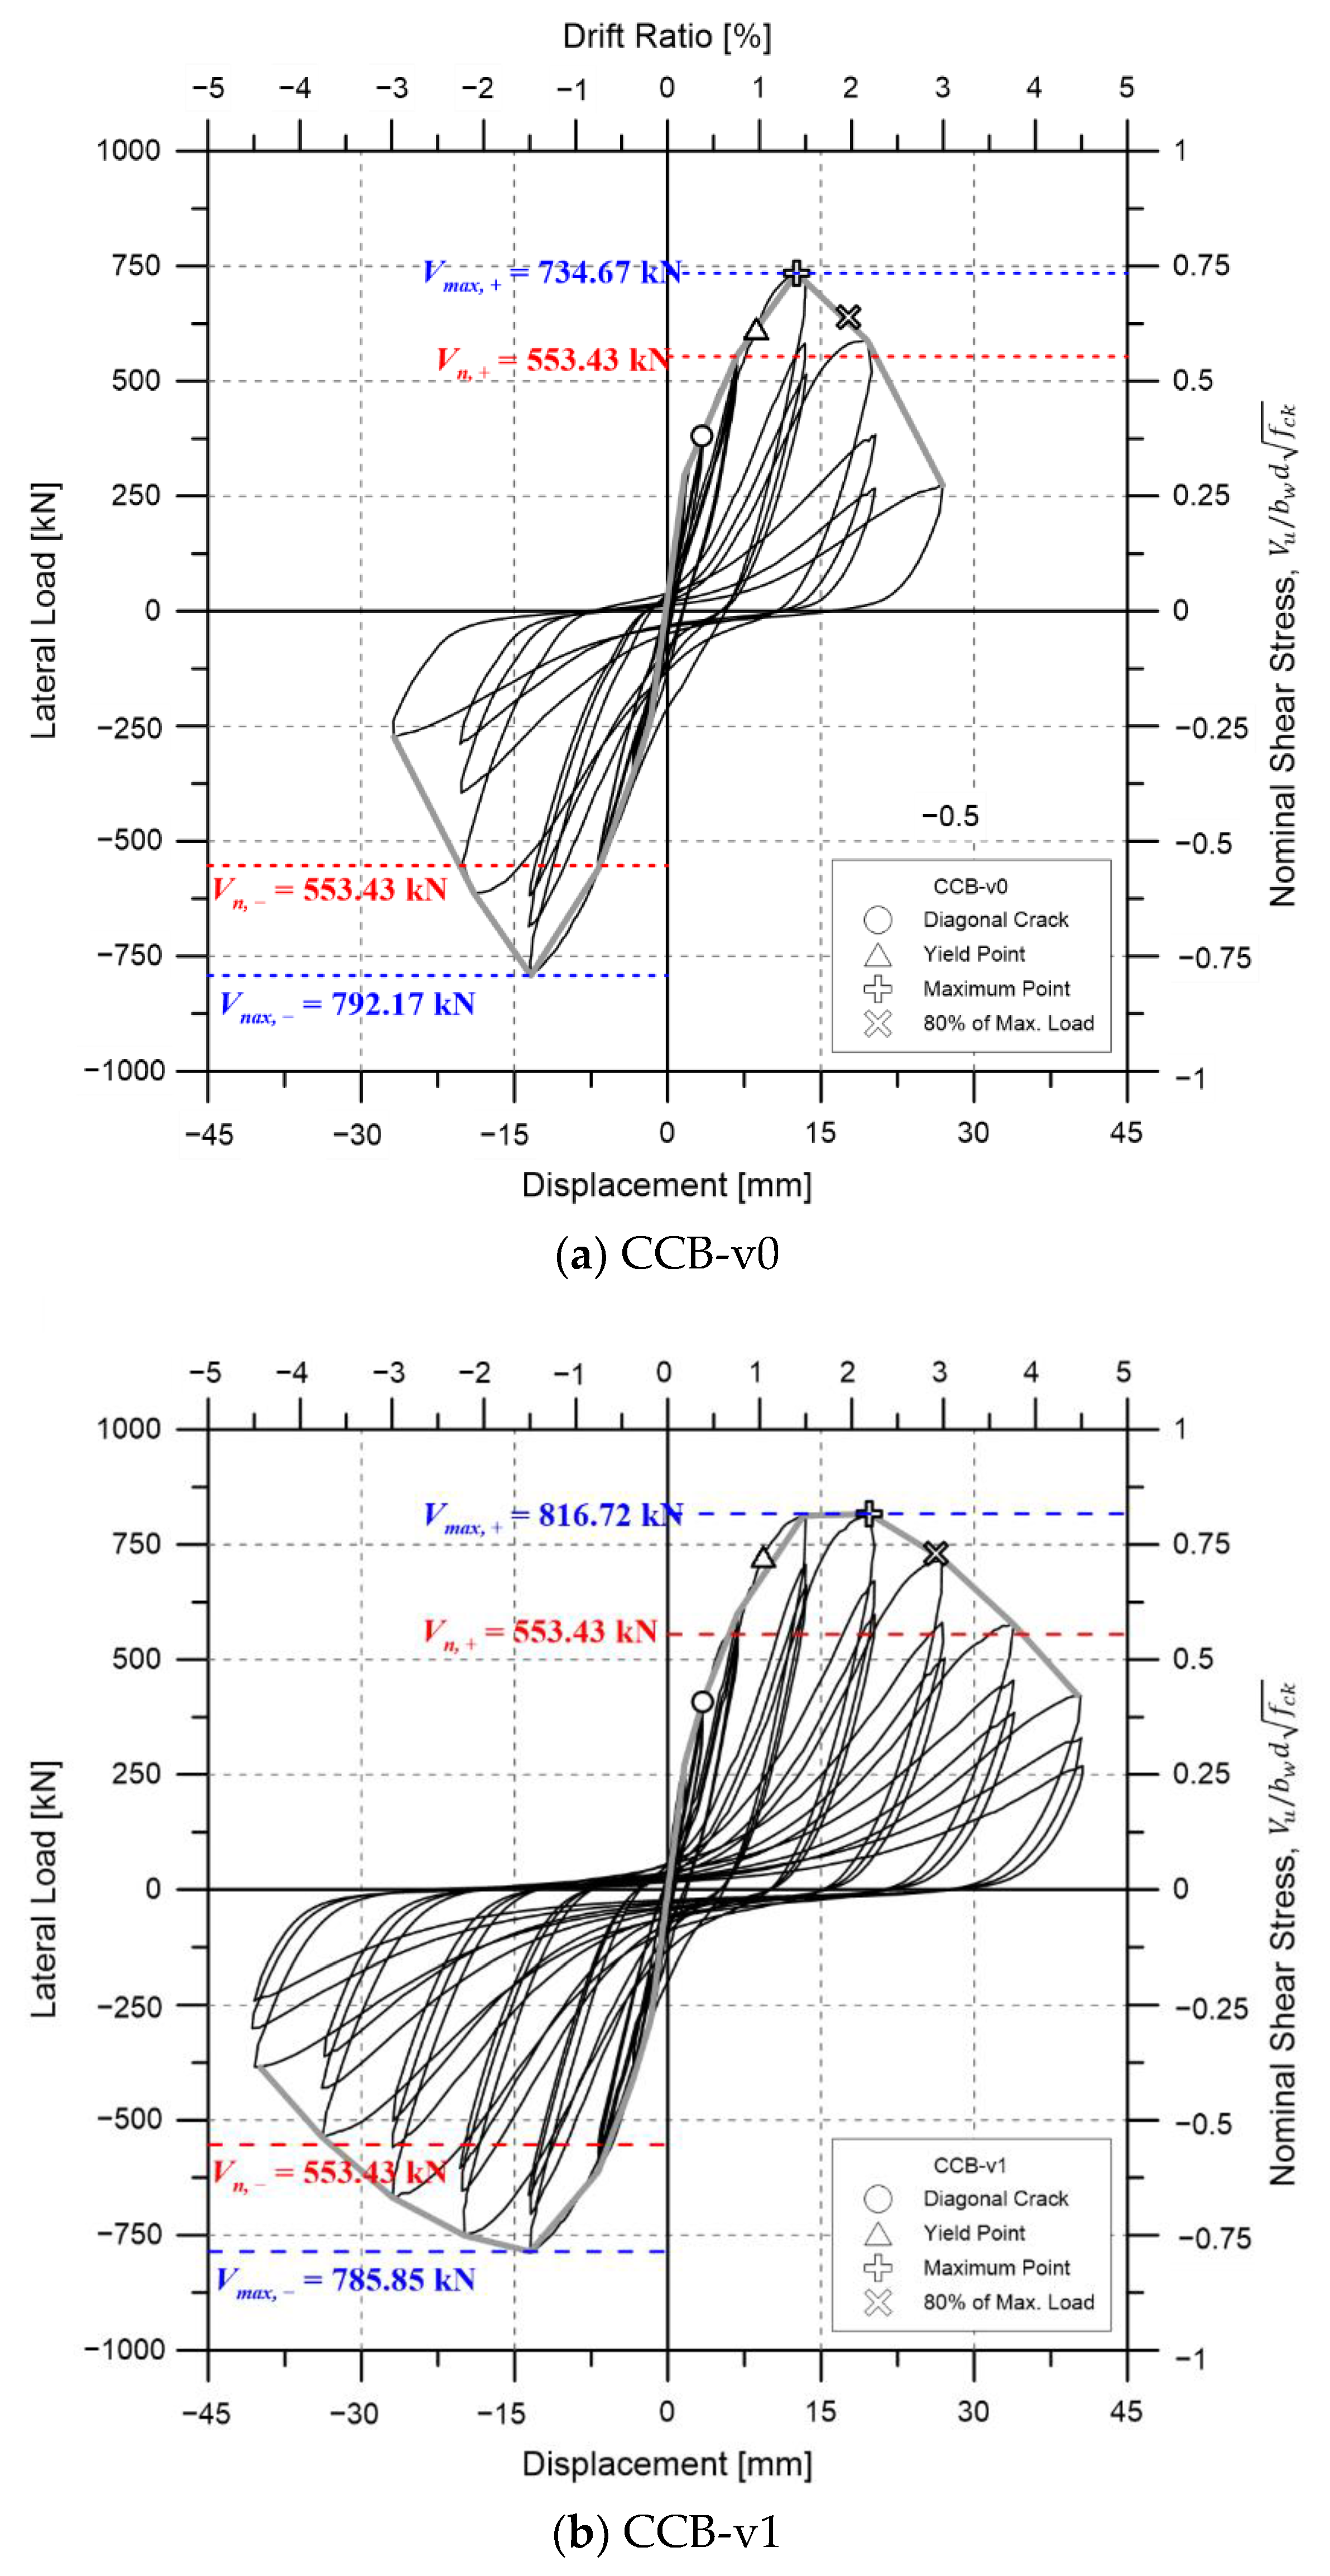
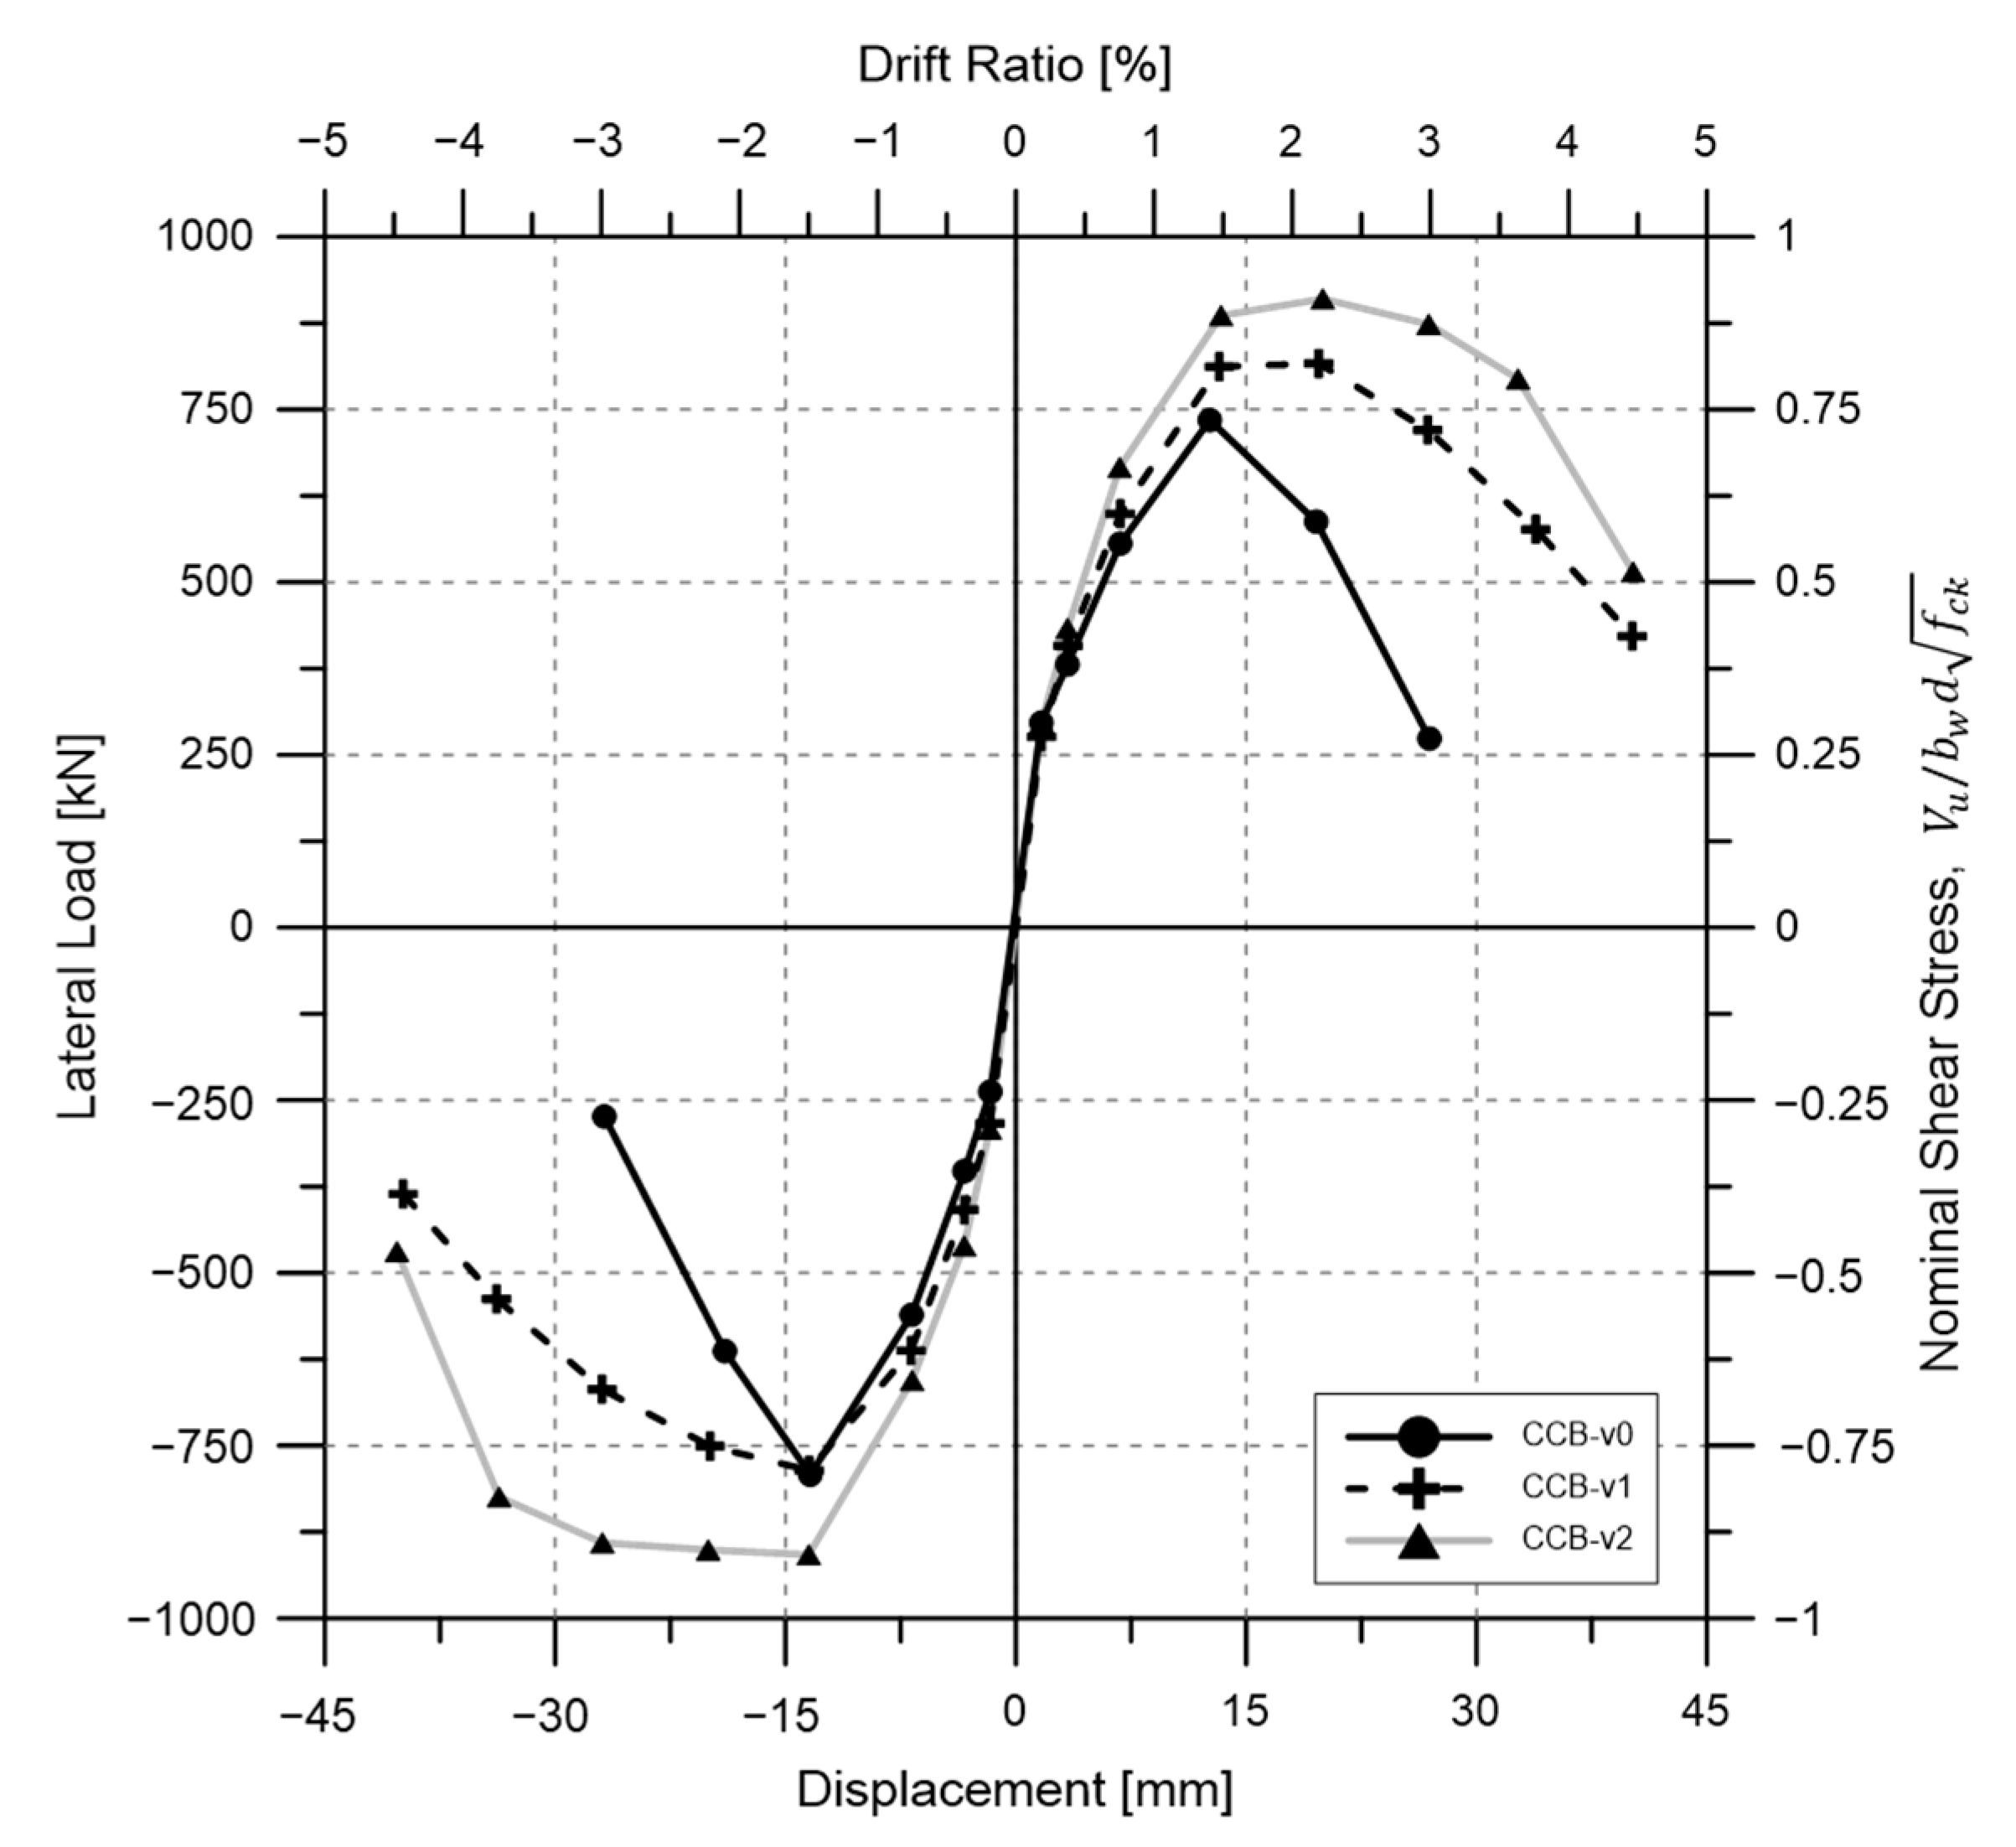
3.1. Load-Displacement Relationship

There are two methods to determine the ultimate and yield displacement. In the first method, which is normally used in experimental studies, the initial stiffness of the slope of the line reaches the point at which the applied lateral force reaches 75% of the nominal strength. In the second method, which is normally used in numerical studies, the beam is loaded until either the first yield of the longitudinal reinforcing bars or the maximum compressive strain of concrete reaches 0.002 at the critical section of the coupling beams. Here, the concrete compressive strain 0.002 is the strain at the maximum compressive stress on the compressive stress-strain curve of concrete, which is originally introduced by Hognastad [24]. Because the initial reinforcing yield occurs prior to the nominal capacity being achieved, both approaches generate similar values [25]. Since the first method is commonly applied when testing concrete structures, it was applied here to estimate the yield displacement and initial stiffness through point A in Figure 6. In addition, the ultimate state of the member was set at point B, which is the point at which the strength of the specimen decreased to 80% of the maximum strength [26].
The test results are shown in Table 5 and the load-displacement relationships are shown in Figure 7. The yield displacement of the CCB-v0 specimen was 8.69 mm, the coupling beam yielded at a drift ratio of 0.97%, and the load was 613.83 kN. The initial stiffness calculated based on Figure 6 was 70.64 kN/mm. The maximum strength was 734.67 kN at a drift ratio of 1.4%, and the test was terminated after a rapid decrease in strength appeared at the sixth drift. The ultimate state, 0.8 P max , was 587.74 kN, and the drift ratio was 2.17%.
The yield displacement of the CCB-v1 specimen with a 1% volume fraction of steel fibers was 9.35 mm, yielding at a drift ratio of 1.04%, and the yield load was 723.35 kN. The initial stiffness of the CCB-v1 specimen was increased by about 9.5% when compared to the standard specimen, CCB-v0. At the displacement drift of 2.19%, the maximum strength was 816.72 kN, and the strength decreased rapidly at the next cycle. The ultimate load was 653.83 kN and the drift ratio was 3.34%.
The yield displacement of the CCB-v2 specimen with a 2% volume fraction of steel fibers was 9.36 mm, yielding at a drift ratio of 1.04%, and the yield load was 790.00 kN. The initial stiffness of the specimen increased by about 19.5% when compared to the standard specimen, CCB-v0, and about 9.1% when compared to the CCB-v1. At the drift ratio of 2.19%, the maximum strength was 816.72 kN, and thereafter the strength decreased rapidly after passing through the two drifts. The ultimate load was 653.38 kN and the drift ratio was 3.34%.
Figure 8 shows the maximum load for each drift to confirm the change in strength and ductility of each specimen. The maximum strengths of CCB-v1 and CCB-v2 were 1.11 times and 1.24 times higher than that of the standard specimen CCB-v0, respectively. As the volume fraction of the steel fibers increased, the maximum strength of the coupling beam also increased. The displacement ductility ratios were 1.48 and 1.64 times higher in CCB-v1 and CCB-v2, respectively, compared to CCB-v0.

3.2. Global Behavior of Test Specimens

At each cycle, each specimen was checked for cracks, and the crack patterns at maximum load and failure are shown in Figure 9. In CCB-v0 (the standard specimen), a flexural crack occurred at the end of the coupling beam at the first drift ratio of 0.1875%. A diagonal tension crack occurred at the second drift (drift ratio of 0.375%), and the transverse reinforcement yielded at the third drift ratio of 0.75%. After that, in the fourth drift, concrete crushing occurred on the web of the specimen and the longitudinal reinforcements yielded. Finally, when the negative load was applied at the fifth drift, the diagonal tension crack was opened and diagonal tension failure occurred.
Similarly, in the CCB-v1 specimen, a flexural crack occurred at the end of the coupling beam at the first drift; however, the length of the crack was shorter, and more cracks occurred than in the CCB-v0. A diagonal tension crack occurred at the drift ratio of 0.375% as in the standard specimen, but it was shorter and more cracks occurred, like the flexural cracks. The yield point of the transverse reinforcement and the longitudinal reinforcement was the same as that of the CCB-v0 specimen. Subsequently, concrete crushing occurred at both ends of the coupling beam at the drift ratio of 2.25% (the fifth drift) and the width of the diagonal tension crack increased at the drift ratio of 3.00%. Finally, at the eighth drift, a diagonal tension failure occurred.
CCB-v2 had more microcracks than the other two specimens. The diagonal tension crack occurred in the third drift, which was later than in the others, and the transverse reinforcement also yielded. Like the CCB-v1 specimen, concrete crushing occurred at both ends of the fifth drift, and cracks developed and were finally fractured by the diagonal tension crack.
Photographs of the final fractured specimens are shown in Figure 10. Each failure pattern confirmed that a large number of microcracks occurred as steel fibers were reinforced, which was effective for crack control, and the angle of the diagonal tension crack was increased.

3.3. Energy Dissipation and Stiffness of SFRC Coupling Beams

The specimen stiffness at each drift ratio was obtained as the slope of a straight line connecting the point of the maximum load in the positive load direction and the point of the maximum load in the negative load direction in the load-displacement relationship. Figure 11a compares the stiffness of the specimens at each drift. The relative stiffness ( k / k 1 d r i f t ), which is the value obtained by dividing the stiffness of each drift ratio by the stiffness calculated in the first drift cycle, is shown in Figure 11b to confirm the stiffness degradation of each specimen.
It was confirmed that the stiffness increased as the reinforcing steel fibers were introduced. After the drift ratio of 1.5%, the test specimen with a 0% volume fraction ratio of steel fibers showed a rapid decrease in stiffness, whereas the specimens with steel fibers showed a moderate decrease in stiffness.
In stiffening a coupled-wall system to limit system drifts, a primary function of the coupling beams is to dissipate energy throughout the full height of the structure [27]. Here, the energy dissipation was calculated as the area surrounding the load-displacement curve. Figure 12a shows the energy dissipation in the first cycle for each drift, and Figure 12b shows the cumulated energy dissipation for each cycle.
Energy dissipation is largely increased as the longitudinal rebar of coupling beams yield [27]. Here, it can be seen that the energy dissipation and cumulated energy dissipation in the first cycle for each drift did not increase significantly up to the third drift of 0.75%, which is considered to behave in the elastic range until the fourth drift. In the fourth drift, the energy dissipation per cycle increased rapidly, which was the same as the yield point of the longitudinal rebar. As the drift ratio increased, the amount of energy dissipation increased as the steel fibers were reinforced. This is believed to be due to the prevention of crack control and rebar slip due to the increase in tensile strength of the SFRC.

4. Deformation Contributions

4.1. Elements Contributing to Deformation

To understand the effect of the coupling beam on the deformation of an entire coupled shear wall system, it is necessary to understand the stiffness of the coupling beam itself. ASCE 41-17 [28] indirectly considers the effect of concrete on the flexural stiffness and shear stiffness of coupling beams as the modulus of elasticity E c . When SFRC is applied to a coupling beam, it delays the occurrence of cracks and also increases the stiffness by enabling crack control; therefore, it is necessary to quantitatively evaluate the stiffness of the coupling beam when steel fibers are introduced.
To confirm the stiffness of each load acting on the connecting beam, we first attempted to identify the elements that influence the deformation of the coupling beam and evaluate the deformation contribution of each component. According to the studies of Lequesne [29] and Setkit [30], the main elements that affect the deformation of the coupling beam by lateral load include flexure, shear, rocking, and sliding at the critical section. In identifying the crack patterns in Section 4.2 above, the initial sliding shear had little effect on the deformation, and in those previous studies [29,30] the effects of those other elements on the coupling beam were small.
Accordingly, in this study, the deformation contributions of three elements (flexure, shear, and rocking) were evaluated, and the total deformation angle due to the lateral load was calculated as the sum of the three elements as shown in Equation (2):
θ t o t a l = θ s + θ f + θ r
Here, θ t o t a l is the total deformation angle of the lateral load, θ s is the deformation angle due to shear, θ f is the rotation angle due to flexure, and θ r is the deformation angle due to rocking. A linear variable differential transformer (LVDT) for measuring each deformation angle was installed as shown in Figure 13.
The LVDT installed in the longitudinal direction of the coupling beam measured the amount of tension and compression deformation, respectively, and from this the deformation angle θ f was calculated. Deformation due to flexure is shown in Figure 14a, and the calculation is shown in Equation (3):
θ f = Δ r Δ l b
The rocking of the coupling beam occurred as shown in Figure 14b due to the separation of the coupling beam from the wall on both sides of the coupling beam. Rocking often occurs because a concrete crack is not completely closed by the aggregates and rebar slip occurs. LVDTs were therefore additionally installed at both ends to measure deformation due to rocking. In order to distinguish this from flexural deformation, the amount of rocking deformation was calculated by fixing the LVDT to the base and excluding the amount of deformation due to flexure.
For example, Δ 3 Δ 7 was obtained by subtracting the flexural deformation, Δ 7 from the deformation, Δ 3 (shown as L3 in Figure 13a); this result was the tensile or compressive deformation due to rocking. More precisely, the deformation angle due to rocking was calculated as shown in Equation (4):
θ r = ( Δ r , b a s e Δ r ) ( Δ l ,   b a s e Δ l ) b
Here, Δ r , b a s e and Δ l , b a s e is the amount of deformation from the center of the specimen to the base, and can be measured through L1, L2, L3, L4 in Figure 13a.
Deformation due to shear was proposed by Kowalsky et al. [31] and Ohtaki et al. [32] and is shown in Figure 14c. It is calculated by Equations (5) and (6):
Δ s = Δ d cos θ Δ t + Δ b 2 Δ l + Δ r 2 tan θ
θ s = Δ s h

4.2. Contribution of SFRC Coupling Beams to Deformation

The deformation contributions of SFRC coupling beams in terms of flexure, rocking, and shear are shown in Figure 15. The y-axis represents the relative deformation contribution of each element to the total deformation contribution, and the x-axis represents the drift ratio. Each deformation contribution was measured in the first cycle of each drift. In the case of the 2% specimen, the measurement was stopped due to defective measuring equipment after the drift ratio of 0.75%.
In the case of the CCB-v0 specimen without steel fibers, the initial shear contribution was 72%, the largest of the three elements. As the test progressed, the deformation contribution of shear decreased but still remained the most significant portion of the total deformation. The deformation contribution due to flexure was about 20%.
When 1% of steel fibers was introduced, the deformation contribution due to shear was still the largest, but the contribution of shear deformation was reduced and the contribution of rocking was increased compared to the standard specimen CCB-v0.
In the specimen containing 2% steel fibers, the deformation contribution of shear was reduced the most, to 25%, whereas the deformation contribution of rocking and the deformation contribution due to flexure were relatively increased. In particular, the deformation contribution of rocking rose rapidly.
In general, when steel fibers were introduced, the shear resistance performance rather than the flexural resistance performance was improved. This shows a similar pattern to the previous study results [29,30]. Like the previous study results, in this study, shear deformation decreased due to fiber, while flexural deformation had no significant effect. Accordingly, the deformation contribution due to flexure did not increase significantly in any of the specimens, but the deformation contribution of rocking was relatively increased because the deformation contribution of shear decreased. In addition, since the steel fibers improved the tensile strength of the concrete, the resistance of shear increased and the shear stiffness was improved, thereby reducing the deformation contribution of shear.

5. Conclusions

This study evaluated the structural performance of conventional reinforced concrete coupling beams according to the volume fraction of steel fibers. Full-scale coupling beam specimens were fabricated with three volume fractions of steel fibers, and reversed cyclic loading tests were performed. From this limited number of experiments on SFRC coupling beams, the following conclusions were obtained.
(1)
The maximum strength of the standard specimen CCB-v0 (0% volume fraction of steel fibers) was 734.67 kN. When 1% steel fiber was introduced, this increased by about 11%, and when 2% steel fiber was introduced the maximum strength was improved by 24%. The displacement ductility ratio was 2.25 when the volume fraction of steel fiber was 0%, but increased by about 43% to 3.22 at the time of 1% containing, and 64% to about 3.68 at the time of 2% containing. All the specimens exceeded the current 0.33 f c k b w d design standard for diagonal reinforcement coupling beams.
(2)
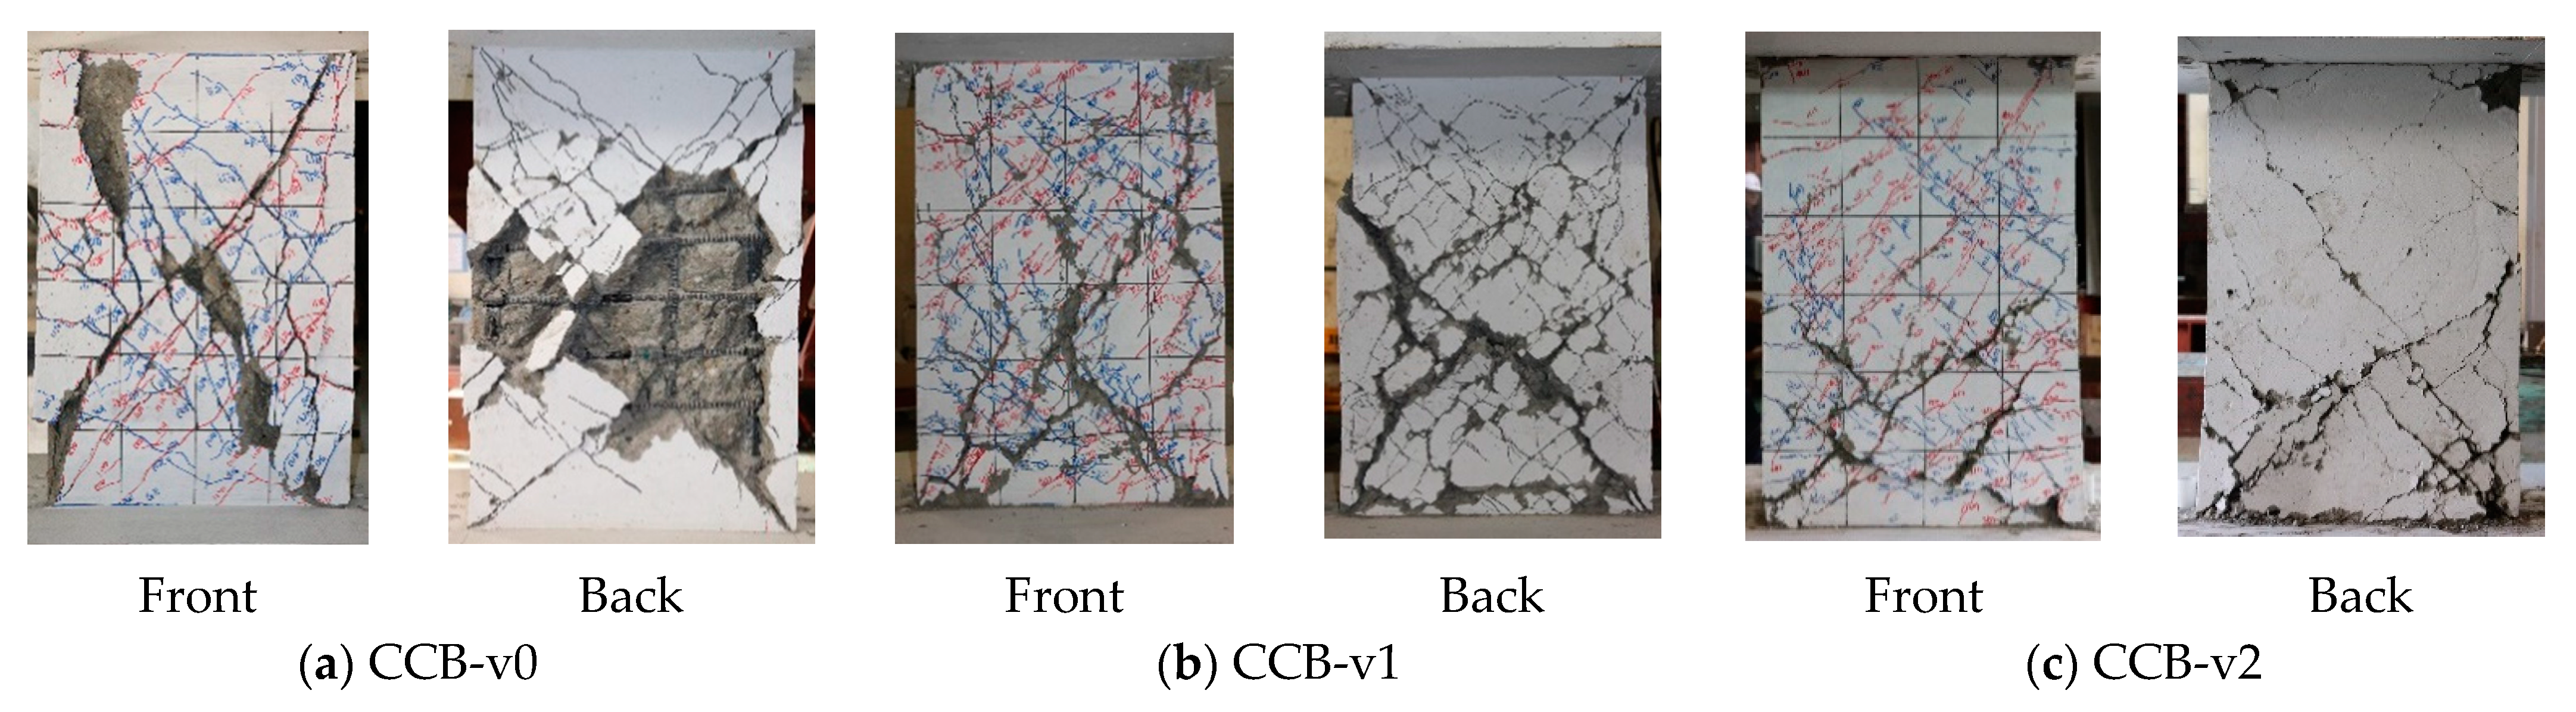
As the steel fibers were introduced, diagonal cracks occurred late. A large number of microcracks occurred and the angle of the diagonal crack was gradually increased. We believe that this occurred because the increase in crack width was suppressed due to the bridging effect of the steel fibers. In future studies, it is necessary to quantitatively analyze the effect of the crack angle due to steel fiber and its effect on the strength of the coupling beams.
(3)
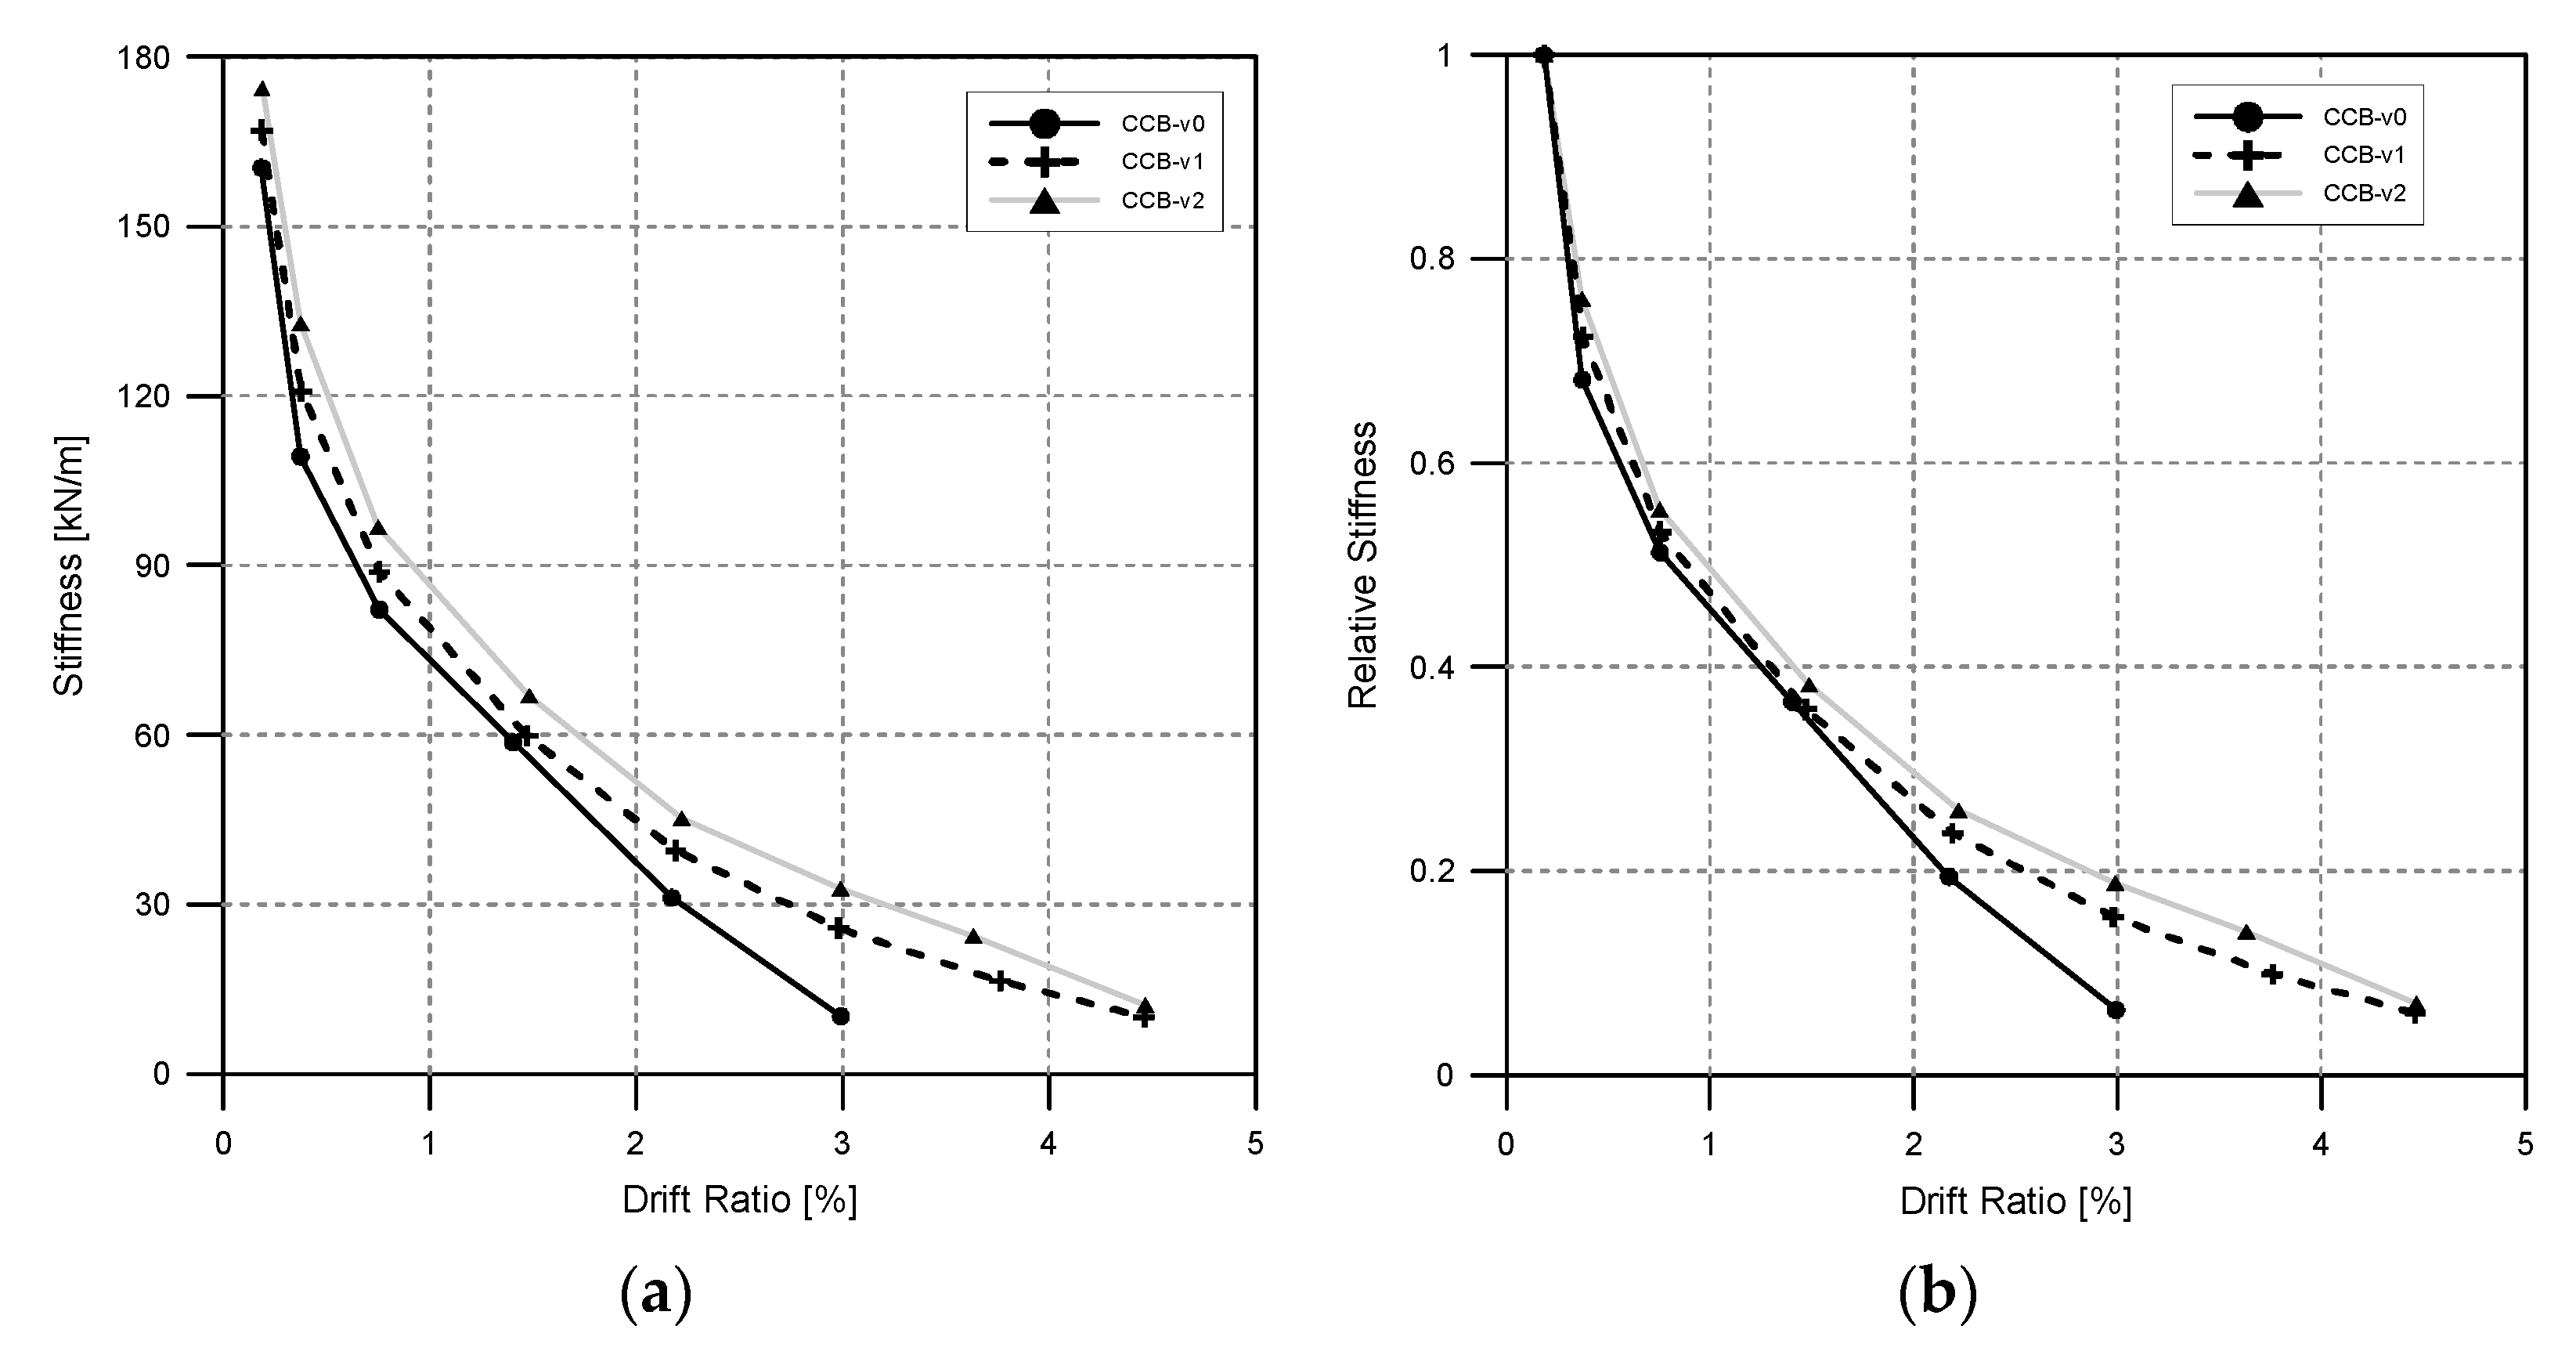
As the steel fibers were introduced, the stiffness increased; also, the degradation of the relative stiffness decreased as the volume fraction of steel fibers increased. In the standard specimen CCB-v0 which had no steel fibers, the stiffness decreased sharply after the maximum strength was reached, but in the specimen CCB-v02 with 2% steel fibers, this rapid decrease in stiffness did not occur. The energy dissipation capacity increased as the steel fibers were introduced, and of particular note was that the energy dissipation increased rapidly when the longitudinal reinforcing bar yielded. There was no significant difference in the yield point of the longitudinal reinforcing bars according to the steel fibers, but the cumulative energy dissipation capacity increased as the steel fibers were contained.
(4)
To confirm the flexural and shear stiffness of the coupling beams according to their steel fiber content, the deformation distribution of the coupling beams was evaluated. The results showed that as the steel fibers were introduced, the deformation contribution of shear decreased, but the deformation contribution of rocking increased. The deformation contribution due to bending did not comparatively increase, which we attribute to the steel fibers improving the tensile strength of the concrete and greatly improving the resistance to shear.
(5)
This study confirmed that each deformation element (flexure, shear, and rocking) changes due to the steel fiber content, and this trend was the same in previous studies. Therefore, the effective stiffness of coupling beams according to the volume fraction ratio of steel fibers should be further quantitatively evaluated based on the results of previous studies and this study.

Author Contributions

Original draft preparation and editing, J.-H.C.; performing tests and investigations, D.-H.S.; validation, S.-Y.K.; analyzing the results and reviewing the article, B.-I.B.; supervision and review writing, C.-S.C. All authors have read and agreed to the published version of the manuscript.

Funding

This work was supported by the National Research Foundation of Korea (NRF) grant funded by the Korea government (MSIT). (No. 2018R1A2B6009483 and 2020R1A4A1019074).

Institutional Review Board Statement

Not applicable.

Informed Consent Statement

Not applicable.

Data Availability Statement

Data is contained within the article or supplementary material.

Conflicts of Interest

The authors declare no conflict of interest.

References

  1. Paulay, T.; Park, R. Reinforced Concrete Structures; John Wiley: New York, NY, USA, 1975. [Google Scholar]
  2. Paulay, T.; Priestley, M.J.N. Seismic Design of Reinforced Concrete and Masonry Buildings; John Wiley: New York, NY, USA, 1992. [Google Scholar]
  3. Paulay, T. The Coupling of Shear Walls. Ph.D. Thesis, University of Canterbury, Christchurch, New Zealand, 1969. [Google Scholar]
  4. Paulay, T.; Binney, J.R. Diagonally reinforced coupling beams of shear walls. In Shear in Reinforced Concrete; SP-42, American Concrete Institute: Farmington Hills, MI, USA, 1974; Volume 42, pp. 579–598. [Google Scholar]
  5. Tassios, T.P.; Moretti, M.; Bezas, A. On the behavior and ductility of reinforced concrete coupling beams of shear walls. ACI Struct. J. 1996, 93, 711–720. [Google Scholar]
  6. Galano, L.; Vignoli, A. Seismic behavior of short coupling beams with different reinforcement layouts. ACI Struct. J. 2000, 97, 876–885. [Google Scholar]
  7. Seo, S.Y.; Yun, H.D.; Chun, Y.S. Hysteretic Behavior of Conventionally Reinforced Concrete Coupling Beams in Reinforced Concrete Coupled Shear Wall. Int. J. Concr. Struct. Mater. 2017, 11, 599–616. [Google Scholar] [CrossRef] [Green Version]
  8. Kwon, H.-W.; Jeon, Y.-R.; Lee, K.-H.; Shin, M.-S.; Han, S.-W. Cyclic Behavior of High-Performance Fiber-Reinforced Cement Composite Coupling Beam Having Diagonal Reinforcement. J. Korea Concr. Inst. 2013, 25, 649–656. [Google Scholar] [CrossRef]
  9. Park, W.S.; Kang, T.H.; Kim, S.; Yun, H.D. Seismic Performance of Moderately Short Concrete Coupling Beams with Various Reinforcements. ACI Struct. J. 2020, 117, 141–154. [Google Scholar] [CrossRef]
  10. Cai, G.; Zhao, J.; Degée, H.; Vandoren, B. Shear capacity of steel fibre reinforced concrete coupling beams using conventional reinforcements. Eng. Struct. 2016, 128, 428–440. [Google Scholar] [CrossRef]
  11. Lequensne, R.D.; Parra-Montesino, G.; Wight, J.K. Seismic response of fiber reinforced concrete coupled walls. ACI Struct. J. 2016, 113, 435–445. [Google Scholar]
  12. ACI 318-19. Building Code Requirement for Structural Concrete and Commentary; ACI Committee: Farmington Hill, MI, USA, 2019. [Google Scholar]
  13. Moehle, J.P.; Ghodsi, T.; Hooper, J.D.; Fields, D.C.; Gedhada, R. Seismic Design of Cast-in-Place Concrete Special Structural Walls and Coupling Beams: A Guide for practicing engineer. In NEHRP Seismic Design Technical Brief, No. 6; National Institute of Standards and Technology: Gaithersburg, MD, USA, 2011. [Google Scholar]
  14. ACI 544.4R-88. Design Considerations for Steel Fiber Reinforced Concrete; ACI Committee: Farmington Hill, MI, USA, 2017. [Google Scholar]
  15. Kim, C.-G.; Park, H.-G.; Hong, G.-H.; Kang, S.-M. Evaluation on Shear Contribution of Steel Fiber Reinforced Concrete in Place of Minimum Shear Reinforcement. J. Korea Concr. Inst. 2014, 27, 603–613. [Google Scholar] [CrossRef]
  16. MacGregor, J.G.; Wight, J.K.; Teng, S.; Irawan, P. Reinforced Concrete: Mechanics and Design, 5th ed.; Prentice Hall: Upper Saddle River, NJ, USA, 1997. [Google Scholar]
  17. KS F 2403. Standard Test Method for Making and Curing Concrete Specimens; Korean Agency for Technology and Standards: Seoul, Korea, 2014; pp. 1–14.
  18. KS F 2405. Standard Test Method for Compressive Strength of Concrete; Korean Agency for Technology and Standards: Seoul, Korea, 2014; pp. 1–16.
  19. Bae, B.I.; Chung, J.H.; Choi, H.K.; Jung, H.S.; Choi, C.S. Experimental study on the cyclic behavior of steel fiber reinforced high strength concrete columns and evaluation of shear strength. Eng. Struct. 2018, 157, 250–267. [Google Scholar] [CrossRef]
  20. KS F 2423. Method of Test for Splitting Tensile Strength of Concrete; Korean Agency for Technology and Standards: Seoul, Korea, 2016; pp. 1–12.
  21. KS F 2408. Method of Test for Flexural Strength of Concrete; Korean Agency for Technology and Standards: Seoul, Korea, 2016; pp. 1–16.
  22. KS B 0802. Method of Tensile Test for Metallic Materials; Korean Agency for Technology and Standards: Seoul, Korea, 2013; pp. 1–7.
  23. ACI 374.2R-13. Guide for Testing Reinforced Concrete Structural Elements under Slowly Applied Simulated Seismic Load; ACI Committee 374: Farmington Hill, MI, USA, 2013. [Google Scholar]
  24. Hognestad, E. Inelastic behavior in tests of eccentrically loaded short reinforced concrete columns. J. Proc. 1952, 49, 117–139. [Google Scholar]
  25. Vu, N.S.; Li, B.; Beyer, K. Effective stiffness of reinforced concrete coupling beams. Eng. Struct. 2014, 76, 371–382. [Google Scholar]
  26. Priestley, M.J.N.; Park, R. Strength and ductility of concrete bridge columns under seismic loading. Struct. J. 1987, 84, 61–76. [Google Scholar]
  27. Paulay, T.; Santhakumar, A.R. Ductile behavior of coupled shear walls. J. Struct. Div. 1976, 102, 93–108. [Google Scholar]
  28. American Society of Civil Engineers. ASCE 41-17: Seismic Evaluation and Retrofit Rehabilitation of Existing Buildings; American Society of Civil Engineers: Reston, Virginia, 2017. [Google Scholar]
  29. Lequesne, R.D. Behavior and Design of High-Performance Fiber-Reinforced Concrete Coupling Beams and Coupled-Wall Systems. Ph.D. Thesis, University of Michigan, Ann Arbor, MI, USA, 2011. [Google Scholar]
  30. Setkit, M. Seismic Behavior of Slender Coupling Beams Constructed with High-Performance Fiber-Reinforced Concrete. Ph.D. Thesis, University of Michigan, Ann Arbor, MI, USA, 2012. [Google Scholar]
  31. Kowalsky, M.J.; Priestley, M.J.; Seible, F. Shear Behavior of Lightweight Concrete Columns under Seismic Conditions; Report SSRP-95/10, Structures Division; University of California: San Diego, CA, USA, 1995. [Google Scholar]
  32. Ohtaki, T.; Benzoni, G.; Priestley, M.J.N. Seismic Performance of a Full Scale Bridge Column-as Built and as Repaired; Report SSRP-97/02, Structures Division; University of California: San Diego, CA, USA, 1997. [Google Scholar]
Figure 1. Stress contributions in a coupled shear wall. (a) Pin connection; (b) Fixed Connection; (c) Actual moment resistant connection.
Sustainability 13 00182 g001
Figure 2. Steel fibers incorporated into the test specimens.
Sustainability 13 00182 g002
Figure 3. Test specimen details. [unit: mm].
Sustainability 13 00182 g003
Figure 4. Test setup.
Sustainability 13 00182 g004
Figure 5. Loading history.
Sustainability 13 00182 g005
Figure 6. Initial stiffness and ultimate load determination.
Sustainability 13 00182 g006
Figure 7. Load-displacement relationships of the test specimens.
Sustainability 13 00182 g007aSustainability 13 00182 g007b
Figure 8. Envelope curve.
Sustainability 13 00182 g008
Figure 9. Crack patterns of the test specimens.
Sustainability 13 00182 g009
Figure 10. Failure patterns of the test specimens.
Sustainability 13 00182 g010
Figure 11. Stiffness degradation. (a) Stiffness; (b) Relative stiffness.
Sustainability 13 00182 g011
Figure 12. Energy dissipation. (a) Energy dissipation per peak cycle; (b) Accumulated energy dissipation per cycle.
Sustainability 13 00182 g012
Figure 13. LVDT setup. (a) LVDT plan; (b) LVDT installation
Sustainability 13 00182 g013
Figure 14. Contributions of flexure, rocking, and shear to the deformation angle. (a) Flexural deformation; (b) Rocking; (c) Shear deformation
Sustainability 13 00182 g014
Figure 15. Deformation contributions to specimen drift at the peak of each loading cycle. (a) CCB-v-0; (b) CCB-v1; (c) CCB-v2
Sustainability 13 00182 g015
Table 1. Test Specimen Data.
Specimensbdh l n /hLongitudinal RebarTransverse Rebar V f
Rebar ρ l f y l Rebar ρ t f y t
[mm] [MPa][MPa][%]
CCB-v03005446001.56-D250.017400D10
@300
0.0084000
CCB-v11
CCB-v22
b: width of coupling beam section, d: effective width of coupling beam section, h: height of coupling beam, f y l : yield strength of longitudinal rebar, ρ l : reinforcement ratio of longitudinal rebar, f y t : yield strength of transverse rebar, ρ t : reinforcement ratio of transverse rebar. V f : volume fraction ratio of steel fiber.
Table 2. Mix Proportions of the Concrete.
V f
(%)
W/B
(%)
S/A
(%)
Unit Weight (kg/m3)
CWSGADSF
033.845.73251577649133.720
178.5
2157
Vf: volume fraction of steel fiber, W/B: water-binder ratio, S/A: fine aggregate ratio, C: cement, W: water, S: fine aggregate, G: coarse aggregate, AD: admixture, SF: steel fiber.
Table 3. Mechanical Characteristics of the Concrete.
V f
(%)
f c
(MPa)
f s p
(MPa)
f r
(MPa)
E c
(MPa)
051.024.234.242,901
140.725.134.6440,691
235.375.566.8546,315
V f : volume fraction of steel fiber, f c : compressive strength of concrete, f s p : splitting tensile strength, f r : flexural tensile strength, E c : modulus of elasticity.
Table 4. Mechanical Characteristics of Reinforcing Bars.
Rebar f y
(MPa)
f y m
(MPa)
ε y
(mm/mm)
f u
(MPa)
D13400483.50.0024589.4
D25400493.90.0025624.1
f y : nominal yield strength, f y m : measured yield strength, ε y : yield strain, f u : ultimate tensile strength.
Table 5. Test Results.
Performance
Points
PropertiesSpecimens
CCB-v0CCB-v1CCB-v2
PositiveNegativePositiveNegativePositiveNegative
Yield displacementDrift ratio
(%)
0.971.141.040.891.041.06
P y
(kN)
613.83712.26723.35640.90790.00783.80
Δ y
(mm)
8.6910.279.358.019.369.55
k i
(kN/mm)
70.6469.3577.3680.0184.4082.07
Maximum
load
Drift ratio
(%)
1.401.492.191.502.221.50
P max
(kN)
734.67792.17816.72785.85910.27907.93
Δ max
(mm)
12.6313.3919.7213.4619.9813.49
Ultimate
Load
( 0.8 P max )
Drift ratio
(%)
2.172.033.343.233.833.94
P u
(kN)
587.74633.74653.38628.68728.22726.34
Δ u
(mm)
19.5618.3130.1029.0334.4735.49
μ = Δ u / Δ y 2.251.783.223.623.683.72
Δ y : yield displacement, P y : load at yield displacement, k i : initial stiffness( P y / Δ y ) , P max : maximum load, Δ max : displacement at maximum load, P u : ultimate load( 0.8 P max ) , Δ max : displacement at ultimate load, μ : displacement ductility( Δ u / Δ y ), Positive: positive direction of loading (push), Negative: negative direction of loading (pull).
Publisher’s Note: MDPI stays neutral with regard to jurisdictional claims in published maps and institutional affiliations.

