Article

New Energy-Resource Efficiency, Technological Efficiency, and Ecosystems Impact Ratings for the Sustainability of China’s Provinces

1
School of Economics and Management, Harbin Engineering University, Harbin 150001, China
2
School of Economics and Management, China University of Petroleum (Beijing), Beijing 102249, China
3
Environmental and Energy Rating Agency “Interfax-ERA”, 127006 Moscow, Russia
4
Wildlife Ecology and Conservation Laboratory Pacific Geographical Institute, Far East Branch of the Russian Academy of Science, 690041 Vladivostok, Russia
5
Geographical Faculty, Moscow State University, 119234 Moscow, Russia
*
Author to whom correspondence should be addressed.
Sustainability 2021, 13(1), 354; https://doi.org/10.3390/su13010354
Submission received: 22 November 2020 / Revised: 24 December 2020 / Accepted: 26 December 2020 / Published: 2 January 2021
(This article belongs to the Section Environmental Sustainability and Applications)

Abstract

:
This paper concerns the necessity of ecosystem protection and energy efficiency rating development. The article analyzes the experience of the non-commercial Environmental and Energy Rating Agency (Interfax-ERA) ratings concerning the environmental assessment of Russian regions and the transfer of successful knowledge for evaluating 31 Chinese provinces. The theoretical base, quantitative and qualitative characteristics of the energy-resource efficiency (ERE) rating, technological efficiency (TE), and ecosystem impact (EI) ratings are proposed based on the system methodology, developed within the framework of the UN Sustainable Development Goals (SDGs). The primary study objective is to determine whether the Interfax-ERA rating methodology and considered criteria could be applied in China to assess the provinces’ environmental, technological, and energy efficiency. The research highlights the importance of multifunctional tools for developing experiences and sharing methodological experiences across countries. The study efficiently emphasizes provinces with a high level of energy efficiency and technological innovations as well as the provinces with the deficient level of eco-oriented economy policy. The results show two types of systematic deviations—significantly high-level impact on the ecosystem in the Chinese provinces and considerably high levels of energy and resource efficiency in capitals and business centers.

1. Introduction

Achieving the global Sustainable Development Goals (SDGs) requires serious work concerning the environmental protection of regions and companies, development of technology assessment, and increasing energy efficiency [1,2,3]. Das and Das (2014) drew attention to the fact that financial growth is no longer the only driver of a region’s rating development. Social, energy, and environmental aspects play a vital role nowadays [4]. The formation of countries’ governments without corruption in ecological protection needs the enhancement of the voluntary market mechanisms based on international ecological responsibility standards, where the ratings included the sustainable indicators concerning green investment attractiveness or energy efficiency rating impact [5]. The Global Reporting Initiative (GRI), Dow Jones Sustainability Index (DJSI), or International Association of Oil and Gas Producers (IOGB) frameworks have become an essential milestone in the creation of global sustainability rankings [6].
Voluntary environmental certification systems such as the Firearms Safety Certification (FSC), Marine Stewardship Council (MSC), Aquaculture Stewardship Council (ASC), International Council for Mining and Shallow Waters (ICMM), Bettercoal, Minerals Council of Australia, and others play an essential role in the rankings elaboration. The Organization for Economic Cooperation and Development’s (OECD) environmental performance reviews provide an independent assessment of countries’ progress toward achieving environmental policy goals [7]. The United States Energy Information Organization (EIA) has published an international energy survey with regional ratings concerning energy products. The McKinsey study analyzed that investors are more aware than ever of the value of integrating environmental–social–governance (ESG) factors into their investment decisions to mitigate risk and unlock opportunities. The U.S. Department of Energy (DOE) recently raised the minimum seasonal energy efficiency ratio (SEER)/energy efficiency ratio (EER) ratings for all cooling units manufactured to provide better environmental protection and lower national costs. Fitch Ratings has revised the criteria to introduce a common approach to reflect relevant ESG factors in Local and Regional Government (LRG) ratings.
Infrastructure projects have been developed to address the sustainability system ratings [8,9] and systems for assessing sustainable building design [10,11]. Lee (2012) and Zarghami and Fatourehchi (2019) in their study emphasized that regional sustainability ratings have also been developed in many countries [12,13]. For example, Turkey has created Turkish Green Building Council (CEDBIK), which adds more factors to address their country’s sustainability challenges. Schwartz (2015) analyzed the prerequisites, specifics, and results of the first environmental rating of oil and gas companies in Russia emphasizing attention on the data disclosure [14]. The World Bank (WB), European Bank for Reconstruction and Development (EBRD), International Finance Corporation (IFC), Asian Development Bank (ADB), and Asian Infrastructure Investment Bank (AIIB) created government policies and standards for international institutions that are adapted to sustainable development, environmental protection, and social responsibility.
It is time to adapt the standards of private financial institutions such as the United Nations Environment Program Finance Initiative (UNEP FI) and investors such as the Principles for Responsible Investment (PRI) or the Carbon Disclosure Project (CDP) to the sustainable regional rankings.
China carefully develops its own provinces’ environmental and energy ratings. Thus, Tseng et al. (2013) [15] discussed ecological innovation and built a system for assessing the effectiveness of green technologies’ innovation, including 22 indicators. Some of the indicators are listed below: investment in clean equipment and technology; implementation of a comprehensive material saving plan; a supervision system and technology transfer; advanced technologies of green production; and document and information management. Luo and Liang (2019) constructed a system for assessing green technology innovation’s effectiveness for regional industrial enterprises in China in terms of green technology innovation inputs and expected and undesirable outcomes [16]. Yun (2011) emphasized that the efficiency of input–output innovation for China provinces is vital for technological innovation [17]. Wang (2004) described a new China impurity control program that ranks the companies’ ecological performance from the best to the worst using five tints and disseminates the public ratings through the media [18]. Nabeeh et al. (2020) emphasized that China’s Green Credit Policy (GCP) for manufacturing, as part of a sustainable financing package, imposes restrictions on suppliers to reduce harmful environmental pollution [19]. Li et al. (2017) [20] drew attention to the fact that in terms of the contribution of countries and territories to environmental assessment methods, Chinese researchers are ranked first (14% of the total number of publications). Nowadays, the Beijing Energy Efficiency Center (BECon) ranks provinces accordingly energy efficiency level. The Chinese Academy of Environmental Planning calculates province Green gross domestic product (GDP) ratings [21]. However, China provinces’ environmentally friendly ratings need to develop in various ways. China needs to create tools to assess the impact on the environment and energy resources [22,23,24].
The paper’s primary objective is to evaluate China’s provinces using the Russian methodology for rating environmental and energy resources.
The tasks of the research are the following:
To evaluate China’s provinces using ERE, technological efficiency (TE), and ecosystems impact (EI) ratings methodology.
To build a strategy matrix for analyzing China provinces’ rating evaluation results.
Environmental and energy rating agency “Interfax-ERA” (ERA) proposed the rating research methods [5,25]. Harbin University of Engineering (China) studied these methods as a tool for comparing provinces of China ecological, technological, and energy conditions. The list of Russian Federation’ ratings is very diverse (see supplementary materials, Table S1a,b). The World Wildlife Fund (WWF) Russia has been actively developing various options and environmental rating approaches for more than ten years. Moreover, a country regions’ rating concerning the quality of life has been compiled by the “RIA” rating agency annually since 2013. The Russian Federation regional ecological rating has been published four times per year by the Green Patrol public organization since April 2008. However, ERA was the first non-profit organization in Russia to receive a UN grant for sustainable development in Russia, so it could be beneficial for China to exchange ideas and research on meeting the requirements of the UN Sustainable Development Goals. Ecosystem Impact ERA Methodological Research has been included in the Top 100 Global Civil Society Initiatives and recognized as the Best Governance Tool at the 2019 Paris Peace Forum. The ERA ratings are the first ratings in Russia, and thus, it is interesting to see how the ratings work in China.
The rationale for referring to Russia’s experience to assess China’s provinces is that Russia is a country similar to China in terms of the industrial complexes’ development history in the socialist period and the transition to a market economy in the past thirty years. In this case, Russian scientists’ research experience may be valuable for a systematic assessment of China’s provinces’ environmental and energy efficiency [26].
Testing environmentally oriented ratings has been important for China since the success of the “Ecological civilization” primarily depends not only on expert’s assessments but also on knowledge of the real state of affairs, which can be explicitly or implicitly distorted. ERA ratings characterize efficiency, i.e., the ability of production systems in every region to perform useful (for humans) work with a low impact on the environment, resources, and energy consumption and minimal ecosystem stability losses. ERE rating expresses the volume of useful products and the costs of energy and natural resources, thus, objectively reflecting the economy’s efficiency. The TE rating reflects the “coefficient of harmful action” or volumes of the significant impacts on the environment, referred to the unit of work done by technical systems. The ecosystem impact (EI) rating reflects the high resilience of wilderness ecosystems (in terms of their area, biomass, productivity, and biodiversity) per unit of total impacts in the regions. Nature can assimilate pollution, waste, and excess extraction of natural resources. ERA ratings correctly reflect the physically measured efficiency of entire production processes.
The article has the following structure: In the first section of the article, the authors explain the theoretical foundations of developing a green economy in China and the theoretical foundations for the environmental rating methodology. The second section provides a methodology and explains the formula. In the third section, there are the calculation results and explanation. Discussion and conclusions appear at the end of the paper.

2. Methods

In this paper, the authors provide an overview of methods for assessing environmental and energy production efficiency in the provinces of China. A group of ERA researchers developed these methods under the UN SDGs framework [5,27,28,29]. These approaches were studied at the Harbin University of Engineering (China) and China University of Petroleum (Beijing) to make baseline comparisons of environmental, energy, and environmental conditions in provinces of China.
Research data are regionally accurate and were obtained from official China statistical yearbooks and from the Economy Prediction System (EPS) database http://olap.epsnet.com.cn/ and used without validation or additional training. A complete list of research indicators is provided in the Supplementary Materials (see Table S2). In this article, the authors use China inland data for 31 provinces. The workflow of data collection and analysis can be seen in Figure 1. The authors chose 2018 as the year when all the data required for the testing methodology were comprehensively collected: Environmental, economic, and social data were used from the China Environment Statistics Books. Calculations of the protected wilderness areas ratio were carried out according to Vladimir Bocharnikov methodology [22,30]. Regional data concerning pollutants’ emissions into the atmosphere, discharge of polluted wastewater, and waste amounts were taken from official statistical collections. China’s provinces’ performance assessment covers social infrastructure and population, including those not employed in the manufacturing economy.
The generated aggregate datasets and calculations are available from the corresponding author upon reasonable request.

2.1. Data Access Limitations

Suppose the production, export, and domestic consumption of fuel and electricity in the country are tracked accurately, information about the regions is reflected in statistics with varying completeness and detail. Incomplete and inconsistent primary statistics often lead to underreporting and/or double counting [31]. However, there are difficulties related to the availability and quality of China’s provincial statistics on environmental protection or energy consumption [32]. For example, the return on investment (EROI) or energy efficiency indicators are calculated only for some fields and are not considered for the company or province as a whole [33]. Therefore, it can be challenging to compile energy efficiency ratings for Chinese regions. The same situation happened with the water saving reports in the Chinese provinces [33,34]. All issues can be resolved by introducing additional standard reporting forms [35]. However, energy management in China is gradually evolving toward controlling energy consumption, energy consumption intensity, carbon emission intensity and control of pollutant emissions [36,37].
The second problem is that there are “steps” in the data series, signs of interpolation or accounting methodology changes. In some years, different criteria were used to include statistical items, leading to inaccurate data. For instance, the number pf hazardous pollutants increased sharply between 2016 and 2017, after China changed statistical standards to include all impurities above 1 kg. That is why, in this preliminary study testing ERA ratings concerning provinces of China, the authors use 2018 datasets. The authors plan to conduct further research for the period from 1970 to 2019.
The authors tried to use indicators that are fully equivalent to those used for Russian regions (totally, Russia has 85 regions) to assess the provinces of China. Russian regions’ indicators were developed by the group of experts under the UN methodology that tried to equally evaluate all regions in Russia, regardless of the economic or demographic position they have. The authors consider energy consumption data of all types of fuel and electricity produced at hydroelectric and nuclear power plants, and interregional electricity flows data. The mapping between Russia and China indicators used in the research appears in Table 1.
The data on environmental impact for Russia and China coincide in five indicators: water consumption, flows of polluted water after economic use, air emissions from stationary pollution sources, hazardous waste, and transformed or destroyed ecosystems. There is no statistically significant indicator of emissions from mobile sources in the provinces of China. Thus, indirect indicators were applied to compare the provinces—gas mileage, highway length, and civilian vehicles. The least complete (compared with the regions of Russia) were data on the structure of natural ecosystems in the provinces of China. The authors used Chinese provinces’ data concerning forests and natural pastures. In Russia, statisticians differentiated the tundra, swamp, and forest data according to the types of species prevailing. Indicators of biomass reserves, productivity, and biodiversity of various types in Russia were considered from publications on the international–regional biological program. To examine China, the authors used the average values for various types of forests and grass ecosystems published for China in the UN databases.

2.2. Rating System Criteria

ERE and TE’s ratings are based on theoretical developments for assessing the stability of physical systems of any nature to access natural and technological complexes’ stability. The theoretical justification and quantitative and qualitative characteristics of the ecosystem and energy efficiency ratings are proposed based on the General Systems Theory (GST) [29] in the UN SDG initiative framework. Few researchers developed system science theory in Russia, e.g., Bogdanov [38,39] and Kleiner [40,41]. The most developed theory in Russia is the General Systems Theory (GST) by Urmantsev. This theory is fully described in the book collection “System, symmetry, harmony” [42] and in several other works [43,44].
Natural and human-made systems are complex, self-developing systems that cannot be evaluated using traditional statistical methods [42]. The creation of an environmentally oriented ranking methodology is also related to GST [29]. It is necessary to determine the research object and select appropriate indicators characterizing the system’s stability and instability. GST is based on the concept of any object of the surrounding reality as a system obje. Thank you so much!ct. All-natural objects must be included in the system as the first of the “primary” elements. The second “primary” element of the system is society. The authors are particularly interested in connection with urgent environmental problems. In the process of evolution, humanity created an “artificial environment” (Technosphere) as a kind of interface with nature, which gave it several undeniable advantages over other species and made it less dependent on external conditions [45]. Between human (H) and nature (N), there is an objective transmitting link or Technosphere (T), which works on entirely different principles, in general, in contrast to the first [28]. Thus, the primary reason for almost all environmental problems is the contradiction between N and T’s functioning laws. A system-wide way of solving these problems (that is, practically ensuring comprehensive environmental safety) eliminates this contradiction. We need to reorient the functioning of objects (T) according to natural laws. Having identified the three “primary” elements of the natural–anthropogenic system (H–N–T), we can suppose all possible relations {r} in Nature (N)–Technosphere (T)–Human (H) system (see Table 2).
Vladimir Artykhov started developing the ecological system science theory in Russia [45]. As in GST, from three essential elements, relations and composition’ laws, a systematic picture of the entire surrounding reality is created. In this case, U (practical value of manufactured goods), C (total energy costs of a substance for production), and E (costs released into the environment in the form of impact) allow us to determine a complete list of criteria reflecting the most common properties inherent in any production system. The basic set of criteria that give a detailed description of the production systems efficiency allows us to consider the crucial directions of production complexes’ modernization, which are as follows:
  • minimizing the energy intensity per unit of production,
  • minimizing environmental impacts per unit of product, and
  • minimizing environmental impact per unit of consumed energy.
These are the main criteria for the sustainable development of the country’s industrial complex. It is advisable to use the rating system methodology [29] as the basis for regulation to ensure that the natural environment’s consumption is considered in economic activity. This approach ensures the regulation of economic activities based on the fundamental principles of environmental safety. If the total energy cost of a substance for production is denoted as C, the cost of usefully used manufactured products as U, and emissions to the environment as impacts as E, then the generalized production process can be expressed in terms of U, E, C as ratios:
U/C ratio is the energy efficiency ratio of a production system. The U/C ratio refers to the authors’ ERE rating.
The C/E ratio refers to the proportion of useless or harmful factors dispersed in the environment. Harmful factors include waste, disturbed soil, car exhaust, sewage, and gas plumes from pipes in specific manufacturing processes. Indeed, it is the inefficiency of the production system or CHA (coefficient of harmful action). However, it is more reasonable to use the inverse—C/E ratio, which reflects technological efficiency, since it does not contain product parameters and only reflects the internal characteristics of the system production processes. The E/C ratio refers to the authors’ TE. The previous two coefficients characterize the ratio of parts of a whole (see Figure 2).
U/E—characterizes environmental “purity” and low resource consumption per unit of the final product and can be called environmental efficiency. In addition to the three paired combinations, there is also a combination of all three elements: U/(E × C)—high values of this indicator mean that the production of products exceeds the consumed energy and produced efficiency. Energy resource efficiency is an additional volume of products produced not only at the expense of material expenditures of energy but also the primary changes in the production system’s structure and diversity, using adaptive stability information mechanisms. The U/(E × C) ratio refers to the authors’ EI Rating. The rating methodological scheme is shown in Figure 3.
The verified and updated statistics for each region are expressed as a % of the total for all China’s provinces. As a result, the consumption of all types of fuel, hydro and nuclear energy, taking into account interregional flows, gives the indicator C. The volume of product production (GDP without a rental component) corresponds to the U indicator. Environmental impacts indicators, such as water use, polluted effluents, air emissions from stationary and mobile sources, waste generation, after converting them into a percentage, could be calculated as complex environmental impacts E indicator. The calculation could be done by adding five percent for water, effluents, emissions, exhaust, and waste and dividing the sum by five.
Next comes the quantitative performance indicators’ formula:
We calculated the ERE rating by using the formula (see Equation (1)):
ERE = 100 × U C × E
where
U—useful value of manufactured goods,
C—total energy costs of a substance for production, and
E—costs released into the environment in the form of impact.
ERE shows the average between the environmental performance indicator (U/E) and the energy efficiency indicator (U/C). The result describes the number of useful products produced per unit of energy consumption and its impact on the environment. The estimate is expected to be a certain amount of substance-energy that is spent on production. Some amount of energy is inevitably dissipated in the environment in the form of various influences during production. The TE rating measures the fraction of energy–material flux that was not dispersed to the environment during production but was put to proper use (see Equation (2)).
TE = 100 × C E
where
C—total energy costs of a substance for production, and
E—costs released into the environment in the form of impact.
The dynamics of technological efficiency reflect the change in energy consumption and the entire set of waste for the industrial complex unit. A decrease in the criterion indicates that the economics’ “engine” consumes more energy and produces more “smoke.”
In 2014, the EI rating was added to these indicators. EI is the ratio of the ecosystem’s sustainability potential to the intensity of environmental impact. Two enterprises with the same waste emissions have a different impact on the environment, depending on their assimilation potential. The EI rating does not reflect the formal statistical impact of production but shows the real impact felt by everyone living in the area where it is located. It makes sense to measure this rating as the ratio of the ecosystem sustainability to the industrial companies’ intensity of the impact on the environment (see Equation (3)):
  Ecosystem   Impact   ( EI )   Rating   = 100 × Ecosystem   resilience   reserve Impact   on   the   environment
where
Ecosystem   resilience   reserve means the potential of the ecosystem sustainability.
The effect intensity was measured in the production of provincial goods with pollution, waste, and electricity consumption. The EI rates are expressed as a percentage of the average country level (for China it equals 100).
The higher the numerator, the more sustainable ecosystem reserves are, as this can be viewed as a potential for conservation in the area. Likewise, the lower the denominator, the higher the enterprise’s impact on nature and the higher the enterprise’s ecosystem efficiency indicator.

3. Results

3.1. Chinese Provinces’ Evaluation

To evaluate the Chinese provinces’ energy-resource, technological, and ecosystem impact, the authors analyzed the intensity of impacts and justify amendments or culls. The rating evaluation results can be seen in Table 3. The higher the coefficient, the better province’s environmental or energy efficiency (average efficiency in China = 100).
In Table 3, the ranking was according to the ERE rating. All these ratings show the potential capability of the Chinese provinces. Rating results for the provinces of China can be found in Figure 4, Figure 5 and Figure 6.
ERE rating the highest level: Beijing, Tianjin, and Hainan. Beijing, Tianjin, and Hainan have a very high level of energy efficiency. These cities have less manufacturing activity and less impact on the environment. Hainan’s rapid economic development and urbanization continue to stimulate energy consumption growth. The 13th Five-Year Plan emphasized that China promotes the energy revolution, and Hainan is suitable for carrying out the pilot demonstrations. Because of the impact of the new projects on petrochemistry, Hainan’s industrial energy consumption was above the rapid growth scale, coupled with the continuous rigid growth of social electricity consumption.
ERE rating, high level: Shanghai and Tibet are relatively high in renewables. Tibet is exceptional with no traditional industry. Ningxia is a relatively big coal and petrochemical industry compared to its total output. It is reasonable to assume that Tibet has the environment’s ability to repair itself.
ERE rating, middle level: Jilin, Chongqing, Zhejiang, Fujian, Qinghai, and Ningxia. Several cities with a middle index, such as Chongqing and Zhejiang, are not highly populated industry cities.
ERE rating, low level: Heilongjiang, Gansu, Shaanxi, Jiangsu, Shanxi, Guangdong, Inner Mongolia, Liaoning, Jiangxi, and Guangxi. Most provinces with low resource efficiency are highly populated regions.
The lowest level of the ERE rating could be observed in the following provinces: Henan, Hebei, Sichuan, Guizhou, Yunnan, Shandong, Hunan, Anhui, Xinjiang, and Hubei.
The energy efficiency of Henan is different; Zhengzhou city, Kaifeng city, Xuchang City, Luohe city, and Zhumadian city’s energy efficiency is relatively low. However, energy efficiency in the central and north regions is higher than in the southern region. Henan is under optimization of energy structure, strengthening regional exchanges and cooperation, industrial structure adjustment and technological progress. These measures must help to improve the province’s energy efficiency in the near future.
Shanxi, Beijing, and Tianjin showed the highest level in terms of the TE rate factor. Furthermore, the provinces like Sichuan, Chongqing, Guangdong, Fujian, Henan, Shanghai, Shandong, Hebei, Liaoning, and Zhejiang follow this behavior for the TE factor. It can be observed that the regions with relatively high TE are the coastal provinces. Chongqing, Sichuan, Tianjin, and Beijing have a very high economic and educational development level, which can lead to scientific and technological progress. China’s high-tech industries are rapidly developing in these provinces.
TE rating, middle level: Jilin, Inner Mongolia, Jiangsu, Hubei, Hunan, and Tibet.
TE rating, low level: Heilongjiang, Ningxia, Shaanxi, Anhui, Jiangxi, Guizhou, Guangxi, and Hainan.
TE rating, the lowest level: Yunnan, Qinghai, Gansu, and Xinjiang.
Figure 5 shows that provinces with the lowest level are mostly in the northwest of the country, where natural resources (except for petroleum in Xinjiang) are insufficient. Yunnan provinces have tourism as their primary industry. Thus, technological efficiency has the lowest level. However, Yunnan government started to support the development of high-tech sectors in recent years. According to the population migration direction these years, most labor and talent tend to migrate to developed places, namely, the provinces with high TE ratings in our study. Western China’s situation is far less favorable than in eastern China, where most provinces have the lowest level of technological efficiency. The situation is generally better in coastal areas than in inland areas. The pillar industry in Xinjiang is the oil industry, while Gansu’s pillar industry is the agricultural industry. The primary industries of coastal cities are generally trade, fishing, and tourism. Xinjiang is the new Silk Road Economic Zone core area; industrialization development has excellent opportunities and brings a significant challenge to this area.
Fujian, Jiangxi, Chongqing, Guizhou, and Hunan presented the highest level for the EI rate. Energy consumption is an essential aspect of the impact on ecosystems. Fujian, Jiangxi, and Guizhou reduced energy consumption per unit of economic output and improved energy efficiency.
Shaanxi, Hubei, Sichuan, Yunnan, Guangxi, Guangdong, Hainan, and Zhejiang provinces provided a high level of EI rate. In absolute terms, these provincial and urban rating values are also higher than the national average. These provinces are from the central and western regions. Furthermore, the usage of environmentally friendly new energy sources such as solar energy and geothermal energy improves the eco-efficiency of provinces. For example, in the three northern regions (northeast, north, and northwest) with abundant wind energy’s resources, the wind energy annual sufficient power density is above 200 Watt/meter. China has found more than 3200 geothermal anomalies and 255 high-temperature geothermal systems across the country, with an estimated total generating potential of 5800 Megawatt (MW), mainly in southern Tibet and western Yunnan and Sichuan. They affect the current local eco-efficiency and provide the possibility to improve the eco-efficiency in China as a whole.
Beijing, Heilongjiang, Jilin, Liaoning, Inner Mongolia, Tibet, and Shanxi areas demonstrated middle level in the EI rating factors compared to other areas. Among all provinces and urban areas, Beijing has a high EI rating value and is ahead of the curve. Beijing’s per capita GDP is second only to Shanghai, ranking second in the country, while its ecological footprint is ranked tenth in the country, not high. Thus, taken together, Beijing has the highest level of ecological civilization, and its economic development is the most resource-saving and environment-friendly.
For the low-level EI rating factors, Anhui, Henan, Hebei, and Gansu belong to this category. The echelons of these provinces have lagged behind the national average. The ecosystems’ efficiency rating shows the viability of ecosystems in terms of the ability to “digest” anthropogenic impacts on the environment.
Following the scale rate, Shanghai, Jiangsu, Tianjin, Shandong, Qinghai, Xinjiang, and Ningxia appeared for the lowest EI rating. In all other areas except Qinghai, the ecological footprint is more significant than the ecological carrying capacity, the ecological deficit is evident, reflecting the enormous pressure on China’s ecology [46].
The results show two types of systemically manifested deviations—a significantly lower level of ecosystem efficiency in Chinese provinces and substantially higher energy and resource efficiency in capitals and business centers in China. The authors can also note that the overpopulation and transformation of nature in the eastern part of China do not compensate for western continental provinces and autonomous regions. Here, intact desert and steppe ecosystems have a naturally low potential for viability.

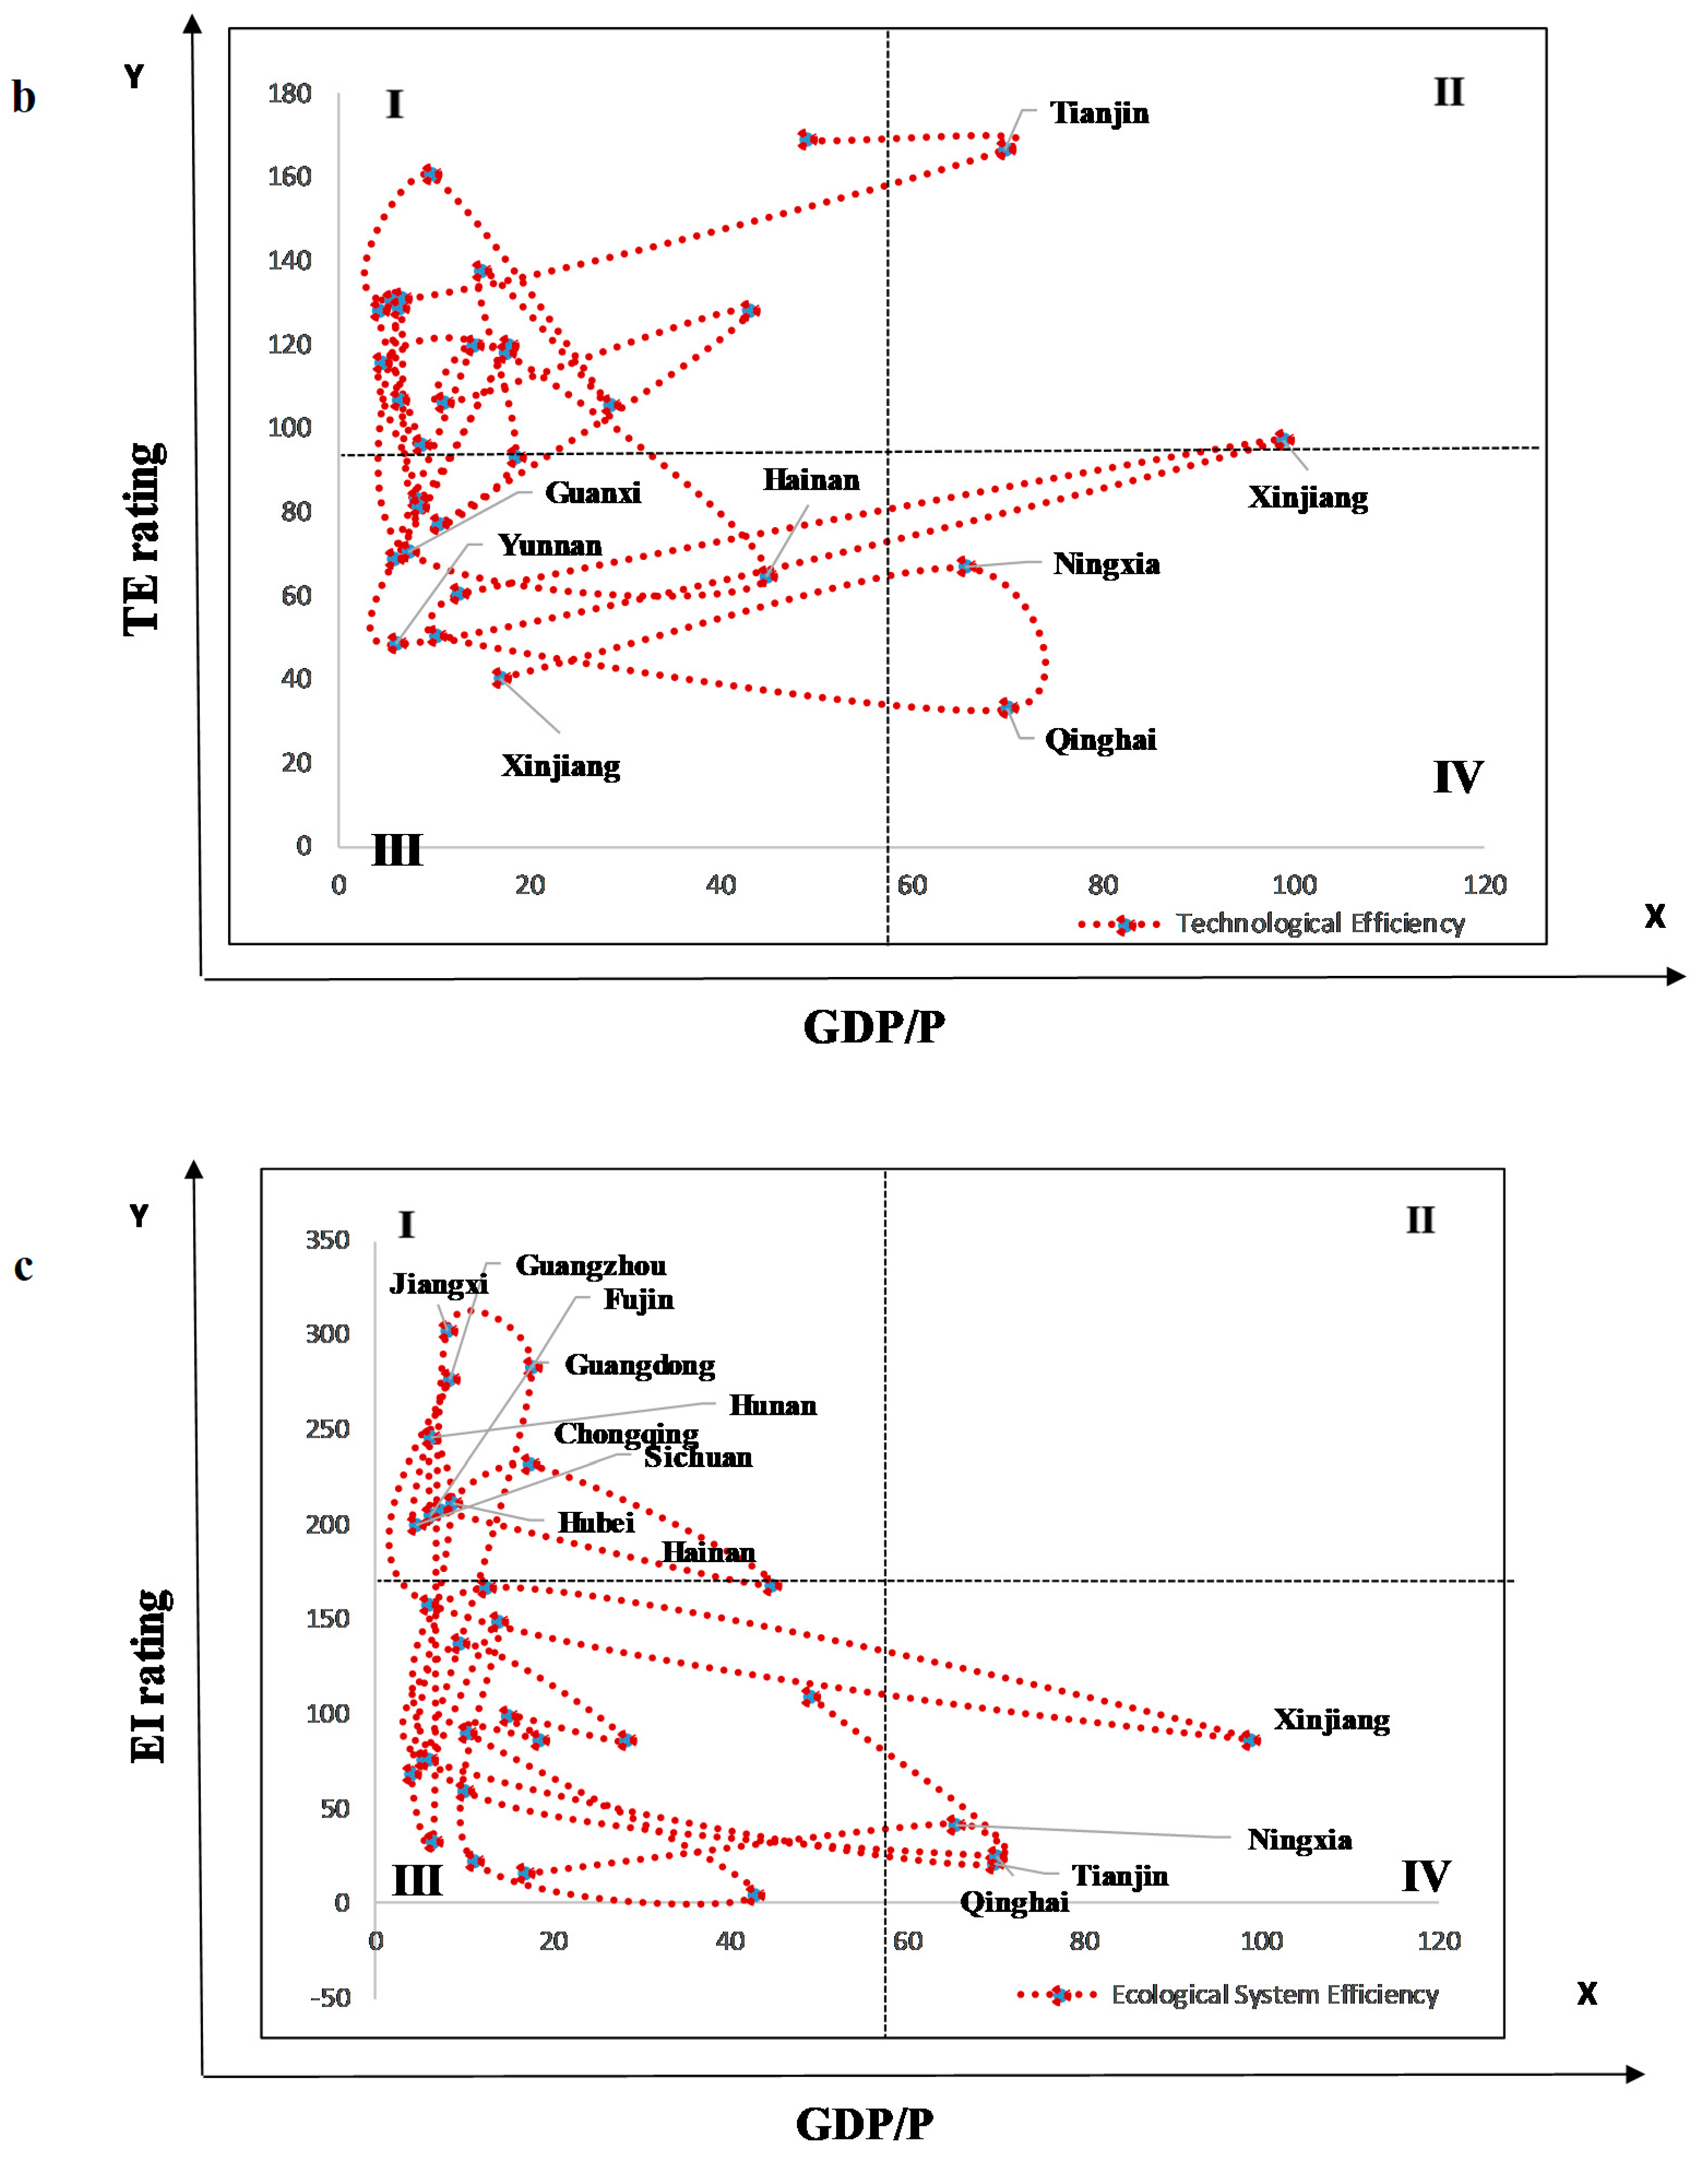
3.2. Strategic Matrix for China’s Environmental Policy Recommendations

The authors built a strategy matrix for analyzing China’s provinces’ rating evaluation results (see Figure 7 and Figure 8). The strategic matrix consisted of four parts and was based on the assessing the GDP/Population (GDP/P) rate and three ratings—ERE rating, TE rating, and EI rating.
Let us assume that the GDP/P vertical is growing and the efficiency horizontal is increasing from left to right. Then the quadrants mean the following:
I.
It is increasing GDP/P with low rating efficiency. Growth without green sustainability. Province development to the detriment and at the expense of natural resources. China implemented this strategy during the breakthrough, and now it is trying to get away from it.
II.
It is increasing GDP/P high rating efficiency—sustainable green growth. The desired strategy of sustainable development—all production indicators are high, and the natural environment operates in a gentle, preserved mode. Moving here from the current state requires increasing efficiencies.
III.
It is declining GDP/P with low rating efficiency. Low economic growth with catch-up efficiency. This strategy is also one of the options for sustainable development—but when they do not try to increase efficiency by adjusting it to the level of GDP/P, they try to reduce all production (degrade) to the level when a balance with efficiency is reached. All efficiencies remain consistently low (or may even decrease).
IV.
It is declining GDP/P with high rating efficiency. Transition to sustainable green growth. This strategy is most likely the ideal of “green development” that should be pursued. Production is becoming more efficient (both resource-wise, technologically, and environmentally), and its gross levels are decreasing—there is a process of reasonable reduction of material needs. It is a transition to the ecologically oriented economy.
The matrix can describe the current state and develop strategies using “development, growth, decline” for a reason. The quadrants contain a macro forecast for different development strategies. If there are data for several years, then we can build a matrix for each year, which tracks from which quadrant to which a province migrates over time (or does not migrate).
To build the matrix, the authors have done three steps:
  • The GDP/P values marked on the on the vertical axis of the strategic matrix.
  • ERE/TE/EI rating results values marked on the horizontal axis of the matrix.
  • The average values marked on the axes result from the average meanings of the GDP/P and Rating.
Please, see results in Figure 8a–c.
Figure 8a shows that Tianjin is in quadrant II with a sustainable energy-resource efficiency strategy. Tibet, Ningxia, and Qinghai are in quadrant IV in the transition to sustainable energy efficiency. Beijing, Hainan, and Shanghai in quadrant I with a very high economic growth level with low energy efficiency, all other provinces are in quadrant III with low economic growth and with catch-up efficiency.
In Figure 8b, Tianjin is in quadrant II with green sustainable technological growth concerning technological efficiency. Tibet, Ningxia, and Qinghai are in quadrant IV with a transition to green technology efficiency. Yunnan, Shaanxi, Xinjiang, Guangxi, Gansu, Hainan, and Anhui are in quadrant III with low economic growth and catch-up technological efficiency. All other provinces are in quadrant I with a high level of economic growth and low green technology sustainability.
In Figure 8c, EI rating indicate that Tianjin, Tibet, Qinghai, and Ningxia are in quadrant IV and have development stage with transition to the eco-sustainable growth economy. Guangxi, Jiangxi, Fujian, Guizhou, Guangdong, Hunan, Sichuan, Hubei, and Chongqing are in quadrant I with a high level of economic growth with the middle level of green sustainability. Other provinces are in quadrant III with a low catch-up green economy efficiency.

4. Discussion

Rapid industrialization and urbanization in China’s provinces led to greater prosperity and improved living standards and, on the contrary, created an upward trend for energy demand and increased pressure on ecosystems [47,48]. In the 12th five-year plan (2011–2015) in China, seven primary tasks were set: reduction of pollutant emissions; improving the sources and quality of drinking water; control of pollution caused by hazardous chemicals and hazardous waste; improving the performance of urban environmental infrastructure; reversing environmental degradation; improving nuclear safety; and strengthening institutions for ecological regulation [31,49]. Environmental development goals include a 17% reduction in carbon emissions per unit of GDP and 16% of energy consumption per unit of GDP, and an increase in the forest area to 21.66% [24,26]. China, therefore, wishes to contribute to the green economy development [50] and seeks the mechanism to develop environmentally oriented ratings.
The research was directed primarily to figuring out whether the Interfax-ERA methodological approaches were developed under the support of the UN research framework. The possibility to apply them in China to assess the environmental, technological, and energy efficiency was explored.
The essence of the ERA ratings:
  • Ratings are not the experts’ opinion but are calculated using well-known formulas from theoretical premises, which allows the ratings to be considered scientifically grounded.
  • Ratings are developed on the base of system methodology.
  • Ratings are entirely open, and calculations can be checked and repeated by everyone. Every rating methodology is also publicly available, and their correctness can be easily verified.
  • Ratings use only material indicators measurable in real physical quantities (i.e., tons, meters). Production systems spend a certain amount of substance-energy on sound production, some of which is inevitably dissipated into the environment during the production process. ERA ratings reflect the most realistic picture of the technological impacts on the environmental condition.
Several previous studies confirm the results of the Interfax-ERA ratings for China’s provinces. Thus, according to Cao et al. (2016), from 2005 to 2012, energy efficiency was at the highest level in eastern China, followed by central China, and at the lowest level in western China. In general, energy efficiency in the eastern, central, and western regions has declined over time, with fewer declines on the east part and more massive decreases in the central and western regions. Thus, the energy efficiency gap between the three areas tends to widen over time. In terms of time, energy efficiency in China usually shows a “U-shaped” trend “first down, then up,” especially in the central region [51]. The Group of the Taiyuan Central Branch of the People’s Bank of China (2019) and the Guigang Central Branch of the People’s Bank of China (2019) noted that from 2013 to 2018, the energy efficiency in the economy in eastern, central, and western China increased. Indeed, the mean value of total factor productivity in the eastern region is higher. The same situation can be observed in the central and western regions. It is relatively lower, mainly due to the enormous technological progress in the eastern region, which forces the real economy to use financial resources more efficiently. Tianjin, Fujian, Shanghai, Hainan, and Shandong are provinces with relatively high energy efficiency in the eastern region, as is Heilongjiang in the central Xinjiang region, and Qinghai in the western region [52].

5. Conclusions

Fulfilled tasks are described below:
(1) The study identified a complex set of social, economic, and environmental issues concerning transforming ERA-Interfax’s Ecosystem Impact (EI), ERE, and TE ratings for 31 inland Chinese provinces. This paper highlighted the importance of multifunctional expertise for developing instruments and methodological expertise between countries.
(2) The strategy matrix for analyzing Chinese provinces’ rating evaluation results was built.
The paper has come to some essential conclusions:
(1) There are two types of systematic deviations—significantly low level of ecosystem efficiency in the Chinese provinces and substantially high energy and resource efficiency in capitals and business centers.
(2) The authors emphasized that eastern China’s overpopulation is not compensated by the natural conditions of the western provinces and autonomous regions, where ecosystems have naturally low potential for viability.
The Matrix Strategy rating results in China concerning ERE rating showed that Tianjin follows a sustainable energy-resource efficiency strategy. Tibet, Ningxia, and Qinghai are on the path to achieve sustainable energy efficiency. Beijing, Hainan, and Shanghai have very high levels of economic growth with an increasing level of energy efficiency efforts. In terms of TE ratings, Tianjin has seen green sustainable technology growth. Tibet, Ningxia, and Qinghai are in the process of moving toward green efficiency. Yunnan, Shaanxi, Xinjiang, Guangxi, Gansu, Hainan, and Anhui have middle-level economic growth and high technological efficiency. All other provinces are experiencing high levels of economic growth and low sustainability of green technologies. In terms of the EI ratings, Tianjin, Tibet, Qinghai, and Ningxia are in transition to eco-sustainable growth economies. Guangxi, Jiangxi, Fujian, Guizhou, Guangdong, Hunan, Sichuan, Hubei, and Chongqing have a high level of economic development growth and need to improve green sustainability level.

Supplementary Materials

The following are available online at https://www.mdpi.com/2071-1050/13/1/354/s1, Table S1. (a) Russian regional ratings’ diversification (b) List of Russia’ regional ratings. Table S2. List of Research Indicators.

Author Contributions

Conceptualization, Z.W. (Zhen Wang), A.S., V.B. and A.M.; methodology, A.M. and V.A.; software Z.W. (Ziming Wang); validation, V.B. and A.M. (Ai Mingye); formal analysis, A.M., V.A., Z.W. (Ziming Wang), V.B. and A.K.; investigation, A.M. (Ai Mingye); data curation, Z.W. (Ziming Wang); writing—original draft preparation, A.S.; writing—review and editing, A.S.; visualization, A.S., Z.W. (Ziming Wang) and A.M. (Ai Mingye); supervision, Z.W. (Zhen Wang); project administration, A.S.; funding acquisition, Z.W (Zhen Wang). All authors have read and agreed to the published version of the manuscript.

Funding

This research was funded by Harbin Engineering University’ Fundamental Research Fund for the Central Universities “Sustainable Development of Green Silk Road from a Complex Network Perspective” (project no. 3072020CFJ0901) and Harbin Engineering University’ Fundamental Research Funds for the Central Universities “Digitally Driven Green Intelligent Manufacturing and Energy Ecological Governance Research” (project no. 3072020CFW0903).

Institutional Review Board Statement

Not applicable.

Informed Consent Statement

Not applicable.

Data Availability Statement

The data used to support the findings of this study are available from the corresponding author upon request.

Acknowledgments

The authors want to thank our editor and reviewers, for their valuable comments and advises.

Conflicts of Interest

The authors declare no conflict of interest. The funders had no role in the design of the study; in the collection, analyses, or interpretation of data; in the writing of the manuscript; or in the decision to publish the results.

Abbreviations

ADBAsian Development Bank (ADB)
AIIBAsian Infrastructure Investment Bank
ASCAquaculture Stewardship Council
BilBillion
CDP Carbon Disclosure Project
CHA Coefficient of Harmful Action
EBRDEuropean Bank for Reconstruction and Development
EI Environmental Impact rating (Interfax-ERA, Russia)
ERAEnvironmental and Energy Rating Agency Interfax, Russia
EREEnergy-Resource Efficiency rating (Interfax-ERA, Russia)
ESGEnvironmental–Social–Governance
FSCFirearm Safety Certificate
GSTGeneral Systems Theory
HAHectares
ICMMInternational Council on Mining and Metals
IFCInternational Finance Corporation
IOGBInternational Association of Oil and Gas Producers
KmKilometer
NERAIndependent Environmental Rating Agency, Russia
OECDOrganization for Economic Cooperation and Development
PPopulation
PRI Principles for Responsible Investments
MSCMarine Stewardship Council
mln.cub.m Million cubic meters
sq.km Square kilometer
TETechnological Efficiency rating (Interfax-ERA, Russia)
th.HAThousand hectares
th.m.cubThousand cubic meters
UN SDG United Nations Sustainable Development Goals
UNEP FIUnited Nations Environment Program Finance Initiative
WB World Bank
WWFWorld Wildlife Fund

References

  1. Kwon, W.S.; Englis, B.; Mann, M. Are third-party green-brown ratings believed? The role of prior brand loyalty and environmental concern. J. Bus. Res. 2016, 69, 815–822. [Google Scholar] [CrossRef] [Green Version]
  2. Daly, H. Sustainable Development: Definitions, Principles, Policies. In Ecological Economics and Sustainable Development; Selected Essays of Herman Daly; Jeroen, C.J.M., Robert, C., Eds.; Edward Elgar Publishing Limited: Cheltenham, UK, 2007; pp. 36–50. [Google Scholar]
  3. Bobylev SN Sustainable Development for Future Generations: Economic Priorities. World New Econ. 2017, 3, 90–96.
  4. Steblyanskaya, A.N.; Wang, Z.; Denisov, A.R.; Bragina, Z.V. Company sustainable growth as the result of interaction between finance, energy, environmental and social factors (in case of JSC “Gazprom”). St Petersburg Univ. J. Econ. Stud. 2020, 36, 134–160. [Google Scholar] [CrossRef]
  5. Interfax-ERA, Methodology for the Ecology and Energy Efficiency Evaluation of the Russian Economy (In Russian). Available online: https://open-era.ru/analitika/metodologiya/otsenka-predpriyatii#part4 (accessed on 21 November 2020).
  6. Das, N.; Das, D. Sustainability Reporting Framework: Comparative analysis of Global Reporting Initiatives and Dow Jones Sustainability Index. Int. J. Sci. Environ. Technol. 2014, 3, 55–66. [Google Scholar]
  7. OECD. Strategic Foresight for Better Policies. 2019, pp. 1–12. Available online: https://www.oecd.org/strategic-foresight/ourwork/Strategic%20Foresight%20for%20Better%20Policies.pdf (accessed on 21 November 2020).
  8. Clevenger, C.M.; Ozbek, M.E.; Simpson, S. Review of Sustainability Rating Systems used for Infrastructure Projects. In Proceedings of the 49th ASC Annual International Conference, Associated Schools of Construction, San Luis Obispo, CA, USA, 10–13 April 2013; pp. 10–13. [Google Scholar]
  9. Jabben, J.; Weber, M.; Verheijen, E. A framework for rating environmental value of urban parks. Sci. Total Environ. 2015, 508, 395–401. [Google Scholar] [CrossRef] [PubMed]
  10. Hu, M.; Cunningham, P.; Gilloran, S. Sustainable design rating system comparison using a life-cycle methodology. Build. Environ. 2017, 126, 410–421. [Google Scholar] [CrossRef]
  11. Mattinzioli, T.; Sol-Sánchez, M.; Martínez, G.; Rubio-Gámez, M. A critical review of roadway sustainable rating systems. Sustain. Cities Soc. 2020, 63, 102447. [Google Scholar] [CrossRef]
  12. Zarghami, E.; Fatourehchi, D. Comparative analysis of rating systems in developing and developed countries: A systematic review and a future agenda towards a region-based sustainability assessment. J. Clean. Prod. 2020, 254, 120024. [Google Scholar] [CrossRef]
  13. Lee, W.L. A comprehensive review of metrics of building environmental assessment schemes. Energy Build. 2013, 62, 403–413. [Google Scholar] [CrossRef]
  14. WWF. Environmental Standards for Operations of Oil and Gas Companies Acting in Russia. Available online: https://wwf.ru/en/resources/publications/booklets/environmental-standards-for-operations-of-oil-and-gas-companies-acting-in-russia/ (accessed on 21 November 2020).
  15. Tseng, M.L.; Wang, R.; Chiu, A.S.F.; Geng, Y.; Lin, Y.H. Improving performance of green innovation practices under uncertainty. J. Clean. Prod. 2013, 40, 71–82. [Google Scholar] [CrossRef]
  16. Du, J.L.; Liu, Y.; Diao, W.X. Assessing Regional Differences in Green Innovation Efficiency of Industrial Enterprises in China. Int. J. Environ. Res. Public Health 2019, 16, 940. [Google Scholar] [CrossRef] [PubMed] [Green Version]
  17. Yun, L. The Efficiency Study of Regional Technological Innovation: Based on the Provinces Level. Energy Procedia 2011, 5, 1579–1583. [Google Scholar] [CrossRef] [Green Version]
  18. Wang, H.; Bi, J.; Wheeler, D.; Wang, J.; Cao, D.; Lu, G.; Wang, Y. Environmental performance rating and disclosure: China’s GreenWatch program. J. Environ. Manag. 2004, 71, 123–133. [Google Scholar] [CrossRef] [PubMed] [Green Version]
  19. Nabeeh, N.A.; Abdel-Basset, M.; Soliman, G. A. Model for evaluating green credit rating and its impact on sustainability performance. J. Clean. Prod. 2021, 280, 124–140. [Google Scholar] [CrossRef] [PubMed]
  20. Li, Y.; Chen, X.; Wang, X.; Xu, Y.; Chen, PH. A review of studies on green building assessment methods by comparative analysis. Energy Build. 2017, 146, 152–159. [Google Scholar] [CrossRef]
  21. Chinese Academy of Environmental Planning (CAEP). The Chinese Environmental Policy Research Working Paper, Volume 7, pp. 1–31. Beijing. 2020. Available online: http://www.caep.org.cn (accessed on 21 November 2020).
  22. Baklanov, P.Y.; Bocharnikov, V.N.; Egidarev, E.G. The “Silk Road of China” and economic priorities of the Pacific Russia. IGCCMR. IOP Conf. Ser. Earth Environ. Sci. 2018, 190, 1–7. [Google Scholar] [CrossRef]
  23. Wang, C.; Wang, J.; Chen, P.; Huang, J.; Du, F.; Liu, W. Infrastructure Connectivity. In Joint Construction of Green Silk Roads: Social, Economic and Environmental Context, 1st ed.; Weidong, L., Ed.; The Commercial Press: Beijing, China, 2019; pp. 170–212. [Google Scholar]
  24. Weng, Q.; Xu, H.; Ji, Y. Growing a green economy in China. IOP Conf. Ser. Earth Environ. Sci. 2018, 121, 052082. [Google Scholar] [CrossRef]
  25. Interfax-ERA, Energy and Ecological Rating of the Russian and Kazakhstan Companies (In Russian). Available online: https://open-era.ru/reitingi/2020/top-150 (accessed on 21 November 2020).
  26. Pan, W.; Pan, W.; Hu, C.; Tu, H.; Zhao, C.; Yu, D.; Xiong, J.; Zheng, G. Assessing the green economy in China: An improved framework. J. Clean. Prod. 2019, 209, 680–691. [Google Scholar] [CrossRef]
  27. Interfax-ERA, Rating of the Fundamental Efficiency of the Regions at the End of 2008. Available online: https://open-era.ru/reitingi/2008 (accessed on 21 November 2020).
  28. Artyukhov, V. Objective assessment of environmental performance of economic activities: Methodology and results. Enterprises, regions of Russia, countries of the world. SPERO 2004, 2, 113–142. [Google Scholar]
  29. Artyukhov, V. System methodology for assessing the stability of natural and anthropogenic complexes (in Russian). Syst. Sci. Theory (Pract. Sci.) 2013, 1, 142. [Google Scholar]
  30. Vasiev, M.; Bi, K.; Denisov, A.; Bocharnikov, V. How Coronavirus Pandemics (COVID-19) Influences Chinese Economic Sustainability. Foresight STI Gov. 2020, 14, 7–22. [Google Scholar]
  31. Shi, B.; Yang, H.; Wang, J.; Zhao, J. City green economy evaluation: Empirical evidence from 15 sub-provincial cities in China. Sustainability 2016, 8, 551. [Google Scholar] [CrossRef] [Green Version]
  32. Wu, y.; Zhu, Q.; Zhu, B. Comparisons of decoupling trends of global economic growth and energy consumption between developed and developing countries. Energy Policy 2018, 116, 30–38. [Google Scholar] [CrossRef]
  33. Tang, X.; Jin, Y.; Feng, C.; McLellan, BC. Optimizing the energy and water conservation synergy in China: 2007–2012. J. Clean. Prod. 2018, 175, 8–17. [Google Scholar] [CrossRef]
  34. Reverte, C. Determinants of corporate social responsibility disclosure ratings by Spanish listed firms. J. Bus. Ethics 2009, 88, 351–366. [Google Scholar] [CrossRef]
  35. Feng, J.; Feng, L.; Wang, J.; King, C.W. Modeling the point of use EROI and its implications for economic growth in China. Energy 2018, 144, 232–242. [Google Scholar] [CrossRef]
  36. Tang, X.; McLellan, BC.; Snowden, S.; Zhang, B.; Höök, M. Dilemmas for China: Energy, economy and environment. Sustainability 2015, 7, 5508–5520. [Google Scholar] [CrossRef] [Green Version]
  37. Jia, X.; Sun, Q.; Gao, Y. New approaches to the green economy of China in the multiple crises. Energy Procedia 2011, 5, 1365–1370. [Google Scholar]
  38. Gorelik, G. Reemergence of Bogdanov’s Tektology in Soviet Studies of Organization. Acad. Manag. J. 2017, 18, 345–357. [Google Scholar]
  39. Gare, A. Aleksandr Bogdanov and Systems Theory. Democr. Nat. 2000, 6, 341–359. [Google Scholar] [CrossRef]
  40. Yan, J.; Feng, L.; Denisov, A.; Steblyanskaya, A.; Oosterom, J.-P. Complexity theory for the modern Chinese economy from an information entropy perspective: Modeling of economic efficiency and growth potential. PLoS ONE 2020, 15, e0230165. [Google Scholar] [CrossRef] [PubMed] [Green Version]
  41. Kleiner, G.; Rybachuk, M. System structure of the economy: Qualitative time-space analysis. Front. J. Soc. Technol. Environ. Sci. 2016, 5, 61–81. [Google Scholar] [CrossRef]
  42. Urmantsev, U. A. Symmetry of the Nature and Natural Symmetry (in Russian). 1965. Available online: http://www.sci.aha.ru/ (accessed on 21 November 2020).
  43. Urmantsev, U. A. Symmetry of System and Symmetry of System. Comput. Math. Appl. 1986, 12, 379–405. [Google Scholar] [CrossRef] [Green Version]
  44. Urmantsev, U.A. Nine Plus One Essay about System Philosophy (in Russian). 1962, pp. 1–89. Available online: http://www.sci.aha.ru/ (accessed on 21 November 2020).
  45. Artykhov, V.V. General System Theory: Selforganization, Sustainability, Diversity, Crises (in Russian); Book House “Librokom”: Moscow, Russia, 2014; 224p. [Google Scholar]
  46. Wuthnow, J. Chinese Perspectives on the Belt and Road Initiative: Strategic Rationales, Risks, and Implications. In China Strategic Perspectives; National Defense University Press: Washington, DC, USA, 2017; pp. 1–45. [Google Scholar]
  47. Cao, Y.; Carver, S.; Yang, R. Mapping wilderness in China: Comparing and integrating Boolean and WLC approaches. Landsc. Urban Plan. 2019, 192, 103636. [Google Scholar] [CrossRef]
  48. Niu, W. The Quality Index of China’s Gross Domestic Product (GDP). China Acad. Sci. J. 2011, 1, 516–525. (In Chinese) [Google Scholar]
  49. Tracy, E.F.; Shvarts, E.; Simonov, E.; Babenko, M. China’s new Eurasian ambitions: The environmental risks of the Silk Road Economic Belt. Eurasian Geogr. Econ. 2017, 58, 56–88. [Google Scholar] [CrossRef] [Green Version]
  50. Yi, H.; Liu, Y. Green economy in China: Regional variations and policy drivers. Glob. Environ. Chang. 2015, 31, 11–19. [Google Scholar] [CrossRef]
  51. The People’s Bank of China. The Research Group of Taiyuan Central Sub-branch, Financial Development, Financial Efficiency and Real Economy Development under the Background of Reform of the Supply Front-Based on the DEA-Malmquist Model (In Chinese). Available online: https://wap.cnki.net/touch/web/Journal/Article/JRFP201904009.html (accessed on 25 December 2020).
  52. The Impact of Inclusive Finance Development on the Income Gap between Urban and Rural Residents, based on PVAR model analysis Guigang Central Sub-Branch of the People’s Bank of China. Hebei Financ. J. 2019, 11, 37–42.
Figure 1. The workflow of data collection and analysis.
Sustainability 13 00354 g001
Figure 2. Rating system criteria. Source: [5].
Sustainability 13 00354 g002
Figure 3. Rating methodological scheme. Source: [5].
Sustainability 13 00354 g003
Figure 4. China provinces’ ERE rating (in % from the country’s average).
Sustainability 13 00354 g004
Figure 5. China provinces technological efficiency (in % of the country’s average).
Sustainability 13 00354 g005
Figure 6. China provinces’ ecosystems efficiency (in % of the country’s average).
Sustainability 13 00354 g006
Figure 7. Strategic matrix methodological scheme.
Sustainability 13 00354 g007
Figure 8. Matrix trajectory results for China Province’s strategy, 2018 based on the ratings: (a) ERE, (b) TE, (c) EI.
Sustainability 13 00354 g008aSustainability 13 00354 g008b
Table 1. The gap between Russia and China data (+ means availability of data, – means nonavailability of data).
IndicatorsRussiaChina
Regional GDP++
Energy consumption (consumption from all types of fuel and electricity produced at hydroelectric and nuclear power plants)++
Balance of interregional electricity flows++
Exhausts++
Hazardous waste ++
Water consumption++
Wastewater discharge (polluted water flows after economic use)++
Air emissions from stationary sources of pollution++
Emissions from transport+
Gasoline consumption+
number of civilian vehicles+
Length of roads+
Urbanized lands ++
Structure of natural ecosystems, area of forests and natural pastures (grass ecosystems of meadows, swamps, and deserts)++
Structure of natural ecosystems (tundra, swamps, and forests are differentiated according to the types of species prevailing)+
Wilderness protected area++
Biomass reserves, productivity, and biodiversity of ecosystems++
GDP, gross domestic product. Source: authors’ methodology.
Table 2. Three “primary” elements of Nature (N)–Technosphere (T)–Human (H)’ system matrix.
HTN
HH–HH–TH–N
TT–HT–TT–N
NN–HN–TN–N
Source: [45].
Table 3. China provinces’ energy-resource efficiency (ERE), technological efficiency (TE), ecosystem impact (EI) ratings evaluation results, 2017.
No.ProvincesEnergy-Resource EfficiencyNo.Technological EfficiencyNo.Ecosystem Impact Indicator
1Beijing568.81168.6015109.60
2Tianjin551.12166.502920.50
3Hainan508.02664.3010168.30
4Shanghai350.19127.70314.90
5Tibet271.41797.301986.50
6Ningxia220.12566.702542.00
7Qinghai200.63133.002724.50
8Fujian173.610119.702282.70
9Chongqing138.712118.005231.30
10Zhejiang134.511119.7013148.30
11Jilin129.31993.101886.80
12Jiangxi109.62082.901302.40
13Inner Mongolia106.416105.302086.40
14Liaoning84.84137.401699.30
15Shaanxi83.42760.3011166.70
16Jiangsu81.515105.902822.40
17Guangdong80.07128.508204.60
18Guangxi78.32370.507207.00
19Heilongjiang72.82276.701790.20
20Gansu69.12850.402459.10
21Shanxi68.93160.4014137.10
22Xinjiang65.83040.403015.30
23Hubei64.21896.106211.40
24Hunan63.014106.404245.80
25Anhui61.82468.602275.60
26Shandong50.45131.202632.60
27Guizhou49.32181.303276.10
28Henan48.18127.802368.20
29Yunnan47.72948.4012158.10
30Sichuan45.013115.209199.40
31Hebei44.06130.502176.40
Publisher’s Note: MDPI stays neutral with regard to jurisdictional claims in published maps and institutional affiliations.

