Abstract
In the context of global change, urban drainage infrastructures must be planned considering future challenges such as new climate change and urban growth scenarios. Large cities require master plans to properly rank and schedule infrastructure development. The flood mitigation measures proposed in previous plans must be revised and updated to address future urban challenges with special regard to climate scenarios. Regarding risk assessment, there is no linear relationship between an increase in rainfall and an increase in risk value. For risk management, the relationship between an increase in rainfall increase and the budget for mitigation measures is even more complex. To investigate this relationship and the economic impact of the aforementioned update, a new plan should be elaborated. Urban drainage master plans have been developed in Barcelona city for the last 50 years. In terms of rainfall, the impact of climate change has been established to be an increase of 7–26% at peak intensity, depending on rainfall duration. The Integral Drainage Master Plan of Barcelona (PDISBA) addresses these new challenges. The modification of rainfall scenario planning and the typology of mitigation measures result in an important rise in investment budget, infrastructure life cycle, and operation and maintenance budgets for said infrastructure. The total cost of the planned measures outlined in the PDISBA has risen to €1.442 million, nearly double that of the previous plan developed in 2006.
1. Introduction
Currently, 54% of the world’s population lives in urban areas, a proportion that is expected to increase to 66% by 2050 [1]. These urban areas are, due to the concentration of population assets and economic activities, some of the most sensitive regions to natural hazards [2]. Indeed, there is a common agreement regarding the relevance of the impact of climate change on our society [3,4,5], with urban flooding being a good example [6,7,8]. In this context, urban drainage systems can fail mainly due to a non-stationary climate and rapid urbanization and may become less efficient regarding crucial issues such as sewer overflows and an increase in urban flooding [9].
Therefore, urban flood and environmental risk assessments plays a crucial role, due to the need to plan and adopt mitigation measures. Specifically, a comprehensive risk assessment (focused on the management of social, economic, and environmental risks) is the proper way to quantitatively evaluate the benefits of adaptation measures in the field of urban drainage [9,10,11,12], using its tools, such as the expected annual damage (EAD) [13] or cost–benefit analysis (CBA) [14].
Climate change must be included in infrastructure design [15,16]. In the flood risk management cycle, climate change modifies the hazard results, altering to risk in the final value (in terms of EAD), and hence, modifying the mitigation measures as well. The design criteria of such measures could be the return period, the CBA, or the knee/elbow point, but in all of them, the effect of climate change will appear, thereby modifying the final investment budget. The complexity of the complete process and its particular steps makes it difficult to quantitatively relate climate change to investment budget.
Big cities such as Barcelona have been managing urban flooding risk for at least 50 years. This means that the drainage network has been homogeneously adapted to the regulations and the preferred design criteria; therefore, a small increase in circulating discharge could significantly affect the network’s global performance. Beyond the damage curves, this effect greatly impacts any planned improvements in the network. To properly investigate these impacts, the whole risk management cycle has been reproduced for climate change scenarios in the city of Barcelona. New flood management strategies, such as those related to improving the water quality of receiving water bodies (from the Mediterranean Sea and Bèsos River, in this case), include elements such as sustainable drainage systems (SUDSs) or low-impact development (LID), not present in previous plans, but which modify mitigation budgets in accordance with the hazard.
It is common to find previous research that assesses the impact of climate change in relation to flood risk [11,17,18], but it is not so common to find complete management cycles, including detailed measurements of the impact on big cities in terms of the economy and urban planning or of the environmental impacts considering the effects of combined sewer overflows on the receiving water bodies. However, there is previous research on the methodology regarding how to develop it [12].
Previous risk assessment research on the impact of climate change reveals that the quantitative relationship between risk and precipitation is not simple [11,13], due to the accumulation of non-linear steps. This relationship is expected to be more complex for the mitigation budget.
2. PDISBA Master Plan
The city of Barcelona is located along the west Mediterranean shoreline and it is confined by rivers to the north and south, mountains to the west, and sea to the east. The most important challenges it will have to address in relation to climate change (CC) are reduced water availability, a rising sea level, increased flooding and receding beaches, and deterioration of water quality in the receiving water bodies. The forecasted consequences of CC will require a new paradigm in urban planning for this century. A new time scale appears linked to CC, and infrastructures planned using present scenarios will be outdated in the mid-term. The PDISBA addresses these challenges by evaluating the impact for the next 80 years and proposing adaptation measures to be implemented during the next 20 years. However, the amount of the investment and the complexity of such projects require detailed analysis in terms of technical development and economic impact.
In order to perform a long-term analysis, it is necessary to include the operation and management activities and the life cycle of existing and projected infrastructures. All of these elements should be included in the economic evaluation of the master plan. The selected strategy to execute the analysis in Barcelona is to perform a CBA, which has been previously applied [19]. Due to the cross-interactions between measures, it is not possible to evaluate them as independent activities or to rank them using the results of the CBA. Moreover, it is not possible to cover the whole range of possible measure combinations. Herein, two different groups of measures were defined as modeling scenarios and were evaluated. The CBA results of the scenarios were only used to justify the investments. Additionally, the CBA results were obtained at the neighborhood scale and used for the prioritization of investments.
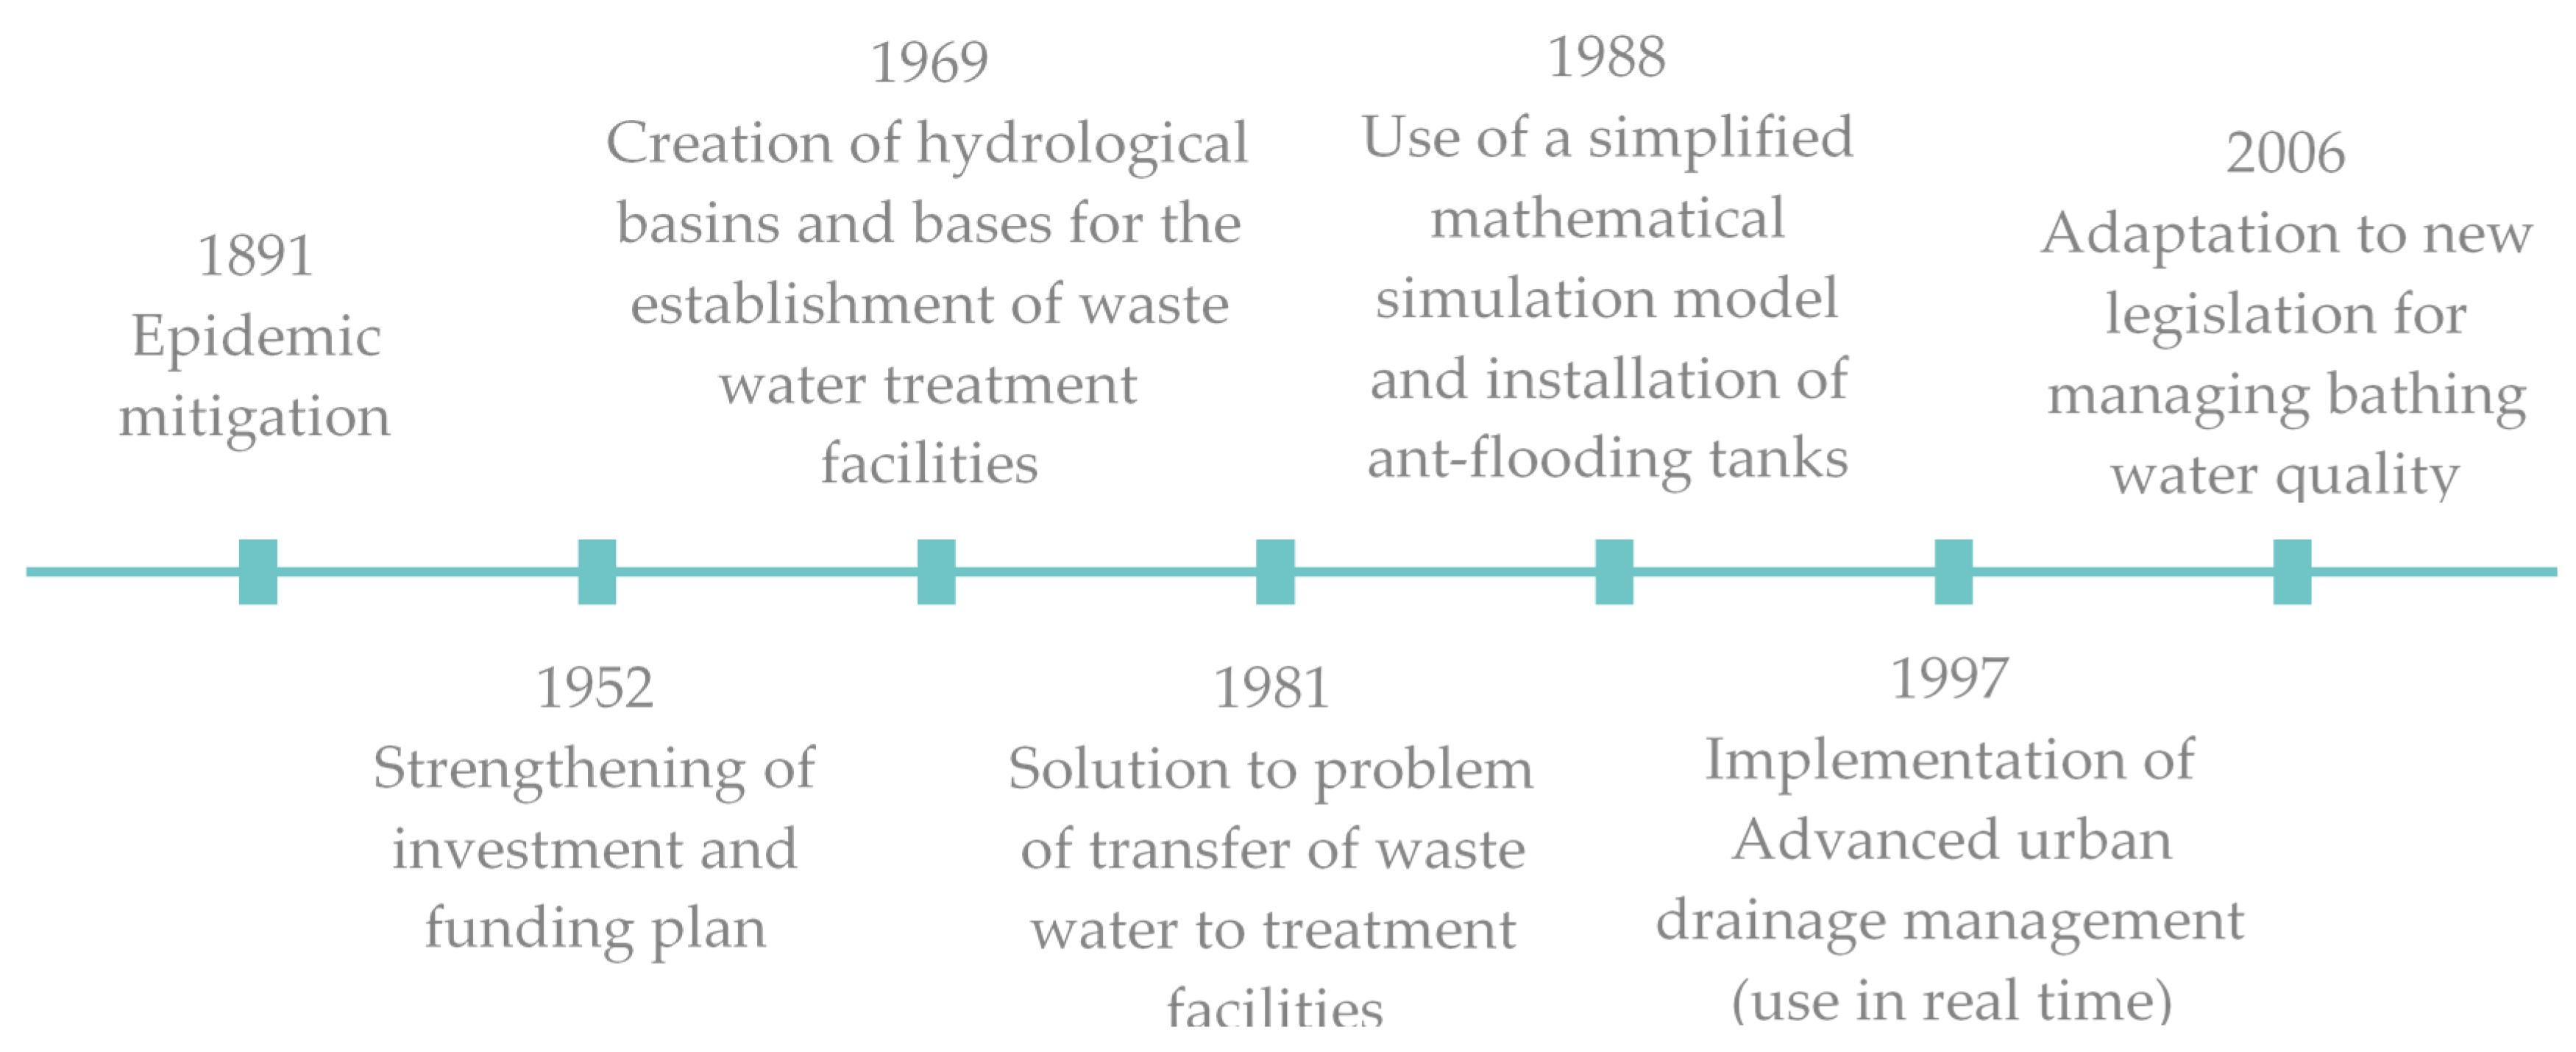
The PDISBA is intended to serve as an effective urban resistance tool that is capable of offering a set of adaptive strategies geared toward reducing the vulnerability of the urban environment and protecting people, assets, and the environment. The Comprehensive Plan for Barcelona’s Sewerage System (PICBA06), drawn up in 2006, is the plan currently in force. However, its projected timespan is not enough to provide answers to the needs posed by society on key issues such as the effects of CC and the social return on investment. Consequently, it was felt that there was a need and justification for updating the plan, with the aim of responding to the new social and environmental reality. Figure 1 shows the different milestones in the drainage master plan for Barcelona.
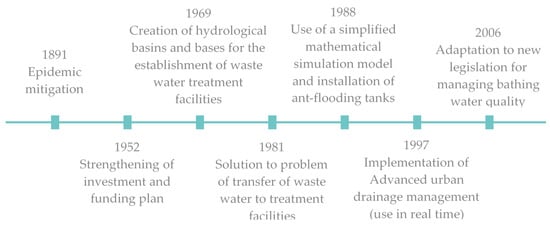
Figure 1.
Different milestones in the different Barcelona drainage plans.
With this commitment, the PDISBA is an ambitious city plan capable of delivering a response to the future challenges that society is calling for, thus becoming the first sewerage and drainage plan to successfully achieve the following specific goals:
- Consideration of CC forecast in its rainfall modeling scenarios;
- Inclusion of a bathing water coastal model;
- Extension of the impact analysis to include environmental, social, and economic damage;
- Inclusion of specific measures to mitigate CC;
- Consideration of sustainable urban drainage systems, also known as low-impact development;
- Inclusion of urban resilience analysis;
- Inclusion of cost–benefit analysis and economic efficiency;
- Inclusion of long-term analysis and mid-term investment.
3. Definition of Hydrological Scenarios
Climate change mitigation is one of the main goals of the PDISBA. The selected method to include CC in the plan is through extreme rainfall scenarios [20,21]. Instead of directly using additional coefficients to weight the existing rainfall scenarios, it was decided to perform a complete reanalysis of the available rainfall data.
The environmental impact of the urban drainage in Barcelona is mainly provoked by the combined sewer overflows (CSOs) in the sea and in the rivers. In order to properly analyze the effect of the plan’s measures on the CSO, a standard hydrological year was defined as having more than 50 rainfall events.
3.1. Rainfall Time Series Reanalysis and Storm Design
To date, studies into Barcelona’s rainfall have been calculated using rainfall data from the Fabra Observatory rain gauge station. The time series includes almost 100 years of data, but the location of the observatory in the mountains above the city cannot ensure, a priori, that it is representative of the whole city. Moreover, the temporal resolution of the data is less accurate than the new rain gauges’ time step. Since 1994, the city has developed a management plan to control the sewer system, installing a total of 25 new rain gauges that cover its entire surface. Hence, a long time series of rainfall data is available (approximately 24 years recorded by 25 rainfall graphs achieved by tipping bucket rain gauges), which permits the development of the entire statistical methodology based on real data.
The starting hypothesis is that the existing data do not yet suffer significant CC trends. Subsequently, the influence of the impact of climate change can be considered explicitly after the rainfall analysis, in accordance with the future scenarios obtained in recent studies of the Barcelona City Council and various climate models.
It is possible to directly estimate the empirical exceedance probability of the rainfall data recorded in the rain gauges during the years considered. This method is a good estimation of the maximum rainfall intensity for return periods shorter than the recorded years. For this case, this method was assumed to be valid for return periods of up to 10 years, using 24 years of data. The annual maximum intensity curves for each return period between years 1 and 10 were completed by interpolation of the available data from the empirical intensity–duration–frequency (IDF) table.
For return periods above or equal to the number of available data, an extrapolation must be performed. The maximum annual intensities for the return periods of 20, 25, 30, 50, 75, 100, and 500 years were calculated by extrapolating the parameters according to the Gumbel or extreme type I probability distribution. With the curves corresponding to the 95th percentile for each return period, joint IDF curves for the city of Barcelona were constructed for both the empirical curves and the curves extrapolated by Gumbel.
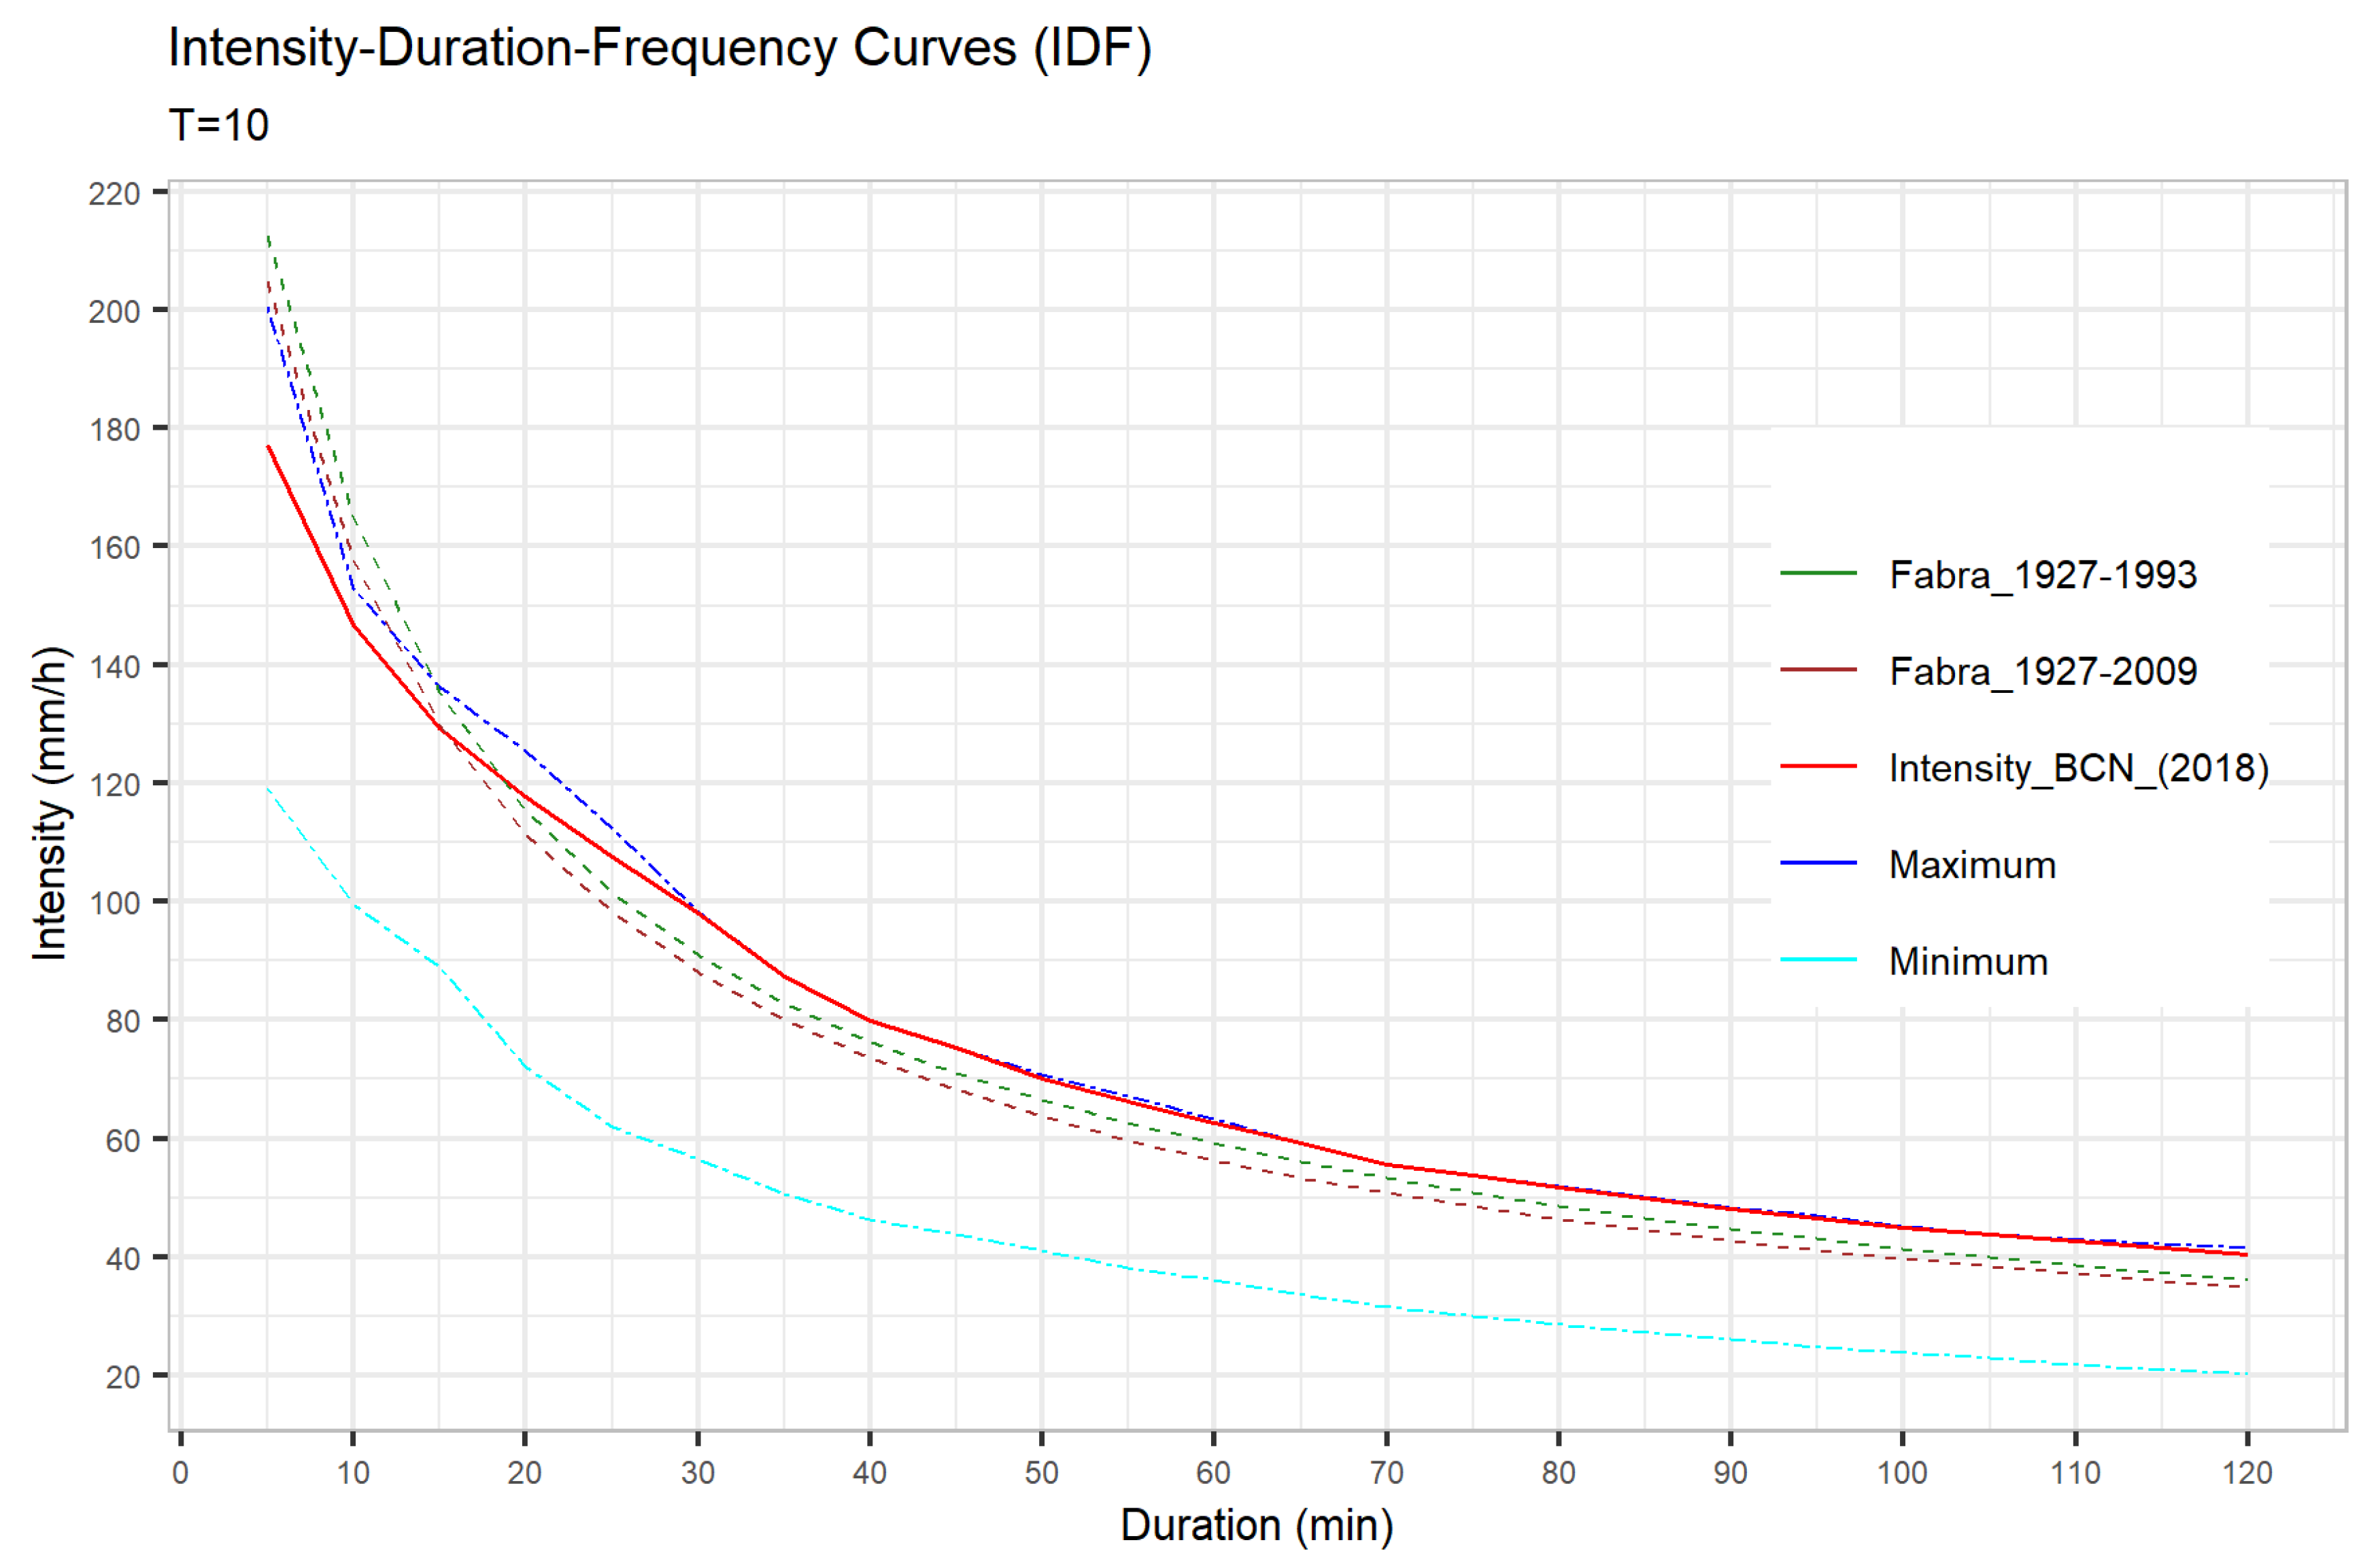
Figure 2 compares the IDF curves obtained using the Fabra Observatory dataset and the new dataset developed in the PDISBA using the new rain gauges’ data. The plot shows the 10-year return period plots.
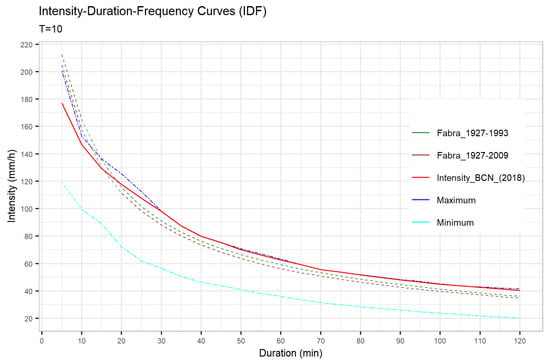
Figure 2.
Comparison between the Intensity–Duration–Frequency (IDF) curves used in the previous master plans and the new plan, PDISBA (“Fabra_*”). The maximum and minimum lines were obtained using the different rain gauges across the city. The selected intensity (“Intensity_BCN_2018”) corresponds to the 95% confidence interval.
As has been stated, the selected intensity of the IDF curves corresponds to the 95% confidence interval of the data. The blue line in the plot shows the maximum observed intensity and the cyan line corresponds to the minimum. The dispersion corresponds to the 25 available rain gauges. It can be observed that, for short durations, the Fabra Observatory IDF curves overestimated the rainfall intensity, but for long durations, they underestimated the precipitation.
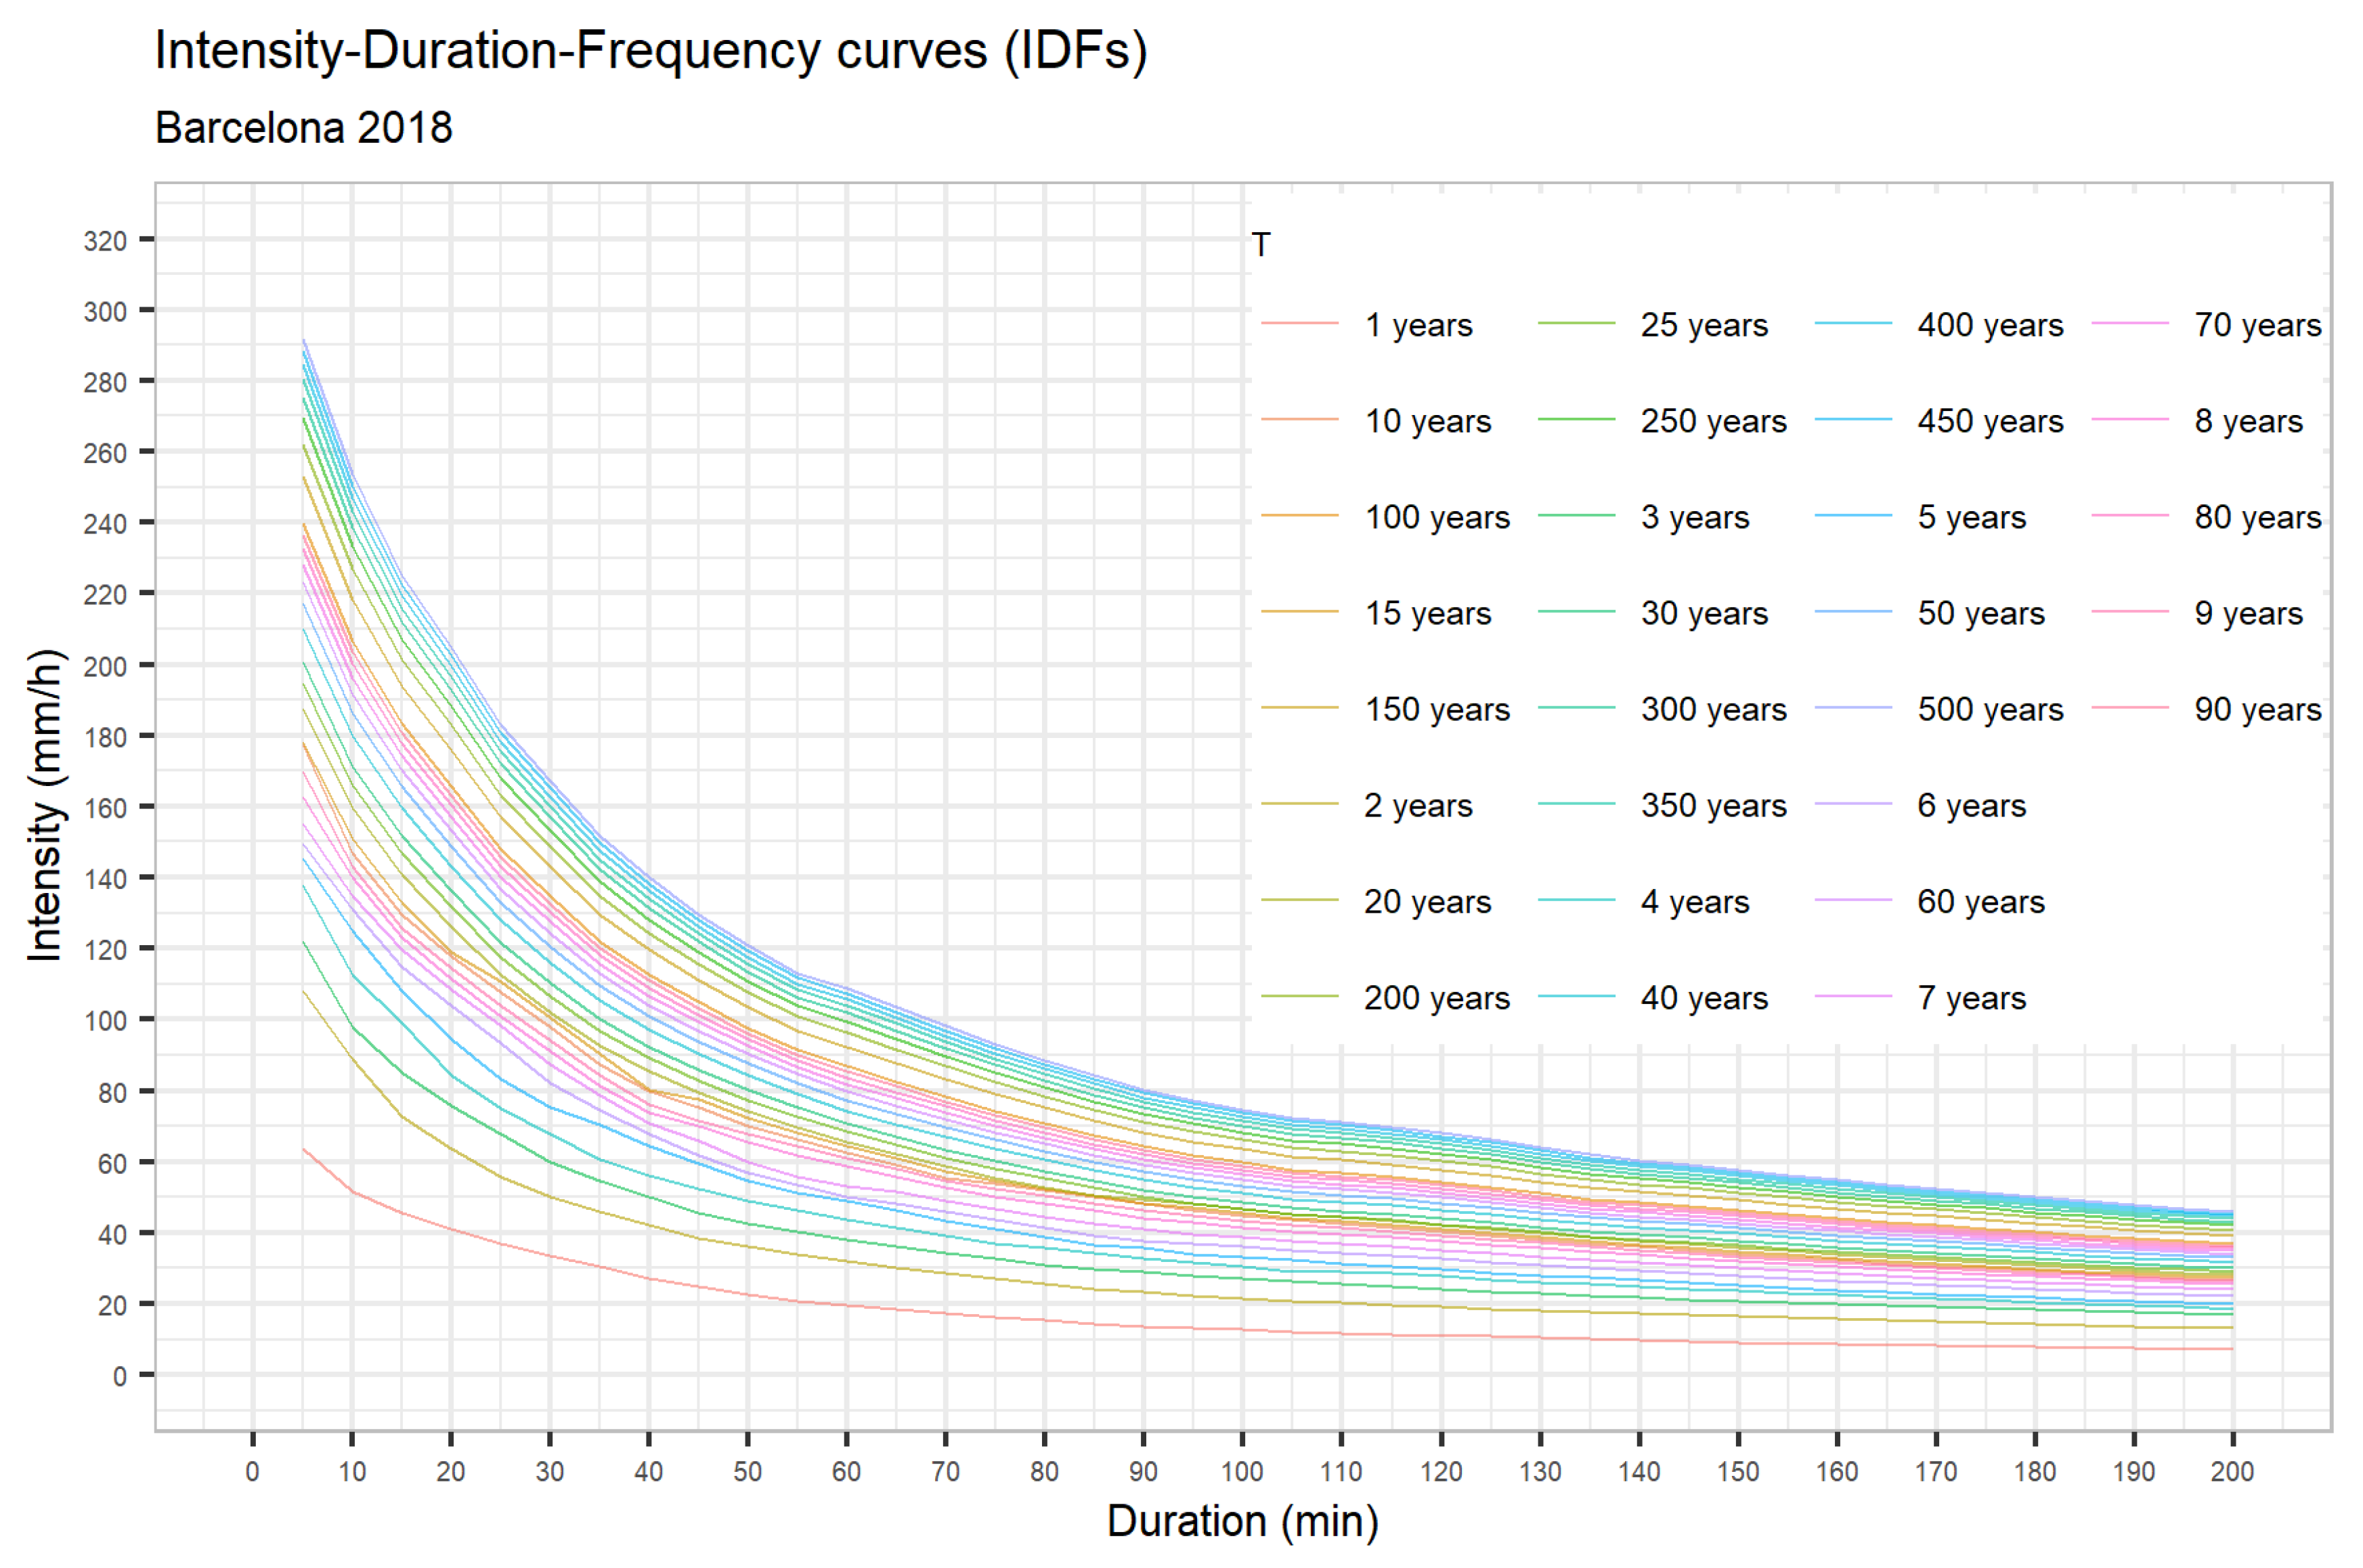
Figure 3 shows the IDF curves obtained by the empirical method for return periods equal to or less than 10 years, as well as the IDF curves obtained by extrapolation using the Gumbel distribution. The former exhibits a smoother shape, due to the mathematical extrapolation.
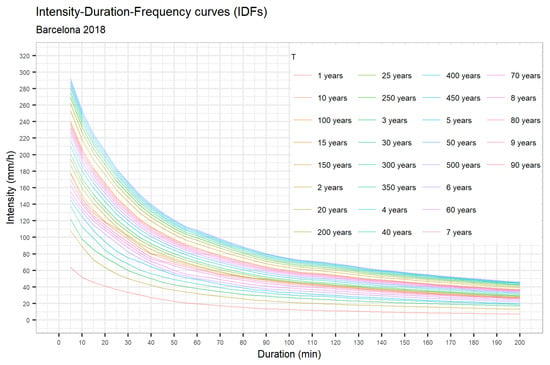
Figure 3.
IDF curves obtained using the data from the 1994–2018 period and fitted to the 95% confidence interval for the empirical IDF curves.
Hyetographs, designed using synthetic rainfall scenarios, were constructed using the alternating block method [22] and the S-curves method [23]. Analysis of the temporal pattern of the rainfall was conducted on a selection of the extreme rainfall events recorded in the last 24 years. According to the study of the temporal distribution of the rain, the average duration varied between 160 and 230 min for the different curves. In the alternating blocks hyetographs, the tails corresponding to the difference between 160 and 230 min were analyzed and finally discarded; therefore, a rainfall duration of 160 min was finally selected. The precipitation duration for the previous plans was approximately 60 min [24].
The second parameter to be established was the intensity peak position in the hyetograph, for which the alternating block method permitted to translate the central intensity peak in order to advance or delay it. The analysis was performed using the S-curves S1, S2, and S3 fitted to the rain gauge data. It was observed that for shorter return periods, the rain showed a centered peak. For rains corresponding to return periods greater than T = 10 years, there was a similar probability of finding the three types of curve (S1, S2, and S3). To conclude which was the most harmful, several model runs were performed using three prototypes of rainfall temporal distribution. For the 10-year return period, it was observed that a delayed peak resulted in higher discharge.
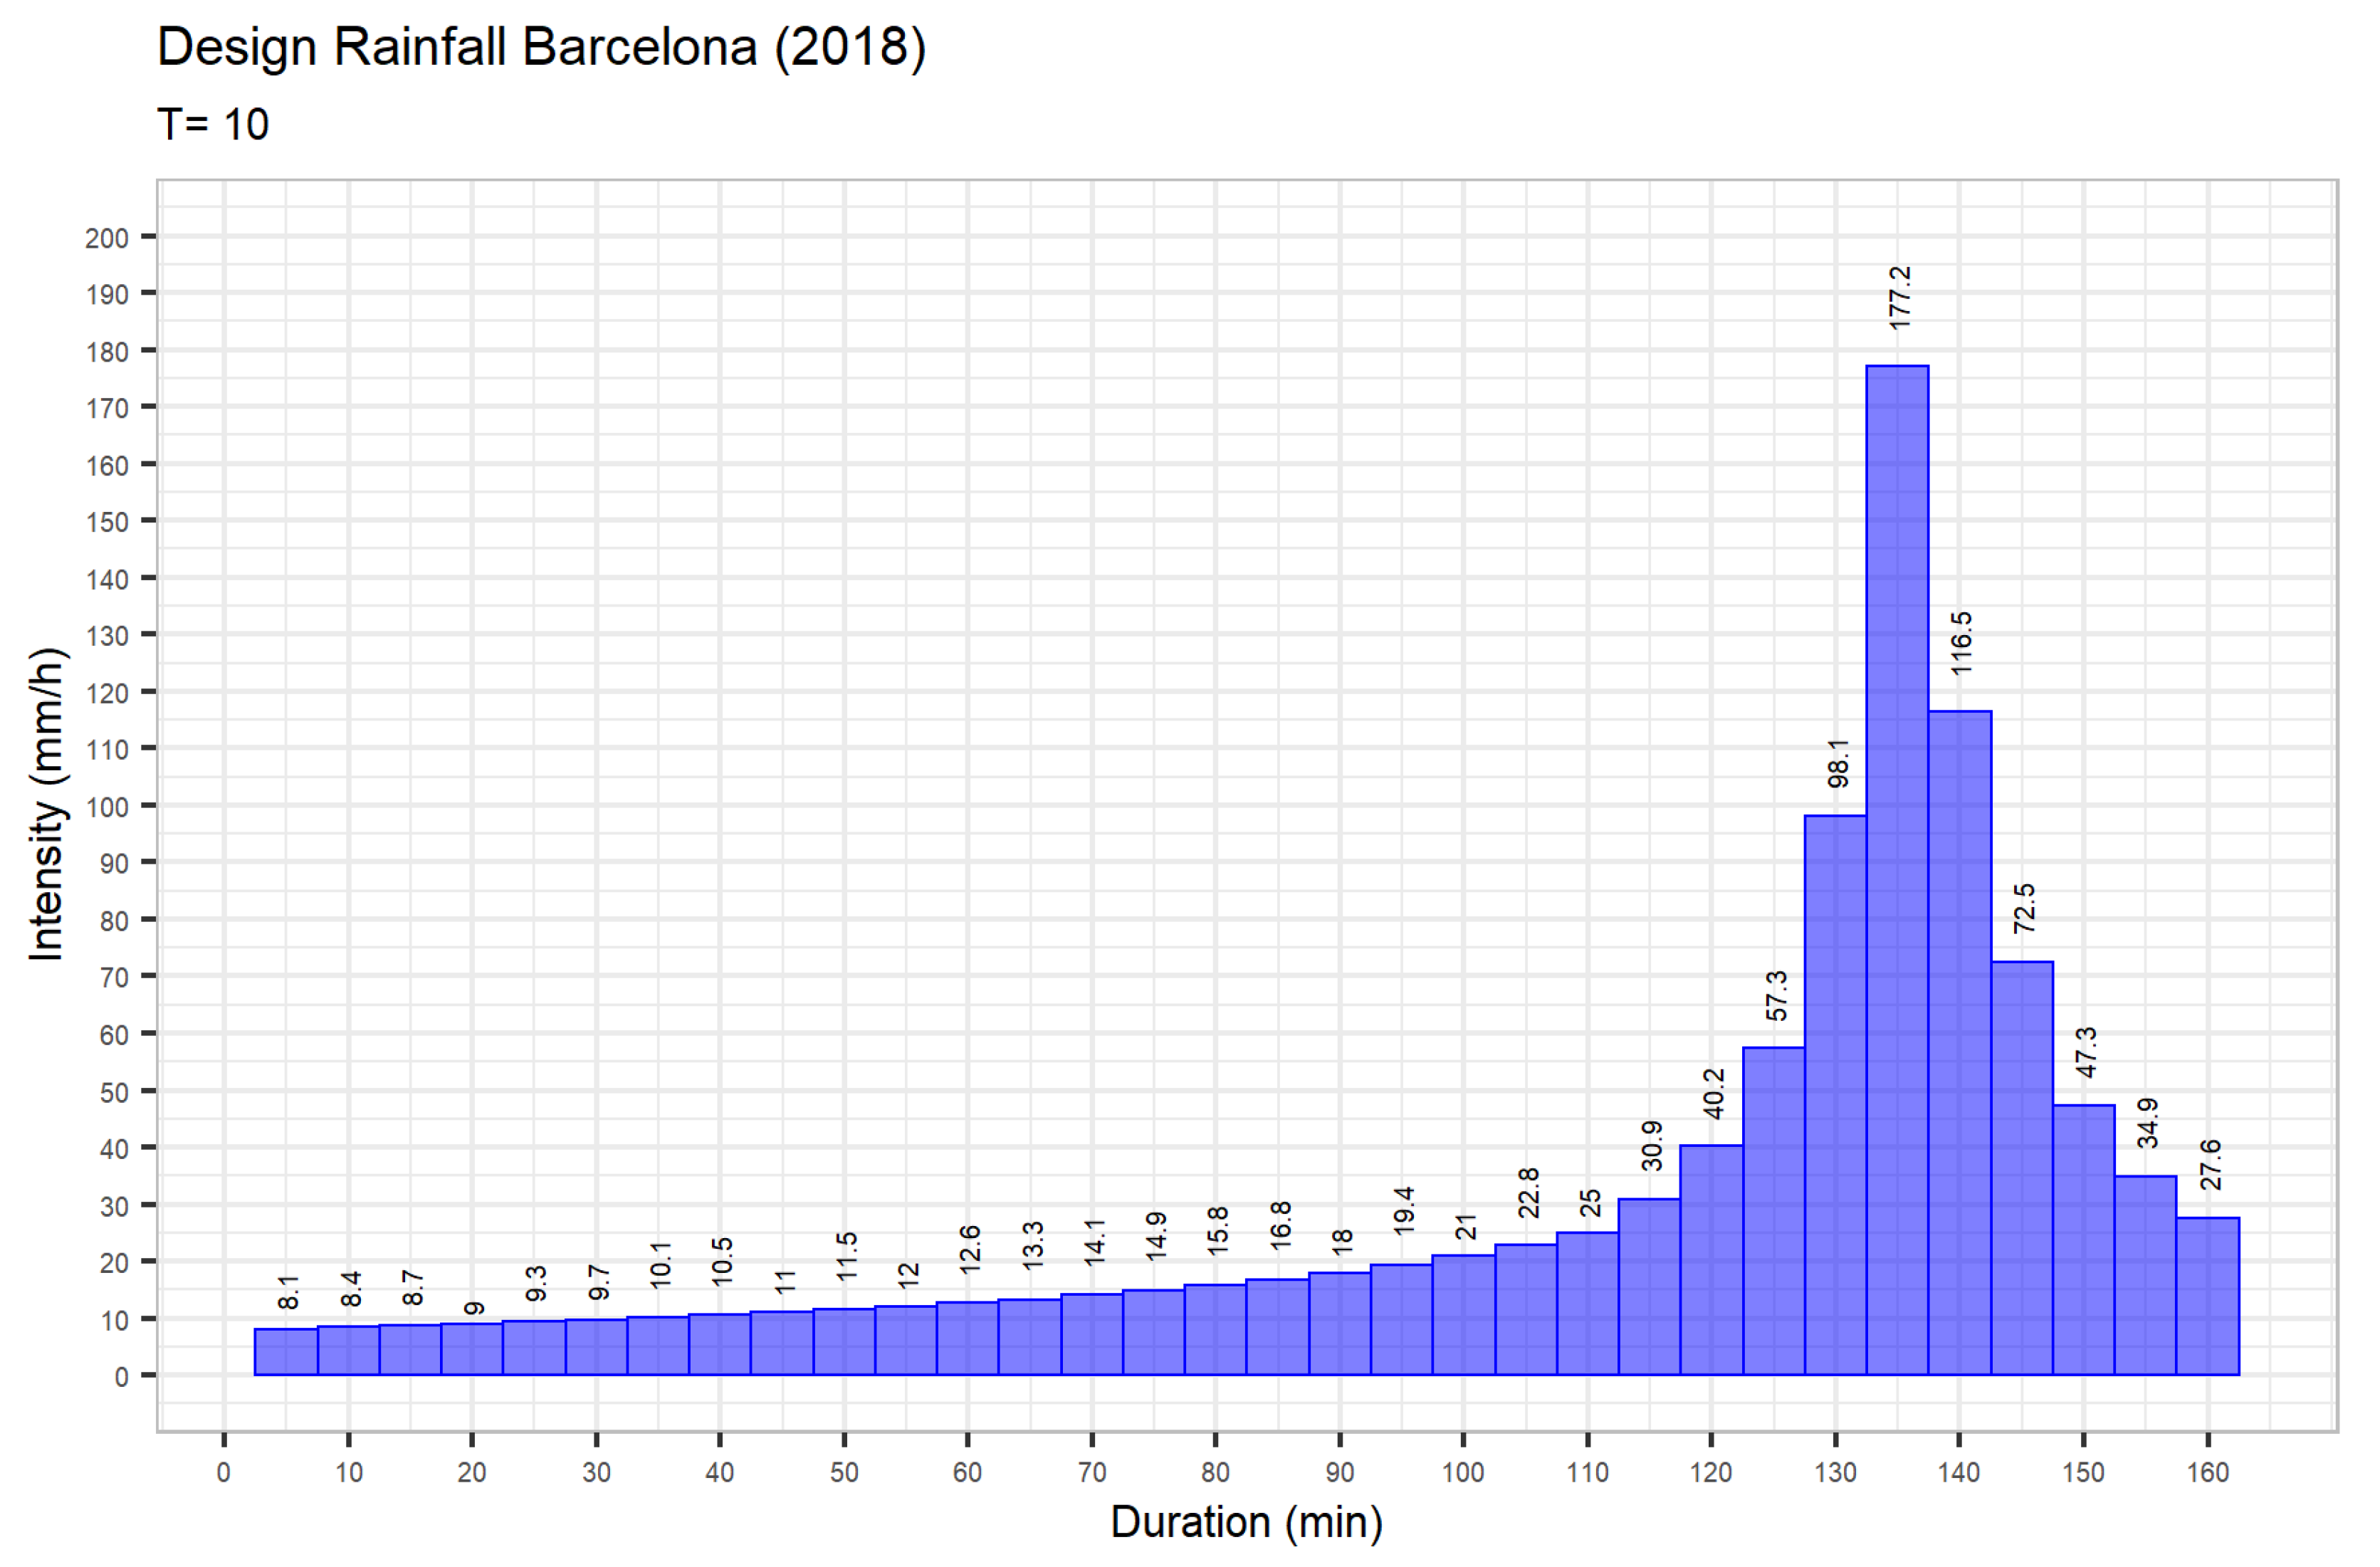
Figure 4 shows the final hyetograph for the selected 10-year return period under the actual conditions. The effect of CC was applied to these values, and the peak intensity was 177.2 mm/h.
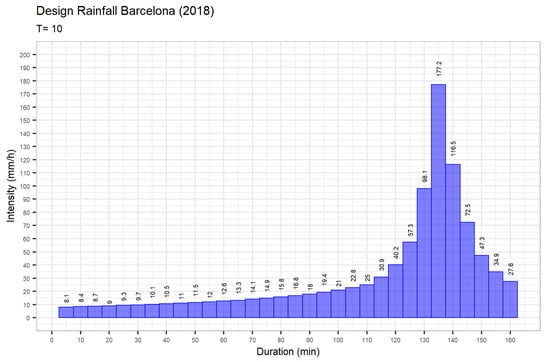
Figure 4.
Design storm for Barcelona corresponding to a 10-year return period.
3.2. Standard Year for CSO Evaluation
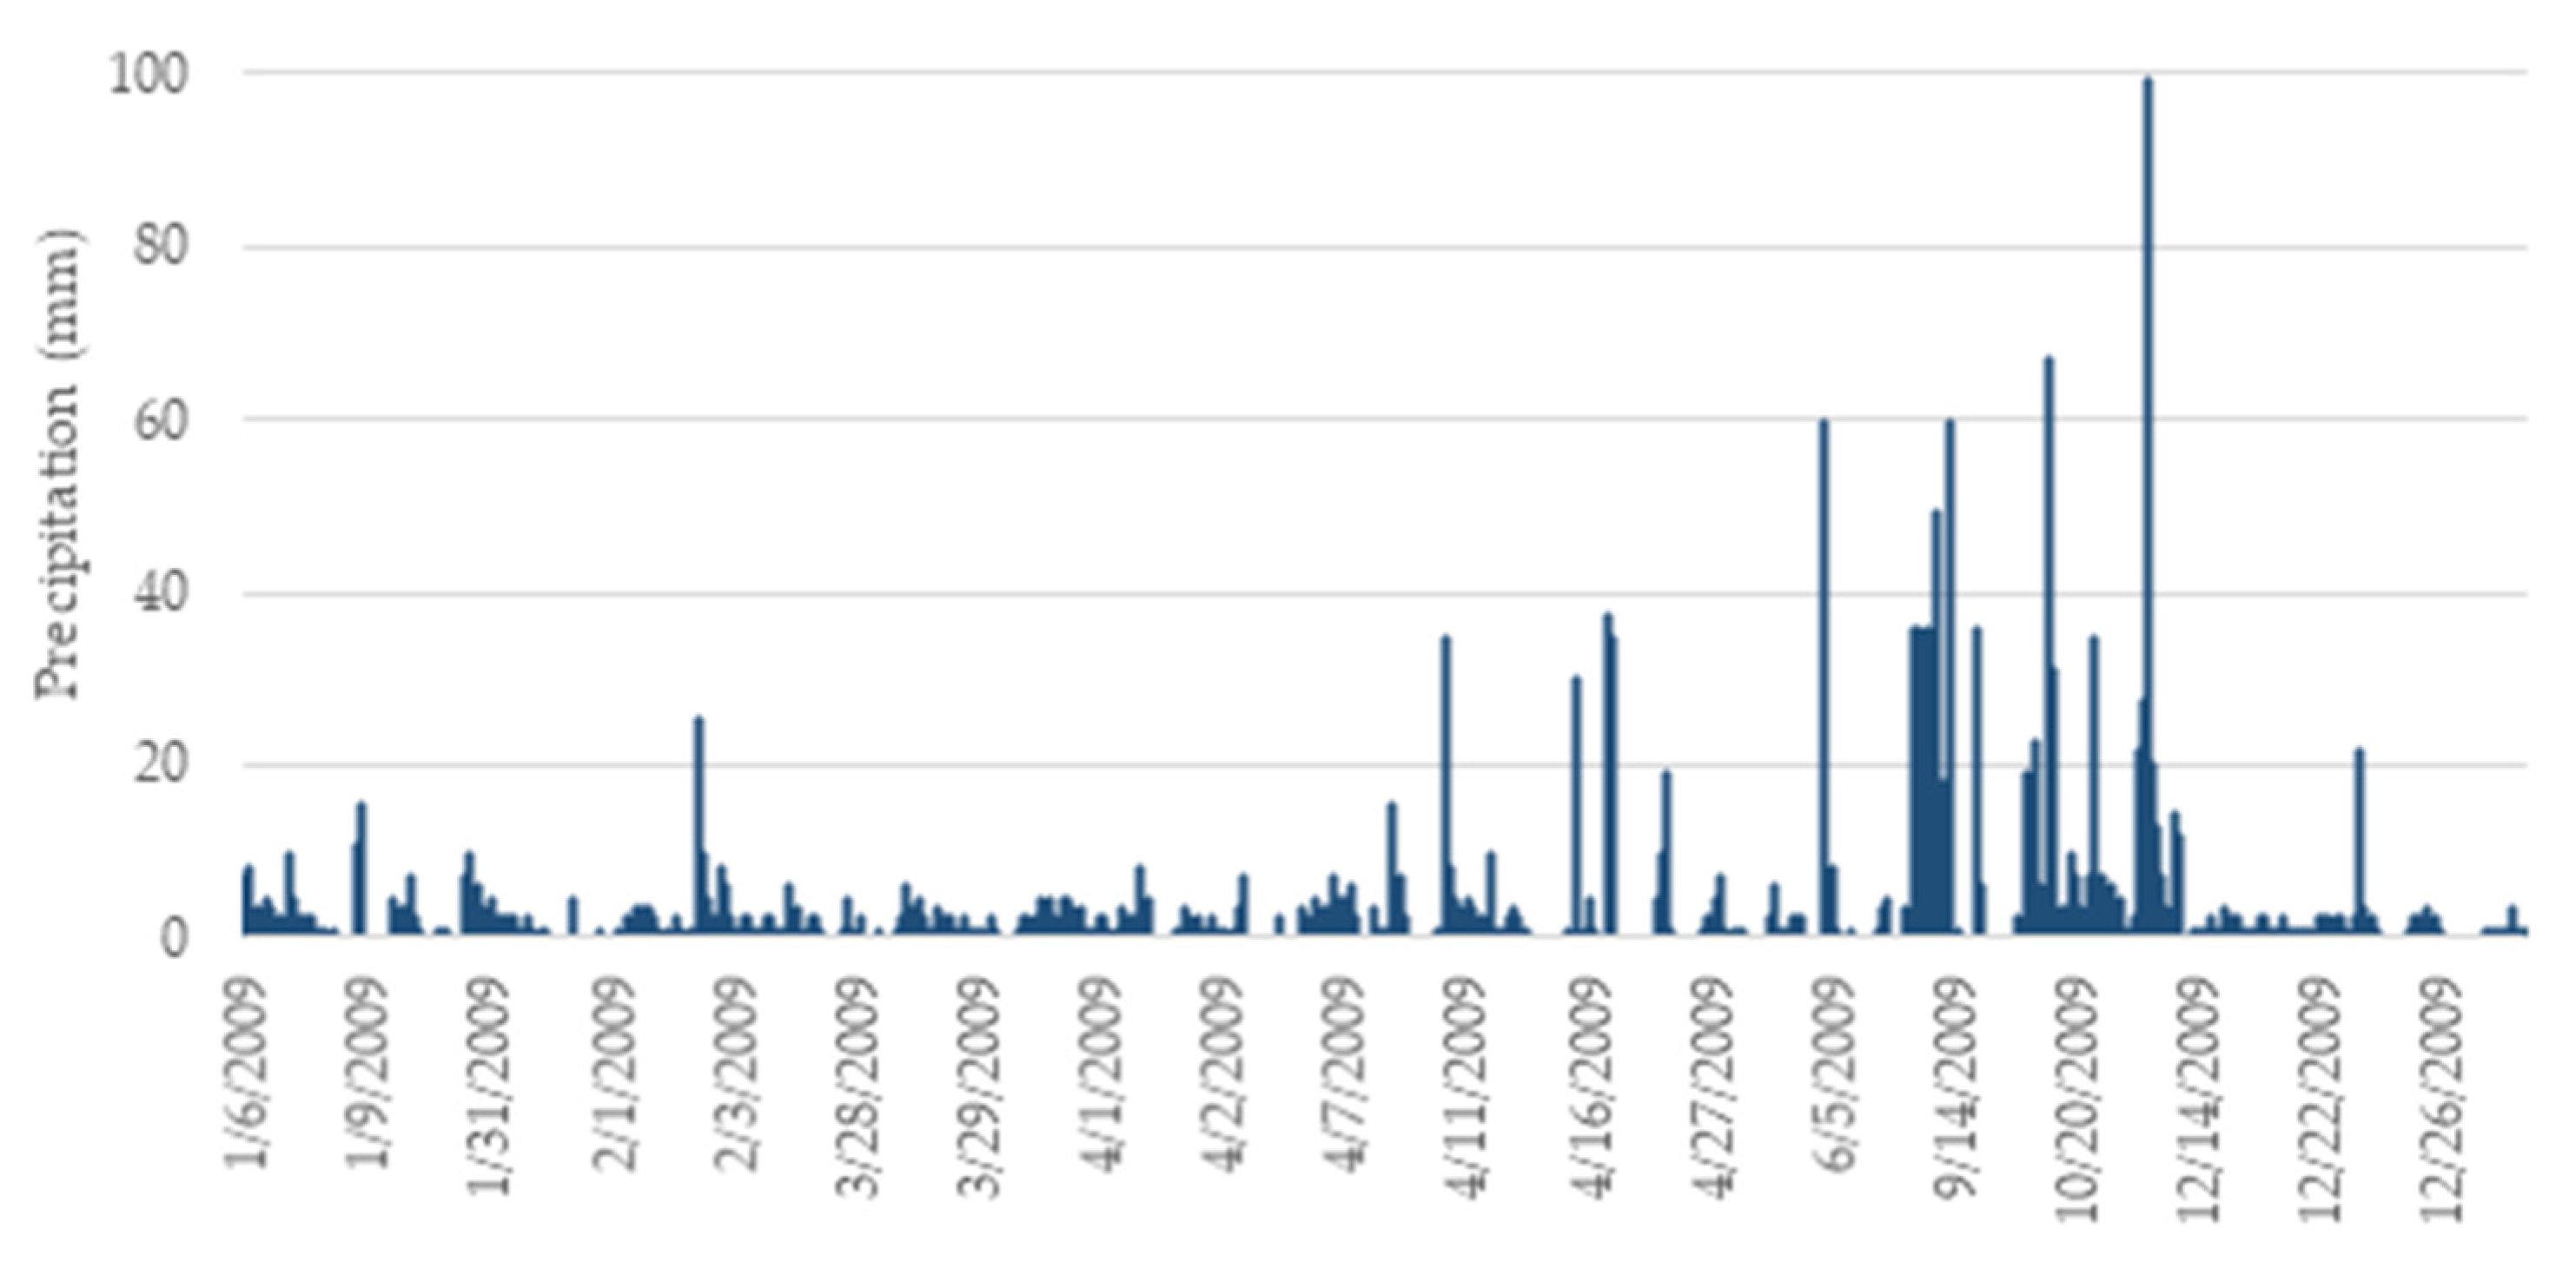
As mentioned in the introduction, a continuous modeling of a one-year duration of rainfall is required to evaluate the reduction of CSOs after the implementation of adaptation measures. The typical indicator to evaluate the performance of CSO measures is using the number of events per year [25]. All of the available time series were analyzed in terms of total precipitation, number of events, and distance between events. The year 2009 was selected as the most representative of the series. The total rainfall was 520 mm and the number of events was 60. Figure 5 shows the data. The plot only includes non-zero values; hence, the horizontal axis is not a continuous time line.
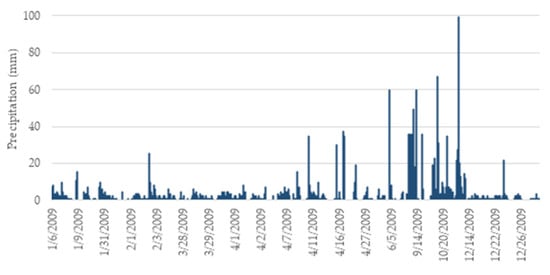
Figure 5.
Time series used to evaluate the impact of combined sewer overflows (CSO), with a total duration of one year.
3.3. Effects of Climate Change on Extreme and Moderate Rainfall Events in Barcelona
The effects of climate change on the urban hydrological cycle due to a potential increase in extreme rainfall episodes should be considered in order to prevent future problems in urban drainage systems. IDF curves are commonly used to design different types of hydraulic structures in the field of urban drainage. IDF curves could be altered due to a presumed increase in extreme intense rainfall caused by climate change. A general overview about this issue was presented by Willems et al. [7].
Contrary to what happens in the high-or mid-latitude regions of the world, in which an increase in total precipitation has been reported [26], several studies have shown a decreasing dominant trend during the last decades in the Mediterranean area. Indeed, the regional climate change assessment report prepared by researchers from the CLIVAR-Spain network [27] concluded that the annual rainfall in the Iberian Peninsula in the last three decades has decreased significantly compared to the 1960s and 1970s. Despite this decrease in total precipitation, an increase in extreme precipitation has been observed. Simulations for the 21st century typically use climate models to predict significant decreases in total precipitation in the Mediterranean area [28], although some projections of regional models have shown a possible increase in torrential rainfall [28,29], with shorter and more intense precipitation episodes.
According to the V report on climate change of the Intergovernmental Panel on Climate Change (IPCC), known as AR5 in English, in some areas of the world, the frequency, intensity, and/or amount of strong precipitation will increase, but, due to high uncertainty, local detailed studies are required [28,30].
The assessment of the potential influence of climate change on the intensity of extreme rainfall is very interesting in the Mediterranean area, especially in densely populated urban areas with complex sewer systems, vulnerable infrastructures, and urban services in the case of extreme rainfall episodes.
In Barcelona, the first evaluation of the possible influence of climate change on extreme precipitation was carried out by Rodríguez et al. [21]. The authors analyzed future series of daily precipitation for the period of 2000–2099, obtained through five general circulation models under four future special reports on emissions scenarios (SRES) climate scenarios of greenhouse gas emissions (A1B, A2, B1, and B2) and applying the statistical downscaling method for six rainfall stations located in the metropolitan area of Barcelona.
From these series, the future changes to be expected in the IDF curves of Barcelona, for each climatic scenario considered, were calculated. To achieve this, two different time reduction (or downscaling) methods were used. In the first, it was assumed that the relative variations of precipitation between the present and the future are the same for any duration less than 24 h. Meanwhile, for the second, which was based on the scale properties of precipitation, the estimates of these variations depend on the duration.
In particular, in this study, the climate change factors cf were defined by hourly intensity for different temporal horizons, such as the ratio between the rainfall intensity with a return period T and for a certain duration t and the corresponding rainfall intensity for the future with the same T and t [31,32]:
These types of values can be applied directly to the intensities of the design project storm, obtaining a new rainfall hyetograph for future scenarios.
The temporal downscaling technique, based on the fractal properties of rain, was applied up to a duration of 1 h, although climatic change factors were applied to the 5 min intensities as a better approximation available on the date of the study. For the period of 2066–2099, under scenarios A1B, A2, B1, and B2, the climate change factors varied from 1.02 to 1.20 for return periods between 1 and 500 years, those for scenario B2 generally being the greatest [21].
Representative concentration pathway (RCP) scenarios are the new set of scenarios developed by the IPCC for the Fifth Assessment Report (AR5) [26,33]. The pathways describe four possible climate futures based on radiative forcing SRES.
Recently, in the context of the H2020 RESCCUE project (Resilience to Cope with Climate Change in Urban Areas–A Multi-Sectorial Approach Focusing on Water) (www.resccue.es), new climatic projections concerning several climate variables (temperature, precipitation, sea level rise, heat wave, drought, etc.) were developed for several European cities (Barcelona, Bristol, and Lisbon) [34].
For the case of Barcelona and the precipitation variable, the historical series of 20 tipping bucket pluviometers of the BCASA rain gauge network with a resolution of 5 min were used, such as the data from the ERA-Interim reanalysis and the of 10 climatic CMIP5 models proposed by the V report of the ICPP [34]. The projections concerning 20 rainfall time series corresponding to the rainfall gauge stations in Barcelona were achieved through a statistical two-step analogue/regression downscaling method successfully implemented in other recent studies in Spain [35,36]. The general atmospheric circulation models were forced by RCPs 4.5 and 8.5, and previously, they were validated for the historical control period of 1976–2005.
The analysis of extreme rainfall episodes on the pluviometric rainfall series (for the period of 2071–2100) of the most representative pluviometer of the BCASA rain gauge network (the Faculty of Physics Station) allowed to achieve new maximum rainfall intensities and new values of climate change coefficients in the range between 1.07 and 1.26, depending on the frequency and duration of each maximum rainfall intensity (Table 1) [37,38]. These values represent the 50th percentile of the results obtained by an ensemble strategy considering all of the outputs provided by the 10 general atmospheric circulation models forced by RCPs 4.5 and 8.5 in order to take into account the uncertainty related to model/run selection and the RCP scenario considered. The new range of climate change coefficients achieved in this study is quite similar to the range achieved by Rodriguez et al. [21], confirming the same trend of the projections about extreme rainfall events in Barcelona, notwithstanding the use of different general atmospheric circulation models and different climate change scenarios (SRES and RCPs) related to the IV and V reports of ICCP.

Table 1.
Climate change factors for the time period 2071–2100, including different return period sand durations up to 60 min for the city of Barcelona (Facultat d’Estació de Física).
The climatic change coefficients obtained for the future time period of 2071–2100 and the return periods of T1, T10, T50, T100, and T500 were applied directly to the project storms proposed in the PDISBA, in order to take into account the effects of climate change on the IDF curves, and consequently, on the drainage capacity of the city and the socioeconomic impacts potentially generated from other services.
The RESCCUE project also provided historical and future rainfall time series to be used as input in the urban drainage and sea water quality models. Ten different climate models were used to provide 5 min downscaled rainfall time series in Barcelona, based on historical (1976–2005) and future (2071–2100) period simulations forced by both RCPs 8.5 and 4.5. The achieved results show that the simulated annual rainfall volume of the historical 1997–2005 period and the number of annual rainfall events were similar to the observed mean values, while the future simulated annual rainfall volumes and annual number of events slightly decreased compared to the historical simulation period.
With these analyses, it can be concluded that the future rainfall scenarios relevant for the analysis of the impacts of CSOs on the sea water quality of Barcelona are unlikely to get worse. Therefore, future continuous rainfall time series with environmental design purposes were considered to be the same as the historical rainfalls [38]. The available climate change factors were for durations of 5–60 min. In order to be able to apply this transformation to durations above 60 min, the trend was propagated for each of the return periods.
While the available climate change factors did not correspond exactly to the period calculated by the IDF (1994–2018), they were used as a reference to obtain the forecast of the IDF curves, including the influence of climate change. The future rainfall for the return periods of T1, T5, T10, T25, T100, and T500 was also calculated.
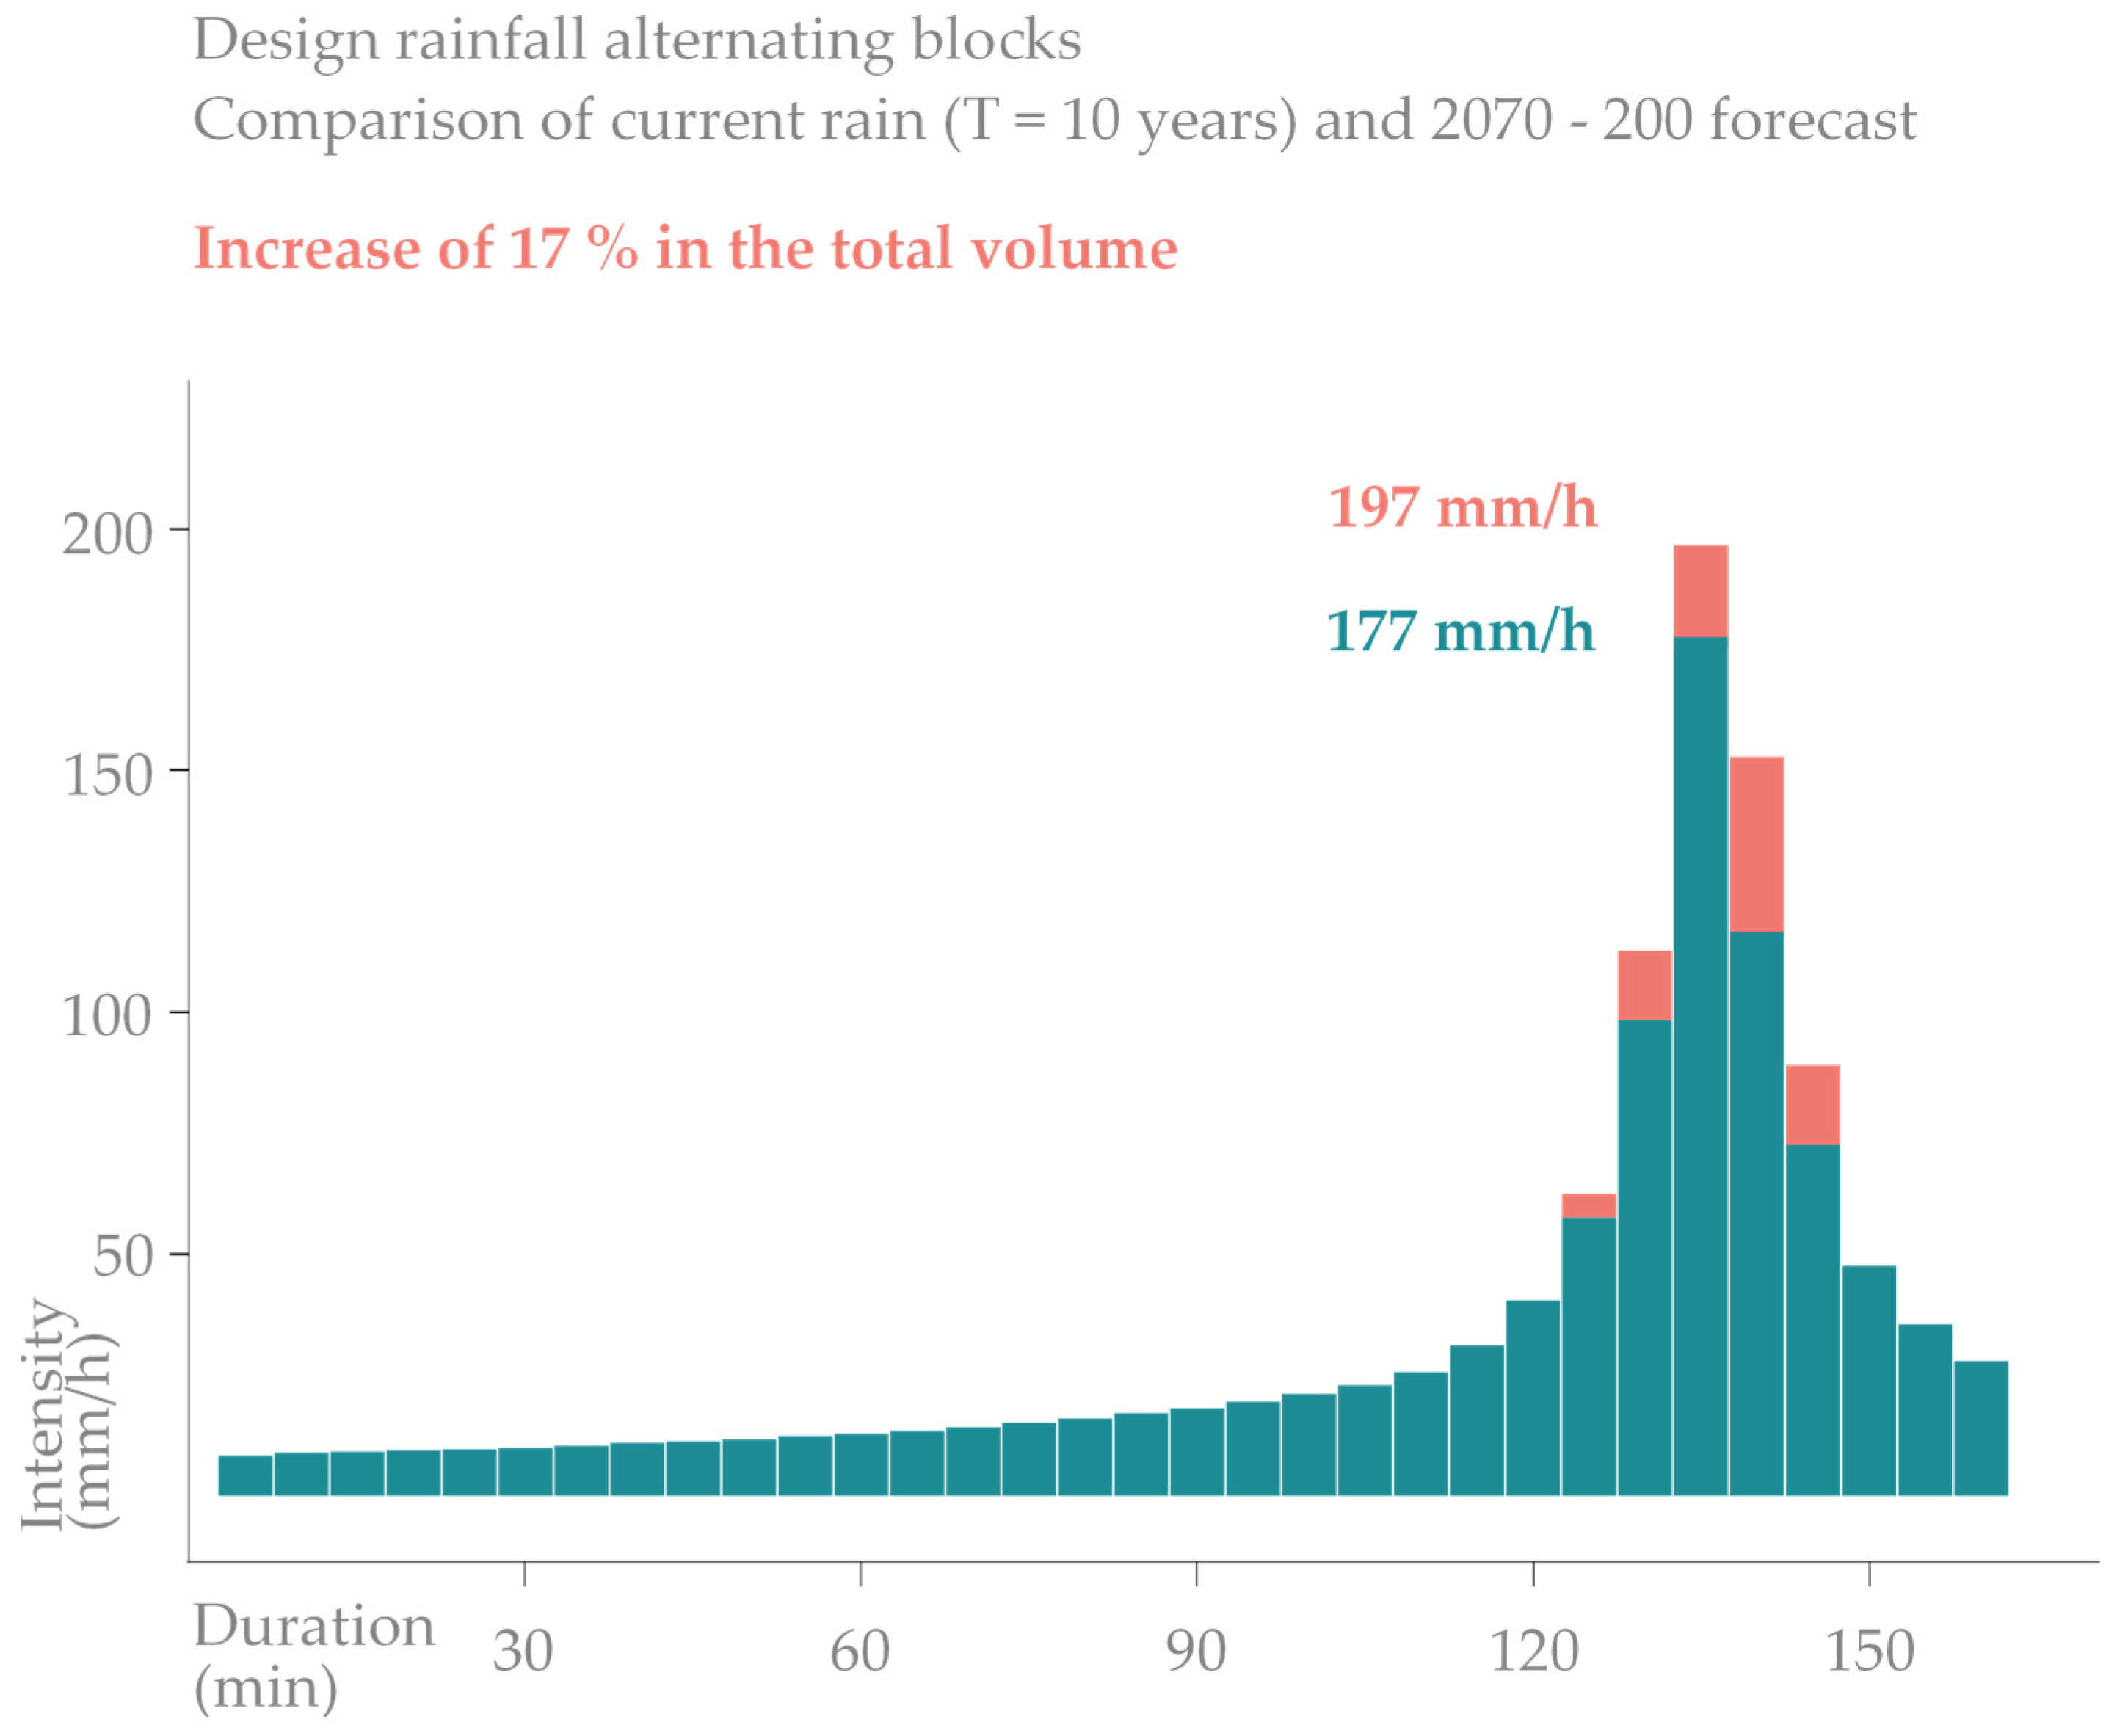
Figure 6 shows a comparison between the design rainfall for a 10-year return period calculated with rainfall data up to 2018 and the forecast for the period 2071–2100 according to the climate change coefficients. The blue is the current rain, while red indicates the future increase in rainfall.
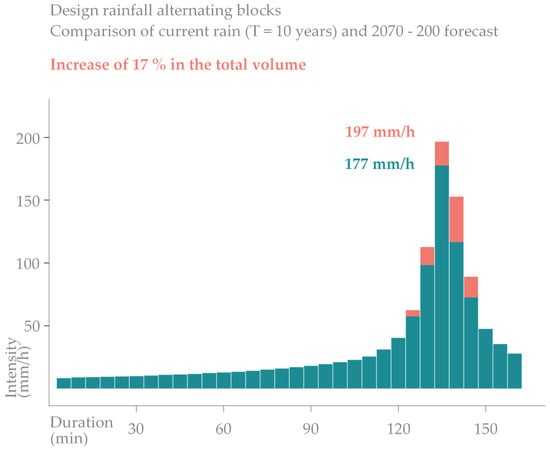
Figure 6.
Comparison of current and future design rainfall considering climate change for T = 10 years.
4. Hydraulic Model Construction
A model is a mathematical representation of phenomena or processes that occur in reality in order to analyze them, to describe and explain their current behavior, and thus to predict their future behavior under other conditions. In the case of sewer systems, the structure of the model is built around three basic systems: the pipeline network, the treatment plants, and the receiving environment. These three systems are completely interrelated, so they need to be studied and managed together.
The model elaborated on in the Master Plan considers 100% of the Barcelona network, the primary network of the other municipalities that discharge into the Barcelona sewers, and the intermunicipal interceptors that transport wastewater and part of the stormwater to the treatment plants. A 1D/2D coupled model was created considering a one-dimensional sewer network modeling and two-dimensional overland flow [39,40].
To create this hydraulic model in Barcelona, the data from the sewer network inventoried on a GE SmallWorld GIS platform were imported into Innovyze’s ICM software, which has been used previously in Barcelona [19,41]. With this aim, a computer architecture was created to automate the transfer of GIS data to hydraulic software, so that periodic updates could be performed relatively easily. In Table 2, a brief summary of the network is provided. More than 85,000 nodes are the basis of the network, including almost 90,000 pipes.

Table 2.
Summary of the elements that make up the one-dimensional model of the sewer network in Barcelona.
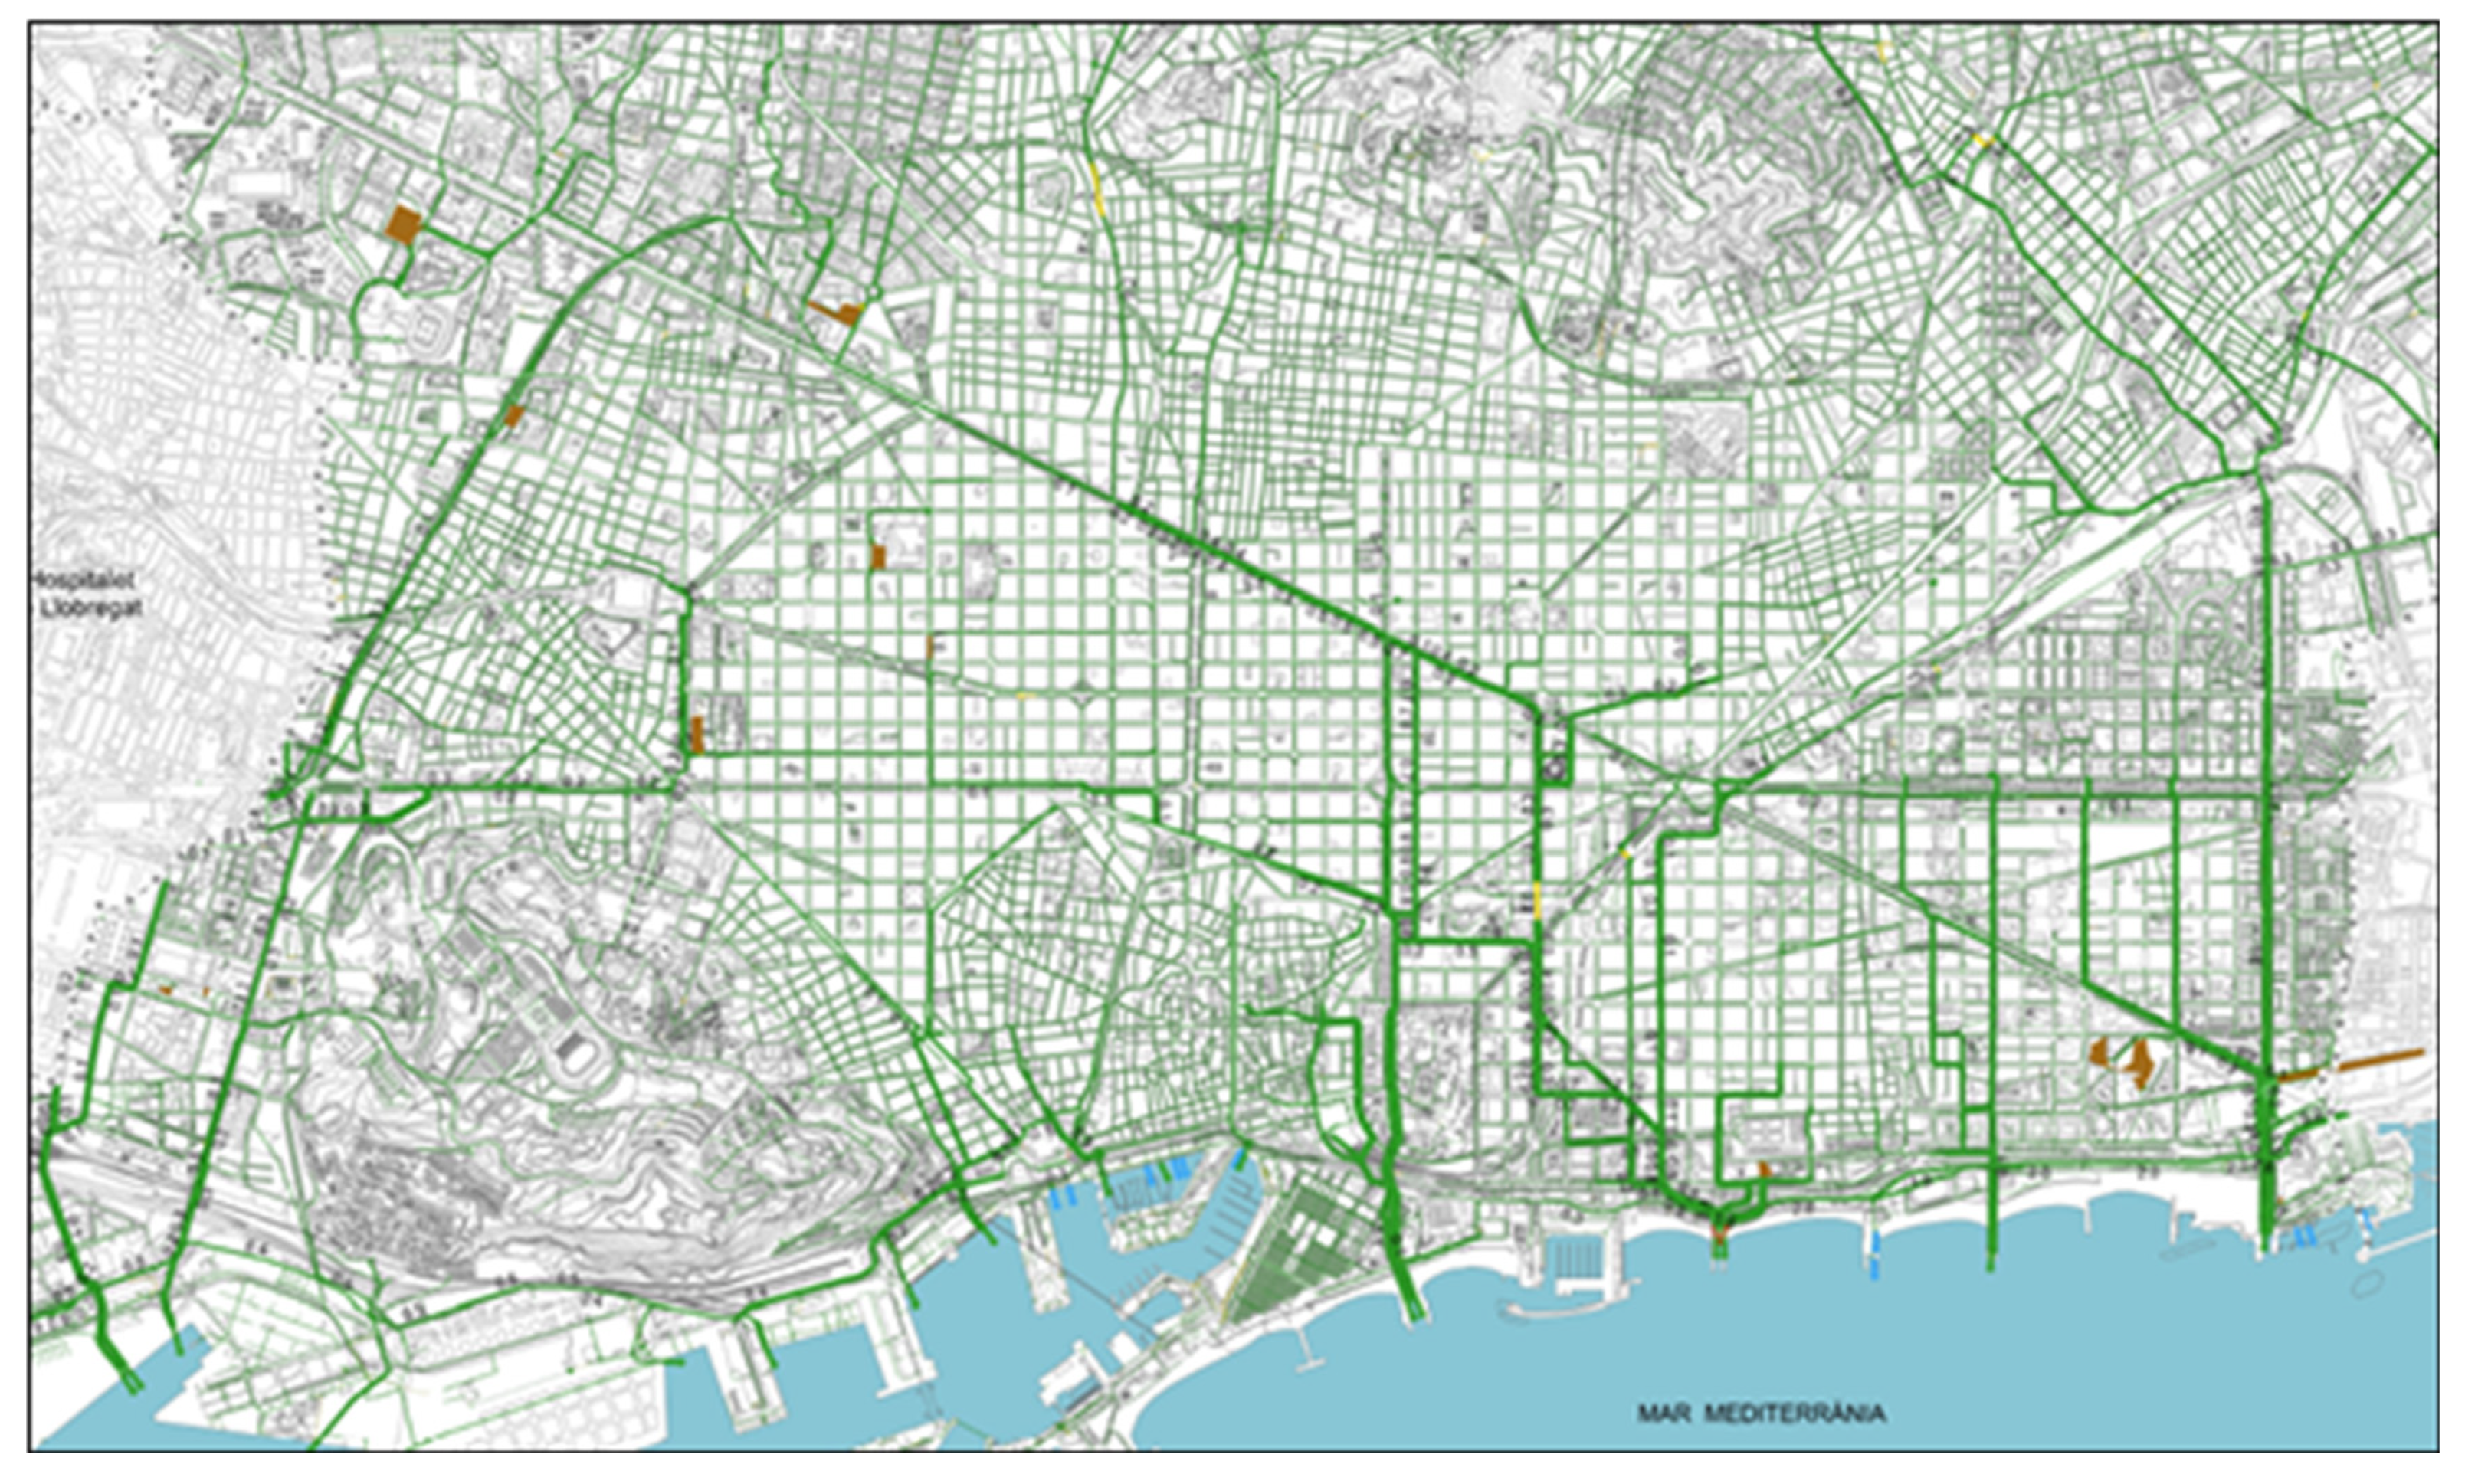
Figure 7 shows the model network represented using a scaled line width, adapted to a real pipe section. The sea outfalls responsible for the CSOs appear at the shoreline.
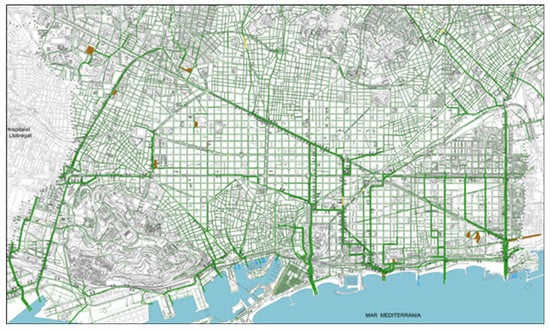
Figure 7.
Barcelona sewer network introduced to the mathematical model. The green lines indicate the existing pipes. The primary and secondary networks are included.
Hydrological basins have been obtained from topographic plans of the study area and allow for obtaining the contour conditions, defining which areas contribute to the flow generation to be discharged into the sewer network.
Regarding the configuration of the river basins, different hydrologic sub-basins were created, taking into account the orography of the land, the torrents that cross the urban area, and the structure of the sewer network. These urban sub-basins were estimated by the Thyssen polygon method in which each node of the model was associated with a sub-basin with the area closest to the node. In contrast, for rural and peri-urban areas, catchment delimitation was conducted through conventional SIG processes based on the surface flow and the position of the inlet structure discharging into the sewer network.
The hydrological loss model is the model responsible for transforming raw rain (i.e., recorded by the rain gauges) into effective rain, which corresponds to the rain that is transformed in runoff and flows down the surfaces of the basin once the different losses occur in reality. In the PDISBA, different formulations were used depending on the type of land use and parameters that were established after the model calibration process.
For urban green areas and rural basins, an initial loss of 0.28 mm was used to estimate the effect of wetting and storage losses of rain volumes on land micro-depressions, while the Horton method, which considers four parameters, was used to define the simulation of the process of hydrological loss due to the effect of the infiltration phenomenon:
| 76 mm/h |
| 13 mm/h |
| 4.14 (1/h) |
| 0.036 (1/h) |
In order to achieve an adequate estimation e of flood impacts, a 1D/2D urban drainage model was developed and calibrated. The 2D model was created using a digital terrain model (DTM) provided by the Cartographic Institute of Catalonia, with a resolution of 2 × 2 m and an altimetry precision of 15 cm. A non-structured mesh of the city surface for the 2D overland flow propagation in the case of flooded nodes was obtained by eliminating the buildings. The main characteristics of the modeling mesh were:
| 1,361,324 |
| 100 m2 |
| 25 m2 |
| 0.0125 s/m1/3 |
| |
| |
| |
The simulation scenarios considered in this Master Plan were:
- Dry weather scenario considering only wastewater.
- Extreme hydrological scenarios (two scenarios proposed): The first case considering design rainfall without climate change effects, and the second with an update of the rainfall intensity design through climate change coefficients.
- Ordinary hydrological scenario generating CSO into the receiving water bodies. In this case, a continuous rainfall series with a time resolution of 5 min was considered for one year in Barcelona (continuous rainfall time series of 2009).
5. Results
In this section, the results of the risk analysis are presented, including the assessment of the actual condition (current scenario), the objectives of the plan, and the proposed measures. The results of the flood risk assessment are presented for the extreme events of a 10-year return period, while the environmental risk assessment was related to the ordinary hydrological scenario (continuous rainfall series of one year). Return periods corresponding to 1, 5, 10, 50, 100, and 500 years were also computed in the plan, because they are required to estimate the EAD.
5.1. Risk Management Objectives
The adaptation measures proposed in the risk management plan were focused on achieving objectives in three main areas:
Adapting to climate change:
- Protect people, mobility, private and public property, and the commercial and industrial areas against extreme rainfall events with a return period of up to 10 years, avoiding 100% of the flood risk.
- Reduce the risk of flooding from extraordinary events (return period of up to 500 years) by 50%.
Environmental protection:
- Comply with the Bathing Water Directive 2006/7/EC and its Spanish transposition RD 1341/2007 by increasing the authorized bathing time to 98.2% (that is, the time in which the required bathing conditions are not fulfilled must not exceed 1.8%). This will reduce the volume of waste-water overflowing into the sea due to the drainage system saturation of 59%.
- Comply with the Water Directive 2000/60/EC and its Spanish transposition RD 1290/2012 by reducing the polluted load in the outlets of the rivers and sea by 60%.
Sustainable maintenance:
- Anticipate the end of the life cycle of the system components.
- Move toward a rate of sustainable network renovation.
- Guarantee the level of service, reducing the groundwater pollution load by 60%.
5.2. Climate Change Impact on the Flood Hazard of a 10-Year Return Period
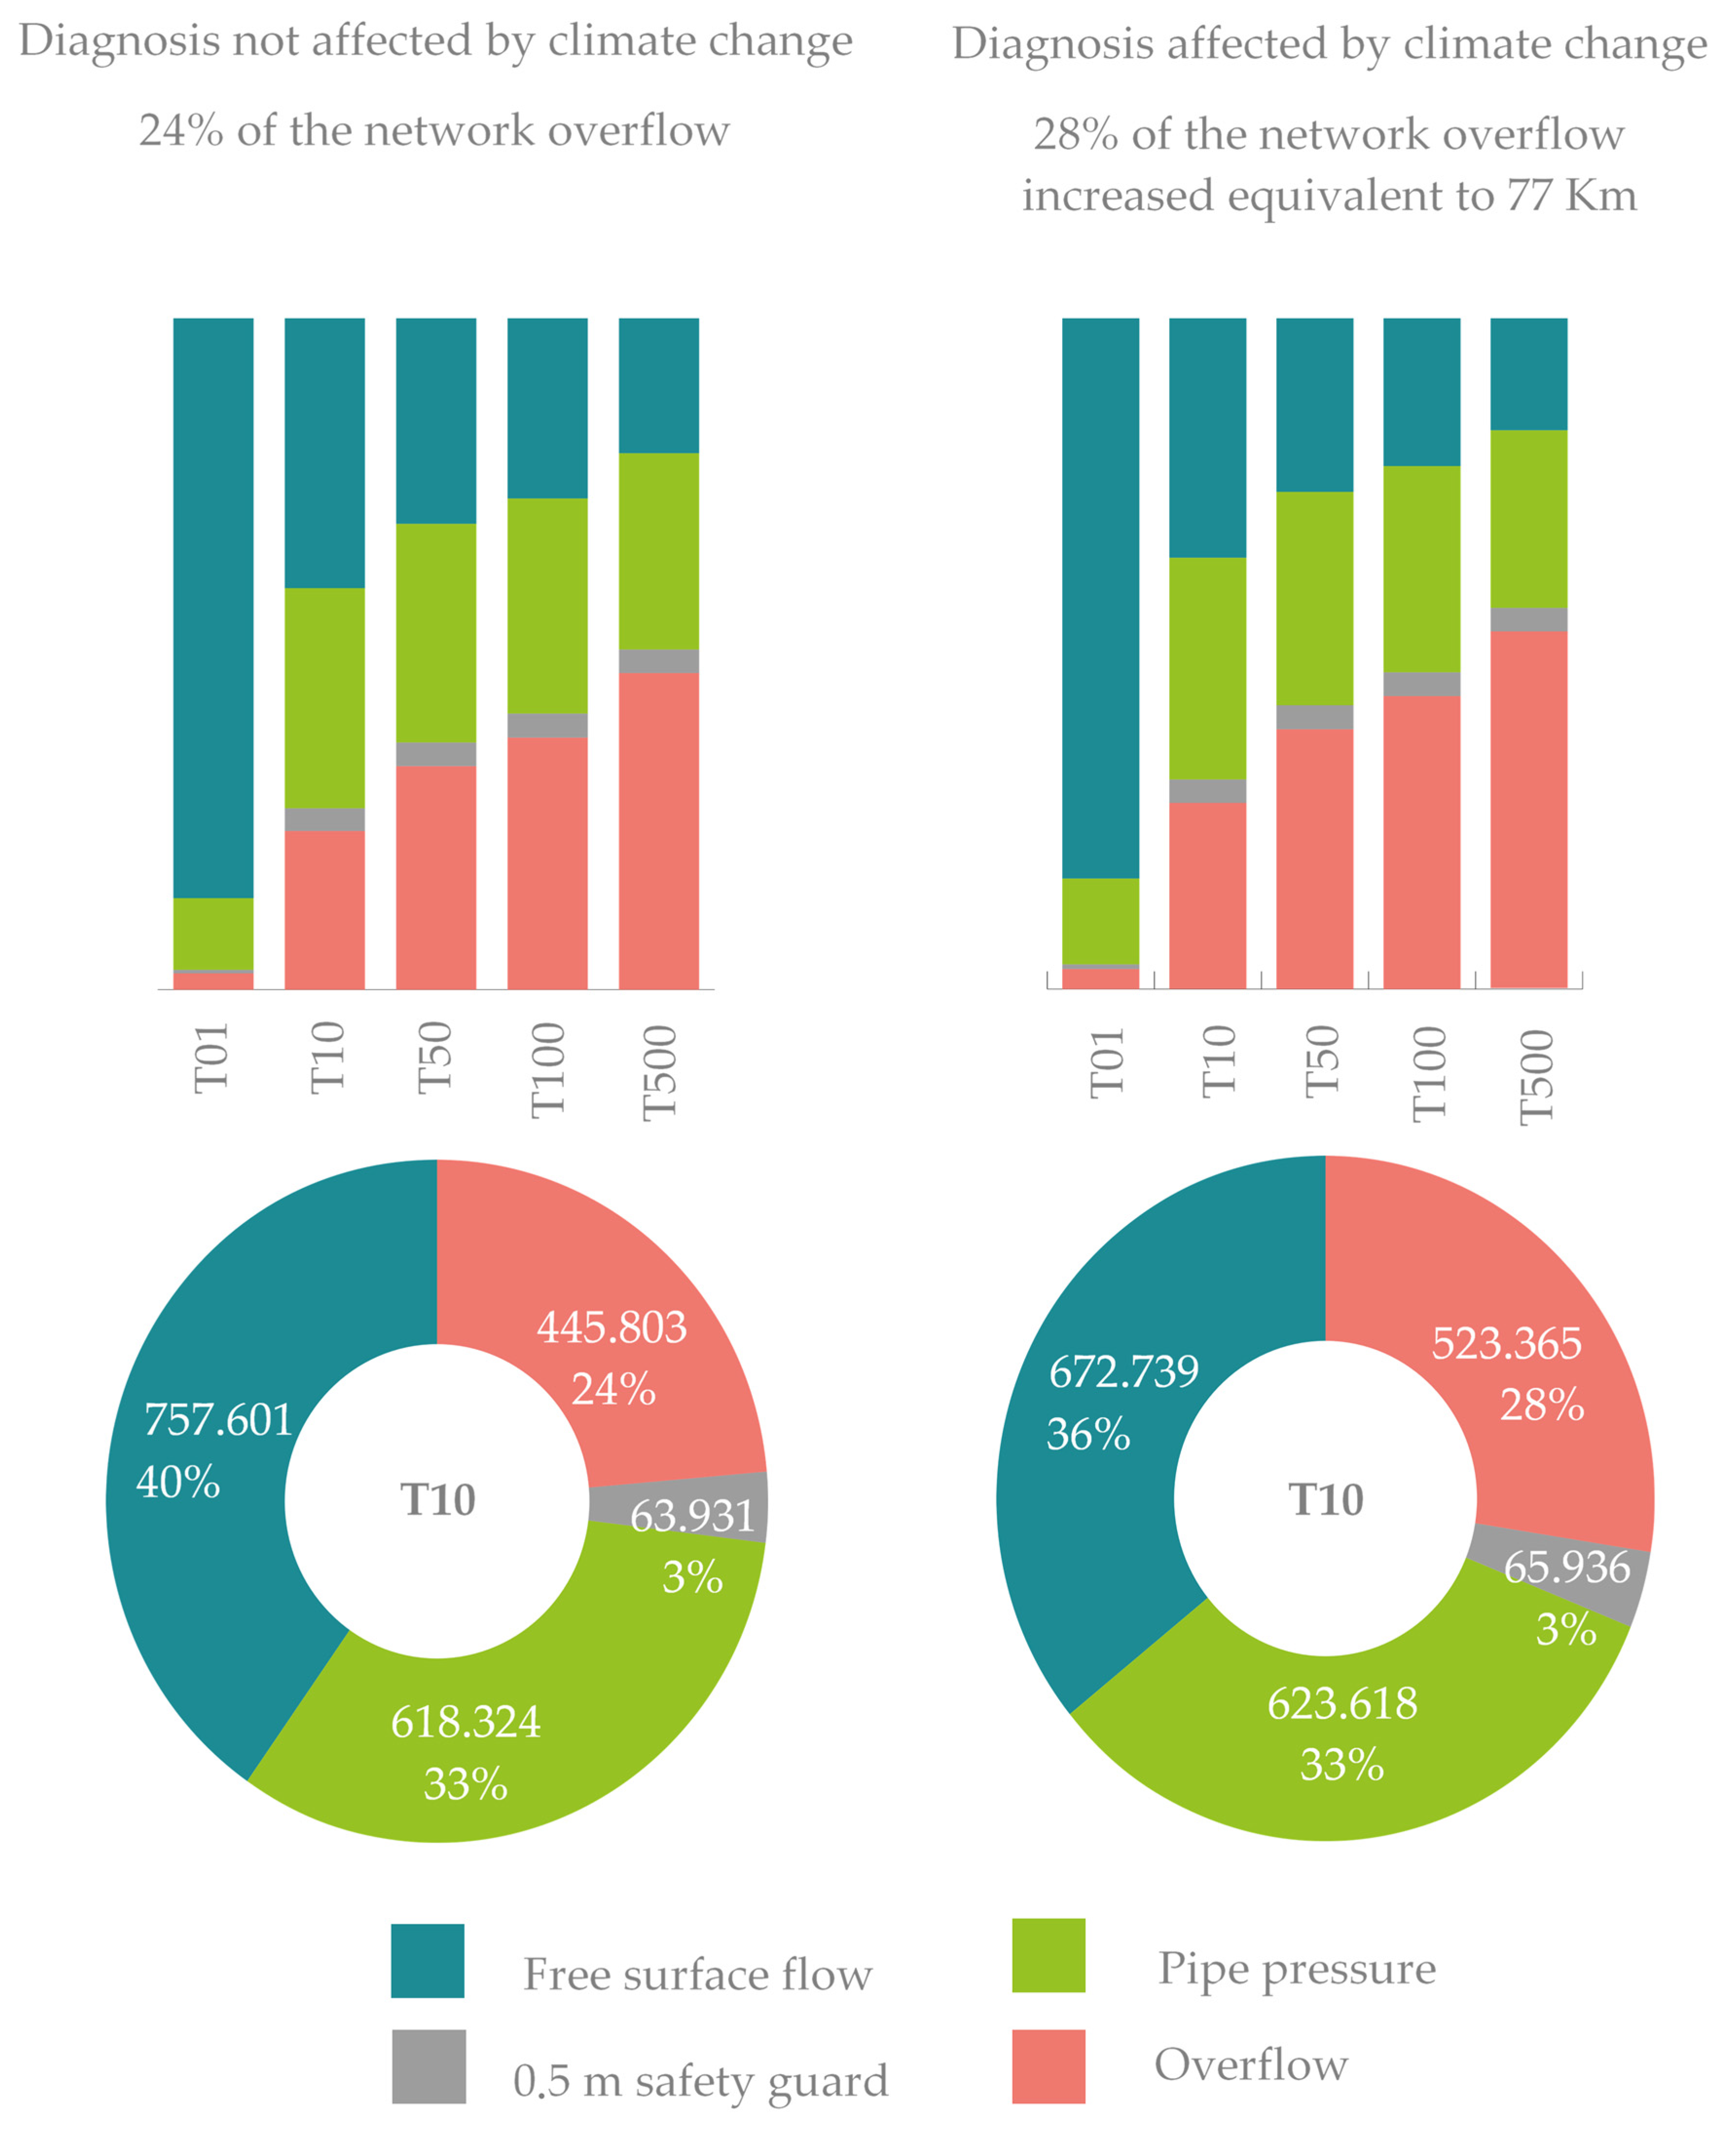
The rainfall forecast models for the considered climate change scenarios and the horizon of 2100 predict an increase in the frequency of heavy storm events. More specifically, this variation in the rainfall pattern means an increase of 17% in the maximum rainfall intensity in Barcelona for an event with a return period of 10 years. Rainfall with a 10-year return period is defined as the rain that, on average, appears every 10 years in a sufficiently long-time register. The diagnosis (defined as the analysis of the current drainage system) of this plan, which does not consider the climate change scenarios, indicates that a drainage system with an insufficient capacity would expose 24% of the city to a high hazard in terms of pedestrian and road traffic safety. However, if climate change scenarios are considered, the diagnosis predicts a further 4% increase, with 28% of the city exposed to a high hazard in terms of pedestrian and road traffic safety (Figure 8).
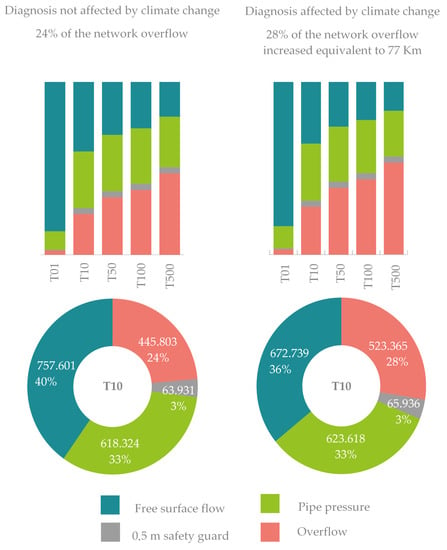
Figure 8.
Impact of the T10 scenario of climate change on the flood hazard statistics.
The result of 28% corresponds to the accumulated effect of increasing the precipitation using the new IDF curves, the new design storm duration, and the climate change coefficient. This contribution was the last included in the model, and that is why it only increased the area by 4%. In the case of continuing to use the rainfall of previous plans and first applying the climate change coefficient, the impact of this coefficient would be crucial.
The part of the drainage system that operates under pressurized conditions causes surface flooding in various parts of the city, with several direct impacts on people’s safety and other indirect impacts on the social and productive activities in the city. Within the PDISBA, a series of forecasting tools were developed to quantify the impacts due to pluvial floods produced by heavy rainfall events by using risk maps: pedestrian safety risk maps, road traffic risk maps, and maps showing the extent of damage to property and commercial activities for each of the possible rainfall synthetic project storms for current and future scenarios, including the effects of climate change. These scenarios range from rainfall events with a return period of one year to very extreme rain events with a return period of over 500 years. This enables an objective assessment forecast to be made of the damage resulting from flooding caused by extreme rain events.
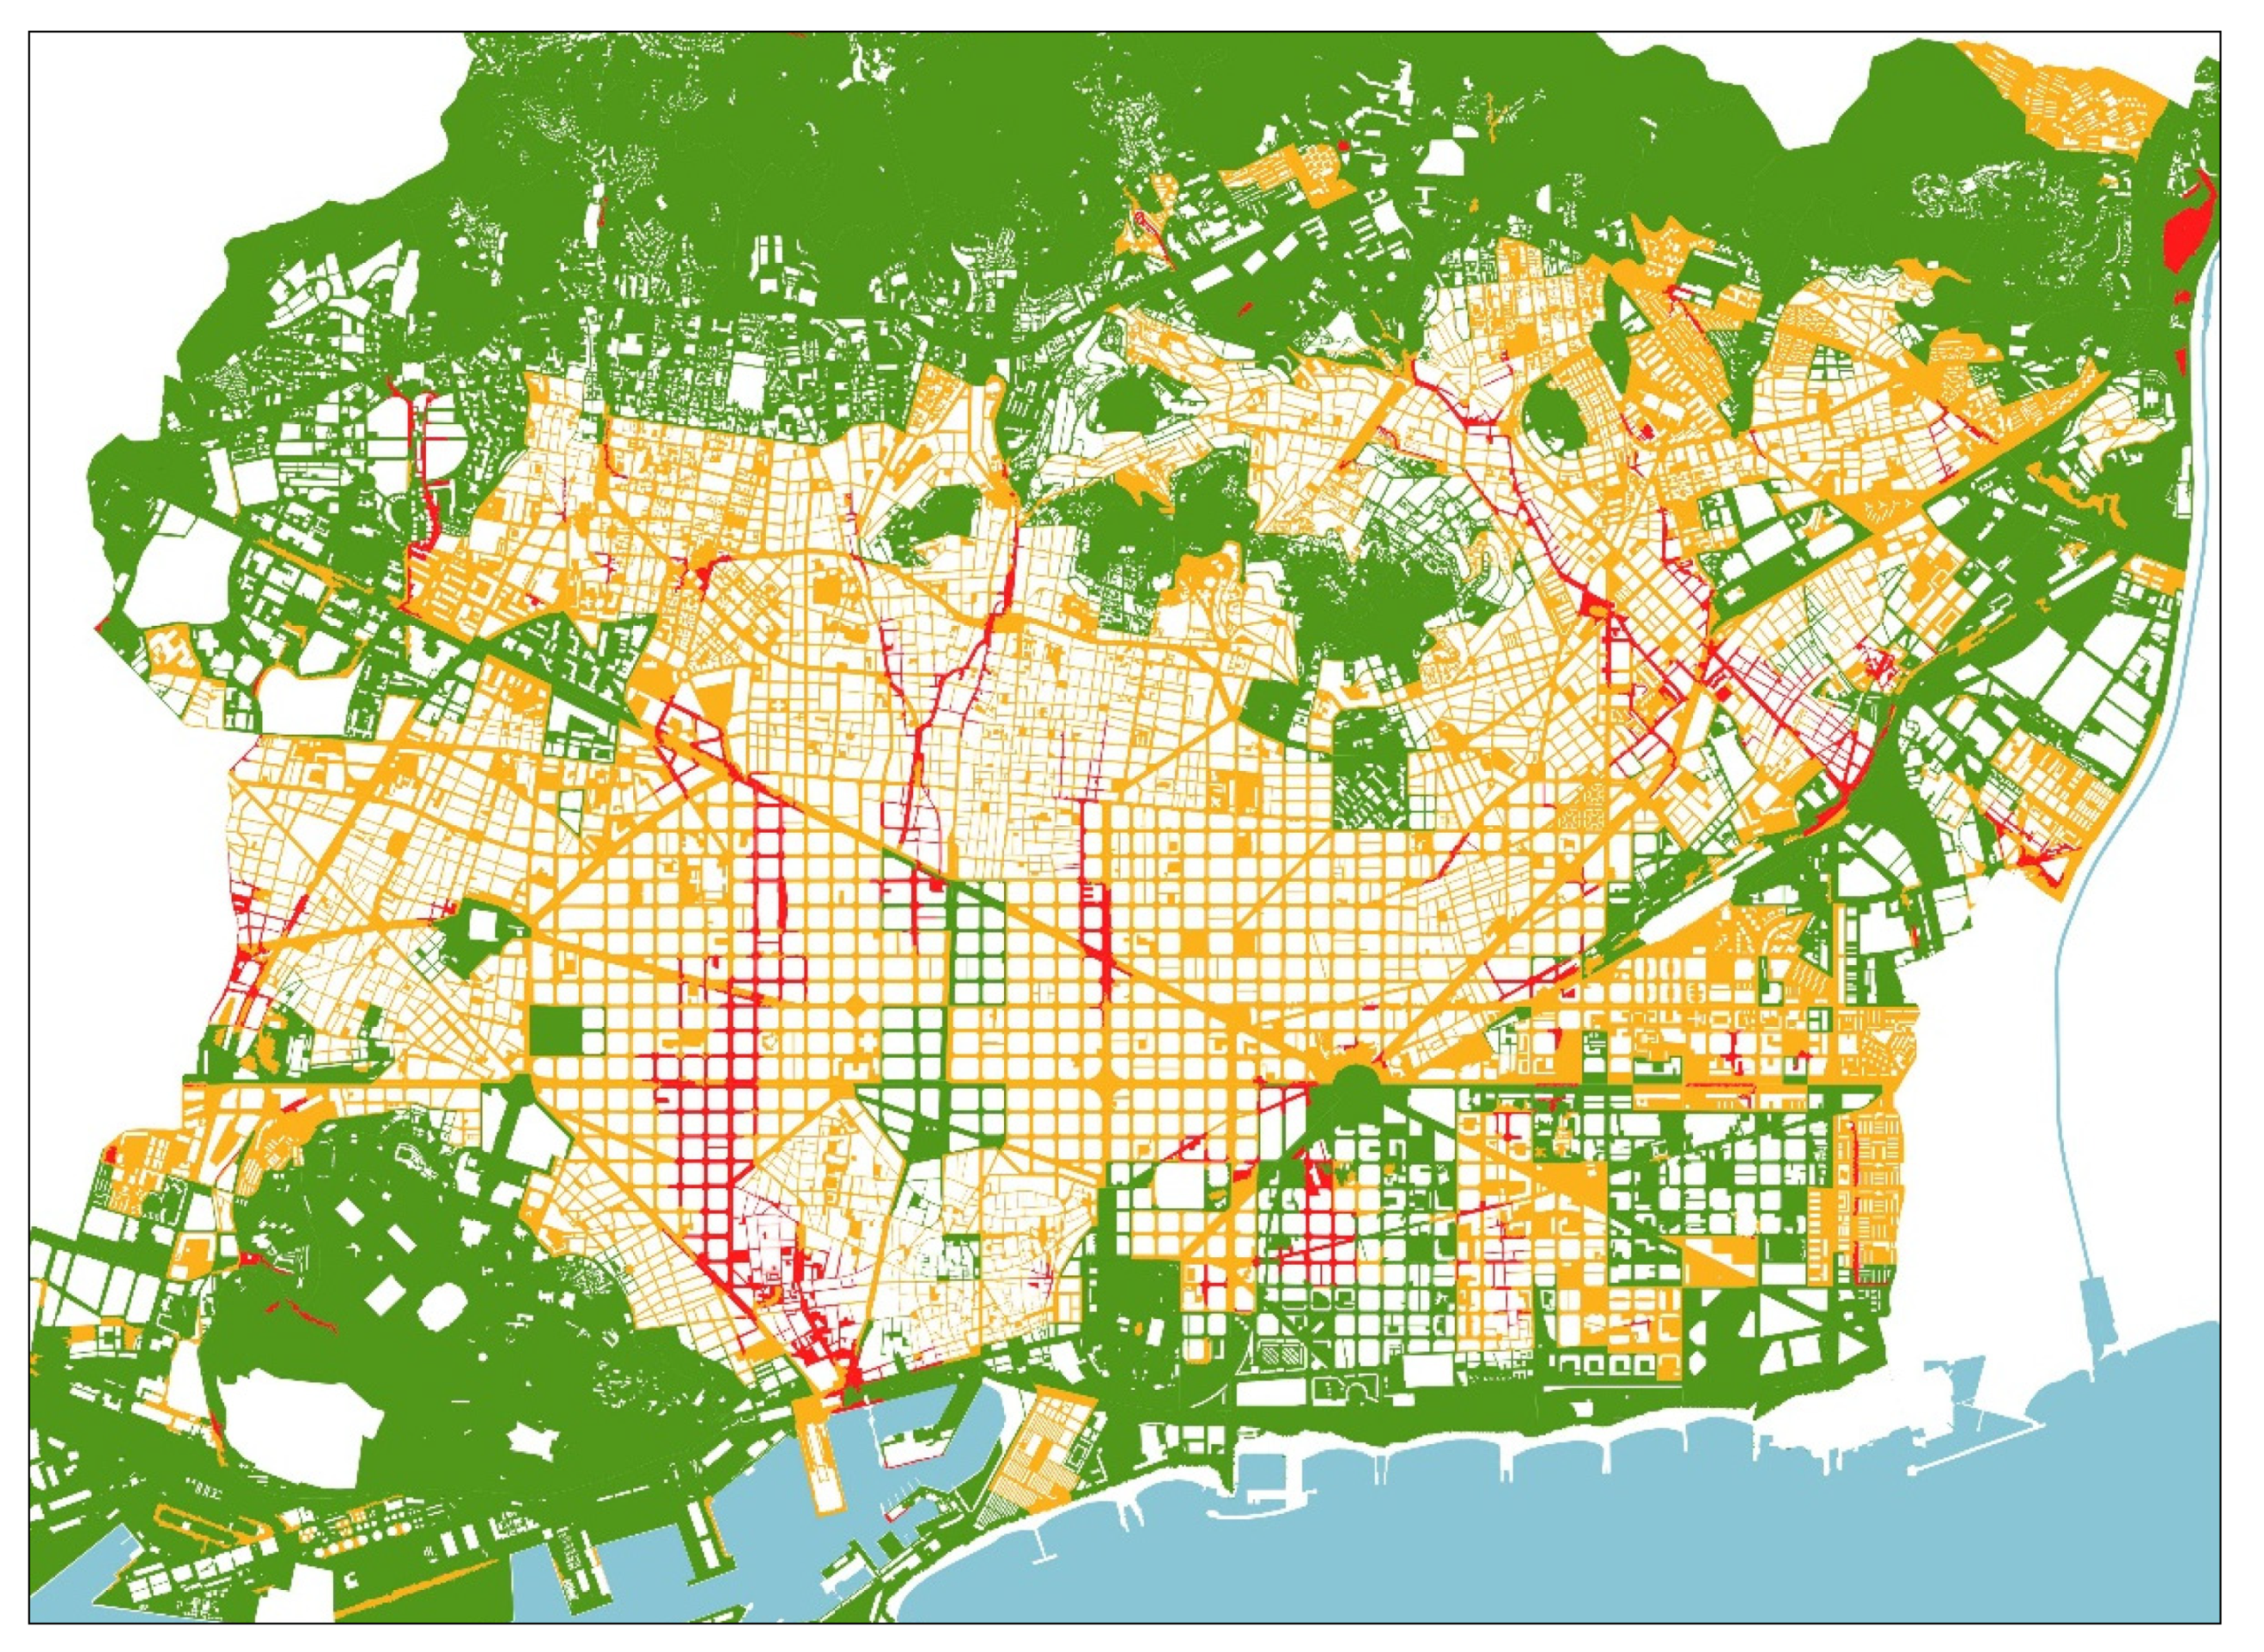
For example, by applying the experimental criteria related to pedestrian’s safety in urban areas, hazard maps were generated for the different rainfalls associated with various return periods. Cross-referencing these data with vulnerability data, based on susceptibility and exposure parameters, provided us risk maps for people that take the effects of climate change into account (Figure 9).
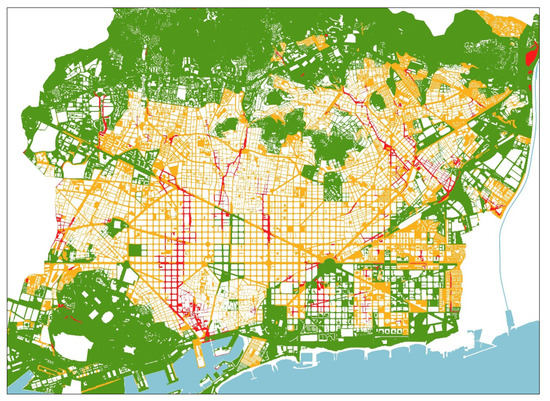
Figure 9.
Risk map for people for rainfall with a 10-year return period. Red indicates a high level of hazard, orange indicates a medium level, and yellow indicates a low level of hazard.
5.3. Flood Risk Management Measures
In order to accomplish the sewerage and drainage management criteria over the coming 80 years, the PDISBA puts forward a series of strategies that entail a change in the traditional drainage model, combined with a model of expanding and improving the infrastructures in line with the sustainable development goals.
5.3.1. Developing New Sustainable Urban Drainage Systems (SUDSs): Change in the Urban Planning Model and New Water Management Paradigm
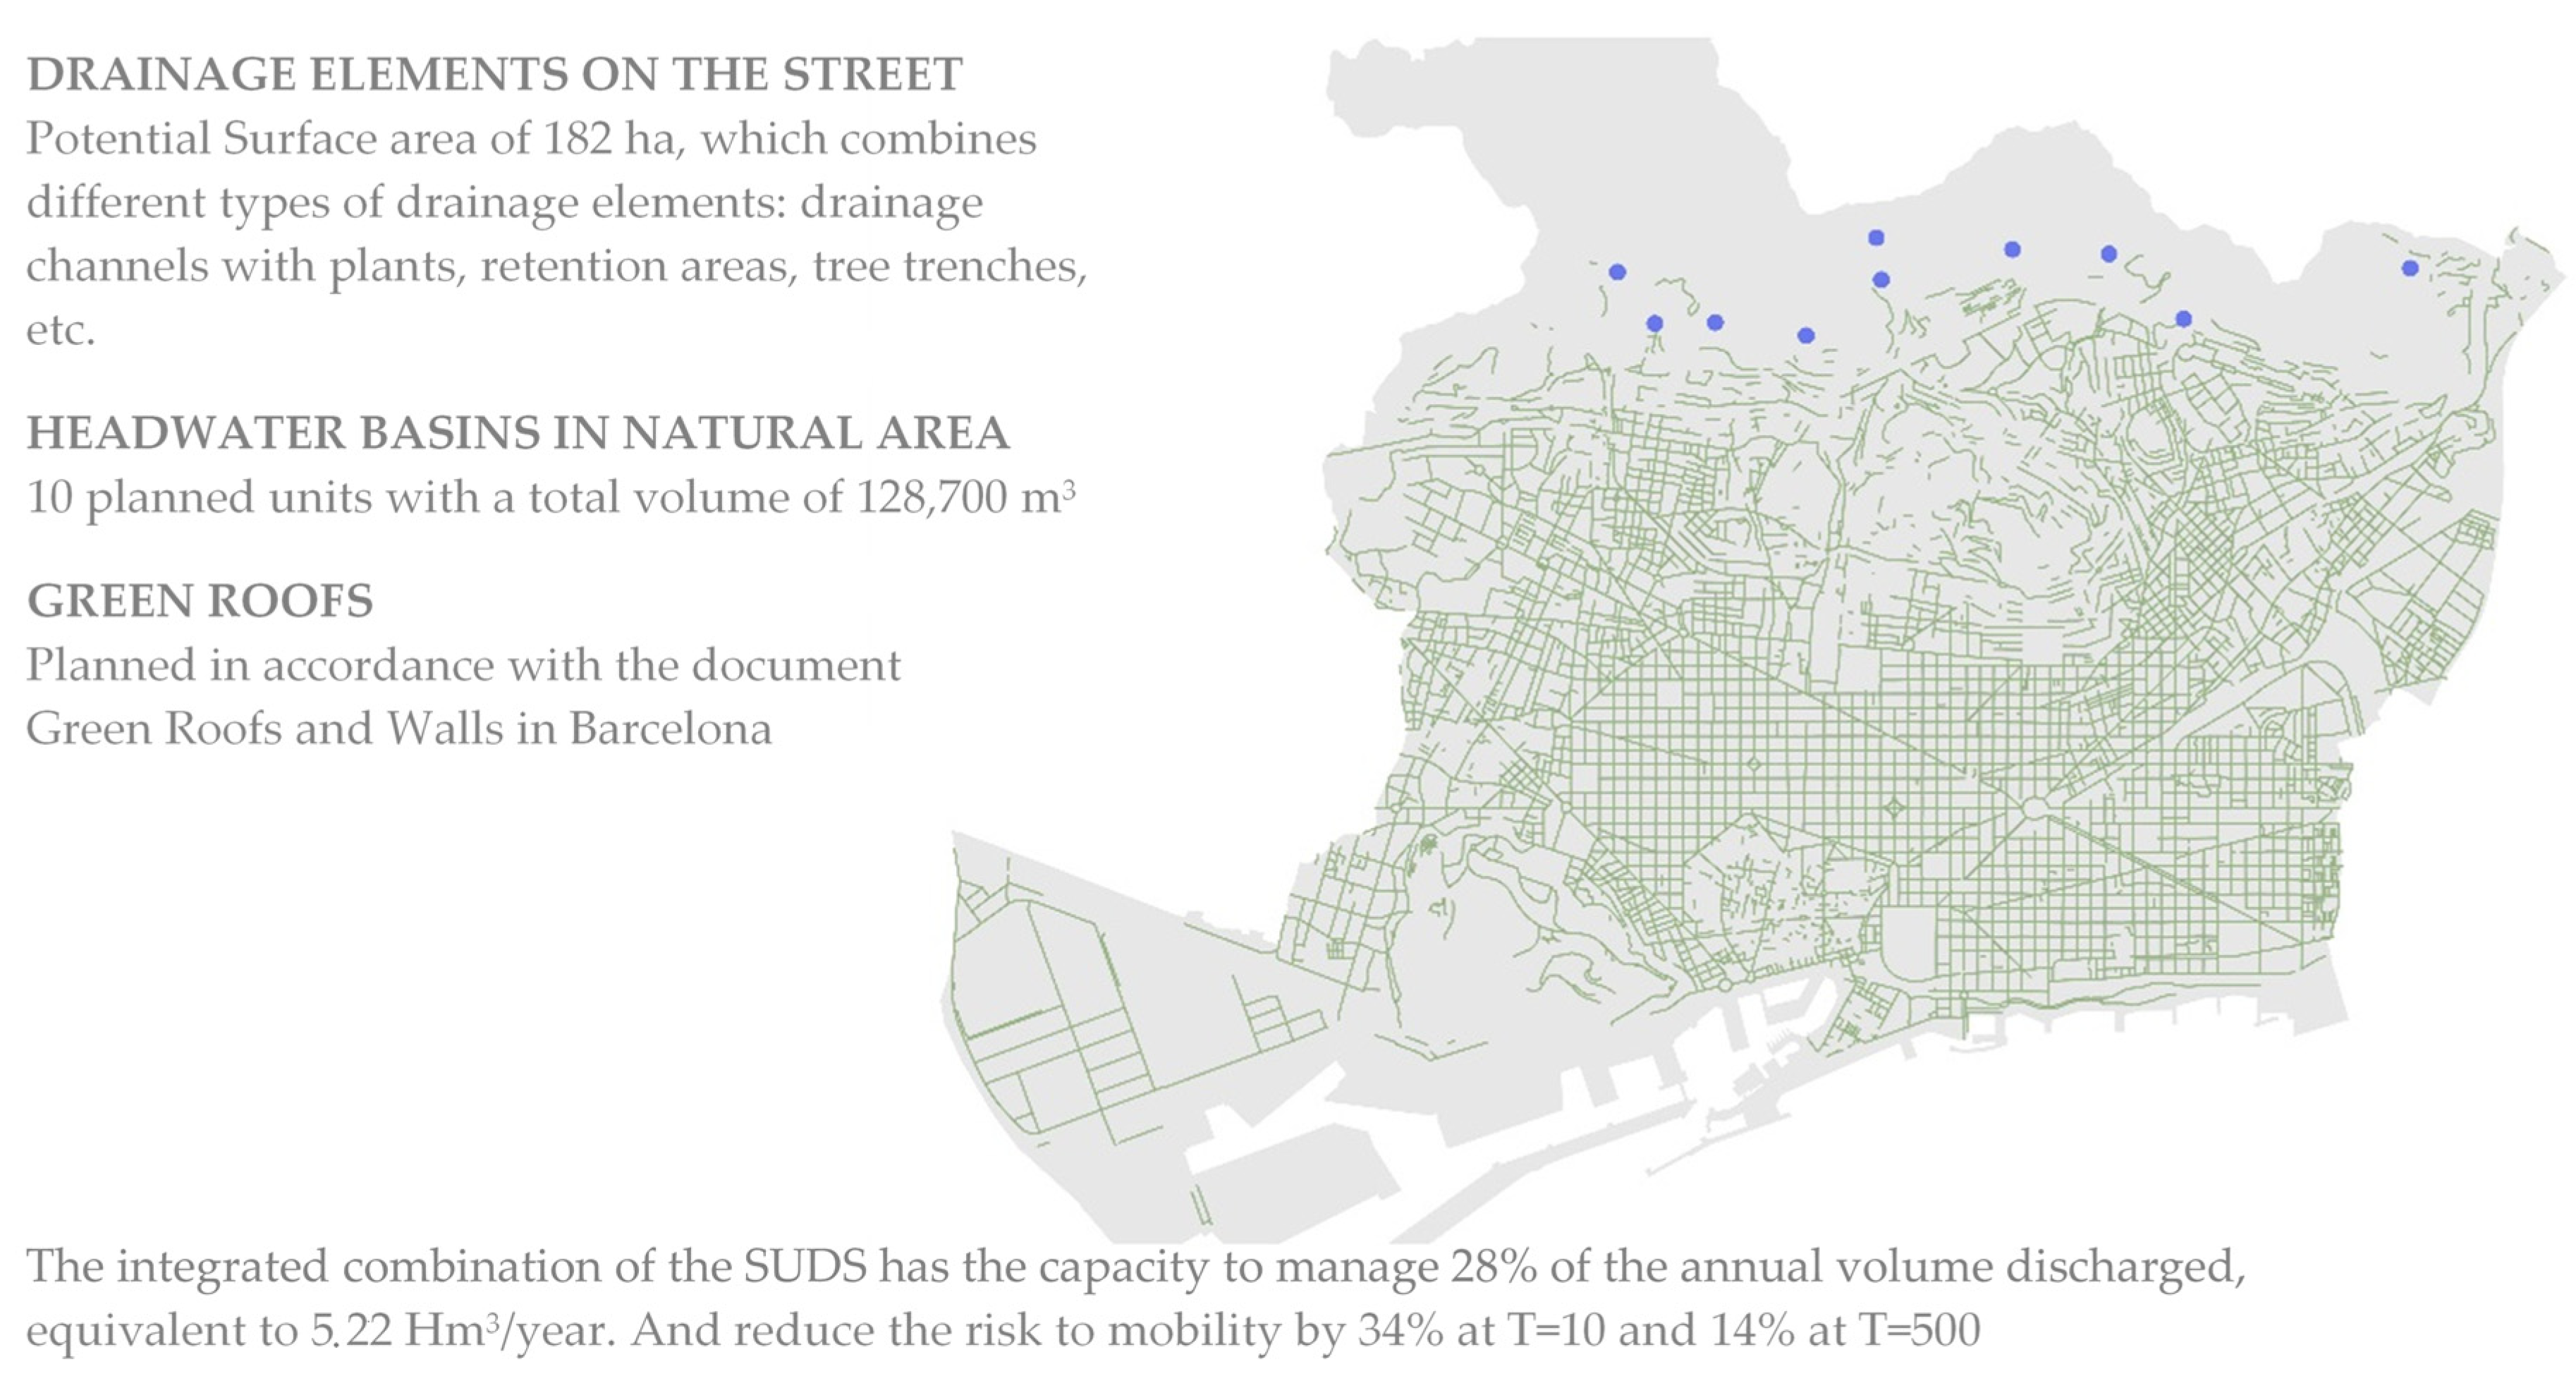
The new drainage management strategies are currently having a high positive impact on the city as they involve a new urban planning model based predominantly on sustainable urban drainage systems. These systems, also known as SUDSs, can manage rainwater at the collection source by means of controlled infiltration features, focusing on the pollutants and lightening the system load. These features reproduce nature’s drainage system, and linked to this, mean an increase in surface greenery, thus providing additional benefits such as better air quality and a reduced heat island effect. The PDISBA envisages Barcelona being equipped with a total SUDS surface area of 180 ha, strategically spread around the city, a set of retention ponds in the Collserola area, and a development plan for green roofs on buildings. Figure 10 shows the proposed SUDSs in the PDISBA.
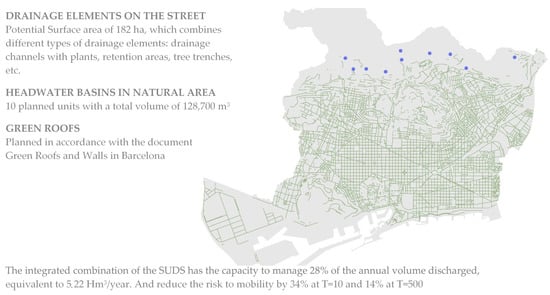
Figure 10.
The locations and descriptions of the Sustainable Urban Drainage Systems (SUDSs) defined by the Master Plan.
5.3.2. Expanding and Improving Sewerage and Drainage System Infrastructures
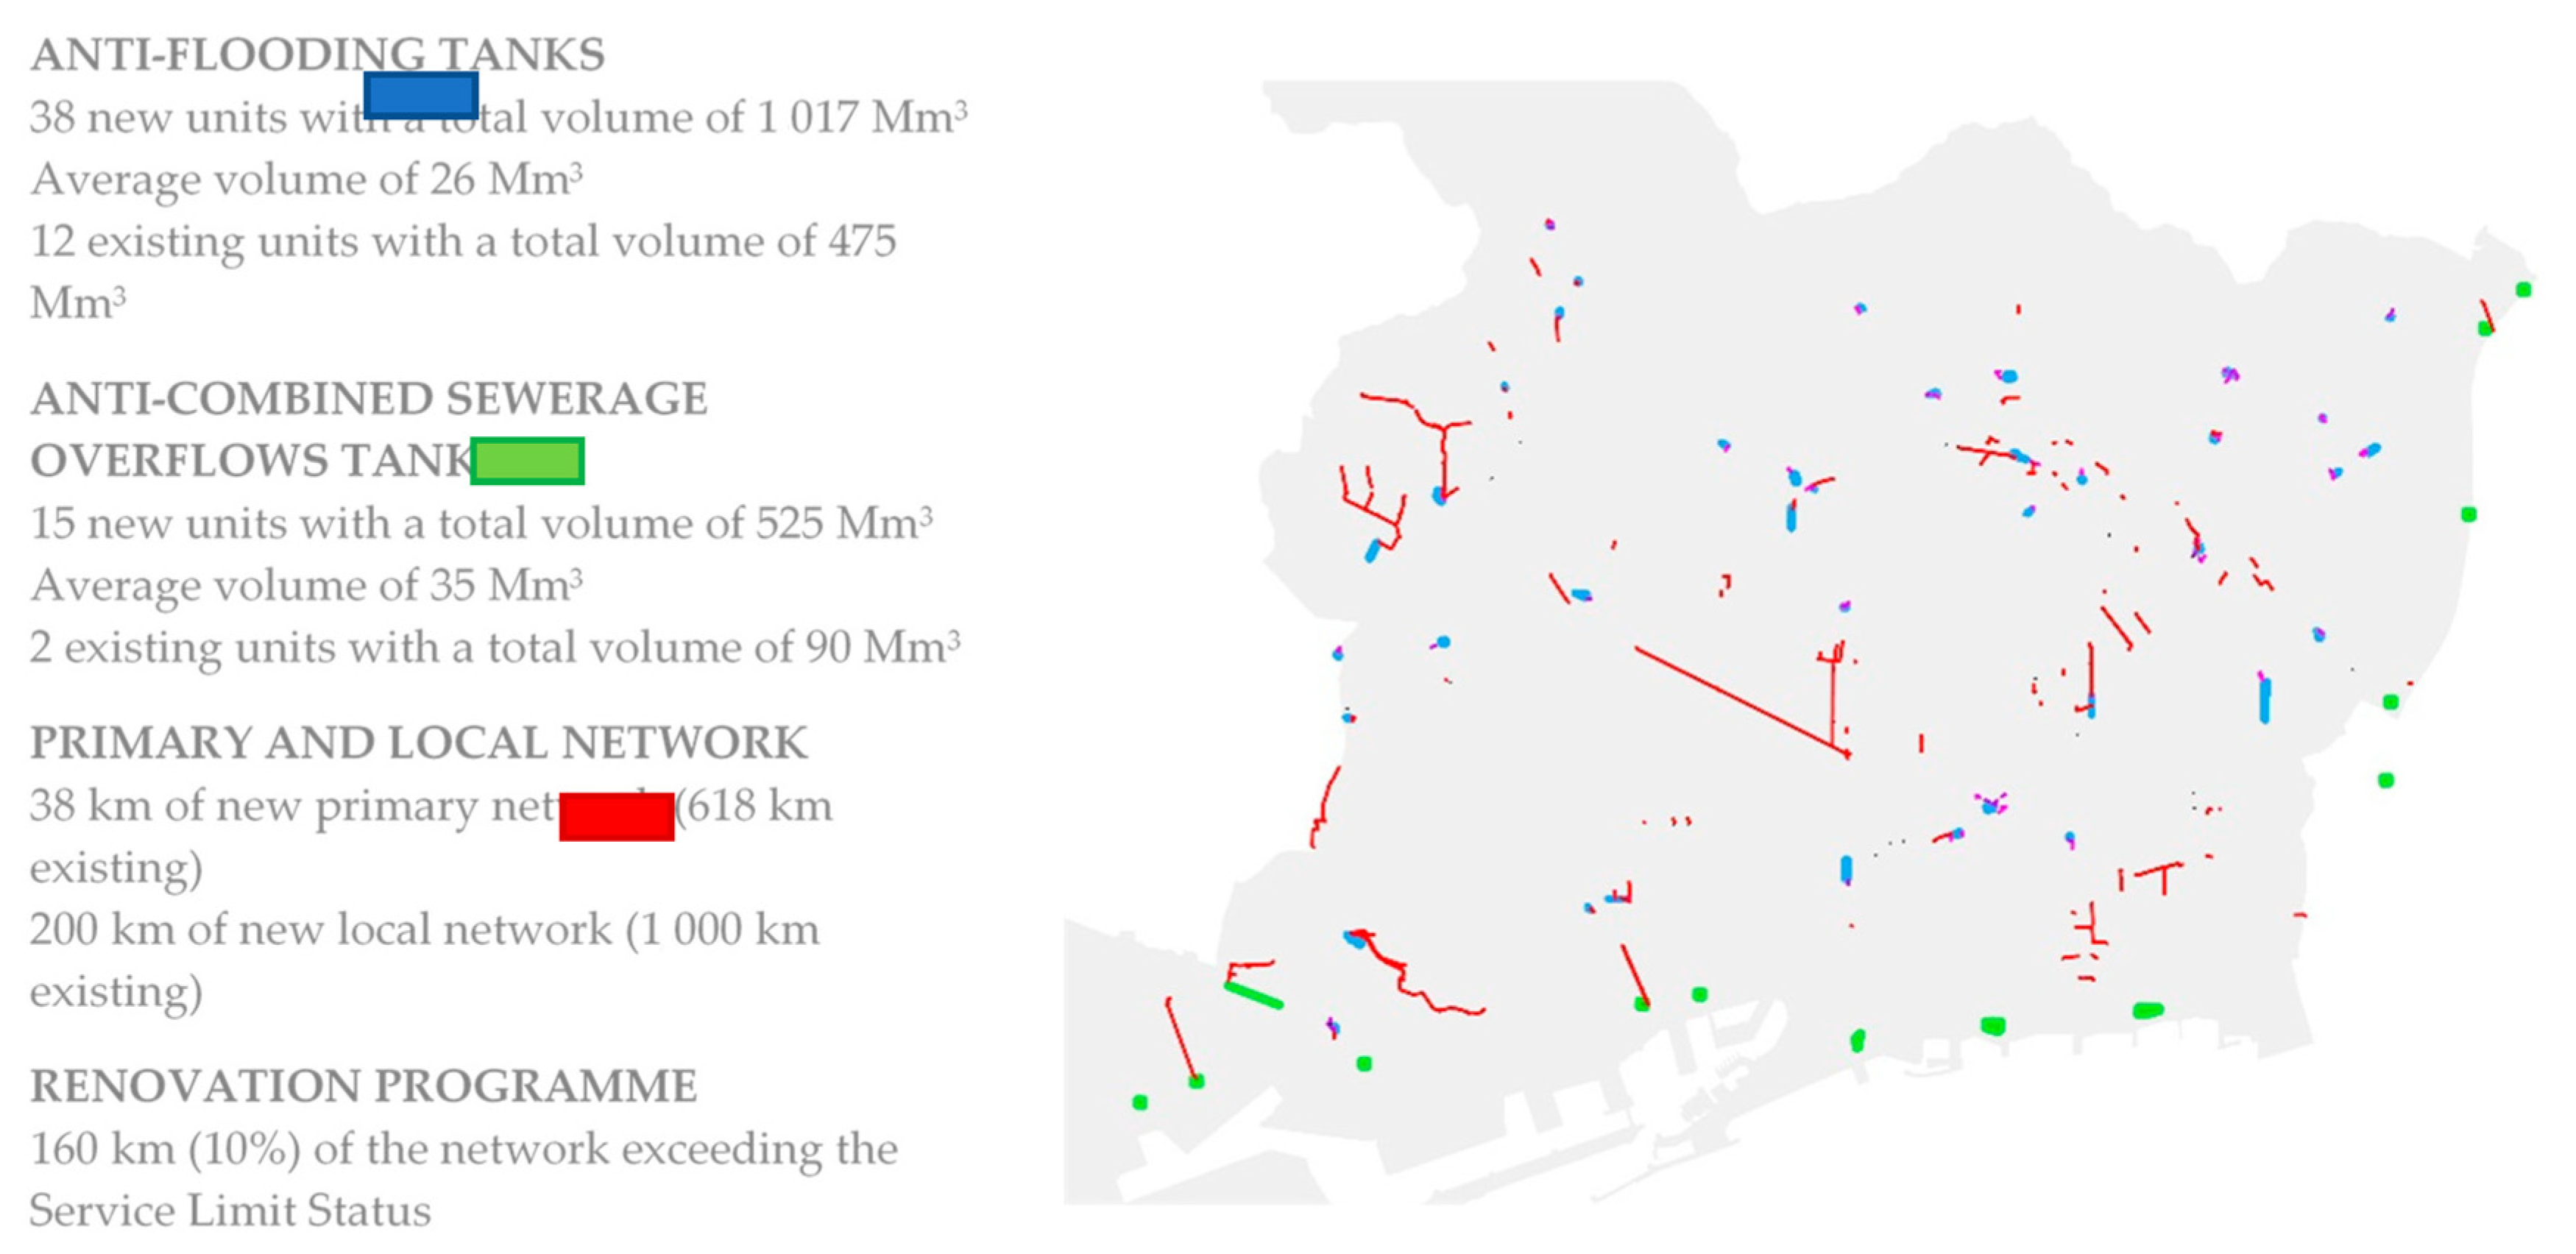
The PDISBA hydraulic model results suggest that the new SUDSs, although achieving a significant improvement of the drainage of the city, are not capable of guaranteeing environmental protection and flood safety criteria, so they have to be combined with a plan for improving and expanding the traditional sewerage and drainage infrastructure. This plan involves expanding and improving the system’s existing capacity by adding another 200 km extra to the existing local pipe network, thereby strengthening the surface drainage system, and by building a further 38 km of the high-capacity primary networks and expanding the water management volume by means of underground retention tanks.
At present, Barcelona has a sewer pipe network of approximately 1600 km and 12 tanks with a total volume of 0.47 Hm3 to handle surplus stormwater from the system produced during intense rainfall episodes. In addition to the sustainable urban drainage systems, the PDISBA provides for a fourfold increase in the total volume of tanks for handling surplus stormwater from the sewerage system, from 0.47 to 2.2 Hm3. This means going from the current 12 to 66 tanks, strategically spread out, of which 50 are to avoid flooding and 16 to protect receiving water bodies, the health of bathers, and the river and coastal ecosystem. Figure 11 shows the proposed structures.
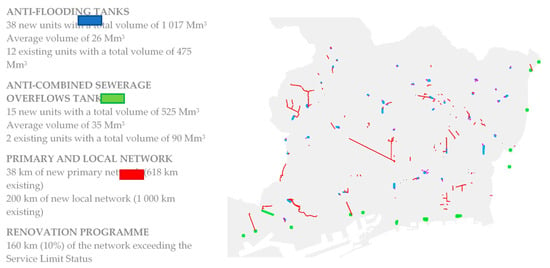
Figure 11.
Structural measures planned for mitigation in the Integral Drainage Master Plan of Barcelona (PDISBA).
5.3.3. Maintenance as a Basic Value of Sustainability
All of these new investments require a sustainable conservation plan for the sewerage and drainage assets that considers the effects of aging and the pace of replacement. One of the effects of the network’s aging is directly linked to the loss of quality of alternative water resources due to the pollution of the underground aquifer. The Barcelona City Council currently satisfies municipal water needs that do not require drinking quality by utilizing groundwater. Optimum network maintenance therefore directly impacts the reserves of alternative water resources.
At present, the City Council repairs the sewer system at an average rate of 7.2 km/year, which means a renovation rate of 0.47%. Network maintenance efforts therefore need to be doubled to reach optimum maintenance levels from the point of view of asset sustainability and preserving alternative water resources.
The Conservation and Maintenance section in the PDISBA states that optimum, sustainable maintenance means moving toward a renovation rate of 1%, i.e., repairing 16 km a year. This increased repair rate would flatten the aging curve and ensure an optimum service level at minimum cost, thus helping to maintain and preserve the quality of groundwater reserves.
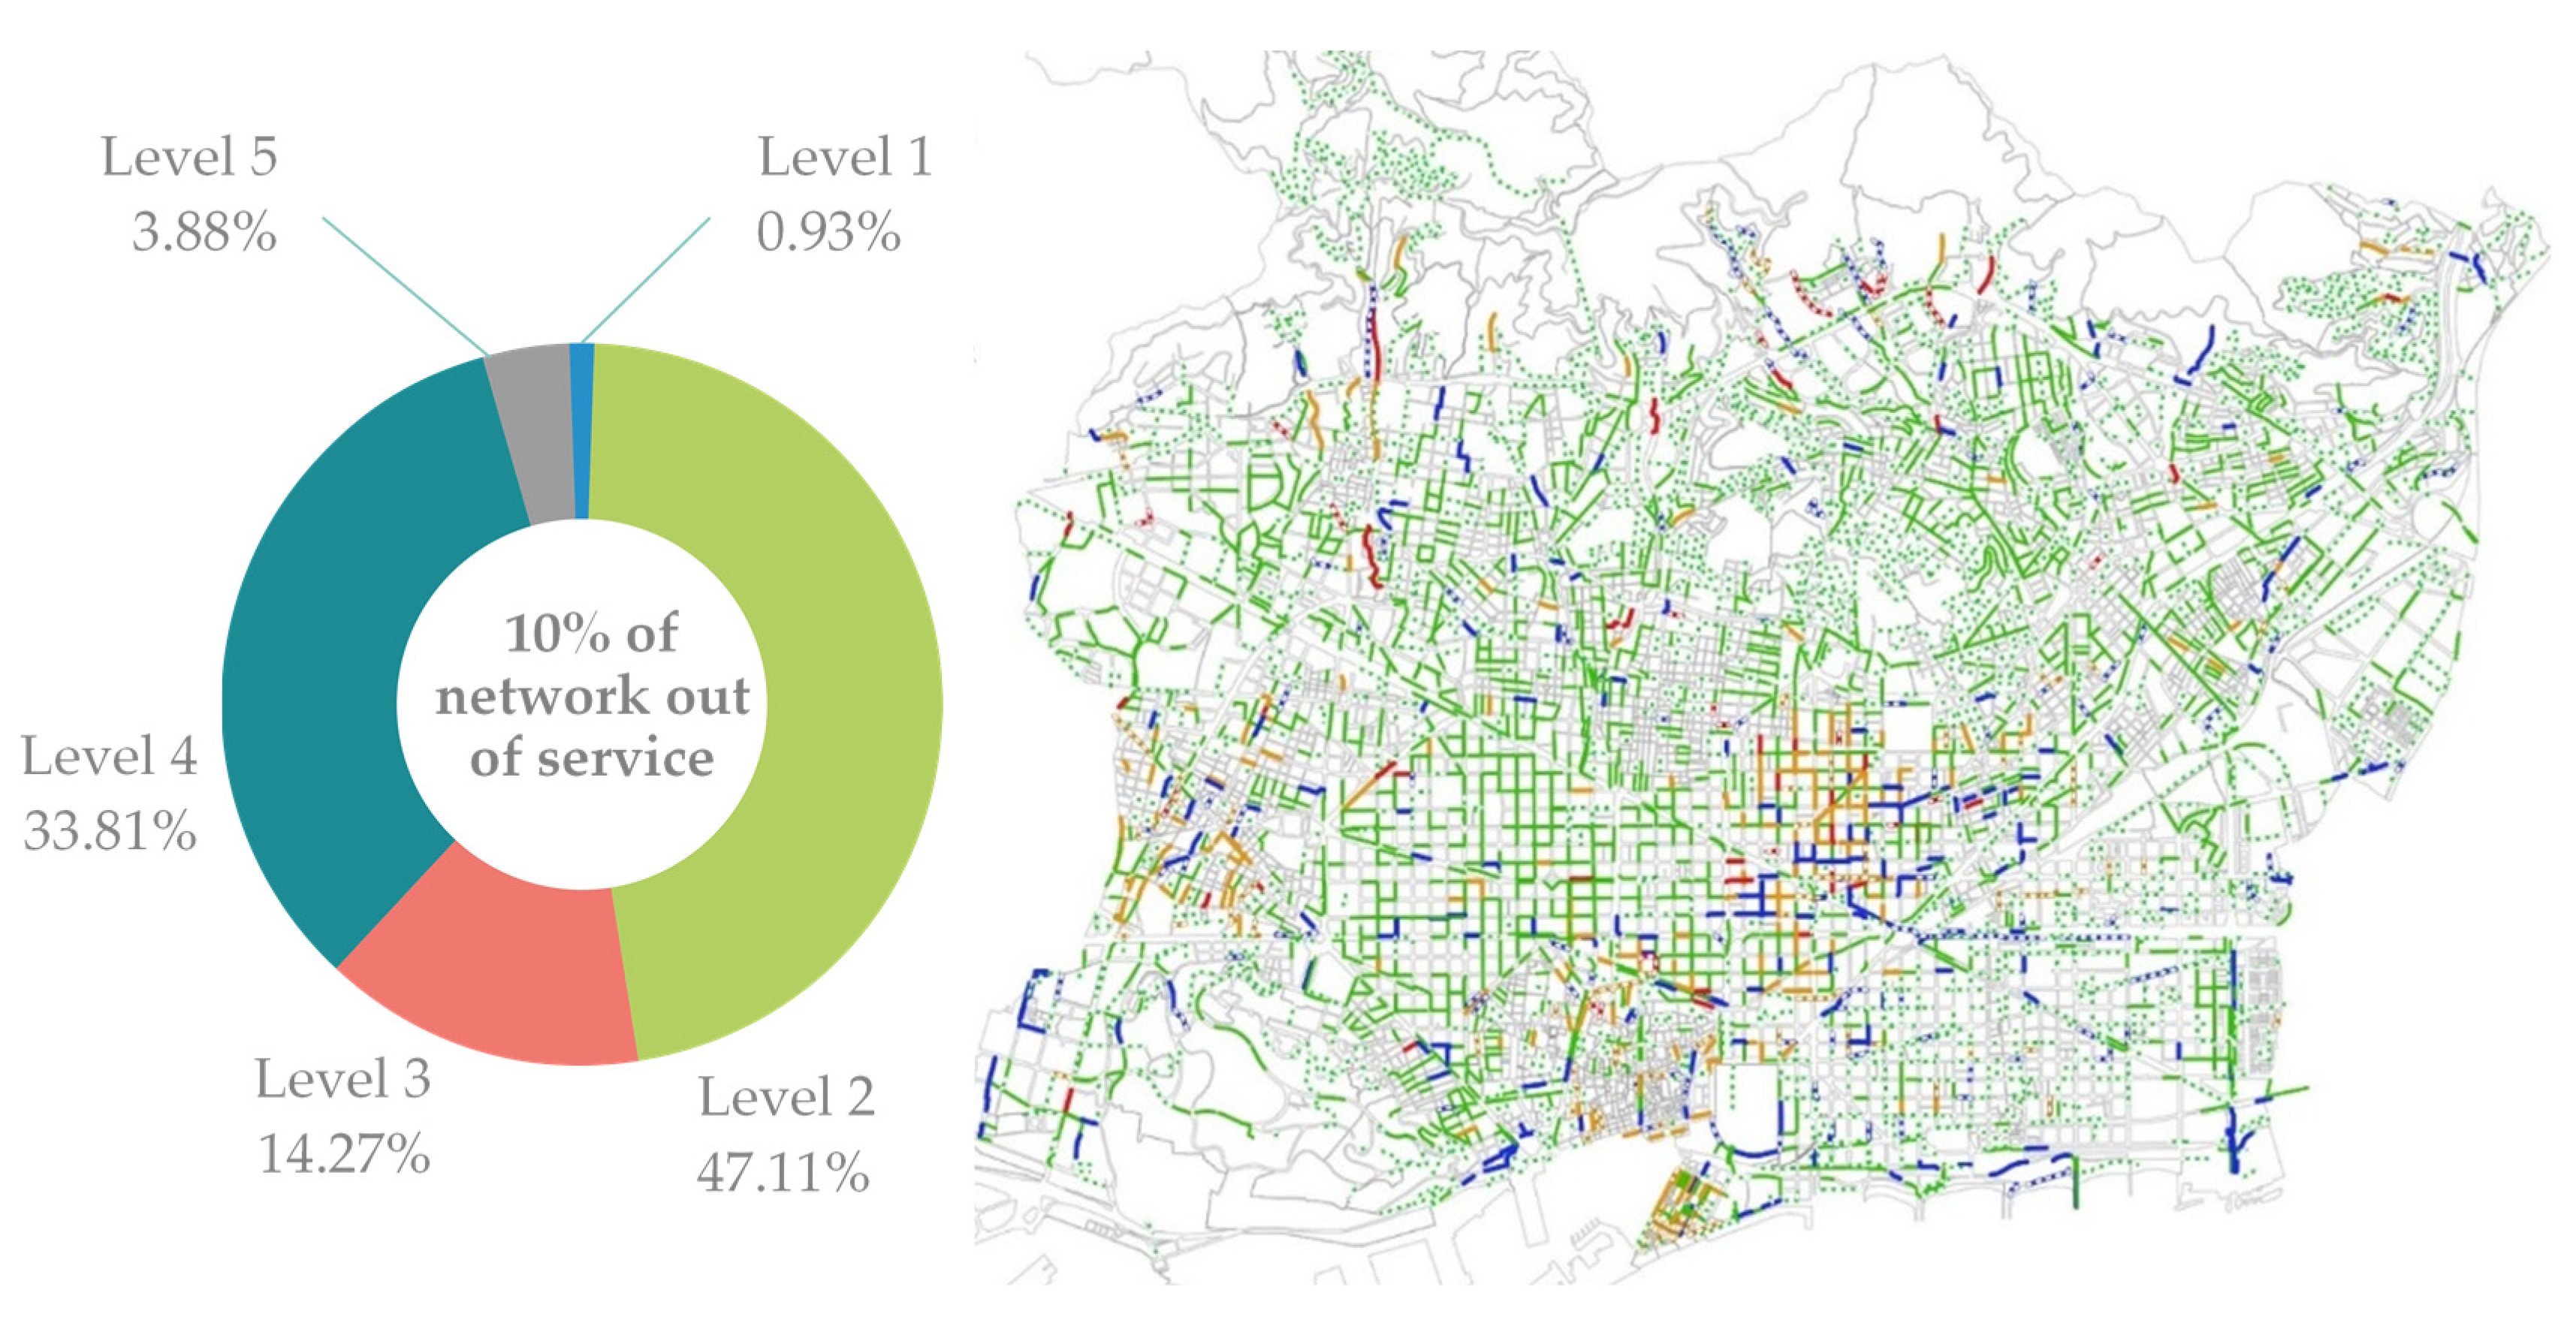
Figure 12 shows the current level of damage of Barcelona’s sewerage system, levels 4 and 5 being fully damaged pipes. Ten percent of the current network is not able to provide the required level of service.
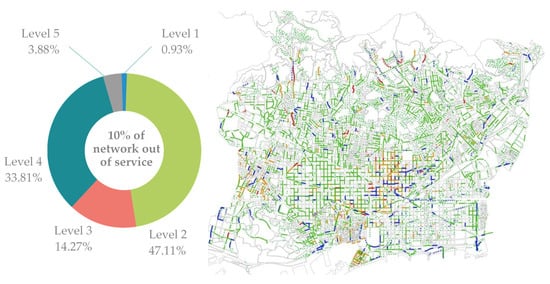
Figure 12.
Level of damage in the existing network. PDISBA includes Level 4 and 5 fixing.
5.4. Residual Risk Analysis
The proposed measures in the plan are not able to completely eliminate the flood risk, so the remainder of the risk is evaluated under different conditions. Using the residual risk, it will be possible, in the following, to estimate the risk management benefit.
5.4.1. Extraordinary Hydrological Scenarios for Flood Analysis
For the synthetic rainfall event of a 10-year return period with climate change, it is verified that the objectives of protection of operation of the network in flow conditions and to avoid floods have not been able to reach 100%, although the reductions with respect to diagnoses are very important. 98% of floods are avoided and risk is practically complete for this return period (Table 3).

Table 3.
Comparison of the improvement in the hydraulic operation between the diagnosis and the forecasts for T = 10 years with climate change (meters I% of network).
It is also important to note that the great improvement in the operation of the network between the prognosis 1 scenario and the prognosis 2 scenario was not caused exclusively due to the planned structural actions, but partly thanks to the hypothesis considering that the floods in the secondary network are solved by increasing the capacity of the secondary network.
The operation of the network was also analyzed, but only for the main network in order to eliminate the effect of the improvement in functionality due to the increase in the capacity of the secondary network in the forecast scenario 2. Thus, it was verified that counting the total of the network by T10 in scenario 1 resulted in a 780 km free flow network, while in scenario 2, this increased to 1580 km (an improvement of more than double). In contrast, by counting only the main network, the improvement was smaller, going from 227 to 377 km of the network functioning under the free flow condition.
5.4.2. Ordinary Hydrological Scenario for CSO Analysis
For each of the forecast scenarios (forecast 1 related to SUDS implementation and forecast 2 related to implementation of SUDSs + structural measures), the year 2009 was simulated as average rainfall to obtain the volumes and the pollution caused by the overflow points. In addition, a 3D marine model simulated the water quality of the bathing waters in Barcelona during the bathing season of 2009. The model aimed to estimate the impact of spills on bathing areas in terms of water quality standards.
The results presented here (Table 4) allow for the conclusion that the objective regarding the reduction of pollution discharged by both the Besòs river and the port was achieved, although, in this case, the reduction was smaller due to the fact that many spills are not related to the main CSO points.

Table 4.
Percentages of the pollution reduction discharged in the two CSO prognosis scenarios with respect to diagnosis.
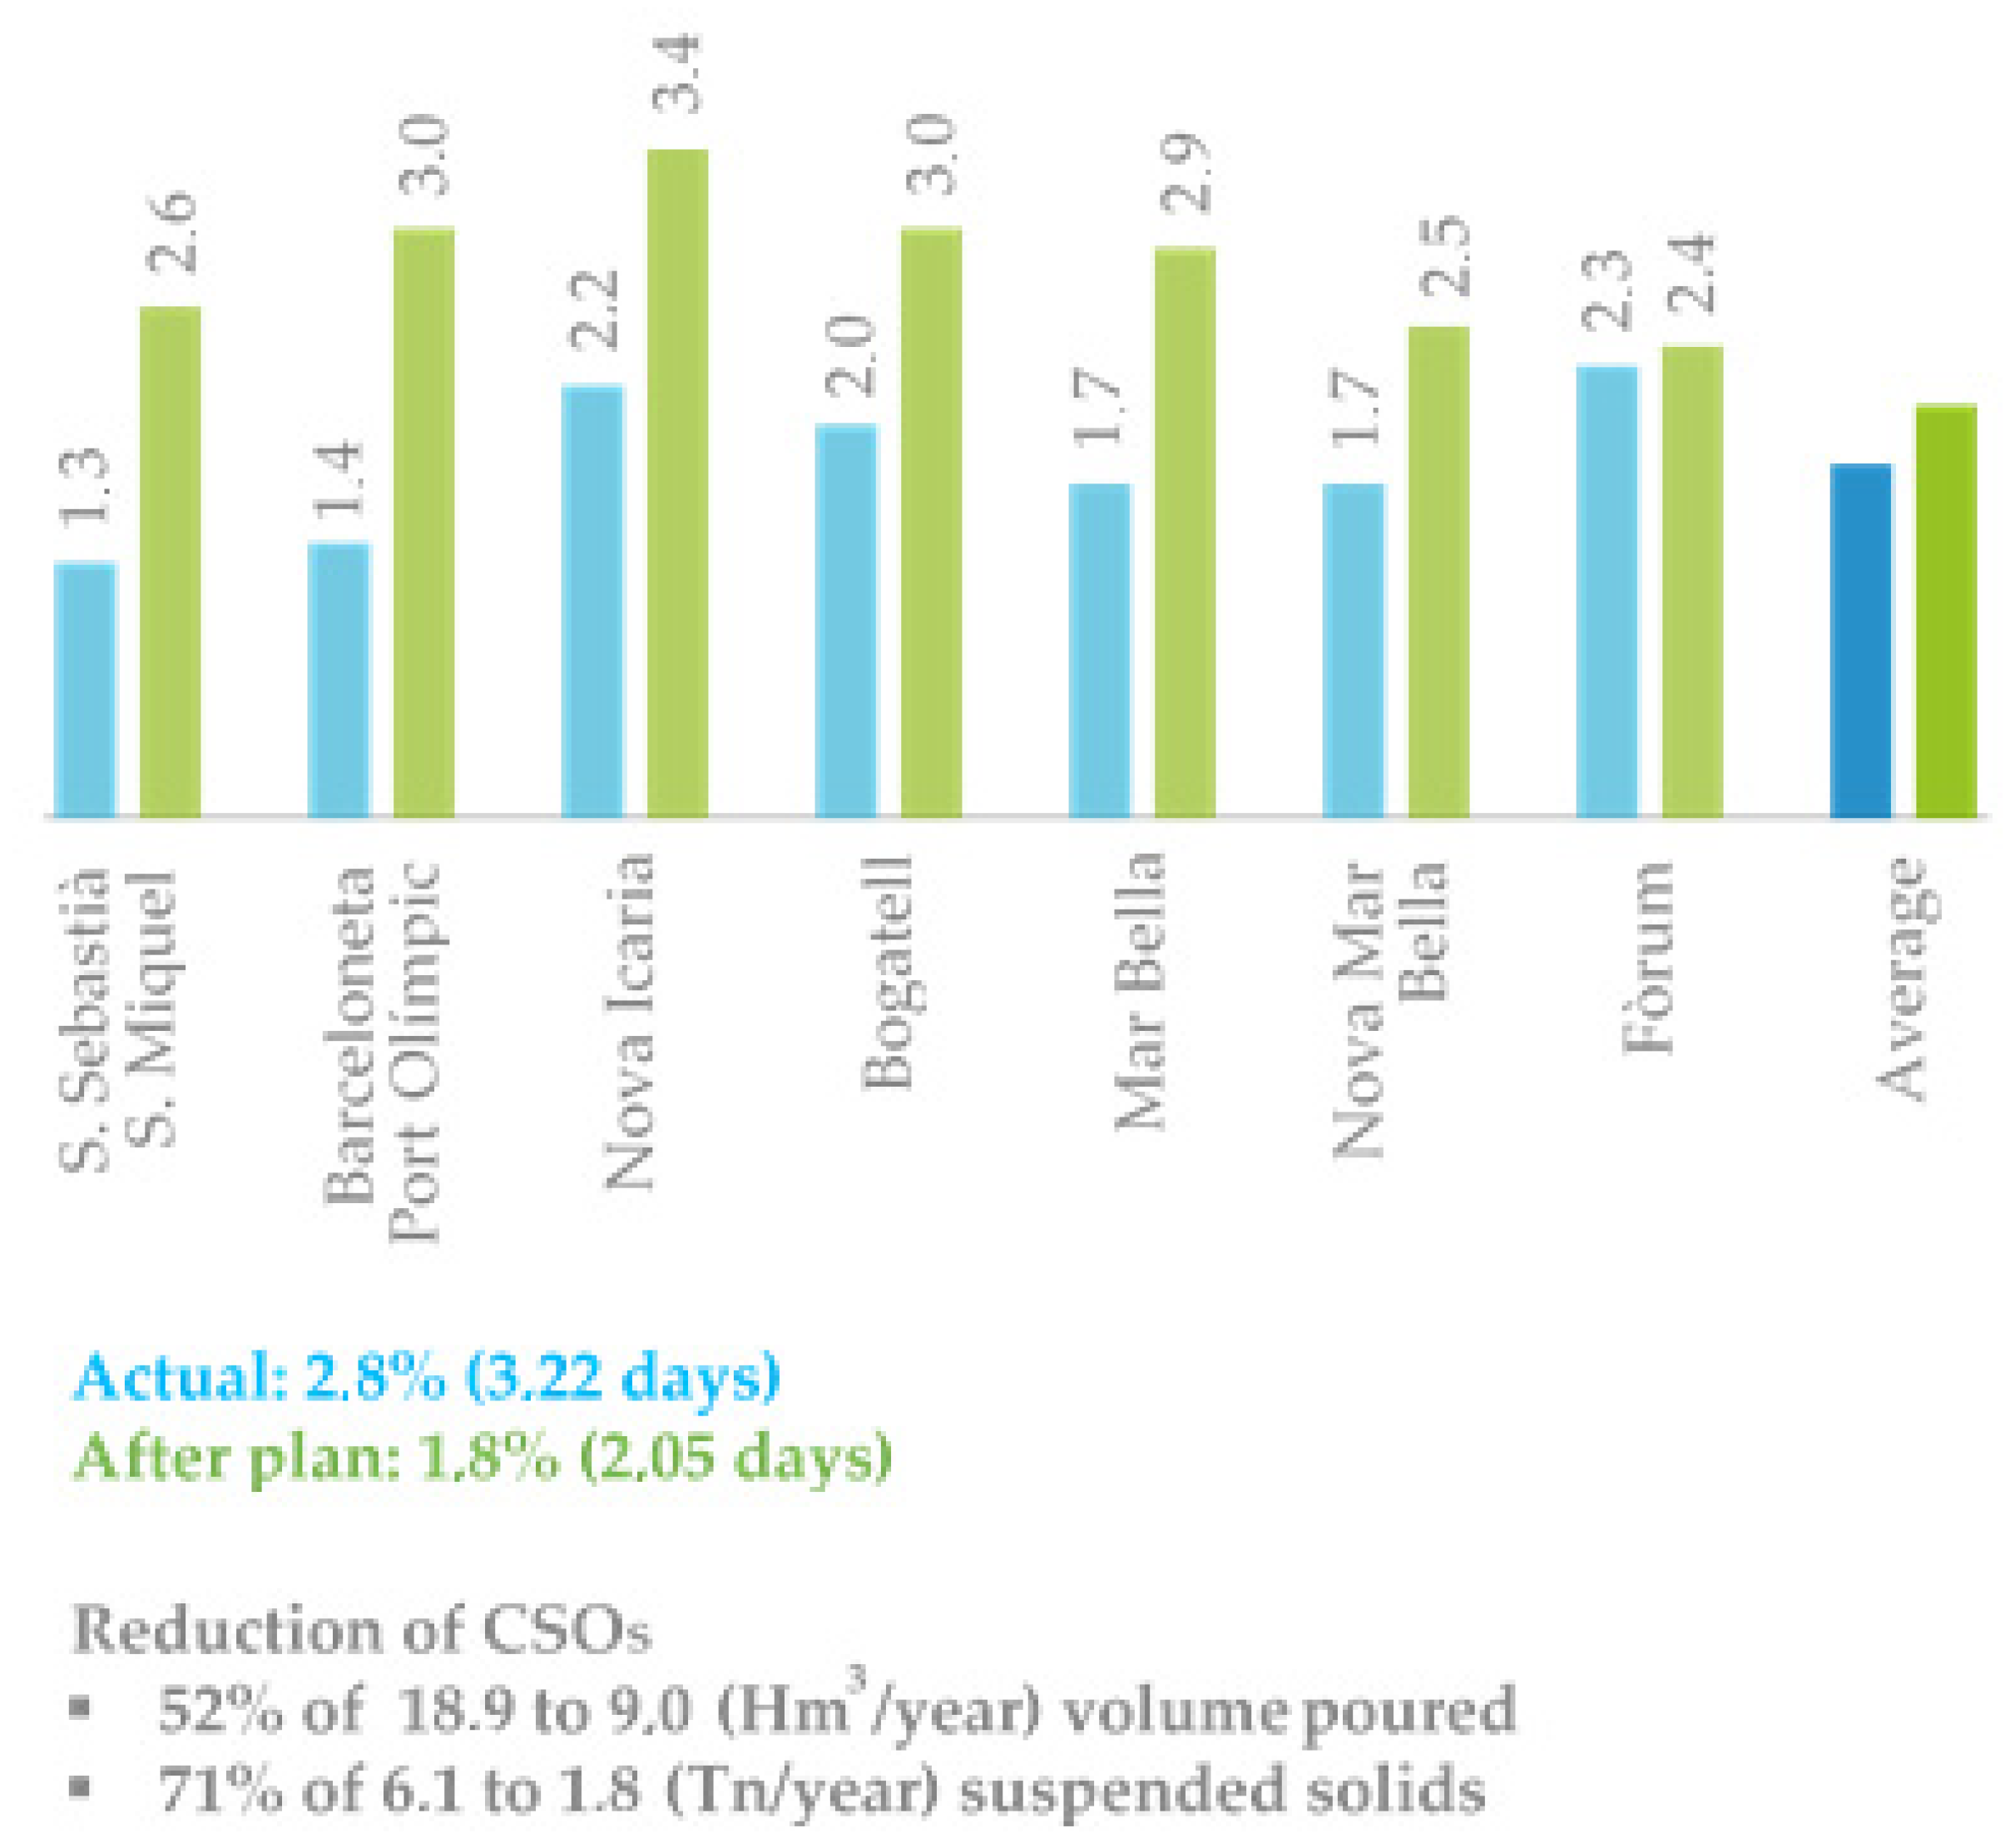
The aim of the adaptation measures for the environmental impact was to focus on the reduction in the pollutant discharge and the impact on the bathing water regulations. Figure 13 shows the water quality impact of the CSOs before the plan and after the application of all measures.
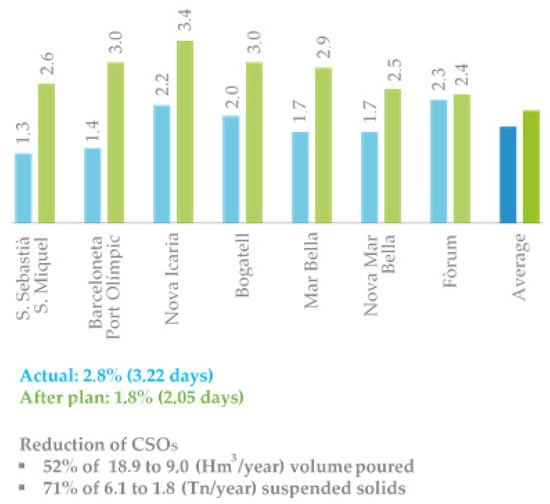
Figure 13.
Percentage of time with low-quality bathing waters of Barcelona’s shoreline due to CSOs. The results are outlined for every beach in the city.
5.5. 10-Year Return Period Damage Computation
The residual risk and ante actual risk were both transformed into damage following the flood damage model developed in PDISBA. This step is necessary to be able to perform CBA. CBA is not used to rank measures; instead, it is used to justify the proposed investment plan. The results are presented in Table 5.

Table 5.
Flood and environment damage for the different scenarios using the 10-year return period events. The concept to quantify the flood impact is the expected annual damage (EAD).
6. Financial Analysis and Investment Planning
In this section, the damage is related to the investments, while financial analysis is applied to decide the value of the proposed mitigation measures.
6.1. Summarized Infraestructure Construction Budget
Table 6 shows the adaptation measure budget, which totals €1422 million. In contrast, the investment associated with the environmental impact (i.e., CSOs) is €206 million; hence, the budget related to flood management is €1226 million. The costs were estimated through the prices database of the City Council, including all of the civil works developed over the last years. The total volume of the planned storm tanks was above 1 million cubic meters, the cost per cubic meter being approximately 0.5 €/m3.

Table 6.
Summary of the total investment in mitigation measures developed in PDISBA.
The SUDS investment corresponds to 15% of the total budget and its development will be in parallel to other urban civil works.
6.2. Investment Plan
The total budget of the measures planned in the PDISBA is approximately €1500 million. The impact of this investment on the economy of the city forces to develop an investment plan, reasonable for the capabilities of the City Council. The time span used in the financial analysis was 20 years for the implementation of measures and 80 years for the life cycle of the infrastructures. The residual value was considered to compute the net present value (NPV) and the internal rate of return (RR) on investment.
Table 7 shows the planned investment rate and compares it with the actual rates. The impact on the local economy is clear, and evolves from an investment rate of €14 million to a new one of €45 million.

Table 7.
Investments rates in the next 20 years to develop the measures planned in the PDISBA.
6.3. Investment Rationalization and Sustainability
The overall PDISBA budget, including the sustainable urban drainage systems, conservation measures, and actions to expand and improve the sewerage and drainage system, stands at €1.4 billion. That is divided into €700 million for risk management and environmental protection measures and €700 million on the local network and sustainable urban drainage systems. The budget is equivalent to approximately 34% of the system’s heritage value, calculated at €4.6 billion. To put it another way, the average age of Barcelona’s sewerage and drainage system is 69 years, and it will require an investment of approximately one third of its asset value to tackle the challenges of the next 80 years in its lifespan. In general terms, the investment plan, which stems from the PDISBA’s overall budget, means an investment rate of €175 million every 10 years.
The City Council is currently working on the block relating to investment in risk management and adapting it to climate change in the most vulnerable neighborhoods by means of the following specific actions in the next six years:
- Division of the large Av. de la Diagonal interceptor, in the final regulated stretch between Carrer de Girona and Passeig de San Joan, to defend and protect the lower part of Gràcia, around the streets of Girona and Bailen—with an approximate budget of €8 million.
- The third phase of the Av. Paral·lel-Carrer Vila i Vila drainage shaft, in the first stage of Carrer Vila i Vila, for the defense and protection of the neighborhoods in the confluence of Ciutat Vella, the lower part of Eixample Esquerre, and Poble Sec—with an approximate budget of €21 million.
- Underground regulation tank for the rainwater from the Av. de Prim drainage shaft, for the defense and protection of the La Sagrera area and the Besòs Maresme neighborhoods—with an approximate budget of €55 million.
Therefore, €84 million—96% of the investment envisaged under the PDISBA in the next 10 years on the risk management and adaptation to climate change block—has already been invested for the next six years
6.4. Cost–Benefit Analysis (CBA)
Due to the different time spans and life cycle durations of the infrastructures planned, the equivalent annual annuity (EAA) of the NPV was used to perform the CBA, labeled as the annual equivalent present value (AEPV). The rate of interest used for the financial computation was 1.23% [42], and the period considered was 80 years, with an implementation period of 20 years. For the structural measures, the life cycle was assumed to be 80 years, and for the SUDSs, 20 years was assumed. Meanwhile, the green roof life was expected to be 70 years. The benefit was computed using the avoided damage, evaluated as the difference in the EAD [43] for the different scenarios.
The costs used for the CBA included the implantation of measures and the operation and management cost as well. In the case of structures with smaller time spans than the analysis period, rehabilitation or refurbishment was included in the cost.
As mentioned in the introduction, the complexity of the interactions between management measures did not permit to compute their effects independently. Moreover, it was not possible to compute the effect of all combinations; hence, two groups were defined as sequential steps:
- SUDS development: This scenario assumes that all the SUDSs are implemented in the city.
- SUDSs + structural measures: This scenario occurs after the previous one, in which SUDSs are finished and then the structural measures are implemented.
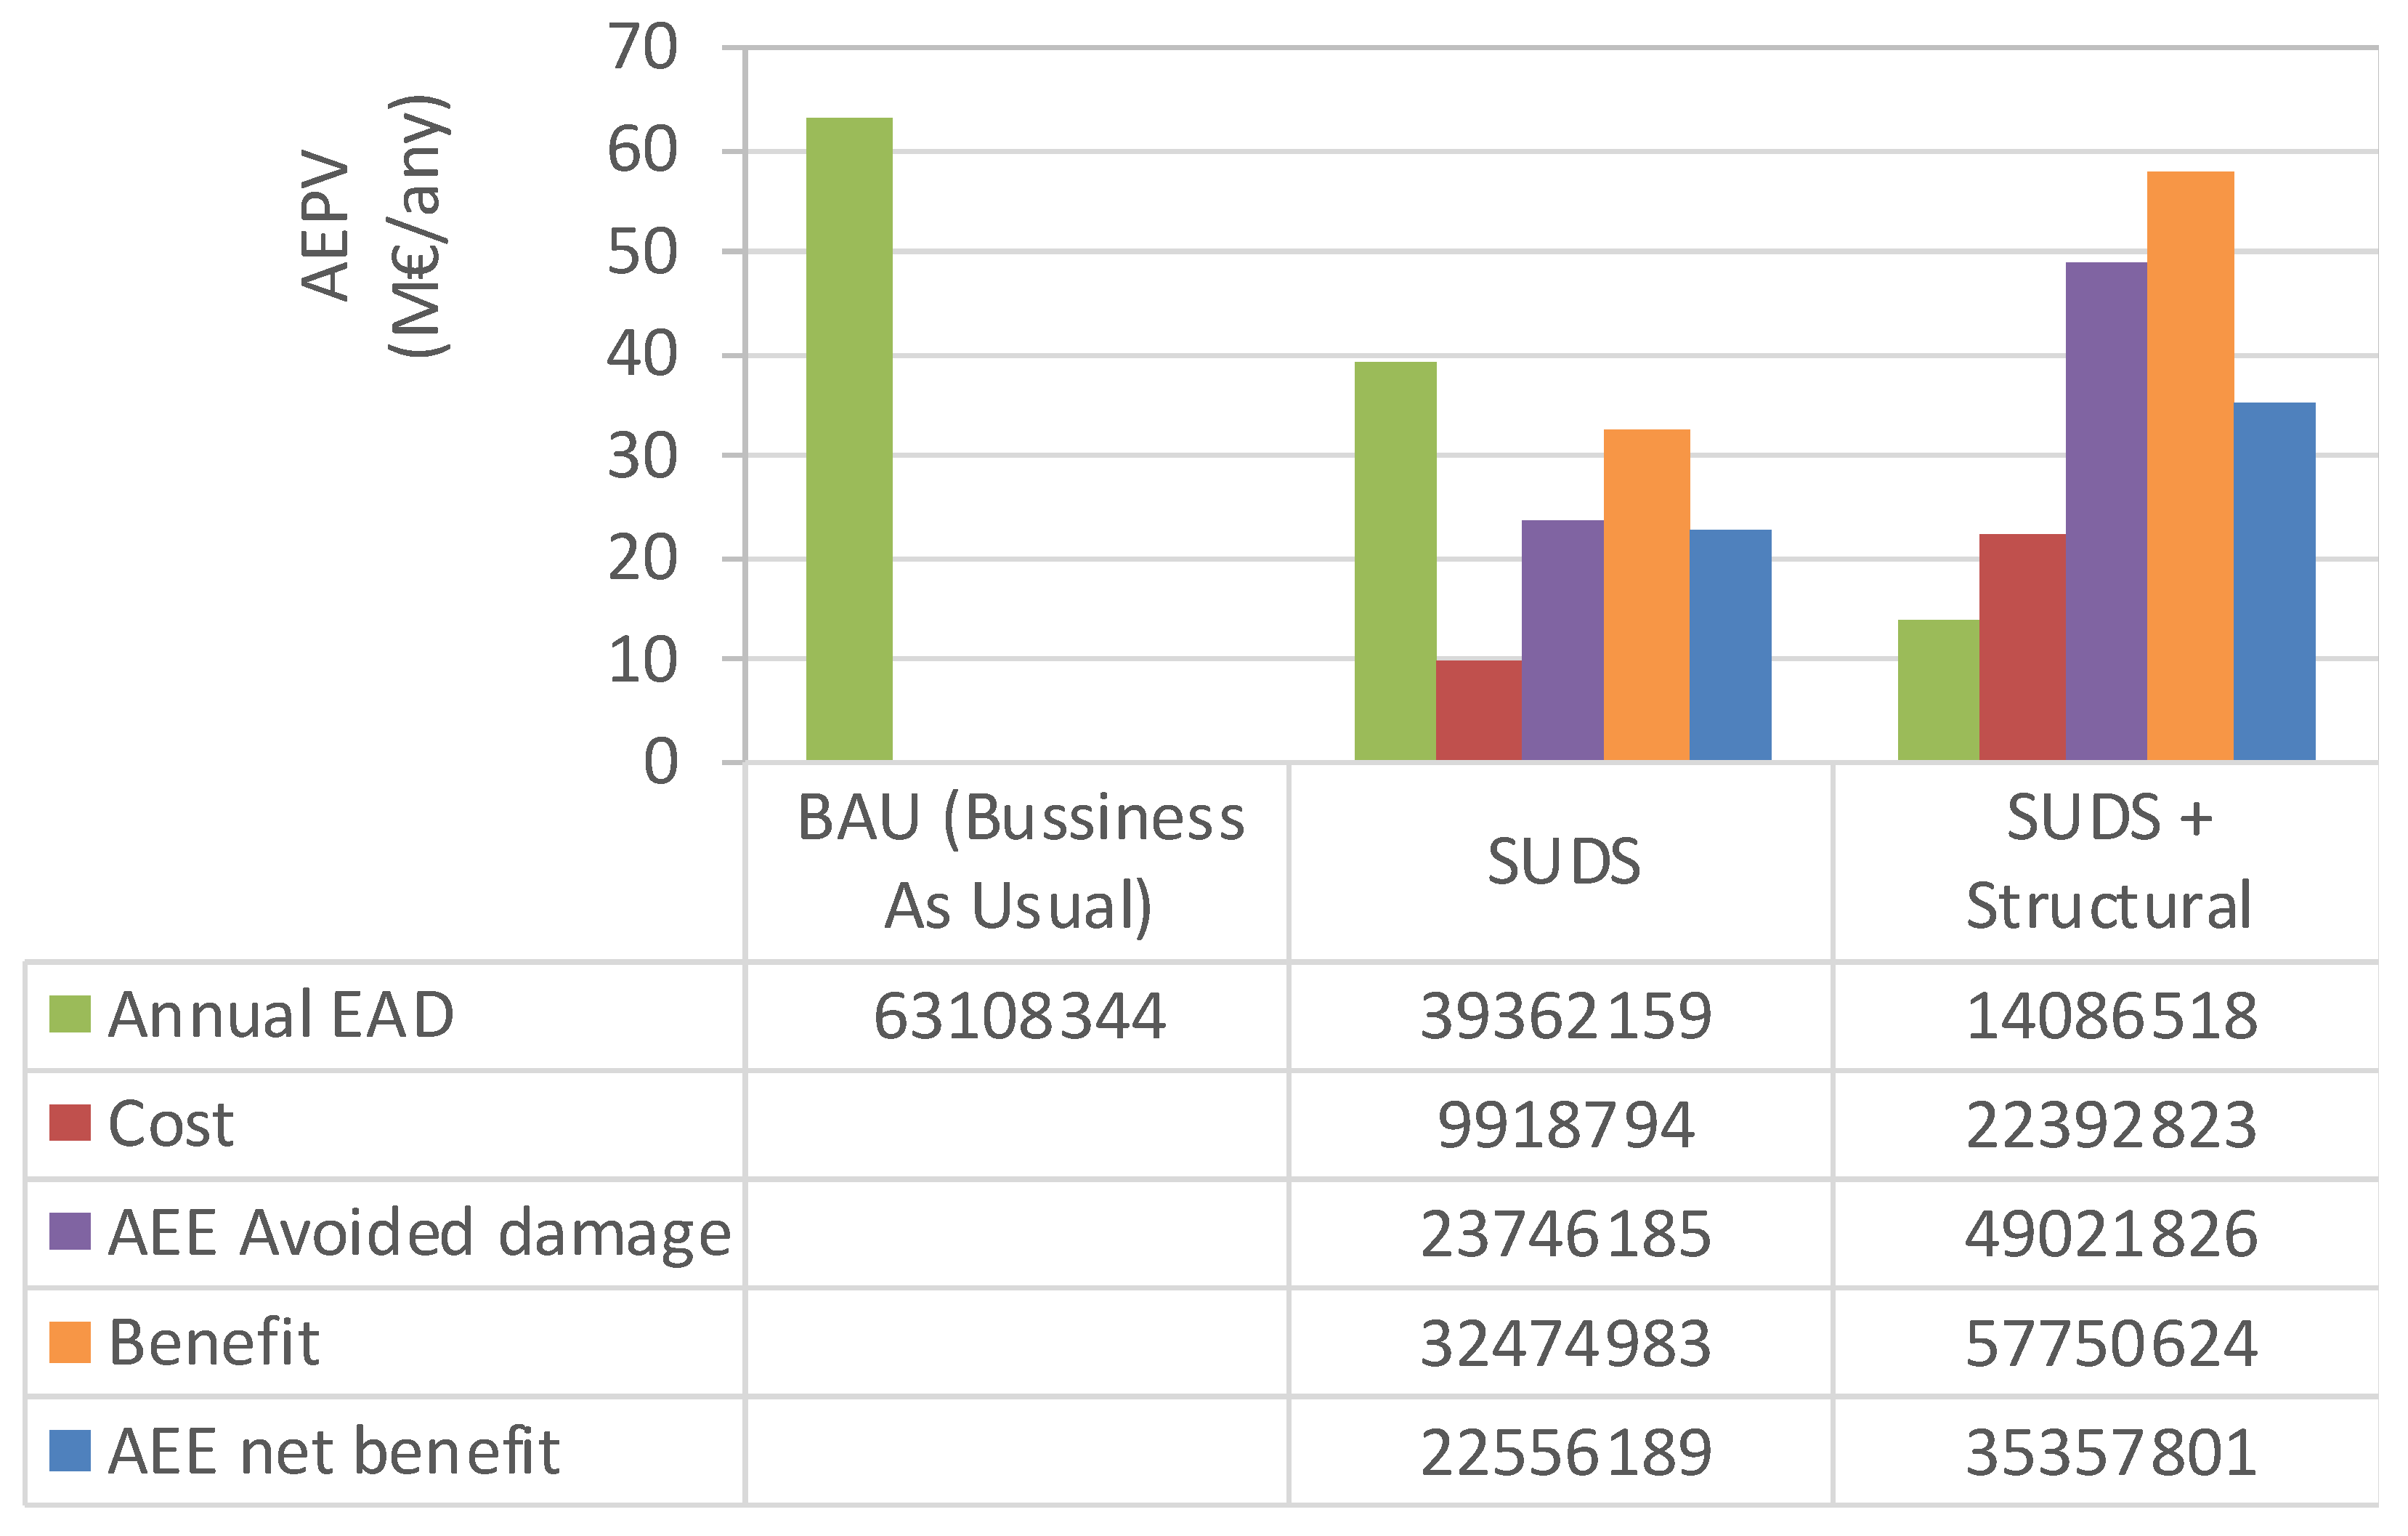
The Figure 14 shows the results of the CBA when flood damage was considered. In the actual scenario (i.e., business as usual (BAU)), the EAD was €63 million. After applying the SUDS plan, the EAD was reduced to € 39 million, with a cost of €10 million and a benefit of €22 million.
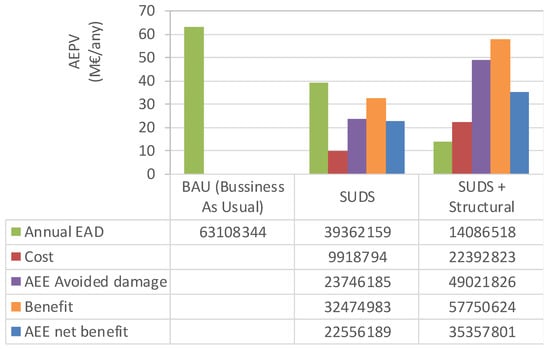
Figure 14.
Results of the CBA of the risk management plan considering only the flood damage. AEE, annual equivalent annuity; AEPV, annual equivalent present value; EAD, expected annual damage.
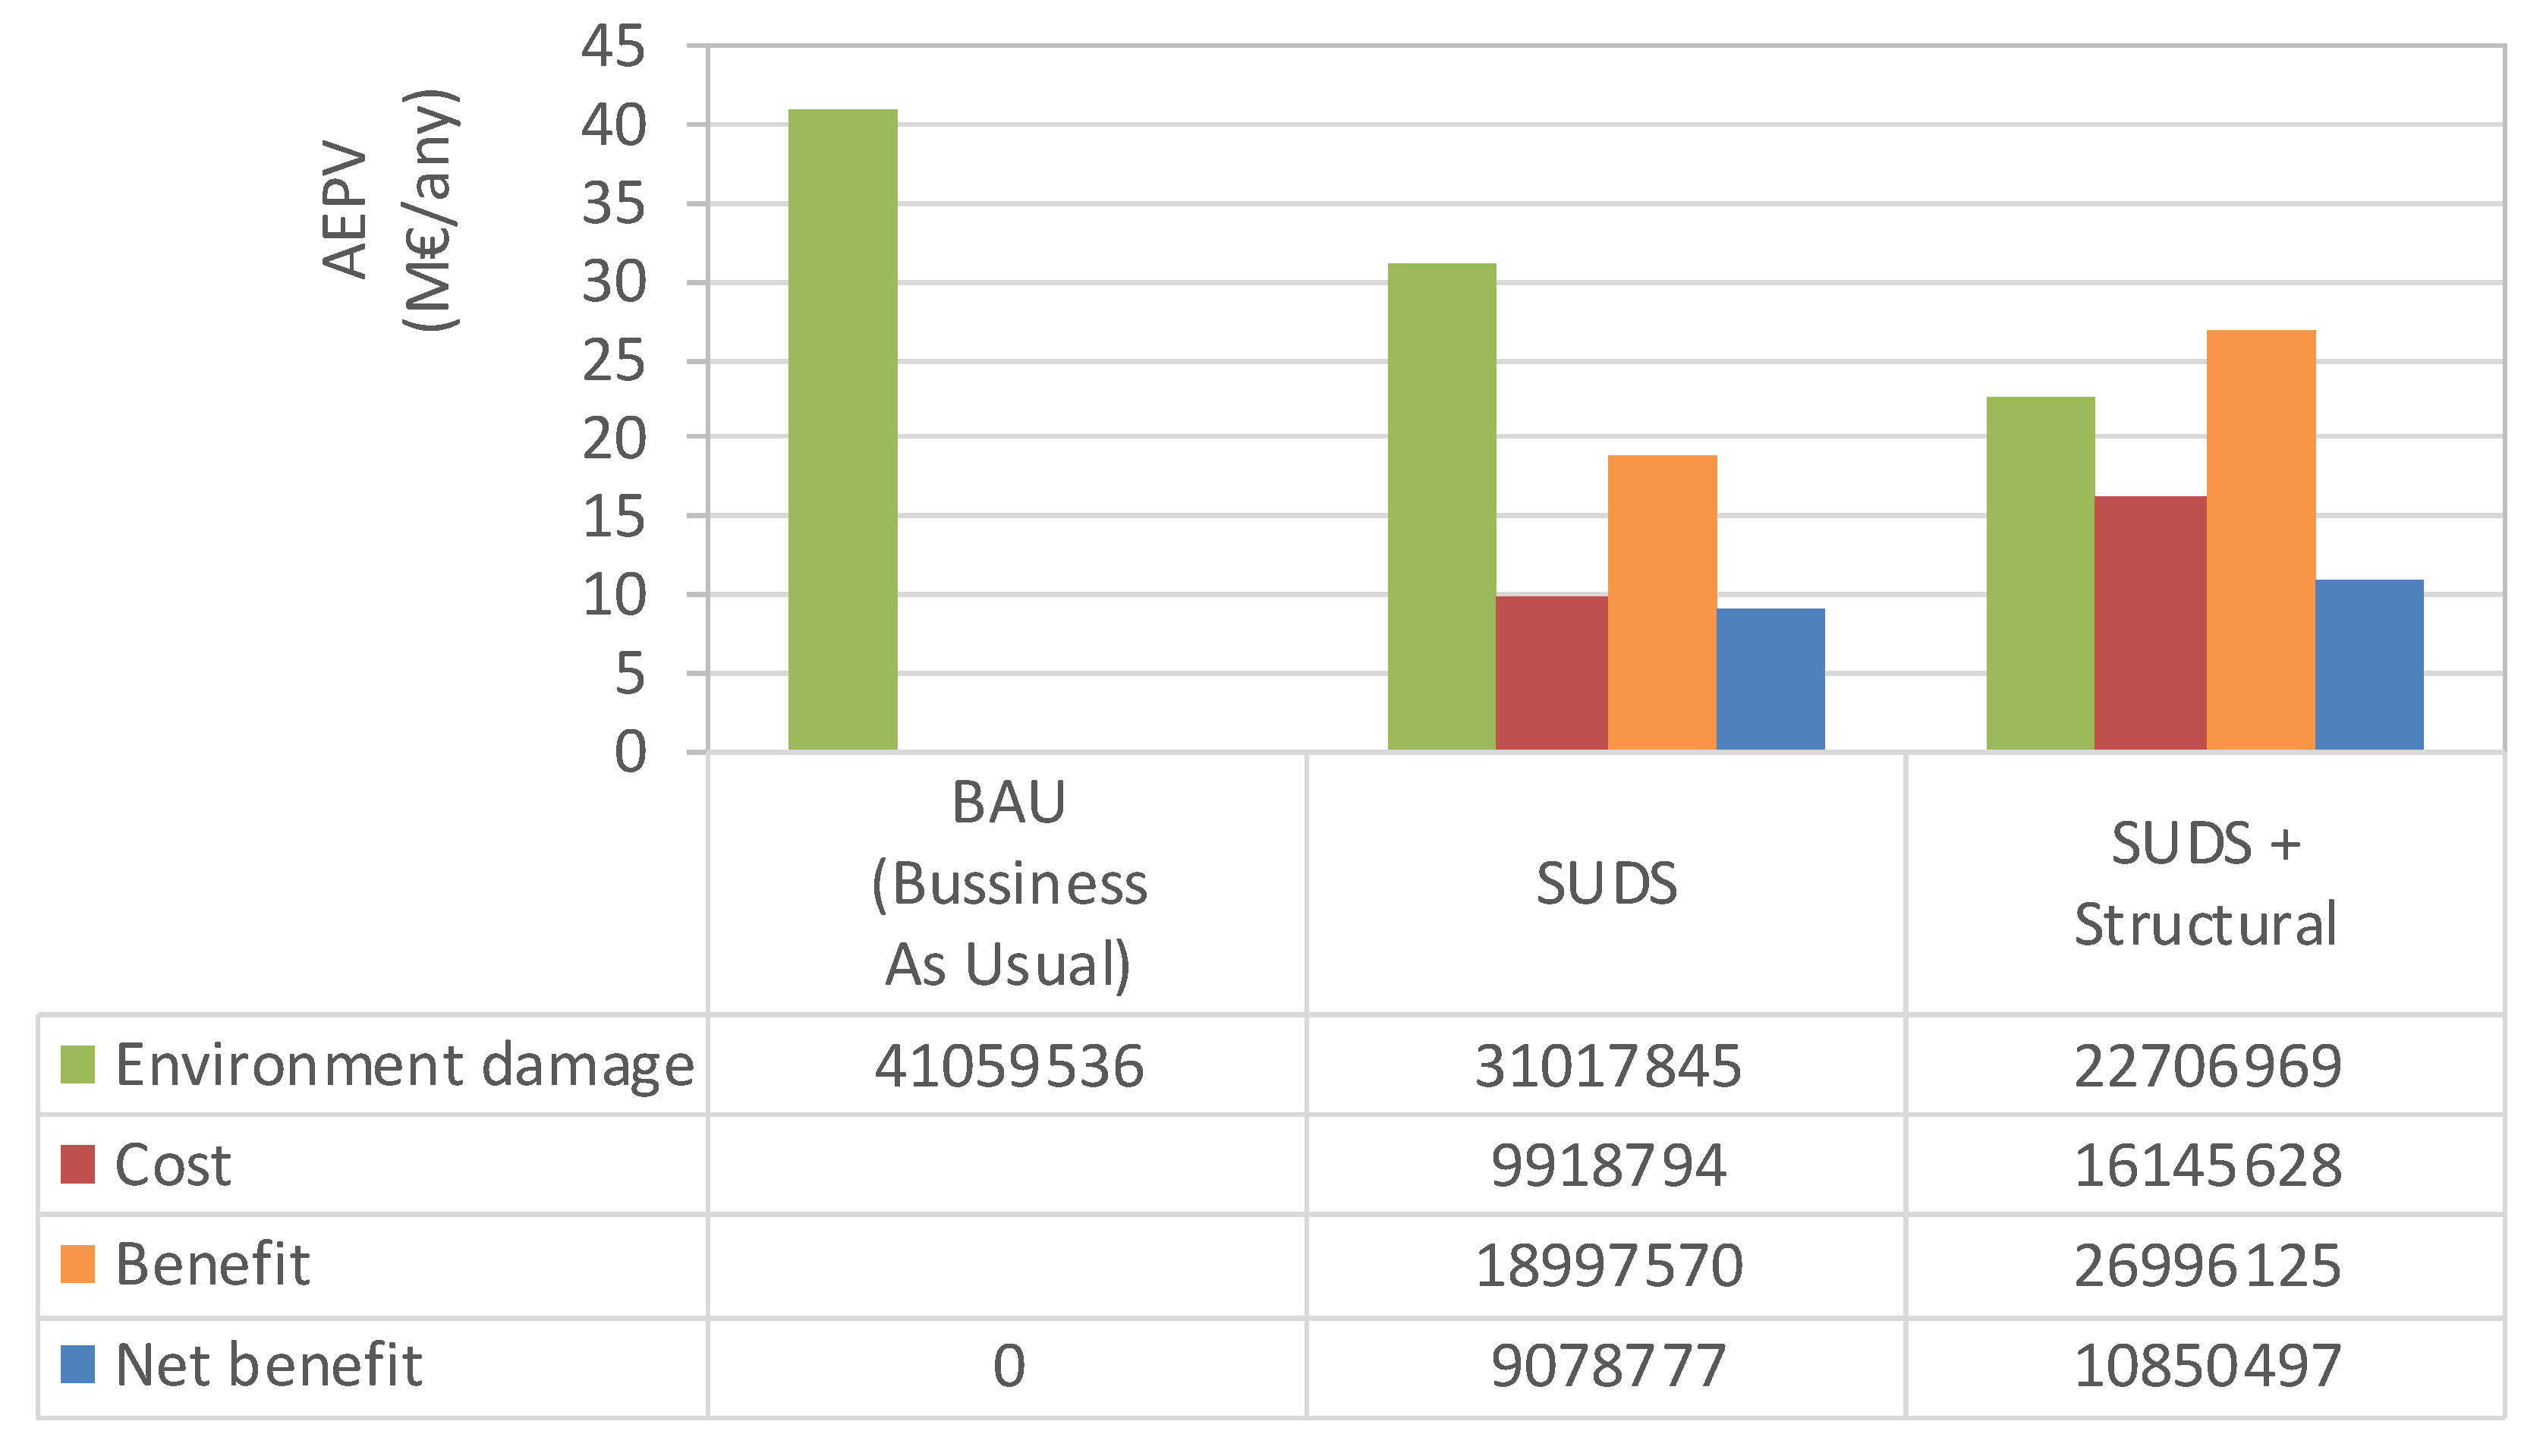
When the structural measures were applied, the EAD reduced to €14 million, but the total cost of the plan rose to €22 million per year. When the environment damage was analyzed for the CSOs, the annual damage was €4 million, and after the SUDS plan, it reduced to €3 million/year, and after the structural measures (first flush tanks), it reduced to €2.2 million. Figure 15 shows these results.
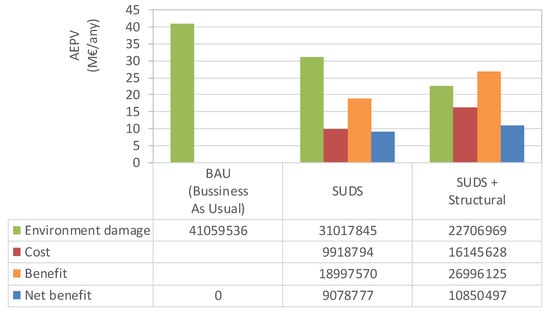
Figure 15.
Results of the CBA of the risk management plan considering only the environmental damage.
The impact of SUDSs on flood and environmental damage were added, and the final results were then then an SUDS implementation cost of €10 million; when adding both benefits, the net benefit was €32 million, which is therefore the most successful measure in the plan. However, to overcome its limitation in terms of impact, structural measures are mandatory.
7. Comparison of PDISBA to the Current Plan
The new urban drainage Master Plan (i.e., the PDISBA) was compared to the current plan in force (PICBA). Table 8 shows the main groups of the flood risk mitigation measures included in both plans. The percentage of difference, computed using the old plan value as a reference, is presented in the third column of the table.

Table 8.
Comparison between the current plan and the new plan.
The SUDS investment could not be directly compared because it is a new element in the budget. In the previous plan requirements, there were no references to sustainable drainage, being one of the main differences between the plans regarding the structural measures. In contrast, a SUDS is a system to reduce the direct runoff of the precipitation, hence it is linked to the impact of floods and climate change. Therefore, its budget was included in the comparison of costs.
A similar situation occurred for the network rehabilitation plan, which was recently finished in the framework of the new plan. Extending the life cycle of infrastructures is a requirement of the new plan. Hence, there is no direct comparison with the previous plan, but in this case, it is an element not related to floods. The budget devoted to rehabilitation is high, because network diagnosis revealed a poor maintenance condition.
The investment of the first CSO flush tanks is similar in both plans, and it is mainly related to environmental issues, not to climate change or floods. The physical locations of the tanks, around the shoreline, reduce its impact on flood management; hence, climate change and CSOs are decoupled from a measures point of view.
Moreover, the secondary network investment budget is quite similar in both plans and is not related to climate change because it is mainly allocated to the development of new urban areas. The difference observed in the new conduits value is justified because some of the measures proposed in the old plan have already been constructed during this period of the new plan. In case of storm tanks, the PICBA plan considers more than 50 tanks, and just 20% of them have been constructed. Storm tanks have a direct impact on flood control, and hence they should be added to the final comparison.
The total budget, including all the measures (environmental, floods, and operation) was €714 million for old plan (PICBA) and €1424 million for the new plan (PDISBA), but these values could not be ascribed to climate change impacts, as described previously. Therefore, these values should be filtered.
Considering all of the previous assumptions, the calculation used to compare the budget to address the impact of climate change-related floods was SUDSs + Hyd. Est. + conduits + storm tanks. The total budget for the old plan (PICBA) was €295 million and €730 million for the new plan (PDISBA), with the difference between both plans being €435 million. This difference is mainly related to the construction of the storm tanks, with and investment increment of €245 million. The second part of the difference is a result of the SUDSs receiving an investment higher than €150 million.
Therefore, it can be concluded that under the new rainfall scenario, including climate change, the new flood management measures total cost is 147% higher than the old one.
8. Conclusions
Climate change has an important impact in urban drainage master plan budgeting. Previous plans become outdated due to the evolution in the rainfall scenarios. If the return period is used in the design criteria, updating the rainfall scenarios involves adding extra structural measures to the previous plans.
Barcelona City Council developed its Integral Drainage Master Plan (PDISBA), within which, it included the definition of new rainfall events linked to the RCP 8.5 climate change scenario. The total cost of the proposed measures reached €1.4 billion. In order to justify this investment, a CBA was performed.
To analyze the impact of the measures, an 80-year period was considered. The duration of the implementation of the structural measures was 20 years. Due to the different time spans of the infrastructures, an equivalent annual annuity was used. Two measure groups were proposed, the first included SUDS implementation and the second included storm tanks, first flush tanks, and conduits other than the SUDSs. Hence, the second scenario was the second step after the development of the first scenario, both being sequential.
Regarding the impact, floods and environmental losses were included in order to quantify the impact of floods is the EAD. To achieve this value, it was necessary to compute different return periods. The residual risk related to both measure scenarios was used to reevaluate the EAD and to compute the benefits. The annual benefit of the first group of measures was €32 million/year for floods and €19 million/year for environment losses. Regarding the second group of measures, including structures, the net benefit of floods rose to €57 million/year and for environmental losses, it increased to €26 million/year. Thus, the total cost of the first measure scenario was €10 million/year and for the second measure scenario, it was €22 million/year.
Comparing the new and old plans, the budget devoted to floods has increased by 150%, from €295 million to €730 million. The rainfall scenario triggered the increase, its main differences being the peak intensity due to climate change and the total duration.
Author Contributions
Conceptualization, A.O. and V.M.; methodology, O.E., B.R. and M.J.V.; software, O.E. and M.J.V.; validation, V.M. and A.O.; investigation, B.R. and M.J.V.; writing—original draft preparation, V.M.; writing—review and editing, V.M.; visualization, O.E., M.J.V. and A.O.; supervision, V.M.; project administration, A.O.; funding acquisition, A.O. All authors have read and agreed to the published version of the manuscript.
Funding
This research was funded by the Barcelona City Council, contract number E18-0185.
Informed Consent Statement
Not applicable.
Data Availability Statement
Data available on request due to restrictions.
Conflicts of Interest
The authors declare no conflict of interest.
References
- United Nations. World Urbanization Prospects: The 2018 Revision; United Nations Publications: New York, NY, USA, 2019. [Google Scholar]
- Velasco, M.; Russo, B.; Cabello, À.; Termes, M.; Sunyer, D.; Malgrat, P. Assessment of the effectiveness of structural and nonstructural measures to cope with global change impacts in Barcelona. J. Flood Risk Manag. 2018, 11, S55–S68. [Google Scholar] [CrossRef]
- Adger, W.N.; Barnett, J.; Brown, K.; Marshall, N.; O’Brien, K. Cultural dimensions of climate change impacts and adaptation. Nat. Clim. Chang. 2013, 3, 112–117. [Google Scholar] [CrossRef]
- Karl, T.R.; Melillo, J.M.; Peterson, T.C.; Hassol, S.J. (Eds.) Global Climate Change Impacts in The United States; Cambridge University Press: Cambridge, UK; New York, NY, USA, 2009. [Google Scholar]
- Parry, M.; Parry, M.L.; Canziani, O.; Palutikof, J.; Van der Linden, P.; Hanson, C. (Eds.) Climate Change 2007-Impacts, Adaptation and Vulnerability: Working Group II Contribution to the Fourth Assessment Report of the IPCC; Cambridge University Press: Cambridge, UK; New York, NY, USA, 2007; Volume 4. [Google Scholar]
- Djordjević, S.; Butler, D.; Gourbesville, P.; Mark, O.; Pasche, E. New policies to deal with climate change and other drivers impacting on resilience to flooding in urban areas: The CORFU approach. Environ. Sci. Policy 2011, 14, 864–873. [Google Scholar] [CrossRef]
- Willems, P.; Arnbjerg-Nielsen, K.; Olsson, J.A.; Nguyen, V. Climate change impact assessment on urban rainfall extremes and urban drainage: Methods and shortcomings. Atmos. Res. 2011, 103, 106–118. [Google Scholar] [CrossRef]
- Zhou, Q. A review of sustainable urban drainage systems considering the climate change and urbanization impacts. Water 2014, 6, 976–992. [Google Scholar] [CrossRef]
- Yazdanfar, Z.; Sharma, A.K. Urban drainage system planning and design—Challenges with climate change and urbanization: A review. Water Sci. Technol. 2015, 72, 165–179. [Google Scholar] [CrossRef]
- Dawson, R.J.; Speight, L.J.; Hall, J.W.; Djordjevic, S.; Savic, D.; Leandro, J. Attribution of flood risk in urban areas. J. Hydroinform. 2008, 10, 275–288. [Google Scholar] [CrossRef]
- Morita, M. Quantification of increased flood risk due to global climate change for urban river management planning. Water Sci. Technol. 2011, 63, 2967–2974. [Google Scholar] [CrossRef]
- Zhou, Q.; Mikkelsen, P.S.; Halsnæs, K.; Arnbjerg-Nielsen, K. Framework for economic pluvial flood risk assessment considering climate change effects and adaptation benefits. J. Hydrol. 2012, 414, 539–549. [Google Scholar] [CrossRef]
- Merz, B.; Elmer, F.; Thieken, A.H. Significance of “high probability/low damage” versus “low probability/high damage” flood events. Nat. Hazards Earth Syst. Sci. 2009, 9, 1033–1046. [Google Scholar] [CrossRef]
- Pearce, D.; Atkinson, G.; Mourato, S. Cost-Benefit Analysis and the Environment: Recent Developments; Organisation for Economic Co-Operation and Development: Paris, France, 2006. [Google Scholar]
- Mailhot, A.; Duchesne, S. Design criteria of urban drainage infrastructures under climate change. J. Water Resour. Plan. Manag. 2010, 136, 201–208. [Google Scholar] [CrossRef]
- Wilby, R.; Keenan, R. Adapting to flood risk under climate change. Prog. Phys. Geogr. Earth Environ. 2012, 36, 348–378. [Google Scholar] [CrossRef]
- Bowering, E.A.; Peck, A.M.; Simonovic, S.P. A flood risk assessment to municipal infrastructure due to changing climate part I: Methodology. Urban Water J. 2014, 11, 20–30. [Google Scholar] [CrossRef]
- Zhou, Q.; Leng, G.; Su, J.; Ren, Y. Comparison of urbanization and climate change impacts on urban flood volumes: Importance of urban planning and drainage adaptation. Sci. Total Environ. 2019, 658, 24–33. [Google Scholar] [CrossRef] [PubMed]
- Velasco, M.; Cabello, À.; Russo, B. Flood damage assessment in urban areas. Application to the Raval district of Barcelona using synthetic depth damage curves. Urban Water J. 2016, 13, 426–440. [Google Scholar] [CrossRef]
- Mirhosseini, G.; Srivastava, P.; Stefanova, L. The impact of climate change on rainfall intensity–duration–frequency (IDF) curves in Alabama. Reg. Environ. Chang. 2013, 13, 25–33. [Google Scholar] [CrossRef]
- Rodríguez, R.; Navarro, X.; Casas-Castillo, M.C.; Ribalaygua, J.; Russo, B.; Pouget, L.; Redaño, A. Influence of climate change on IDF curves for the metropolitan area of Barcelona (Spain). Int. J. Clim. 2014, 34, 643–654. [Google Scholar] [CrossRef]
- Chow, V.; Maidment, D.; Mays, L. Applied Hydrology; McGraw-Hill Book Company: New York, NY, USA, 2008. [Google Scholar]
- U.S. Department of Agriculture Soil Conservation Service. A Method for Estimating Volume and Rate of Runoff in Small Watersheds. SCS-TP-149; U.S. Department of Agriculture Soil Conservation Service: Washington, DC, USA, 1973.
- Raso, J.; Malgrat, P.; Castillo, F. Improvement in the selection of design storms for the New Master Drainage Plan of Barcelona. Water Sci. Technol. 1995, 32, 217–224. [Google Scholar] [CrossRef]
- EPA. Combined Sewer Overflows Guidance for Monitoring and Modeling; Office of Wastewater Management, U.S. Environmental Protection Agency: Washington, DC, USA, 1999; p. 20460.
- IPCC. Summary for policymakers. In Climate Change 2013: The Physical Science Basis. Contribution of Working Group I to the Fifth Assessment Report of the Intergovernmental Panel on Climate Change; Stocker, T.F., Qin, D., Plattner, G.K., Tignor, M., Allen, S.K., Boschung, J., Nauels, A., Xia, Y., Bex, V., Midgley, P.M., Eds.; Cambridge University Press: Cambridge, UK; New York, NY, USA, 2013. [Google Scholar]
- Pérez, F.F.; Boscolo, R. Clima en España: Pasado, presente y futuro. Informe de Evaluación del Cambio Climático Regional; CLIVAR: Ministerio de Medio Ambiente y Medio Rural y Marino Ministerio de Ciencia e Innovacion (MICINN), ENERO: Madrid, Spain, 2010; p. 83. (In Spanish)
- Agencia Estatal de Meteorología (AEMET); Fundación Biodiversidad, Oficina Española de Cambio Climático. Cambio Climático: Bases Físicas, Guía Resumida Del Quinto Informe De Evaluación Del Ipcc Grupo De Trabajo I.; Ministerio de Agricultura Alimentación y Medio Ambiente: Madrid, Spain, 2013.
- Christensen, O.B.; Christensen, J.H. Intensification of extreme European summer precipitation in a warmer climate. Glob. Planet. Chang. 2004, 44, 107–117. [Google Scholar] [CrossRef]
- Lehner, B.; Döll, P.; Alcamo, J.; Henrichs, T.; Kaspar, F. Estimating the impact of global change on flood and drought risks in Europe: A continental, integrated analysis. Clim. Chang. 2006, 75, 273–299. [Google Scholar] [CrossRef]
- Arnbjerg-Nielsen, K. Quantification of climate change impacts on extreme precipitation used for design of sewer systems. In Proceedings of the 11th International Conference on Urban Drainage, Edinburgh, UK, 31 August–5 September 2008. [Google Scholar]
- Arnbjerg-Nielsen, K. Quantification of climate change effects on extreme precipitation used for high resolution hydrologic design. Urban Water J. 2012, 9, 57–65. [Google Scholar] [CrossRef]
- Solomon, S.; Qin, D.; Manning, M.; Chen, Z.; Marquis, M.; Averyt, K.B.; Tignor, M.; Miller, H.L. (Eds.) Climate Change 2007: The Physical Science Basis. Contribution of Working Group I to the Fourth Assessment Report of the Intergovernmental Panel on Climate Change; Cambridge University Press: Cambridge, UK; New York, NY, USA, 2007. [Google Scholar]
- Monjo, R.; Pórtoles, J.; Gaitán, E.; Redolat, D.; Paradinas, C.; Prado, C.; Torres, L.; Ribalaygua, J.; Russo, B.; Velasco, M. Final Climate Scenarios Report. Deliverable 1.2 RESCCUE Project. 2017. Available online: http://www.resccue.eu/sites/default/files/resccue_d1.2_climate_scenarios.pdf (accessed on 15 December 2020).
- Lastra, A.; González, P.; Russo, B.; Redaño, A.; Ribalaygua, J. Efectos del cambio climático sobre las precipitaciones extremas en la comunidad de Madrid. In Proceedings of the 23rd Jornadas Técnicas de AEAS, Burgos, Spain, 28–30 April 2015. [Google Scholar]
- Ribalaygua, J.; Torres, L.; Pórtoles, J.; Monjo, R.; Gaitán, E.; Pino, M.R. Description and validation of a two-step analogue/regression downscaling method. Theor. Appl. Clim. 2013, 114, 253–269. [Google Scholar] [CrossRef]
- Monjo, R.; Paradinas, C.; Gaitán, E.; Redolat, D.; Paradinas, C.; Prado, C.; Portolés, J.; Torres, L.; Ribalaygua, J.; Russo, B.; et al. Report on Extreme Events Predictions. Deliverable 1.3 RESCCUE Project. 2018. Available online: https://www.ficlima.org/intercambio/indexed/RESCCUE/Deliverables_WP1/RESCCUE_D1.3_Extreme_Events_Predictions.pdf (accessed on 15 December 2020).
- Russo, B. Multi-hazards Assessment Related to Water Cycle Extreme Events for Future Scenarios—Business as Usual. Deliverable 2.3; RESCCUE EU H2020 Project. 2019. Available online: http://www.resccue.eu/ (accessed on 15 December 2020).
- Leandro, J.; Chen, A.S.; Djordjević, S.; Savić, D.A. Comparison of 1D/1D and 1D/2D coupled (Sewer/Surface) hydraulic models for urban flood simulation. J. Hydraul. Eng. 2009, 135, 495–504. [Google Scholar] [CrossRef]
- Vojinovic, Z.; Tutulic, D. On the use of 1D and coupled 1D-2D modelling approaches for assessment of flood damage in urban areas. Urban Water J. 2009, 6, 183–199. [Google Scholar] [CrossRef]
- Akerman, P.B. Modelización hidráulica del passeig de gràcia mediante infoworks icm para la optimización de la disposición de imbornales. In Proceedings of the 4th Jornadas De Ingeniería Del Agua, JIA, Cordoba, Spain, 21–22 October 2015. (In Spanish). [Google Scholar]
- Chiabai, A.; Hunt, A.; Galarraga, I.; Lago, M.; Rouillard, J.; de Murieta, E.S.; Tepes, A.; Troeltzsch, J.; Watkiss, P. Using Cost and Benefits to Assess Adaptation Options. Deliverable 3.1A. conAdapt. 2015. Available online: https://www.ecologic.eu/sites/files/publication/2016/2728-d-3-1-using-cost-and-benefits-to-assess-adaptation-options.pdf (accessed on 15 December 2020).
- USACE. Expected Annual Flood Damage Computation, Users Manual, CPD-30 US Army Corps of Engineers Hydrologic Engineering Center. March 1989. [Google Scholar]
Publisher’s Note: MDPI stays neutral with regard to jurisdictional claims in published maps and institutional affiliations. |
© 2020 by the authors. Licensee MDPI, Basel, Switzerland. This article is an open access article distributed under the terms and conditions of the Creative Commons Attribution (CC BY) license (http://creativecommons.org/licenses/by/4.0/).

