Article

Assessing the Greenhouse Gas Impact of a Renewable Energy Feed-in Tariff Policy in Mozambique: Towards NDC Ambition and Recommendations to Effectively Measure, Report, and Verify Its Implementation

by
Emília Inês Come Zebra
1,2,*,
Gilberto Mahumane
2,
Federico Antonio Canu
3 and
Ana Cardoso
3
1
Energy and Sustainability Research Institute Groningen, Faculty of Science and Engineering, University of Groningen, 9747 AG Groningen, The Netherlands
2
Department of Physics, Eduardo Mondlane University, Maputo CP. 257, Mozambique
3
UNEP DTU Partnership, Department of Technology, Management, and Economics, Technical University of Denmark, 2100 Copenhagen, Denmark
*
Author to whom correspondence should be addressed.
Sustainability 2021, 13(10), 5376; https://doi.org/10.3390/su13105376
Submission received: 4 March 2021 / Revised: 23 April 2021 / Accepted: 6 May 2021 / Published: 11 May 2021

Abstract

:
Parties to the Paris Agreement (PA) have agreed on the goal of limiting the increase in global average temperature to well below 2 °C and are pursuing efforts to limit warming to 1.5 °C. Countries’ nationally determined contributions (NDCs) comprise the main framework used to achieve this. In this context, Mozambique′s NDC includes, amongst other actions, increased renewable energy (RE) generation. This article presents the results of the assessment of greenhouse gas (GHG) impacts of the Renewable Energy Feed-in Tariff (REFIT), using the Long-range Energy Alternatives Planning (LEAP) system model, in order to determine its potential contribution to Mozambique′s NDC’s goals and RE targets. Results from this study show that the REFIT regulation can be expected to contribute to reducing 0.34 MtCO2eq (0.6% of the NDC target for the electricity sector) by 2030, compared to a business-as-usual (BAU) scenario. However, the NDC ambition could be enhanced through the REFIT and contribute to reducing 2.54 MtCO2eq (4.3% of the NDC target for the electricity sector) by 2030. The article further discusses the requirements for a robust measuring, reporting, and verification (MRV) system for climate policies, using REFIT as a case study, to facilitate effective tracking of NDC progress and achievement and transparent reporting to the United Nations Framework Convention on Climate Change (UNFCCC).

1. Introduction

Mozambique ranks as the country with the largest power generation potential in the southern African region. Hydropower dominates the country’s electricity market and accounts for 81% of the total electricity generated [1]. Technically feasible hydropower potential is estimated at 19,000 MW, of which 2075 MW correspond to the total installed capacity at the Cahora Bassa Dam. The country only exploits about 500 MW of the total capacity [1]. Other sources include coal, gas, wind, and solar photovoltaic (PV) energy. Most of the hydropower is exported to the neighboring countries of South Africa, Zimbabwe, and Botswana [1]. This clearly highlights the importance of the electricity sector, especially as one of the main contributors to the country’s economic development. Even though Mozambique has a large production potential, its power sector faces other key challenges, highlighted by the World Bank in a policy note in 2015: (i) the lack of reliable and efficient electricity supply; (ii) the expansion of generation and transmission to meet future energy demand; and (iii) the provision of electricity to the vast majority of the growing population [2,3]. Demand growth has been mostly driven by the commercial and industrial sectors. Historically, demand growth has been increasing and seems to have reached a peak in 2014, at 831 MW, but it is expected to continue growing [1,3,4]. Figure 1 shows statistics from the International Energy Agency (IEA) on how the energy sector has evolved from 1990 to 2018 [4]. As can be seen, the energy matrix is composed of natural gas, oil, biofuels, hydro, and finally coal, represented by the light blue color on the chart. The figure shows that the power sector is dominated by fossil fuel and highlights biofuels and waste as the dominant source of energy. However, there is not much waste used as an energy source in Mozambique and the bulky portion for biofuels illustrated in Figure 1 in fact represents biomass in the form of firewood and charcoal.
In order to address the above-mentioned challenges and decarbonize the energy sector, the country has seen a growing mix of renewable energy technologies [1]. To expedite the energy diversification and thus achieve environmental responsibility, the country approved the Renewable Energy Feed-in Tariff (REFIT) in 2014. Its primary objective is to promote and guarantee the diversification of the national energy matrix and the safe supply of electricity and ensure energy security at the national level by gradually replacing fossil fuel energy sources that rely on fuel imports. In addition, the country has recently (December 2018) approved the second set of National Determined Contributions (NDCs) [5] and its operational plan. The NDCs comprise the main framework used to achieve the shorter-term emissions reductions needed to realize the long term objective of the Paris Agreement (PA), namely constraining global warming at 1.5 to 2 °C above pre-industrial levels. They incorporate the efforts of each country to limit emissions and to respond to the impacts of climate change [6,7,8,9]. Implementing and regularly revising and raising the ambitions for NDCs at five-year intervals is the key to reaching the PA’s goals [10]. For Mozambique, the NDCs describe how the country intends to contribute to the objective of the PA by reducing 31.9 MtCO2eq of greenhouse gas (GHG) emissions by 2025, of which 30 MtCO2eq will be reduced or sequestrated in the forest and land-use sector and a reduction of 1.90 MtCO2eq is envisioned through measures in the waste and energy sectors [5]. The energy sector has been identified as one of the priority sectors for mitigation of GHG emissions in the NDC due to its high share of national emissions and the potential for emission reduction through the implementation of alternative energy policies.
The PA (Article 13) foresees the Enhanced Transparency Framework (ETF) as one of the pillars for building mutual trust and confidence among parties [6] and thereby promoting effective implementation and enhancing climate ambitions. According to the Modalities, Procedures, and Guidelines (MPGs) for Article 13 of the PA [11], countries must report, amongst other aspects, information on actions, policies, and measures that support the implementation and achievement of their NDCs. As such, accounting for every single effort leading to GHG emissions reductions is crucial and such efforts need to be monitored and reported [12,13].
The REFIT regulation, although still not operational, is a renewable energy (RE) policy instrument with the potential of providing substantial GHG reductions as compared to a business-as-usual (BAU) scenario [14]. However, a GHG impact assessment of the implementation of the REFIT is needed to quantify its real potential mitigation and contributions to the NDC target in order to support decision-making towards an effective energy transition.
This paper presents an assessment of the GHG impact of the Mozambican REFIT regulation and details a set of recommendations for tracking and reporting the future implementation of the REFIT regulation in line with the ETF of the PA. The paper’s findings contribute to the growing body of knowledge about the transformation pathways of energy policies and the possible resulting enhancement of NDCs. According to Wang and Chen [15], only a few studies have explored how the NDCs can be enhanced.
The paper is organized as follows: the current section introduces the scope of the study presented in this article; Section 2 presents the background of the REFIT in different countries, including the REFIT regulation in Mozambique; Section 3 explains the materials and methods applied for the assessment. Section 4 presents the results and discussion, including the GHG emission reduction of the REFIT regulation and its impact on the goal of the NDCs, as well as describing the barriers to establishing effective measuring, reporting and verification (MRV) procedures; the conclusions are provided in Section 5.

2. Background

2.1. Brief Overview of Renewable Energy Feed-in Tariff Regulation

Feed-in tariffs are considered to be effective RE policy instruments to attract private investments for the deployment of RE projects [16]. They are gaining increasing attention and have been adopted by many countries as an instrument that obliges the national utility companies to purchase energy produced by independent power producers (IPPs) at a specific preferential price per kWh over a fixed period, providing investors with incentives to participate in the RE subsector by ensuring returns of their investments [17,18]. These tariffs differ in their details and implementation in different countries. In Europe, the UK, Denmark, Germany, and Spain are the first countries that have successfully implemented feed-in tariff (FIT) regulations. This is evident through the increased number of renewable energy developments, despite some challenges in the initial stage [19,20]. Well-advanced renewable systems can also be found in the United States. However, FIT policies have not been widely adopted in North America. This is because other policies, such as renewable portfolio standards, are already in place [20]. In Asia, countries such as South Korea, Japan, China, India, Singapore, Malaysia, Thailand, and Taiwan have embraced the FIT scheme [21]. In Australia, several government bodies have enacted FIT schemes whereby PV energy is prioritized. For instance, the Australian Capital Territory introduced a gross production of PV energy at a FIT of EUR 0.3 per kWh. In Africa, most countries envisage an increase in energy production and diversification. However, the number of grid-connected renewable energy power plants is still relatively low despite several promoting tools that have been put in place such as subsidies, tendering, quotas, and FITs [22]. FITs are regarded as the most important economic instrument driving the adoption of renewable energies [21]. In Africa alone, they have been adopted in more than 50 countries. However, factors such as insufficient levels of FIT rates, unsuitable institutional design, grid infrastructure barriers (such as the unavailability and inflexibility of the grid in terms of integrating or absorbing power generation), lack of acceptance from utilities companies, and obstacles in the implementation have in many cases hindered the successful implementation of FIT and a steady deployment of renewable energy [22,23]. Nevertheless, there has been some progress over the years. For instance, in the southern African region, South Africa adopted and implemented the second REFIT regulatory framework in October 2009. The approval was welcomed by major players in the renewable energy sector. The FIT envisaged a total electricity production of 10 TWh by the year 2013. The sources of electricity included wind, biogas, biomass, landfill gas, small hydro, PV and concentrated solar. The country stipulated a duration of tariffs of 20 years [24]. Table 1 summarizes the FIT scheme for South Africa.
In Algeria, an FIT was instituted in 2004 following a period of power outages in 2003. The target was to diversify the electricity generation by including renewables (wind, waste, hydro, and solar photovoltaic and concentrated solar power). At that time, the country was the first African country to approve and implement an FIT. In 2011, the country declared its ambition of producing up to 20,000 MW of power from renewable sources by 2030 [22]. The tariffs are presented in the form of premiums on the market price. In Kenya, an FIT scheme was introduced in 2008 with the major objective of energy diversification and the aim of sustaining the micro-economy through income and employment generation. The FIT was revised in 2010 for biogas and biomass energies. Overall, it includes wind, biomass, small hydro, biogas, geothermal and solar (PV and CSP) [22,25] energy sources. Table 2 summarizes the FIT scheme in Kenya. Kenya is one of the only countries where data for the impact of an FIT scheme is available [22].
Uganda is another African country with a well-defined FIT scheme. The government approved the FIT scheme in 2007 through the Renewable Energy Policy in order to diversify energy sources and technologies. The overall objective was to increase the use of renewable energy from 4% to 61% by 2017 [22,26]. Table 3 summarizes the FIT for Uganda.

2.2. Renewable Energy Feed-in Tariff Regulation of Mozambique

In Mozambique, the REFIT regulation was approved by Decree no. 58/2014. It is designed as a pricing mechanism to promote the use of the vast untapped RE resources. Its primary objective is to promote and guarantee the diversification of the national energy matrix and the safe supply of electricity—using hydro, solar PV, wind, and biomass mini-grids (up to 10MW)—and to ensure energy security at the national level by gradually replacing fossil fuel energy sources that rely on fuel imports. The regulation intends to achieve this by creating an enabling environment aimed at mobilizing IPPs and their investors into expanding Mozambique’s electricity sector with the admitted RE sources. However, there is no scheduled start date for the implementation of the REFIT regulation. The REFIT is contingent upon the adoption of accompanying regulations, such as the guidelines to connect RE electricity generation to the grid, the guidelines for investors, design of power purchase agreements (PPA), and the legal framework for mini-grids, including technical and environmental standards [27].
The initial caps for the level of procurement were imposed by the Ministry of Energy and Mineral Resources (MIREME): 120 MW for mini-hydro, 60 MW for wind, 50 MW for biomass, and 20 MW for solar PV power plants. Once the caps are reached, the national utility company, EDM, is no longer obligated to sign a PPA at the REFIT price for that particular technology.
The tariffs were designed and estimated taking into account RE policies and strategic goals, such as the creation of a favorable platform for investments in RE, and were differentiated according to project size and type of technology. This was done to ensure that the tariffs adequately cover the investment costs and do not cause excessive burden to EDM and final consumers [27,28]. The tariffs are currently set as shown in Table 4.
Table 4 shows how the tariff decreases with the size in capacity and indicates that solar technologies have the highest tariff. However, due to the advancements in RE technologies (especially solar) and favorable regulatory and policy landscapes, the costs of renewable energy technologies worldwide have declined in recent years and this trend is expected to continue in the future [29,30]. Due to these developments, the tariffs proposed under the REFIT regulation need to be revised to reflect the actual costs of the different technologies.

3. Materials and Methods

The study applied the ICAT Renewable Energy Assessment Guide (ICAT Guide), which is part of the Policy Assessment Guides developed by the Initiative for Climate Action Transparency (ICAT), to guide the estimation of the GHG reduction potential of REFIT [31]. The ICAT Guide describes the process applicable to estimate the GHG emission reduction of REFIT regulation ex ante as compared to what would have occurred in a baseline scenario. This was done to determine the REFIT′s potential contribution to meeting the goals of the NDCs and RE policy targets. The ICAT Guide utilizes the emission trajectory method to estimate the GHG impact of RE policies, which involves developing a trajectory of future emissions from the electricity grid based on the expected future mix of generating technologies. This involves making assumptions about the future electricity mix, which can be done using existing data or through more complex approaches that model the energy sector development in detail. The resulting emission trajectory can be used either as a standalone assessment to determine whether the trajectory is on track to meet a target or in combination with a baseline scenario to determine the emission reductions of the policy [31]. ICAT plays an important role for many developing countries that require support in terms of guides and tools to aid them in assessing the impacts of their climate policies in order to achieve their NDC ambitions and national development goals [32].
The Ministry of Land and Environment (MTA) of Mozambique participated in an initial phase of ICAT support and utilized the ICAT Guide together with the Long-range Energy Alternatives Planning (LEAP) model to perform an ex ante assessment of the GHG emission potential of the REFIT policy. The ICAT Guide does not provide a specific tool to model and perform the actual calculations of emission reductions and leaves the choice of tools to the users. The LEAP model was selected for this study to calculate the GHG emission reductions of the REFIT and model energy and emission scenarios [33,34,35]. This assessment can be used to inform policy and decision-makers about the climate impact potential of the REFIT policy and obtain increased support for the steps needed to enable its operationalization.
The positive results of the ICAT phase I prompted further application of support through a second phase of ICAT, expected to run in 2021, which will be crucial for the preparation of the country’s Biannual Transparency Report in 2024, as required by the PA ETF. The second phase of ICAT support involves strengthening the unfavorable institutional policy related to climate transparency and MRV, which will enhance the country’s capacity to assess and reach the ambitions set out in its NDC [33]. The method was also employed by Behren et al. in a study that aimed at accessing the social impact of an FIT in Portugal [14]. The authors employed a “hybrid-economic input-output model” where the historical energy policy characterized, by subsidies and expansion of renewables, was compared to a baseline do-nothing scenario. The results revealed that the implementation of the FIT resulted in a reduction of GHG emissions of about 7.2 MtCO2eq, accompanied by the creation of about 160,000 jobs a year [14]. Similarly, Qi, Zhang, and Karplus applied the ICAT guides and LEAP model to assess the CO2 emissions of renewable energy development in China. The results revealed a reduction of about 1.8% in cumulative emissions as compared to a no-policy baseline scenario for the period 2010–2020 [36]. In addition, international organizations, such as the World Resources Institute (WRI), also provide an overall international standard for estimating and reporting the change in GHG emissions and removals resulting from policies and actions [37,38]. Related to the ICAT methodology adopted in this study is the third step, in which an ex ante assessment is recommended. Figure 2 shows for a summary of the WRI recommended steps for the guidelines on GHG impact estimation.
In addition, consultation meetings were organized with representatives and experts from the energy sector and the MTA, which is inter alia responsible for reporting progress on mitigation actions to the UNFCCC, in order to assess the potential effectiveness of the implementation of the REFIT regulation and identify MRV barriers.

3.1. LEAP Model

LEAP is a tool developed by the Stockholm Environment Institute that has been extensively adopted by different countries to assess mitigation options, especially in the developing world. It is an integrated modeling tool that supports a wide range of different modeling methodologies. Its accounting framework calculates future energy demand as the product of activity levels (for instance, GDP, population, physical production levels, economic development, technology, and price) and energy intensity per unit of activity [34,35]. The LEAP model was selected to ensure consistency with the NDC baseline and mitigation scenarios and with other scenarios from studies about Mozambique which have applied the same tool in their analysis [39,40]. Our application of the model included the historical period 2015–2018, for which the model was run to test its ability to replicate known statistical data; subsequently, the model generated scenarios for the period 2019–2030.
Various software tools for the analysis of energy and electricity systems have been described in the literature, each with their own features and limitations. The choice of software is determined by the objectives of the analyses and the type of input data. The LEAP model was selected for the purposes of this study as it has the ability to model long-term scenarios for the energy sector and has the advantage of performing simulation and linear programming, as opposed to other energy tools, such as the HOMER software, which is limited to simulations and optimization for investments and operation decision support [41]. The LEAP model has been applied and described in previous studies. Pham et al. used the model to assess the mitigation potential of selected biomass energy technologies in Vietnam [42]. Other applications can be traced back to 2007, when the LEAP model was used for a study in rural areas of Thailand aimed at analyzing the GHG reduction potential of improved cooking stoves and biogas digesters [43]. In their 2008 publication, Cai et al. used the LEAP model to assess CO2 emission reduction potential for five selected sectors (electricity, iron and steel, cement, pulp and paper, and transport) with high GHG emissions in China [44]. The model was also used in a study by Zhou et al. to evaluate the efficiency of energy schemes and reduced emissions resulting from reduced demand [45]. LEAP modeling capabilities were also explored and used for a scenario-based study that aimed at accessing the impact of several energy policies in Nigeria [46]. An ex ante study was carried out by Lin et al. using a LEAP model to forecast future energy trends and GHG emissions reduction potential. The results of the study revealed a significant reduction in GHG emissions and favorable conditions for the use of clean energy [47]. Huang et al. employed the LEAP model to study and compare the impact of future greenhouse gas emissions and energy supply and demand trends. The authors based their study on several alternative scenarios in terms of energy policies and energy sector evolution [48].
Chhay used the ICAT guidelines and LEAP modeling tool in their study to assess the GHG mitigation potential for renewables beyond Thailand’s NDC. The authors developed and compared three scenarios, namely a BAU scenario, a carbon capture and storage scenario, and a carbon tax scenario, from 2015 to 2050 [49]. The results revealed potential decreases in CO2 emissions and electricity generation, compared to the BAU scenario, of 37.3% and 57.7%, respectively, in 2050 compared to 2015. The high potential for CO2 emissions reduction was realized by the imposition of a carbon tax [49]. In addition, it was found that Thailand would meet its NDCs (20% of GHG reduction) by 2030.
Another scenario-based study was presented by Tian et al. The authors used the LEAP model and an autoregressive integrated moving average (ARIMA) model (an econometric model) to assess energy consumption and CO2 emissions reduction potential. The findings revealed the potential for significant reductions in community energy consumption levels (about 140%) and in CO2 emissions (about 45%) both in the short and long term [50].
The Stockholm Environmental Institute, with the aid of Universidad Nacional Autonoma de Mexico (UNAM), applied the LEAP energy modeling capabilities and ICAT guidelines to develop baseline emissions scenarios for the period from 2009 to 2030 in Mexico. Based on three baseline scenarios and mitigation options, the results of the study revealed a significant potential to reduce GHG emissions in both the energy and non-energy sectors in Mexico. The application of the mitigation measures is expected to result in reductions of about 180 MtCO2e in 2020 and 449 MCO2e in 2030. These amount to abatements of about 19 and 38% compared to the baseline scenario [51]. LEAP modeling has also been used in Ireland to assess the ex-ante GHG emission mitigation potential of various measures for the period from 2021 to 2030. The results revealed a potential reduction of about 2 MtCO2eq from electric vehicles and 0.8 MtCO2eq from residential retrofitting [52].

3.1.1. Baseline Scenario

The baseline scenario was based on the same dataset as the one developed for Mozambique’s NDC implementation plan and was generated using the LEAP software for the sectors of agriculture, forestry, energy, and transportation. The scenario was mainly built based on data from the National Energy Statistics (2000–2011) [53] combined with the most recent available data from the Power Generation Integrated Master Plan [54].
Electricity generation in Mozambique has mostly been dominated by hydropower and hydro will continue to play an important role in the future, even though the share of other technologies, including fossil fuels, has been increasing gradually in recent years. Table 5 provides a breakdown of the historical technology mix for Mozambique’s installed electricity generation capacity from 2012 to 2018, which forms the basis for the baseline scenario. The RE sources included here are therefore not part of the mitigation scenario.
The assumptions for the development of electricity generation came from different sources, mainly from the annual reports of the utility company Electricidade de Moçambique (EDM), the Renewable Energy Development Strategy, and the five-year government plan (2015–2019). The non-policy drivers affecting electricity demand for the development of the scenario included demographics and gross domestic product (GDP) data, provided by the National Institute of Statistics (INE). GDP growth has gradually slowed in the last four years from approximately 7.8% in 2015 to about 3.3% in 2018. This economic recession has, in addition to affecting electricity demand, led to the postponement of several development projects, including some in the RE area. Therefore, there is great uncertainty about the future of RE additions, especially with regard to the commencement dates for a number of planned projects.
In Appendix A (Table A1) we present the actions and measures that were used to construct the baseline scenario beyond 2018. The power projects included in the baseline scenario were selected from a broader list of projects that have been proposed or are under development, mainly by private entities. To summarize, the projects presented in Appendix A (Table A1) include power capacities of 2500 MW for fossil fuel sources (natural gas and coal) and 2785 MW for renewables (hydro and solar). They were selected during the development of the NDC for Mozambique through a multicriteria analysis (MCA) conducted with stakeholders. The selection criteria applied were: relevance of the project, financial attractiveness, technology appropriateness, and availability of technical capacity. As a result of the MCA, wind and biomass RE sources were not included in the baseline scenario (for 2020–2030). The capacity of solar PV (40 MW) developed from historical data was kept constant until 2030. There are indications that bagasse is used for energy purposes by some sugar cane companies in the southern and central regions of Mozambique. However, the information and data were inconsistent and hence hard to account for in the baseline scenario.
Table 6 provides the historical and expected electricity demand by sector for five-year periods from 2010 while Table 7 shows the average growth rates of electricity demand by sector for the same periods.
In Table 6, the data for the years 2010 and 2015 originate from the national power utility company. The projects for 2020 to 2030 are our own calculations based on socio-economic and demographic drivers using the LEAP system. Table 7 provides the evolution of electricity growth rates measured as electricity demand in each sector. The agriculture and industry sectors registered the highest growth levels in the period 2010–2020. The government and the private sector are implementing various initiatives to modernize these sectors, including increased access to reliable electricity services aimed at boosting their productivity. The constant growth after 2020, in Table 7, was driven by the assumption of an electrification rate of 120,000 new household connections per year, reflecting EDM’s average new connections per year for the past 15 years. Despite these notable electrification efforts by EDM, the country’s electricity coverage was still approximately 30% in 2018 according to the National Power Utility Strategy 2018–2028 [55]. The share of electricity coverage was based on the number of utility customers connected to the national grid.

3.1.2. NDC and REFIT Scenarios

The electricity generation component for the mitigation scenario of the NDC was built based on the “improved access to renewable energy” action from the National Climate Change Adaptation and Mitigation Strategy (ENAMMC) [56]. This action includes measures to promote RE for rural electrification and the sustainable use of biomass. Additional data for the construction of the mitigation scenario was obtained from the Integrated Master Plan for Mozambique′s Power System Development, developed by EDM (EDM’s Company Strategy 2018–2028), and the New and Renewable Energy Development Strategy 2011–2025. Further inputs on the mitigation options for the NDC Mitigation scenario were collected during various multi-sectoral consultations organized by the MTA.
Table 8 summarizes the power additions included in the REFIT Policy scenario (250 MW RE addition) and the NDC REFIT scenario (32 MW RE addition). The REFIT Policy scenario is based on the initial technology caps set for the REFIT. The policy′s maximum implementation potential, distributed according to the type of technology, is as follows: 120 MW for mini-hydro, 60 MW for wind, 50 MW for biomass, and 20 MW for solar power plants. The NDC REFIT scenario (32 MW RE addition) is based on the expected RE contribution to the NDC Mitigation scenario. The NDC Mitigation scenario consists of the power projects with capacities of up to 10 MW, namely hydro (Luaice and Berue), solar (Vilanculo and Balama), and the sugar cane project, all included in Table 9.
The list of projects included in the NDC Mitigation scenario is shown in Table 9. Similar to the baseline, MCA was applied for the selection of power projects to build the NDC Mitigation scenario. However, in this case, only RE projects were prioritized.
The collective implementation of these actions is defined as the NDC mitigation (electricity generation) scenario. These actions include, as mentioned earlier, the introduction of 32 MW of RE through the partial implementation of the REFIT. The 32 MW additions through the REFIT are in this analysis presented as the NDC REFIT scenario, while the full implementation potential of the REFIT of 250 MW is presented as the REFIT Policy scenario.

3.2. Stakeholder’s Consultations for Mapping Barriers and Identifying Elements to Ensure a Robust MRV System for the REFIT

In addition to the GHG impact assessment, this study addresses recommendations on how to improve data collection and reporting to track the implementation of the REFIT, aligned with the requirements of the MPGs for Article 13 of the PA, as well as identifying the main barriers that can hinder the effective MRV of the REFIT.
Stakeholder participation is an important requirement for raising awareness about the benefits of robust MRV, as it allows the assessment of the effectiveness of the REFIT regulation, and for ensuring that the frequency of monitoring addresses the needs of decision-makers and other stakeholders, while not putting undue burden on entities actively involved in MRV. A series of stakeholder consultation meetings have been conducted, organized by the MTA as the focal point of the UNFCCC and UNEP DTU Partnership, one of the ICAT implementing partners providing capacity building support to participating countries. The meetings engaged a wide range of relevant stakeholders, including MIREME and the Ministry of Economy and Finance (MEF), financial institutions, civil society, and private sector organizations. Preliminary studies were conducted prior to the consultations based on the information available from national reports, such as the National Climate Change Monitoring and Evaluation System (SNMAMC) [57] and the National Strategy for Adaptation and Mitigation of Climate Change [56]. The findings were presented during the consultations, followed by discussions and validation of the results by the stakeholders. The participants provided valuable insights for establishing MRV systems for the REFIT and gave their points of view on the main barriers that may hinder the MRV of the REFIT, including suggestions to overcome these barriers.

4. Results and Discussions

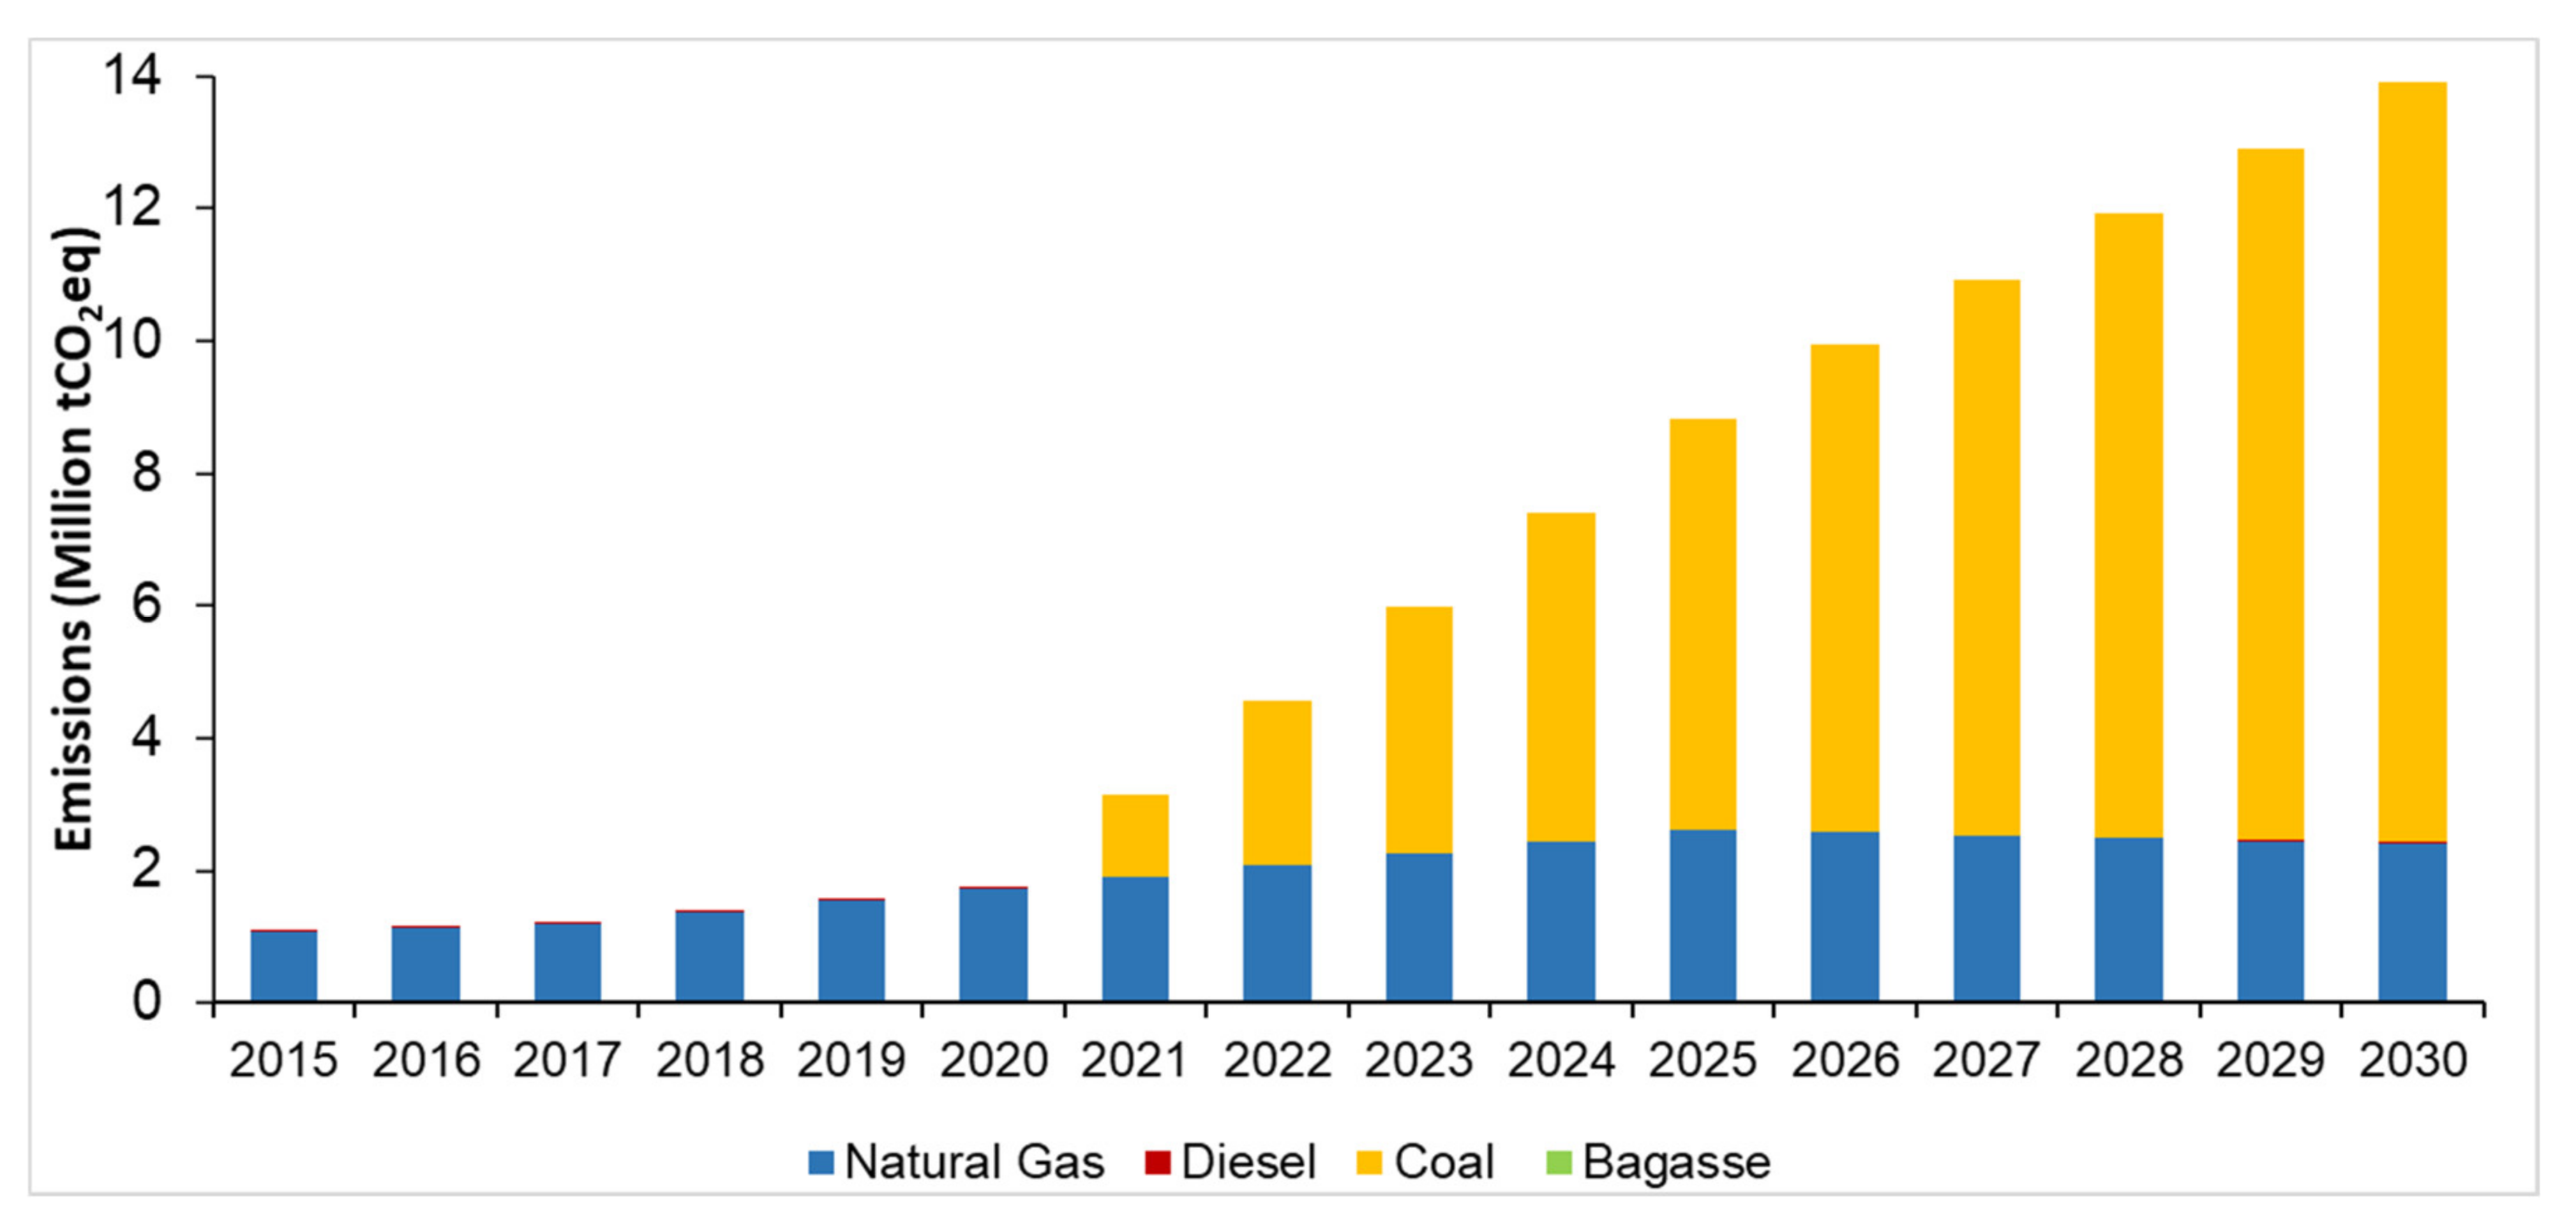
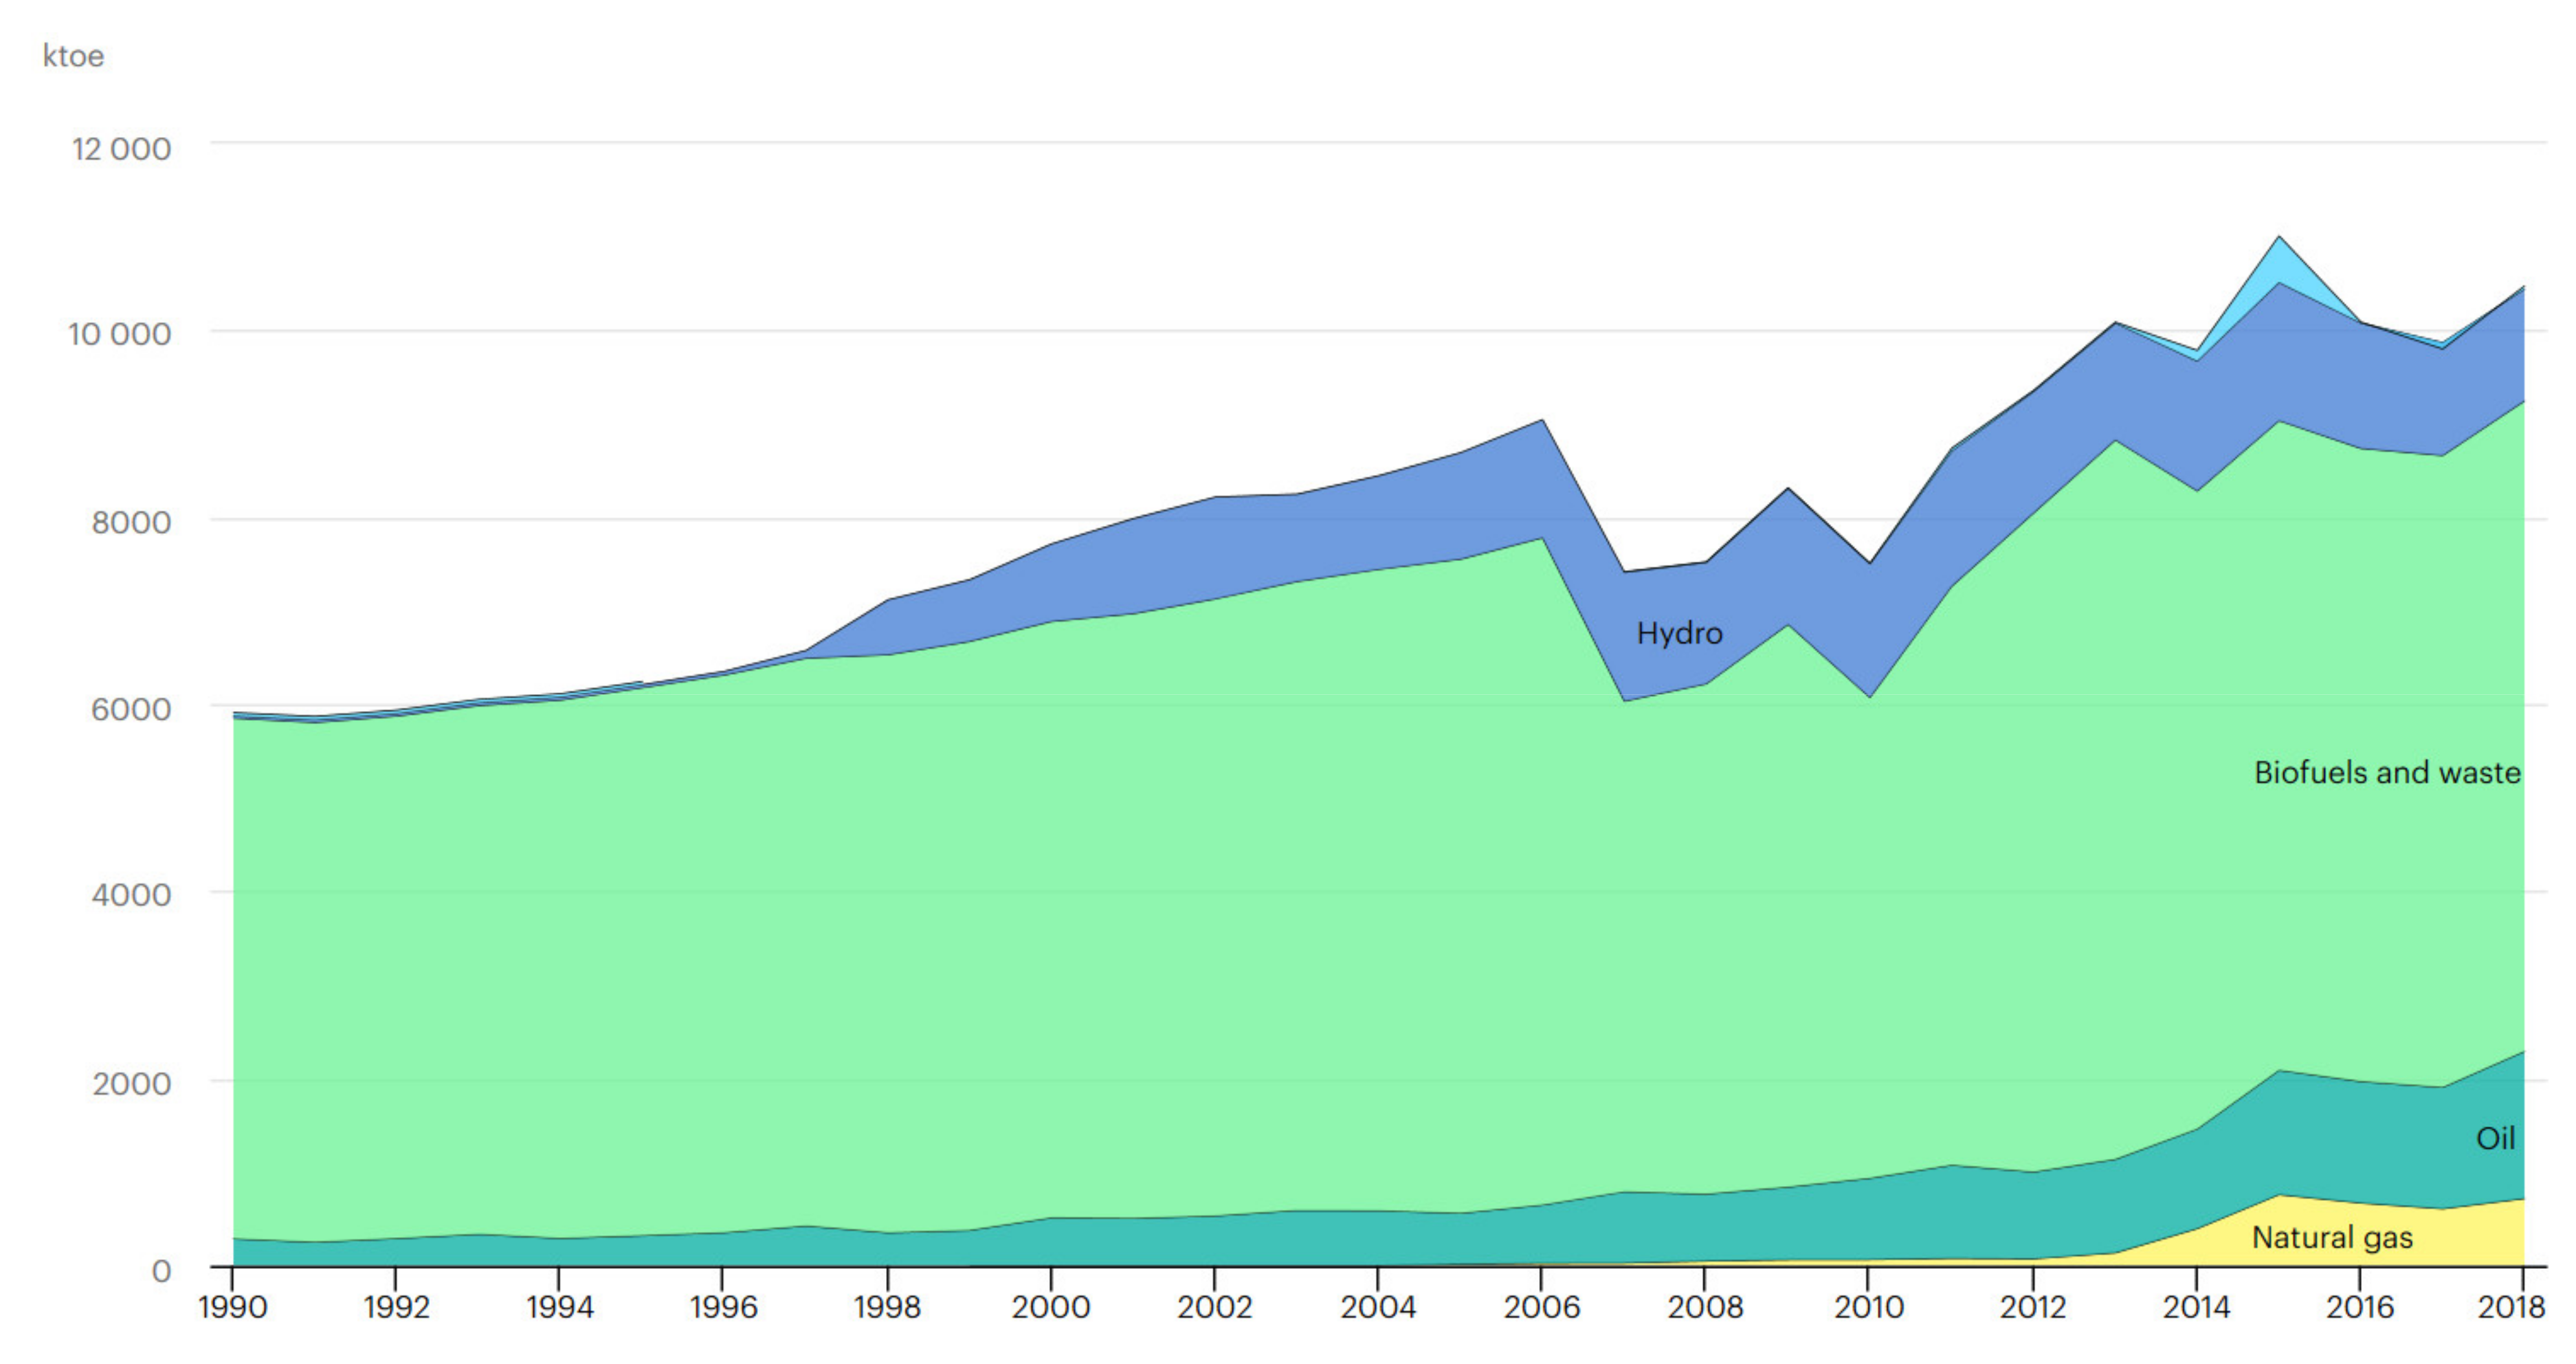
4.1. The Ex Ante Baseline Scenario

This section presents the results of the baseline scenario modeling for power generation developed for Mozambique’s NDC. The GHG emissions from electricity generation in the baseline scenario are expected to increase rapidly over time and become the third source of GHG emissions in order of magnitude, after agriculture and forest and land use.
The two main sources of GHG emissions resulting from electricity generation in Mozambique are coal and natural gas. The recent discovery and exploitation of these fossil fuel resources has encouraged the country diversify its electricity generation mix and increase the use of fossil fuel sources. Interestingly, among the various arguments in support of these options there are some related to extreme climate events that pose a risk to hydro generation in Mozambique, such as droughts and floods. Electricity exports to neighboring countries are also one of the main drivers for fossil fuel-based generation.
Figure 3 shows that natural gas is currently the main source of GHGs, accounting for nearly all emissions from electricity generation. However, emissions from coal generation may substantially rise in the medium to long term, accounting for approximately 70% and 82% by 2025 and 2030, respectively, if no RE policy is put in place, i.e., under the baseline scenario.
Figure 4 shows emissions by gas and indicates that carbon dioxide is the main type of GHG emission from electricity generation in the baseline scenario. This finding is in line with a previous study [49] in which carbon dioxide was found to constitute the main type of GHG emission.

4.2. The REFIT Policy Scenario and the NDC Mitigation Scenario

This section presents the results of the modeling of the policy scenarios for the implementation of the REFIT regulation. It presents two variant scenarios: the NDC REFIT scenario, representing a 32 MW addition of RE as expected under the NDC of Mozambique; and the REFIT Policy scenario, with 250 MW of RE addition, representing the maximum implementation potential set by the policy caps.
In order to ensure its alignment with the NDC Mitigation scenario, the REFIT Policy scenario analyzed in this study starts in 2020 and runs until 2030 and includes the actions and projects included in the NDC Mitigation scenario.
Figure 5 illustrates the expected BAU GHG emission scenarios for electricity production (baseline), the REFIT contribution to the energy sector mitigation in the NDC scenario (NDC_REFIT 32 MW), and the REFIT Policy scenario assuming maximum implementation of the policy (REFIT_Policy 250 MW). A comparison between the baseline and the NDC REFIT scenario shows that the REFIT contribution to electricity-related emissions is minor, corresponding to 0.34 MtCO2eq cumulative emission reductions by 2030. A comparison of the baseline and the REFIT Policy scenario shows that the difference between these scenarios is 0.17 and 0.61 MtCO2eq in 2025 and 2030, respectively. Taking 2030 as reference, the 0.61 MtCO2eq emission reduction from electricity falls close to the findings from [52]. In the NDC REFIT scenario (32 MW) the emissions reductions are almost negligible for the period 2020–2025 and for 2020–2030 represent only 0.6%.
It is important to note that the implementation of the REFIT Policy scenario would lead to additional emission reductions compared to the NDC Mitigation scenario (shown in Figure 5) because the NDC Mitigation scenario only accounts for the implementation of 32 MW of RE out of the total 250 MW potential of the REFIT. Figure 6 compares the scenarios and presents them in terms of their potential for increased NDC ambitions, including the baseline scenario for electricity production, the NDC Mitigation scenario with all electricity-related actions (including 32 MW of RE addition from the implementation of REFIT), and the REFIT Ambition scenario (with an additional 218 MW from implementing the REFIT policy in its full potential).
In the baseline scenario, the emissions are estimated to be 8.8 and 13.9 MtCO2eq in 2025 and 2030, respectively. The potential emissions reductions in the REFIT Ambition scenario represent 0.5% for the period 2020–2025 and 4.3% for the period 2025–2030. Therefore, the full implementation of the REFIT policy would result in higher emission reductions than expected under the NDC scenario, as can be seen in Table 10. However, if placed in an international scale, these results are lower than those reported by previous studies [49,50,51]. This is as expected because REFIT policies are different. However, the reduction in emissions presents a good milestone.
As expected, Table 10 shows that the accumulated emissions would be the lowest with the REFIT Ambition scenario. Table 11 shows how the different scenarios compare in terms of emission savings in relation to the baseline.
If we compare the emission reductions for the REFIT′s full potential (REFIT_Ambition 250 MW) to the collective emission reductions from all electricity production activities envisioned by the NDC (NDC_Mitigation), we see that promoting full implementation of the REFIT by 2030 could indeed provide an opportunity to achieve a more ambitious NDC target. The additional contribution would not be significant but would still be valuable. When comparing the total expected emissions for electricity generation to the total NDC contribution of 30.41 MtCO2eq (2020–2025), the expected impact of the REFIT seems quite limited in terms of the achievement of GHG emission reductions in the sector and for the NDC overall. As expected, the highest emission reductions are obtained with the REFIT Ambition scenario, estimated at an additional 1.41 MtCO2eq and 11.25 MtCO2eq, resulting in emission savings of 4.5% and 16.4%, for 2020–2025 and 2025–2030, respectively. A full-scale implementation strategy is what other countries are envisioning, as reported in previous studies [42,43,44,45,46,47,48,49,50,51,52].

4.3. Tracking and Reporting the Implementation of the REFIT Policy

In addition to the GHG impact assessment, this study also investigated how to improve data collection for reporting and tracking implementation of REFIT, in alignment with the requirements of the MPGs for Article 13 of the PA. MRV processes to track the progress of the implementation of the REFIT regulation need to be in place in order to assess the effectiveness of the regulation and its impacts on GHG emission reductions. However, no specific plan for MRV procedures for the REFIT is provided by the government and the timing and frequency of MRV are not specified in the REFIT regulation. Nonetheless, there are existing monitoring initiatives for the electricity sector and for climate change at the national level, such as the National Climate Change Monitoring and Evaluation System [57], that can be used for the MRV of the implementation of the REFIT.
Tracking the implementation of the REFIT consists of tracking several aspects that are relevant for monitoring its performance and is not only limited to GHG emissions. According to the MPGs, non-GHG impacts can also be reported to the UNFCCC. Tracking both GHG and non-GHG impacts is also relevant for national planning because it documents successful policies that achieve strategic goals. Transparency beyond GHG emissions is thus an important tool to demonstrate that REFIT has a measurable impact and is implemented effectively. In addition, tracking of the policy′s impact can provide the feedback required to make potential modifications to the REFIT, like recalculating the tariffs and assessing the quality of the services provided.

4.3.1. Indicators for the MRV of the Implementation of the REFIT and of Support Received

The key performance indicators for monitoring the progress of implementation of the REFIT are presented in Table 12. They include the entity responsible for measuring the indicator and the entity that should gather the information and report it to MITADER for the compilation of biennial transparency reports (BTRs) for the UNFCCC. According to the participants of the stakeholder meetings, MIREME, through the National Directorate of Planning and Cooperation (DPC) and the National Directorate of Electricity (DNE), is responsible for monitoring and reporting the energy produced by EDM and IPPs under the REFIT regulation. The tariff levels and expenditures at the source should be monitored by the DNE, EDM, and the Energy Regulatory Authority Board (ARENE). MIREME must report the statistical data, including the biannual energy balances for the installed/planned capacity, to MITADER. The MEF, through the National Directorate of Planning and Budget (DNPO), must coordinate the planning activities and allocate and manage the budget for the implementation of the REFIT regulation. MIREME must bear the responsibility of reporting the co-benefits (sustainable development benefits), which include the number of connected households, schools, health centers, and public administrations infrastructures, as well as jobs opportunities. However, coordination among these entities is also necessary to avoid duplication of efforts by different actors. Participants from the stakeholder meetings stressed that there should be a strong mechanism to facilitate data sharing. The sectors should therefore identify a common and viable platform for making data available.

4.3.2. Barriers to Establishing Effective MRV Procedures

This section addresses the barriers identified for effective MRV of the REFIT. The barriers, as well as suggestions to overcome these barriers, are presented in Table 13 and are classified in terms of barriers related to GHG emission reductions, financial factors, technological factors, and capacity building factors. These barriers were identified by experts from different institutions representing the main stakeholders of the power sector (MIREME, the Mozambican energy fund (FUNAE), EDM, and ARENE), financial institutions, civil society, and private sector organizations during a series of stakeholder consultations conducted to design the MRV of the REFIT.
Like other developing countries, Mozambique is in an inceptive stage of development when it comes to developing robust and comprehensive MRV systems. Two of the main constraints that the country is facing are the insufficient availability of financial resources and the lack of skilled capacities for clear budgetary allocations, which can hinder the provision of financial support for MRV and monitoring of funds spent. Similarly, these barriers have been addressed in [58] as some of the main factors that may hinder rural electrification in Mozambique and Tanzania. According to the study, the donors’ criteria do not match local capacities, making it difficult to access financial support. Therefore, the enhancement of institutional capabilities for clear and transparent budgetary allocations should be prioritized to overcome both financial and capacity barriers.
The weak coordination between institutions and insufficiently skilled technicians are the major challenges for the implementation of an MRV system for the emissions reductions of the REFIT regulation. These challenges were also reported by the authors of [22] when addressing the implementation of the REFIT in Africa and by the authors of two other studies [59,60] with regard to the barriers that can hinder private investment in the development of renewable projects in Mozambique. In addition, the lack of mechanisms for data collection and the lack of recurrent updates of the grid emission factor may heavily affect the estimation of GHG emissions. The establishment of clear definitions of roles and responsibilities, capacity building for MRV procedures for local experts, and improvements in data collection, processing, and sharing may be able to make considerable contributions to overcoming these barriers, as presented in Table 13.

5. Conclusions

This article presents an assessment of the contribution of a REFIT policy to reducing GHG emissions in Mozambique. The assessment is of particular relevance for Mozambique since the country is currently in a phase of energy transition and sound policies with clearly mapped impact potentials may help to attract investments to implement the needed expansion in electricity generation capacity through RE technologies.
Currently, hydropower dominates the electricity generation mix but this pattern is likely to be disrupted in the near future, given that the use of coal and natural gas, both recently discovered to be abundant resources in Mozambique, is expected to grow sharply under the baseline scenario.
The REFIT Policy scenario takes into account the electricity generation component of the NDC Mitigation scenario and the initial REFIT technology caps for the level of procurement imposed by MIREME under the REFIT regulation. However, the tariffs and the caps on the maximum generation capacity established under the REFIT regulation should be revised to reflect the current stage of development of the technologies, taking into account declining costs in RE technologies.
The REFIT Policy scenario, with the maximum implementation of 250 MW, was presented, along with two variant scenarios, the NDC REFIT scenario of 32 MW and the REFIT Ambition scenario of 218 MW. Emission reductions in the NDC REFIT (32 MW) scenario were found to be almost negligible for the period 2020–2025, corresponding to practically no emission reductions by 2025 and only 0.34 MtCO2eq by 2030, equivalent to a 0.6% reduction compared to the baseline scenario. Full implementation of the REFIT policy would lead to a reduction of 0.17 MtCO2eq by 2025 and 2.54 MtCO2eq by 2030, corresponding to 0.5% and 4.3% reductions by 2025 and 2030, respectively, compared to the baseline scenario. The potential deviation from the baseline scenario might not seem highly significant but it is still a considerable change compared to the REFIT contribution envisioned in the NDC Mitigation scenario.
It is important to note that the implementation of the REFIT Policy scenario would lead to additional emission reductions compared to the NDC Mitigation scenario, as the NDC REFIT scenario only accounts for 32 MW out of the total 250 MW potential. Therefore, the full implementation of the REFIT policy would result in an increased ambition of 218 MW compared to the current NDC. The full implementation of the REFIT has the potential to provide additional emission reductions compared to the NDC target, equivalent to 0.17 MtCO2eq by 2025 and 2.2 MtCO2eq by 2030, meaning that NDC ambition for the electricity production subsector could be raised by 13.7% by 2025 and 24% by 2030. This is, however, dependent on the creation of the right enabling environments, which requires additional international efforts to support climate action that allow for the full implementation of the REFIT.
An MRV system is important to track the progress of the implementation of REFIT regulation, including its contributions to emission reductions, sustainable development benefits (as described in national policies), and adherence to the international reporting obligations of the UNFCCC. Moreover, it provides the necessary feedback for policy adjustments, such as updates on the tariffs. The proposed MRV system provides clear definitions of roles, responsibilities, and modalities in order to track specific indicators and monitor the impacts of the REFIT, following which reporting protocols can be established.
However, there are some barriers and gaps that might hinder the estimation of GHGs and, consequently, the implementation of an MRV system, such as weak coordination between institutions; lack of consistent data; lack of mechanisms for data collection, processing, and sharing; lack of skilled capacities; and lack of budgetary allocations for MRV. These barriers can be overcome by establishing clear definitions of the roles and responsibilities of the institutions and through enhancement of institutional capacity building for local MRV experts and support for the improvement of mechanisms for data collection, processing, and sharing.

Author Contributions

Conceptualization, methodology, formal analysis, data curation, supervision, validation, writing—original draft, E.I.C.Z.; software, data curation, writing—original draft preparation, G.M.; writing—review and editing, F.A.C.; writing—review and editing, A.C. All authors have read and agreed to the published version of the manuscript.

Funding

This research received no external funding.

Institutional Review Board Statement

Not applicable.

Informed Consent Statement

Not applicable.

Acknowledgments

The analysis that forms the basis for the article was funded through the Initiative for Climate Action Transparency (ICAT). We thank the Ministry of Land and Environment of Mozambique, especially Marília Telma António Manjate and Paula Salva da Costa Panguene, for their support and engagement in facilitating access to information and for engaging with relevant stakeholders.

Conflicts of Interest

The authors declare no conflict of interest.

Appendix A

Table A1. Upcoming Actions and Projects Included in the Baseline Scenario Appendix A. Upcoming Actions and Projects Included in the Baseline Scenario.
ENAMMC ActionENAMMC/NDC MeasureDescription
Project Name/LocationCapacity
(MW)
Year *StatusScenario
Improving access to renewable energies (4.6.2.1.1)Promoting the use of renewable energy sources (biogas, biomass, solar, wind, thermal, waves, and geothermal energy) (4.6.2.1.1.2.)Hydro
Mphanda Nkuwa15002024PREF
Cahora Bassa North12452026PREF
Solar PV
Mocuba–Zambezia402018IREF
Increasing energy efficiency (4.6.2.1.2)Ensuring availability and access to low-carbon fossil fuels (4.6.2.1.2.1.) Use of “clean coal” technologies in coal-fired power stations (including the use of cogeneration where applicable) (4.6.2.1.2.4.)Natural Gas (NG) and Coal
Temane (NG)4002022PREF
Temane II (NG)1002023PREF
Central Térmica Maputo (NG)1102018IREF
Nacala GT Emergency (NG)402019 PREF
Moatize, Tete (Coal)12002023PREF
Jindal (Coal)1502023PREF
Baobab (Coal)3002022PREF
Nacala (Coal)2002022PREF
Source: Mozambique NDC Report, December 2018; P: planned; I: in implementation; REF: a baseline scenario; * most likely year of start.

References

  1. USAID. Mozambique Power Africa Fact Sheet. September 2020. Available online: https://www.usaid.gov/powerafrica/mozambique (accessed on 5 February 2021).
  2. World Bank. Mozambique Energy Sector Policy Note; World Bank: Washington, DC, USA, 2015. [Google Scholar]
  3. Get.Invest. Mozambique Energy Sector. November 2020. Available online: https://www.get-invest.eu/market-information/mozambique/energy-sector/ (accessed on 27 January 2021).
  4. IEA. Mozambique Key Energy Statistics 2018. 2018. Available online: https://www.iea.org/countries/mozambique (accessed on 15 January 2021).
  5. MITADER (Ministry of Land Environment and Rural Development). Contribuição Nacionalmente Determinada (NDC) de Moçambique à Convenção Quadro das Nações Unidas Sobre as Mudanças Climáticas (UNFCCC); Ministry of Land Environment and Rural Development (MITADER): Maputo, Mozambique, 2017.
  6. The Paris Agreement (United Nations Framework Convention on Climate). The Paris Agreement. In Proceedings of the 21st Conference of the Parties, Paris, France, 30 November–12 December 2015.
  7. UNFCCC, 2016: Decision 1/CP.21 Adoption of the Paris Agreement. Available online: https://unfccc.int/process-and-meetings/conferences/past-conferences/paris-climate-change-conference-november-2015/cop-21/cop-21-decisions (accessed on 17 December 2020).
  8. Iyer, G.; Ledna, C.; Clarke, L.; Edmonds, J.; McJeon, H.; Kyle, P.; Williams, J.H. Measuring progress from nationally determined contributions to mid-century strategies. Nat. Clim. Chang. 2017, 7, 871–874. [Google Scholar] [CrossRef]
  9. Chaturvedi, V.; Koti, P.N.; Chordia, A.R. Pathways towards India’s nationally determined contribution and mid-century strategy. Energy Clim. Chang. 2021, 2, 100031. [Google Scholar] [CrossRef]
  10. Röser, F.; Widerberg, O.; Höhne, N.; Day, T. Ambition in the making: Analysing the preparation and implementation process of the Nationally Determined Contributions under the Paris Agreement. Clim. Policy 2020, 20, 415–429. [Google Scholar] [CrossRef] [Green Version]
  11. Modalities, Procedures and Guidelines for the Transparency Framework for Action and Support Referred to in Article 13 of the Paris Agreement|UNFCCC. Available online: https://unfccc.int/ (accessed on 17 September 2020).
  12. Weikmans, R.; van Asselt, H.; Roberts, J.T. Transparency requirements under the Paris Agreement and their (un)likely impact on strengthening the ambition of nationally determined contributions (NDCs). Clim. Policy 2020, 20, 511–526. [Google Scholar] [CrossRef]
  13. Dal Maso, M.; Canu, F.A. Unfolding the Reporting Requirements for Developing Countries under the Paris Agreement’s Enhanced Transparency Framework; DTU: Copenhagen, Denmark, 2019; ISBN 9788793458703. [Google Scholar]
  14. Behrens, P.; Rodrigues, J.F.D.; Brás, T.; Silva, C. Environmental, economic, and social impacts of feed-in tariffs: A Portuguese perspective 2000–2010. Appl. Energy 2016, 173, 309–319. [Google Scholar] [CrossRef] [Green Version]
  15. Wang, H.; Chen, W. Modeling of energy transformation pathways under current policies, NDCs and enhanced NDCs to achieve 2-degree target. Appl. Energy 2019, 250, 549–557. [Google Scholar] [CrossRef]
  16. Jenner, S.; Groba, F.; Indvik, J. Assessing the strength and effectiveness of renewable electricity feed-in tariffs in European Union countries. Energy Policy 2013, 52, 385–401. [Google Scholar] [CrossRef] [Green Version]
  17. Ramli, M.A.M.; Twaha, S. Analysis of renewable energy feed-in tariffs in selected regions of the globe: Lessons for Saudi Arabia. Renew. Sustain. Energy Rev. 2015, 45, 649–661. [Google Scholar] [CrossRef]
  18. Sun, P.; Nie, P.-Y. A comparative study of feed-in tariff and renewable portfolio standard policy in renewable energy industry. Renew. Energy 2015, 74, 255–262. [Google Scholar] [CrossRef]
  19. Lu, Y.; Khan, Z.A.; Alvarez-Alvarado, M.S.; Zhang, Y.; Huang, Z.; Imran, M. A Critical Review of Sustainable Energy Policies for the Promotion of Renewable Energy Sources. Sustainability 2020, 12, 5078. [Google Scholar] [CrossRef]
  20. Pyrgou, A.; Kylili, A.; Fokaides, P.A. The future of the Feed-in Tariff (FiT) scheme in Europe: The case of photovoltaics. Energy Policy 2016, 95, 94–102. [Google Scholar] [CrossRef]
  21. Lim, X.-L.; Lam, W.-H.; Hashim, R. Feasibility of marine renewable energy to the Feed-in Tariff system in Malaysia. Renew. Sustain. Energy Rev. 2015, 49, 708–709. [Google Scholar] [CrossRef]
  22. Meyer-Renschhausen, M. Evaluation of feed-in tariff-schemes in African countries. J. Energy S. Afr. 2013, 24, 56–65. [Google Scholar] [CrossRef] [Green Version]
  23. Bakhtyar, B.; Ibrahim, Y.; Alghoul, M.A.; Aziz, N.; Fudholi, A.; Sopian, K. Estimating the CO2 abatement cost: Substiture Price of Avoiding CO2 Emission (SPAE) by renewable Energy’s Feed in Tariff in selected countries. Renew. Sustain. Energy Rev. 2014, 35, 205–210. [Google Scholar] [CrossRef]
  24. Odeku, K.O.; Meyer, E.L.; Mireku, O.; Letsoalo, J.L.H. Implementing a Renewable Energy Feed-in Tariff in South Africa: The beginning of a New Dawn. Sustain. Dev. Law Policy 2011, 11, 3–9. [Google Scholar]
  25. Ndiritu, S.W.; Engola, M.K. The effectiveness of feed-in-tariff policy in promoting power generation from renewable energy in Kenya. Renew. Energy 2020, 161, 593–605. [Google Scholar] [CrossRef]
  26. Bhamidipati, P.L.; Haselip, J.; Elmer Hansen, U. How do energy policies accelerate sustainable transitions? Unpacking the policy transfer process in the case of GETFiT Uganda. Energy Policy 2019, 132, 1320–1332. [Google Scholar] [CrossRef]
  27. Mokveld, K.; Von Eije, S. Final Energy Report Mozambique; Netherlands Enterprise Agency: The Hague, The Netherlands, 2018. [Google Scholar]
  28. Associação Lusófona de Energias Renováveis. Energias Renovaveis em Mocambique_Relatorio Nacional do Ponto de Situacao; Associação Lusófona de Energias Renováveis: Lisboa, Portugal, 2017. [Google Scholar]
  29. IRENA. The Power to Change: Solar and Wind Cost Reduction Potential to 2025; IRENA: Abu Dhabi, United Arab Emirates, 2016. [Google Scholar]
  30. IRENA. Innovation Outlook: Renewable Mini-Grids; IRENA: Abu Dhabi, United Arab Emirates, 2016; ISBN 9789295111431. [Google Scholar]
  31. New Climate Institute and Verra ICAT. Renewable Energy Guidance: Guidance for Assessing the Greenhouse Gas Impacts of Renewable Energy Policies. 2018. Available online: https://www.climateactiontransparency.org/wp-content/uploads/2018/05/ICAT-RE-Ch-1-2-What-is-the-guidance-and-why-should-I-use-it.pdf (accessed on 17 December 2020).
  32. Kuramochi, T.; Hagemann, M.; Hans, F. Quantifying policy impact: ICAT renewable energy guidance and other examples. In Proceedings of the Eionet Meeting, Copenhagen, Denmark, 12 September 2018. [Google Scholar]
  33. Initiative for Climate Action Transparency. Government of Mozambique Advances Its National MRV System by Strengthening Its Institutional Capacity. Denmark. Available online: https://climateactiontransparency.org/government-of-mozambique-advances-its-national-mrv-system-by-strengthening-its-institutional-capacity/ (accessed on 21 January 2021).
  34. Heaps, C.G. Long-Range Energy Alternatives Planning (LEAP) System; Software Version: 2018.1.25; Stockholm Environment Institute: Stockholm, Sweden, 2016. [Google Scholar]
  35. Stockholm Environment Institute. Long-Range Energy Alternatives Planning System-User Guide. Available online: https://unfccc.int/resource/cd_roms/na1/mitigation/Module_5/Module_5_1/b_tools/LEAP/Manuals/Leap_Use_Guide_English.pdf (accessed on 7 February 2020).
  36. Qi, T.; Zhang, X.; Karplus, V.J. The energy and CO2 emissions impact of renewable energy development in China. Energy Policy 2014, 68, 60–69. [Google Scholar] [CrossRef] [Green Version]
  37. World Resources Institute. Initiative for Climate Action Transparency. Available online: https://www.wri.org/our-work/project/icat (accessed on 17 January 2021).
  38. Rich, D.; Bhatia, P.; Finnegar, J.; Levin, K.; Mitra, A. An Accounting and Reporting Standard for Estimating the Greenhouse Gas Effects of Policies and Actions; World Resources Institute: Washington, DC, USA, 2014; Available online: www.wri.org/publication/policy-and-action-standard (accessed on 5 February 2021).
  39. Sousa, R.; Mourão, I.; Cavalheiro, G. Estudo Viabilidade de Opções de Desenvolvi-Mento de Baixo Carbono; Agencia Portuguesa do Ambiente: Lisbon, Portugal, 2016. [Google Scholar]
  40. Mahumane, G.; Mulder, P. Introducing MOZLEAP: An integrated long-run scenario model of the emerging energy sector of Mozambique. Energy Econ. 2016, 59, 275–289. [Google Scholar] [CrossRef] [Green Version]
  41. Ringkjøb, H.-K.; Haugan, P.M.; Solbrekke, I.M. A review of modelling tools for energy and electricity systems with large shares of variable renewables. Renew. Sustain. Energy Rev. 2018, 96, 440–459. [Google Scholar] [CrossRef]
  42. Kumar, A.; Bhattacharya, S.C.; Pham, H.L. Greenhouse gas mitigation potential of biomass energy technologies in Vietnam using the long range energy alternative planning system model. Energy 2003, 28, 627–654. [Google Scholar] [CrossRef]
  43. Limmeechokchai, B.; Chawana, S. Sustainable energy development strategies in the rural Thailand: The case of the improved cooking stove and the small biogas digester. Renew. Sustain. Energy Rev. 2007, 11, 818–837. [Google Scholar] [CrossRef]
  44. Cai, W.J.; Wang, C.; Chen, J.N.; Wang, K.; Zhang, Y.; Li, X.D. Comparison of CO2 emission scenarios and mitigation opportunities in China’s five sectors in 2020. Energy Policy 2008, 36, 1181–1194. [Google Scholar] [CrossRef]
  45. Zhou, N.; Fridley, D.; Khanna, N.Z.; Ke, J.; McNeil, M.; Levine, M. China’s energy and emissions outlook to 2050: Perspectives from bottom-up energy end-use model. Energy Policy 2014, 53, 51–62. [Google Scholar] [CrossRef]
  46. Vincent, E.N.; Comfort, E.C.; Panchakshara, M.G.; Emodi, A.S.A. Energy policy for low carbon development in Nigeria: A LEAP model application. Renew. Sustain. Energy Rev. 2017, 68, 247–261. [Google Scholar]
  47. Lin, J.Y.; Cao, B.; Cui, S.; Wang, W.; Bai, X. Evaluating the effectiveness of urban energy conservation and GHG mitigation measures: The case of Xiamen city, China. Energy Policy 2010, 38, 5123–5132. [Google Scholar] [CrossRef]
  48. Huang, Y.; Jeffrey, B.Y.; Peng, C.Y. The long-term forecast of Taiwan’s energy sup-ply and demand: LEAP model application. Energy Policy 2011, 39, 6790–6803. [Google Scholar] [CrossRef]
  49. Chhay, L.; Limmeechokchai, B. CO2 Mitigation in the Power Sector of Thailand: Analyses of Cleaner Supply-side Options beyond the Paris Agreement. Open Environ. Res. J. 2019, 12, 15–25. [Google Scholar] [CrossRef] [Green Version]
  50. Tian, C.; Feng, G.; Li, S.; Xu, F. Scenario Analysis on Energy Consumption and CO2 Emissions Reduction Potential in Building Heating Sector at Community Level. Sustainability 2019, 11, 5392. [Google Scholar] [CrossRef] [Green Version]
  51. Clark, V.; Heaps, C. Update of Mexico’s Emissions Baseline and Mitigation Portfolio 2009–2030; USAID: Washington, DC, USA, 2013; pp. 8–121.
  52. Mac Uidhir, T.; Rogan, F.; Gallachóir, B.Ó. Develop a LEAP GHG Ireland Analytical Tool for 2050; Environmental Protection Agency: Wexford, Ireland, 2020; ISBN 9781840959512. [Google Scholar]
  53. Ministry of Energy. Estatistica de Energia; Ministry of Energy: Maputo, Mozambique, 2012.
  54. Ministry of Minerals Resources and Energy (MIREME). Integrated Master Plan Mozambique Power System Development—Draft Final Report; Ministry of Minerals Resources and Energy (MIREME): Maputo, Mozambique, 2017.
  55. Electricidade de Moçambique (EdM). Lighting Mozambique s Transformation. EDM Strategy 2018–2028; Electricidade de Moçambique (EdM): Maputo, Mozambique, 2018. [Google Scholar]
  56. Government of Mozambique (GoM). Mozambique’s National Climate Change Adaptation and Mitigation Strategy (ENAMMC) 2013–2025; Ministry for the Coordination of Environmental Affairs: Maputo, Mozambique, 2012.
  57. National Council for Sustainable Development (CONDES). National Climate Change Monitoring and Evaluation System (SNMAMC); National Council for Sustainable Development (CONDES): Maputo, Mozambique, 2014.
  58. Ahlborg, H.; Hammar, L. Drivers and barriers to rural electrification in Tanzania and Mozambique—Grid-extension, off-grid, and renewable energy technologies. Renew. Energy 2014, 61, 117–124. [Google Scholar] [CrossRef]
  59. Baruah, P.; Coleman, B. Country Brief: Mozambique Off-grid Solar Power in Mozambique: Opportunities for Universal Energy Access and Barriers to Private Sector Participation; Global Green Growth Institute: Seoul, Korea, 2018. [Google Scholar]
  60. BERF. Business Environment Constraints in Mozambique’s Renewable Energy Sector: Solar PV Systems and Improved Cook Stoves. Business Environment Reform Facility: 2016. Available online: https://assets.publishing.service.gov.uk/media/5c76b459ed915d3547d50a07/Final_BERF-Mozambique-Renewable-Energy-8th-Dec2016.pdf (accessed on 17 January 2021).
Figure 1. Energy sector growth in Mozambique in terms of total energy supply by source [4].
Sustainability 13 05376 g001
Figure 2. WRI guidelines on estimation of the impacts of GHG emissions [37].
Sustainability 13 05376 g002
Figure 3. Greenhouse gas (GHG) emissions estimates by source (million tCO2eq), directly (at point of emissions) calculated for the baseline scenario.
Sustainability 13 05376 g003
Figure 4. Greenhouse gas emissions estimates by source for electricity generation in the baseline scenario.
Sustainability 13 05376 g004
Figure 5. GHG emissions estimates for electricity production in the baseline, NDC_REFIT, and REFIT_Policy scenarios.
Sustainability 13 05376 g005
Figure 6. Greenhouse gas emissions estimated for the baseline, NDC Mitigation, and REFIT Ambition scenarios.
Sustainability 13 05376 g006
Table 1. South African feed-in tariffs [23].
PhasesType of TechnologyTariff (Rand/kWh)Tariff (EUR/kWh *)
Phase ILandfill gas power plant0.900.09
Small hydro power plant (less than 10 MW)0.940.10
Wind power plant1.250.13
Concentrating solar power (CSP) with storage2.10.21
Phase IIConcentrating solar power without storage3.140.32
Solid biomass1.180.12
Biogas0.960.10
Photovoltaic systems (large ground or roof-mounted systems)3.940.40
Concentrating solar power central tower with storage capacity of 6 h2.310.23
* The exchange rate for the 19.7.2011 (9,8321 Rand = 1€) provided by the web-page http://bit.ly/1yvIoLA (accessed on 5 February 2021) was used to convert the tariff in €/kWh. The conversion allows comparison to other feed-in tariffs.
Table 2. Feed-in tariffs in Kenya [22].
Technology TypePlant Capacity (MW)Maximum Firm Power Tariff (USD/kWh) at the Interconnection PointMaximum Non-Firm Power Tariff (USD/kWh)
GeothermalUp to 700.085
Wind0.5–1000.120.12
Biomass0.5–1000.080.06
Small hydro0.5–0.990.120.10
1–5.00.100.08
5.1–100.080.06
Biogas0.5–400.080.06
Solar0.5–100.200.10
Table 3. Feed-in tariffs up to 20 MW—Uganda [22].
TechnologyTariff
(USD/kWh)
O&M
Percentage
(USD/kWh)
2011
(MW)
2012
(MW)
2013
(MW)
2014
(MW)
Payment Period
(Years)
Hydro (9 > < = 20 MW)0.077.61459013518020
Hydro (1 > < = 8 MW)Linear tariff7.241530609020
Hydro (500 kW > < = 1 MW)0.1097.081152520
Biogases0.08122.6520507510020
Biomass0.10316.231020305020
Biogas0.11519.231020305020
Landfill gas0.08919.711020305020
Geothermal0.0774.291030507520
Solar PV0.3625.032357.520
Wind0.1246.34507510015020
Table 4. Tariff structure of the Mozambican REFIT by technology and capacity.
Capacity (MW)Solar PV (MZN/kWh)Wind (MZN/kWh)Small Hydro (MZN/kWh)Biomass (MZN/kWh)
Up to 0.01 MW13.08.04.8Not applicable
Up to 0.5 MWNot applicableNot applicableNot applicable5.7
Up to 1 MW10.75.63.45.4
Up to 5 MW8.44.72.74.4
Up to 10 MW7.94.12.34.1
Table 5. Historical installed capacity (MW) by type of technology (baseline scenario).
Capacity2012201420162018
Hydro2278.002278.002278.002278.00
Natural gas1.43247.00282.00344.00
Diesel0.690.690.690.69
Solar PV-31.0036.0040.00
Total2280.122556.692596.692662.69
Table 6. Electricity demand by sector every five years.
Demand (GWh)20102015202020252030
Residential898.001119.001235.001364.001506.00
Services45.0057.0062.0062.0063.00
Agriculture0.301.101.602.002.70
Industry (non-ferrous metals)8185.0011,566.0016,184.0019,034.0022,658.00
Other industries1248.001613.001816.001863.001929.00
Total10,376.3014,356.1019,298.6022,325.0026,158.70
Table 7. Average growth rates of electricity demand by sector every five years.
Growth Rates (%)20102015202020252030
Residential-24.6%10.4%10.4%10.4%
Services-26.7%8.8%0.0%1.6%
Agriculture-266.7%45.5%25.0%35.0%
Industry (non-ferrous metals)-41.3%39.9%17.6%19.0%
Other industries-29.2%12.6%2.6%3.5%
Table 8. Building of REFIT Policy scenario and NDC REFIT scenario.
TechnologyImplementation PeriodCapacity of the NDC_REFIT Scenario (MW)Capacity of the REFIT_Policy Scenario (MW)
Hydro2023–20302.20
Hydro2020–2030120.00
Wind2020–203060.00
Solar PV2023–202520.00
Biomass2025–203020.00
Bagasse2025–203010.00
Bagasse2025–203030.00
Total32.20250.00
Table 9. Projects included in the NDC Mitigation scenario.
TechnologyProject NameCapacity (MW)Year *Status
HydroTsate–Sofala502025Planned
HydroMoamba Major152020Planned
HydroLuaice–Niassa0.52023Planned
HydroBerua1.522028–2030Approved
HydroBoroma2002028–2030Planned
HydroLupata6002028–2030Planned
WindNamaacha1202021Planned
WindManhiça–Maputo1202025–2030Planned
WindQuantum Power1202025–2030Planned
Solar PVMetoro–Cabo Delgado402020Planned
Solar PVVilanculo–Inhambane102023Planned
Solar PVDondo–Sofala302021Planned
Solar PVNacala–Nampula302022Planned
Solar PVBoane–Maputo302023Planned
Solar PVBalama–Cabo Delgado102023Planned
Solar PVCuamba–Niassa302020Planned
BiomassBiomassa–Salamanga302025–2030Conceptual
BiomassBiomassa–Moamba302025–2030Conceptual
BiomassSugarcane Association102025–2030Conceptual
Total1477
Source: Mozambique NDC Report, December 2018; * most likely year of start.
Table 10. Comparison of accumulated emissions (MtCO2eq) for the different scenarios.
PeriodBaselineNDC_REFIT
(32 MW)
REFIT_Policy
(250 MW)
NDC_MitigationREFIT_Ambition
(218 MW)
2020–202531.6531.6531.4830.4130.24
2025–203068.4168.0765.8759.3657.16
Table 11. Comparison of emission savings for the different scenarios in relation to the baseline.
PeriodBaselineNDC_REFIT
(32 MW)
REFIT_Policy
(250 MW)
NDC_MitigationREFIT_Ambition
(218 MW)
2020–2025-0.0%−0.5%−3.9%−4.5%
2025–2030-−0.5%−3.7%−13.2%−16.4%
Table 12. Key performance indicators to track the progress of the REFIT.
ParameterKey Performance IndicatorEntity Responsible for MeasuringEntity Responsible for Gathering and Providing DataMonitoring Frequency
GHG emission reductionkW/h supplied to the grid by a REFIT-supported energy provider sourceMITADERMIREME (EDM and DPC)Annual
Grid Emission FactorMITADERMIREME (EDM)Every three years
Utilization of national RE resourcesInstalled RE
capacity (MW) by source
MITADERMIREME (EDM, DPC)Annual
Expenses for implementing REFITLevel of tariff by sourceMIREME (DNE, ARENE, EDM)MIREME (DNE, ARENE, EDM) and MEFEvery three years
Sum of tariff′s payments by sourceMIREME (DNE, ARENE, EDM)MIREMEEvery three years
Social benefitsNumber of new businesses or investments and opportunitiesMIREME (DPC, DNE)MIREME (DPC, DNE)Annual
Additional households with access to basic electricity servicesMIREME (DPC, DNE)MIREME (DPC, DNE)Annual
Number of new jobs created through REFIT supported activities.MIREME (DPC, DNE)MIREME (DPC, DNE)Annual
Table 13. Barriers and gaps for MRV of the REFIT.
Type of MRVBarriers and Gaps for MRVSuggestions to Overcome the Barriers
GHG emission reductionWeak coordination between institutions
Insufficiently skilled technicians
Insufficient data availability
Lack of recurrent updates of the grid emission factor
Enhance institutional capacity building for MRV
Clear definitions of roles and responsibilities
MITADER should improve coordination between institutions
Improve mechanisms for data collection, processing, and sharing
Financial supportInsufficient financial resources availability for MRV
Insufficiently skilled capacities for budgetary allocations
Ensure financial mechanisms
Ensure a clear and transparent planning process
Enhance institutional capacity building
Technology development and transfer supportLack of consistent database for technology support received and needed
Lack of skilled capacities
Enhance institutional coordination and capacity building
Capacity-building support receivedInsufficiently skilled capacities for MRVMobilize financial and technical resources for institutional capacity building for MRV
Publisher’s Note: MDPI stays neutral with regard to jurisdictional claims in published maps and institutional affiliations.

