Abstract
The Shuangji River in Xinmi City is a tailwater-type river. Its main water sources are the effluent from the domestic sewage plant, the effluent from the paper industry sewage plant and the coal well. The construction of wastewater treatment facilities in Xinmi city has significantly reduced the amount of total phosphorus (TP) discharged into Shuangji River. However, phosphorus control in rivers where the overlying waters are predominantly tailwaters is still a challenge, especially as the sediment–water interface’s phosphorus exchange mechanism needs to be investigated in detail. In this study, the content and proportion of each phosphorus fraction in the sediment of a tailwater-type river, the Shuangji River, were determined. It was found that the organic phosphorus (OP) and iron-bound phosphorus (Fe-P) content and proportion were high, and the risk of release was relatively high in the section of the river where the overlying water was the tailwater of a sewage plant. Temperature, pH, dissolved oxygen, and hydraulic disturbance were also found to control phosphorus forms’ transformation and release in the sediment. Elevated temperatures mainly stimulated the release of OP and Fe-P from the sediments. The dissolution of calcium-bound phosphorus (Ca-P) is the main pathway for phosphorus release under acidic conditions, whereas, under alkaline conditions, phosphorus release is mainly controlled by ion exchange between OH− and Fe-P and metal oxide-bound phosphorus (Al-P). Aerobic versus anaerobic conditions cause changes in Fe-P content in the sediment mainly by changing Fe ions’ chemical valence. Hydrodynamic disturbance accelerates labile-P release, but once the hydrodynamic disturbance stops, the overlying water dissolved total phosphorus (DTP) concentration rapidly decreases to a similar concentration as before.
1. Introduction
Phosphorus is an essential nutrient in water ecosystems and is considered a key limiting factor in water bodies’ eutrophication [1,2]. Population growth, increased industrialization, agricultural activities, and urbanization have led to the pollution of the water of many rivers, lakes, and reservoirs, seriously affecting water resources [3,4,5]. Some phosphorus entering the river can be removed by self-purification, while some can be adsorbed by the particulate matter and sediment in the water and accumulated in the riverbed through natural sedimentation, and sediment acts as a phosphorus ‘sink’. Once the external environment changes, for example, the physical and chemical properties of the sediment change, the phosphorus concentration in the overlying water decreases, dissolved oxygen in the water decreases, and the sediment releases phosphorus into the overlying water and becomes an endogenous source of phosphorus in the river [6,7].
The determination of phosphorus fractions in sediments can help to understand the mechanism of phosphorus adsorption and sediment-overlying water phosphorus exchange, which is of great significance for water environment management and improvement [8,9,10,11]. Phosphorus in sediments is mainly inorganic and organic phosphorus. Different forms of phosphorus have different bioavailability and release capacities and contribute differently to eutrophication in water bodies. For most rivers, lakes, and reservoirs, sediments contain a relatively large proportion of inorganic phosphorus [12,13,14,15]. Based on the activity or potential bioavailability of phosphorus, Kaiserli et al. [16] classified phosphorus forms in sediments as loosely adsorbed phosphorus (labile-P), iron-bound phosphorus (Fe-P), metal oxide-bound phosphorus (Al-P), organic phosphorus (OP), calcium-bound (Ca-P), and residual phosphorus (Res-P). Labile-P, Fe-P, and OP are considered relatively active forms in sediments and are easy transformed by transport at the sediment-water interface [17,18]. Labile-P is considered a significant indicator of sediment phosphorus bioavailability because it occurs as orthophosphate in pore water and can be taken up directly by algae, contributing to the water column eutrophication [19]. It has been shown in some research that the amount of Fe/Al-P in sediments is influenced by human activities, generally from domestic sewage and industrial effluent discharges [20,21]. Based on the stability of OP, Ivanof et al. [22,23] classified organophosphorus as labile organic phosphorus (LOP), moderately labile organic phosphorus (MLOP) and non-labile organic phosphorus (NLOP). The amount and composition of organic phosphorus in the sediment affects the conversion of organic phosphorus to dissolved inorganic phosphorus during sediment resuspension. Additionally, OP can promote phytoplankton and algal growth through degradation and conversion to soluble reactive phosphorus (SRP) [23,24,25]. Ca-P is usually closely related to endogenous element accumulation in carbonates from rock debris and soils in watersheds. Ca-P and Res-P are considered to be the most stable forms in sediments [21].
Changes in external environmental factors significantly influence sediment phosphorus release; sediment phosphorus release is influenced by more than one factor and generally depends on a combination of influencing factors. Jiang et al. [26] investigated the effects of living activity, light, temperature, and dissolved oxygen on sediment phosphorus release in Taihu Lake and found that: microorganism metabolism can change the microenvironmental state of sediment; and light, temperature, and dissolved oxygen have a more significant effect on phosphorus release. Li et al. [27] studied the effect of substrate oxidation on phosphorus transformation in three shallow eutrophic lakes (Taihu Lake, Chaohu Lake, and Dianchi Lake) in China, and the results showed that substrate oxidation will promote the conversion between different forms of phosphorus in sediments, providing a scientific basis for eutrophic lake management. Wang et al. [28] studied the effect of different disturbance conditions on sediment phosphorus release. The results showed that the release intensity of dissolved total phosphorus (DTP), soluble reactive phosphorus (SRP), and dissolved organic phosphorus (DOP) increased with the increase in disturbance intensity. The equilibrium time of DTP in the overlying water was about 16 h after the release of phosphorus from heavily polluted sediments and 8 h for lightly polluted sediments. After the cessation of disturbance, DTP, SRP, and DOP in the overlying water all showed a rapid decrease and gradually reached equilibrium, indicating the buffering capacity of the sediment in the disturbance conditions. These studies show that environmental factors on phosphorus release help understand the phosphorus exchange mechanism at the sediment-water interface and guide the water environment’s management.
Shuangji River in Xinmi City is a tailwater-type river. The section above the river, where the Qingshi River joins the Shuangji River, was cut off. The natural runoff flow is small, and Shuangji River mainly consisting of the tailwater from the sewage treatment plant, the tailwater from the paper wastewater treatment plant, and the water from the coal mine, which is the main drainage and pollution channel in Xinmi city. With the implementation of point and non-point source pollution control measures in Xinmi city, the river’s phosphorus content has gradually decreased. However, the outflow section still often exceeds the surface water grade III standard, especially in summer and autumn. After site visits and indoor sediment phosphorus release experiments, it is suspected that high-temperature conditions have promoted the release of phosphorus, increasing the phosphorus exchange flux between the sediment-overlying water.
This study investigates the content and distribution of various phosphorus fractions in sediments of the Shuangji River basin in Xinmi City and the influence of environmental factors on phosphorus release to provide practical information and control directions for the water environment managers.
2. Materials and Methods
2.1. Study Area
The source of the Shuangji River is located in the northwest mountainous area of Xinmi City, and the Shuangji River is part of the Shaying River system in the Huai River basin, with a total length of 204 km and a basin area of 1941 km2. The river flows from west to east, passes through Xinmi city, Xinzheng city, and finally merges into the Jialu River. The mainstream in Xinmi city is about 53 km long, with an average slope drop of about 3.3‰. Xinmi has a continental monsoon climate in the northern temperate zone, with an average annual temperature of 14.3 °C. The wind direction is mostly northwest and southeast, and the maximum wind speed is 22 m/s. The average annual precipitation is 650 mm. Due to the influence of the monsoon climate, the annual precipitation is uneven. Summer precipitation accounts for approximately 50% of the annual precipitation, spring precipitation approximately 21% of the annual precipitation, and autumn precipitation approximately 25% of the annual precipitation; winter precipitation only accounts for about 4% of the annual precipitation. The annual average evaporation is 1400 mm. The terrain of Xinmi City is complex, with an altitude above sea level of 114–1108.5 m. There are mountains in the west, north, and south, with hills and valleys in the middle and plains in the east. Mountainous area accounts for 21.2% of the total area; hilly area accounts for 57.3% of the total area.
The Xinmi city section of the Shuangji River has very little natural runoff, and the upstream is dry. The main water volume comes from the domestic sewage plant’s tailwater, the papermaking wastewater, and the coal mine, which has become the main tailwater river in Xinmi city. The daily volume of outbound water is about 55,000 m3, the water quality is weakly alkaline, with an average pH of 7.94, and the hydrogeology is loose rock pores water. In 2017, the annual average values of chemical oxygen demand (COD), ammonia nitrogen (NH3-N), and total phosphorus (TP) of the Shuangji River provincial control monitoring section were 39.22, 1.74, and 0.26, respectively. It is urgent to control pollution sources in the Shuangji River basin to reach the Class III surface water goal.
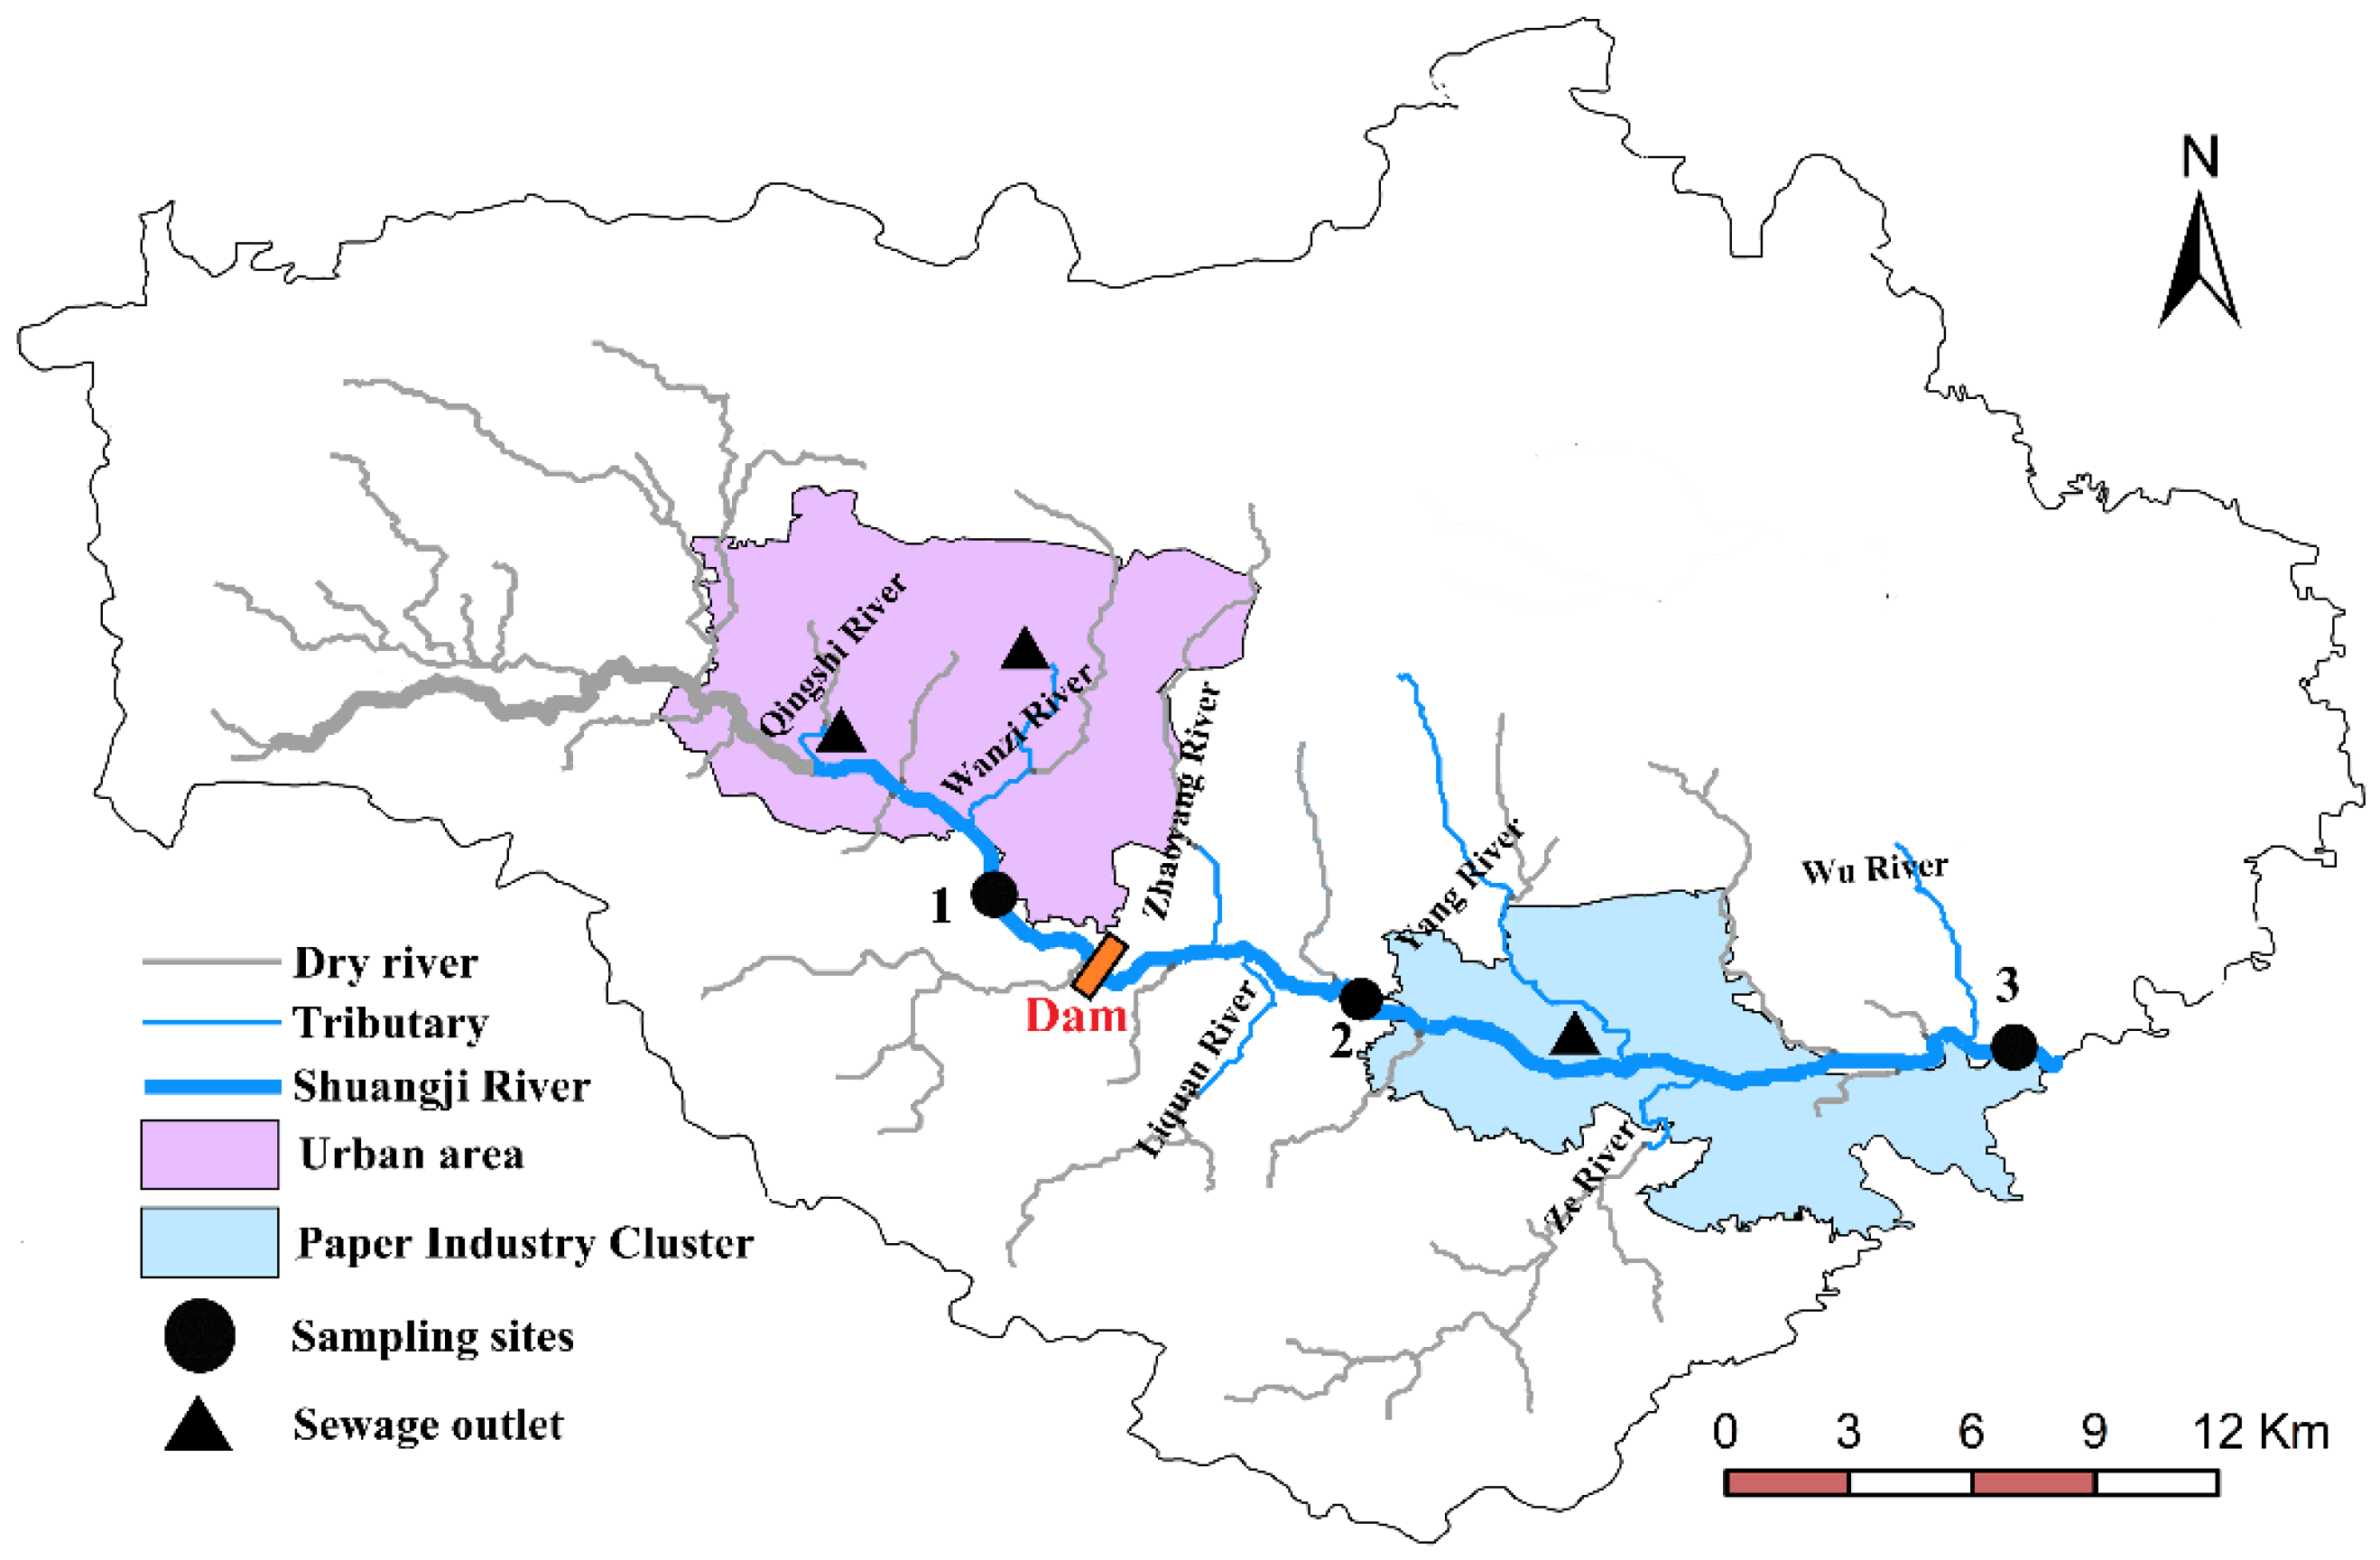
The geographical location of the main river and tributaries in the study area is shown in Figure 1. The flows are shown in Table 1. The Shuangji River upper section was intercepted by a storage dam in Chaohua town. The storage dam is about 40 m long, 8 m wide and 2.5 m high, and the water surface area reaches 15,000 square meters. Most of the water stored in the storage dam flows to the Caomagou reservoir through the Dongfanghong irrigation canal. The Dongfanghong irrigation canal is the largest gravity irrigation canal in Xinmi City and the main canal is 30 km long and irrigates 43 villages in five townships (towns), with a total of about 2400 hectares of cultivated land. Part of the water transported to Caomagou reservoir is used as cooling water for nearby power plants, and a small part of the water (about 0.034 m3/s, Table 1) flows into the lower reaches of the Shuangji River through the Wu River.
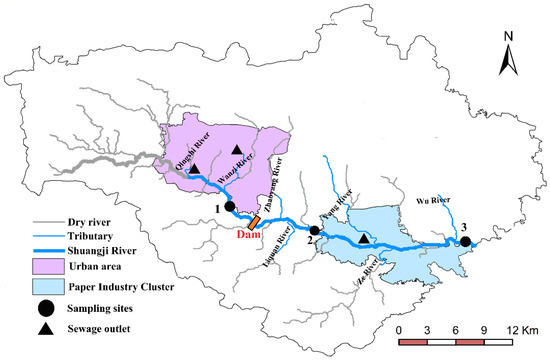
Figure 1.
Study area and sampling site distribution.

Table 1.
Basic information of Shuangji River Basin in Xinmi City
2.2. Sampling Sites and Sample Collection
In this study, three sampling sites representing different overlying water types were set up on the mainstream, and the sampling sites were shown in Figure 1.
Water samples were collected three times a month between July 2019 and October 2020. The water samples were collected from each sampling site at triplicate, mixed well and filled into pre-cleaned 500 mL polyethene plastic bottles, stored in a 4 °C portable refrigerator, and sent to the laboratory immediately after sampling for COD, NH3-N, and total TP. pH and dissolved oxygen (DO) were determined in situ using portable testing instruments.
In this study, four sediment collection activities were conducted at three sampling sites in January, April, July, and October 2020, and a total of 12 samples were collected. In each sampling activity, three groups of surface sediment (about 10 cm) were collected using a grabber-type sediment collector at each sampling site and mixed evenly and placed in plastic bags as final samples, drained of air, marked, and stored in a 4 °C portable refrigerator, and the samples were sent back to the laboratory for pre-processing immediately after the sampling was completed.
The collected sediments were freeze dried and ground and sieved through a 100 mesh screen before phosphorus fraction analysis.
2.3. Sample Analysis
COD was analyzed using the dichromate method, NH3-N was determined by Nessler’s reagent spectrophotometry, and TP was determined by the ammonium molybdate spectrometric method.
Phosphorus in sediments can be classified as inorganic phosphorus (IP) and organic phosphorus (OP). According to the sequential extraction method, inorganic phosphorus in sediments can be classified into labile-P, Fe-P, Al-P, Ca-P, and res-P [4]. TP and IP were determined using the standards, measurements and testing program (SMT), and OP was the difference between TP and IP [29].
2.4. Sediment Phosphorus Release Experiment
10 g of the original sediment was evenly laid flat in a 1000 mL beaker and 500 mL of distilled water was slowly injected along the beaker wall; 20 mL of the overlying water was collected with a syringe every 12 h, filtered through a 0.45 μm fiber filter membrane, and the DTP content in the water was determined by the ammonium molybdate spectrometric method after sampling, immediately supplemented with 20 mL of distilled water.
2.4.1. Effect of Temperature on Phosphorus Release
To simulate the differences in phosphorus release from sediments caused by temperature changes in the four seasons in the Shuangji River basin, three sets of beakers were placed in 5, 15, and 25 °C for phosphorus release experiments.
2.4.2. Effect of pH on Phosphorus Release
NaHCO3 or dilute sulfuric acid was dissolved in 500 mL of distilled water, and the pH was adjusted to 4, 6, 7, 8, and 10, and then slowly injected along the beaker walls to perform phosphorus release experiments in the same room temperature (about 15 °C).
2.4.3. The Effect of Dissolved Oxygen on Phosphorus Release
Aerobic experiments were conducted by micro-aeration of the overlying water through a micro-inflatable pump, and dissolved oxygen in the water was measured at intervals to maintain it at DO > 5 mg/L. The anaerobic experiment replaced the beaker with a 1000 mL pumping bottle with a thin tube inserted on the cap and a clamp controlling the tube’s mouth. Nitrogen was passed through the micro-inflatable pump once a day for about 30 min each time. Immediately after the end of the aeration, the exhaust pipe was tightly sealed. The two groups of experiments were conducted at room temperature (about 15 °C).
2.4.4. Effect of Hydraulic Disturbance on Phosphorus Release
This experiment simulated four groups of experiments with different flow velocities by using different rotational speeds of the thermostatic oscillator, with flow velocities of 0, 0.2, and 0.4 m/s. The purpose was to investigate the effect of flow velocity on phosphorus release from the sediment, and the empirical equation between oscillator speed and flow velocity was adopted from the research results of Wang et al. [30]; the equation is shown in (1), and the set rotational speeds were 0, 110 and 160 r/min:
where v refers to the flow velocity (m/s) and ω refers to the rotational speed (r/min).
2.4.5. Sediment Phosphorus Release Fluxes and Release Rates
As time increases, phosphorus is gradually released from the sediment into the overlying water, and the release rate and amount released can be calculated using Equations (2) and (3).
In the equations: r represents the release rate in mg/(m2·h); V is the volume of overlying water in L; , and are, respectively, the nth, initial concentration and j − 1th collection phosphorus concentration in the overlying water at the time of the water sample in mg/L; represents the volume of the water sample collected for the j − 1th time in L; is the concentration of the supplementary overlying water in mg/L; A is the sediment and the contact area of the overlying water in m2; t is the time in hours; and W is the amount of phosphorus released from the sediment during tin mg.
2.5. Statistical Analysis
The water samples and sediment samples measured in the experiment were expressed by the mean (±SD). The difference of pollutant concentration and sediment phosphorus content among different sampling sites and the influence of different environmental factors on phosphorus release in sediments were analyzed by nonparametric tests based on the K independent sample test (Kruskal-Wallis test). Pearson’s correlation coefficients calculated by Equation (4) were used to test the correlation between variables. We use OriginPro 2019b (OriginLab, Northampton, MA, USA) to generate graphics, using IBM SPSS Statistics 26.0 for Windows for data statistics and performing analyses.
and represent the values of two variables; and represent the mean value of two variables; n represents the number of samples; and and represent the sample standard deviation of the two variables.
3. Results and Discussion
3.1. Water Quality Status
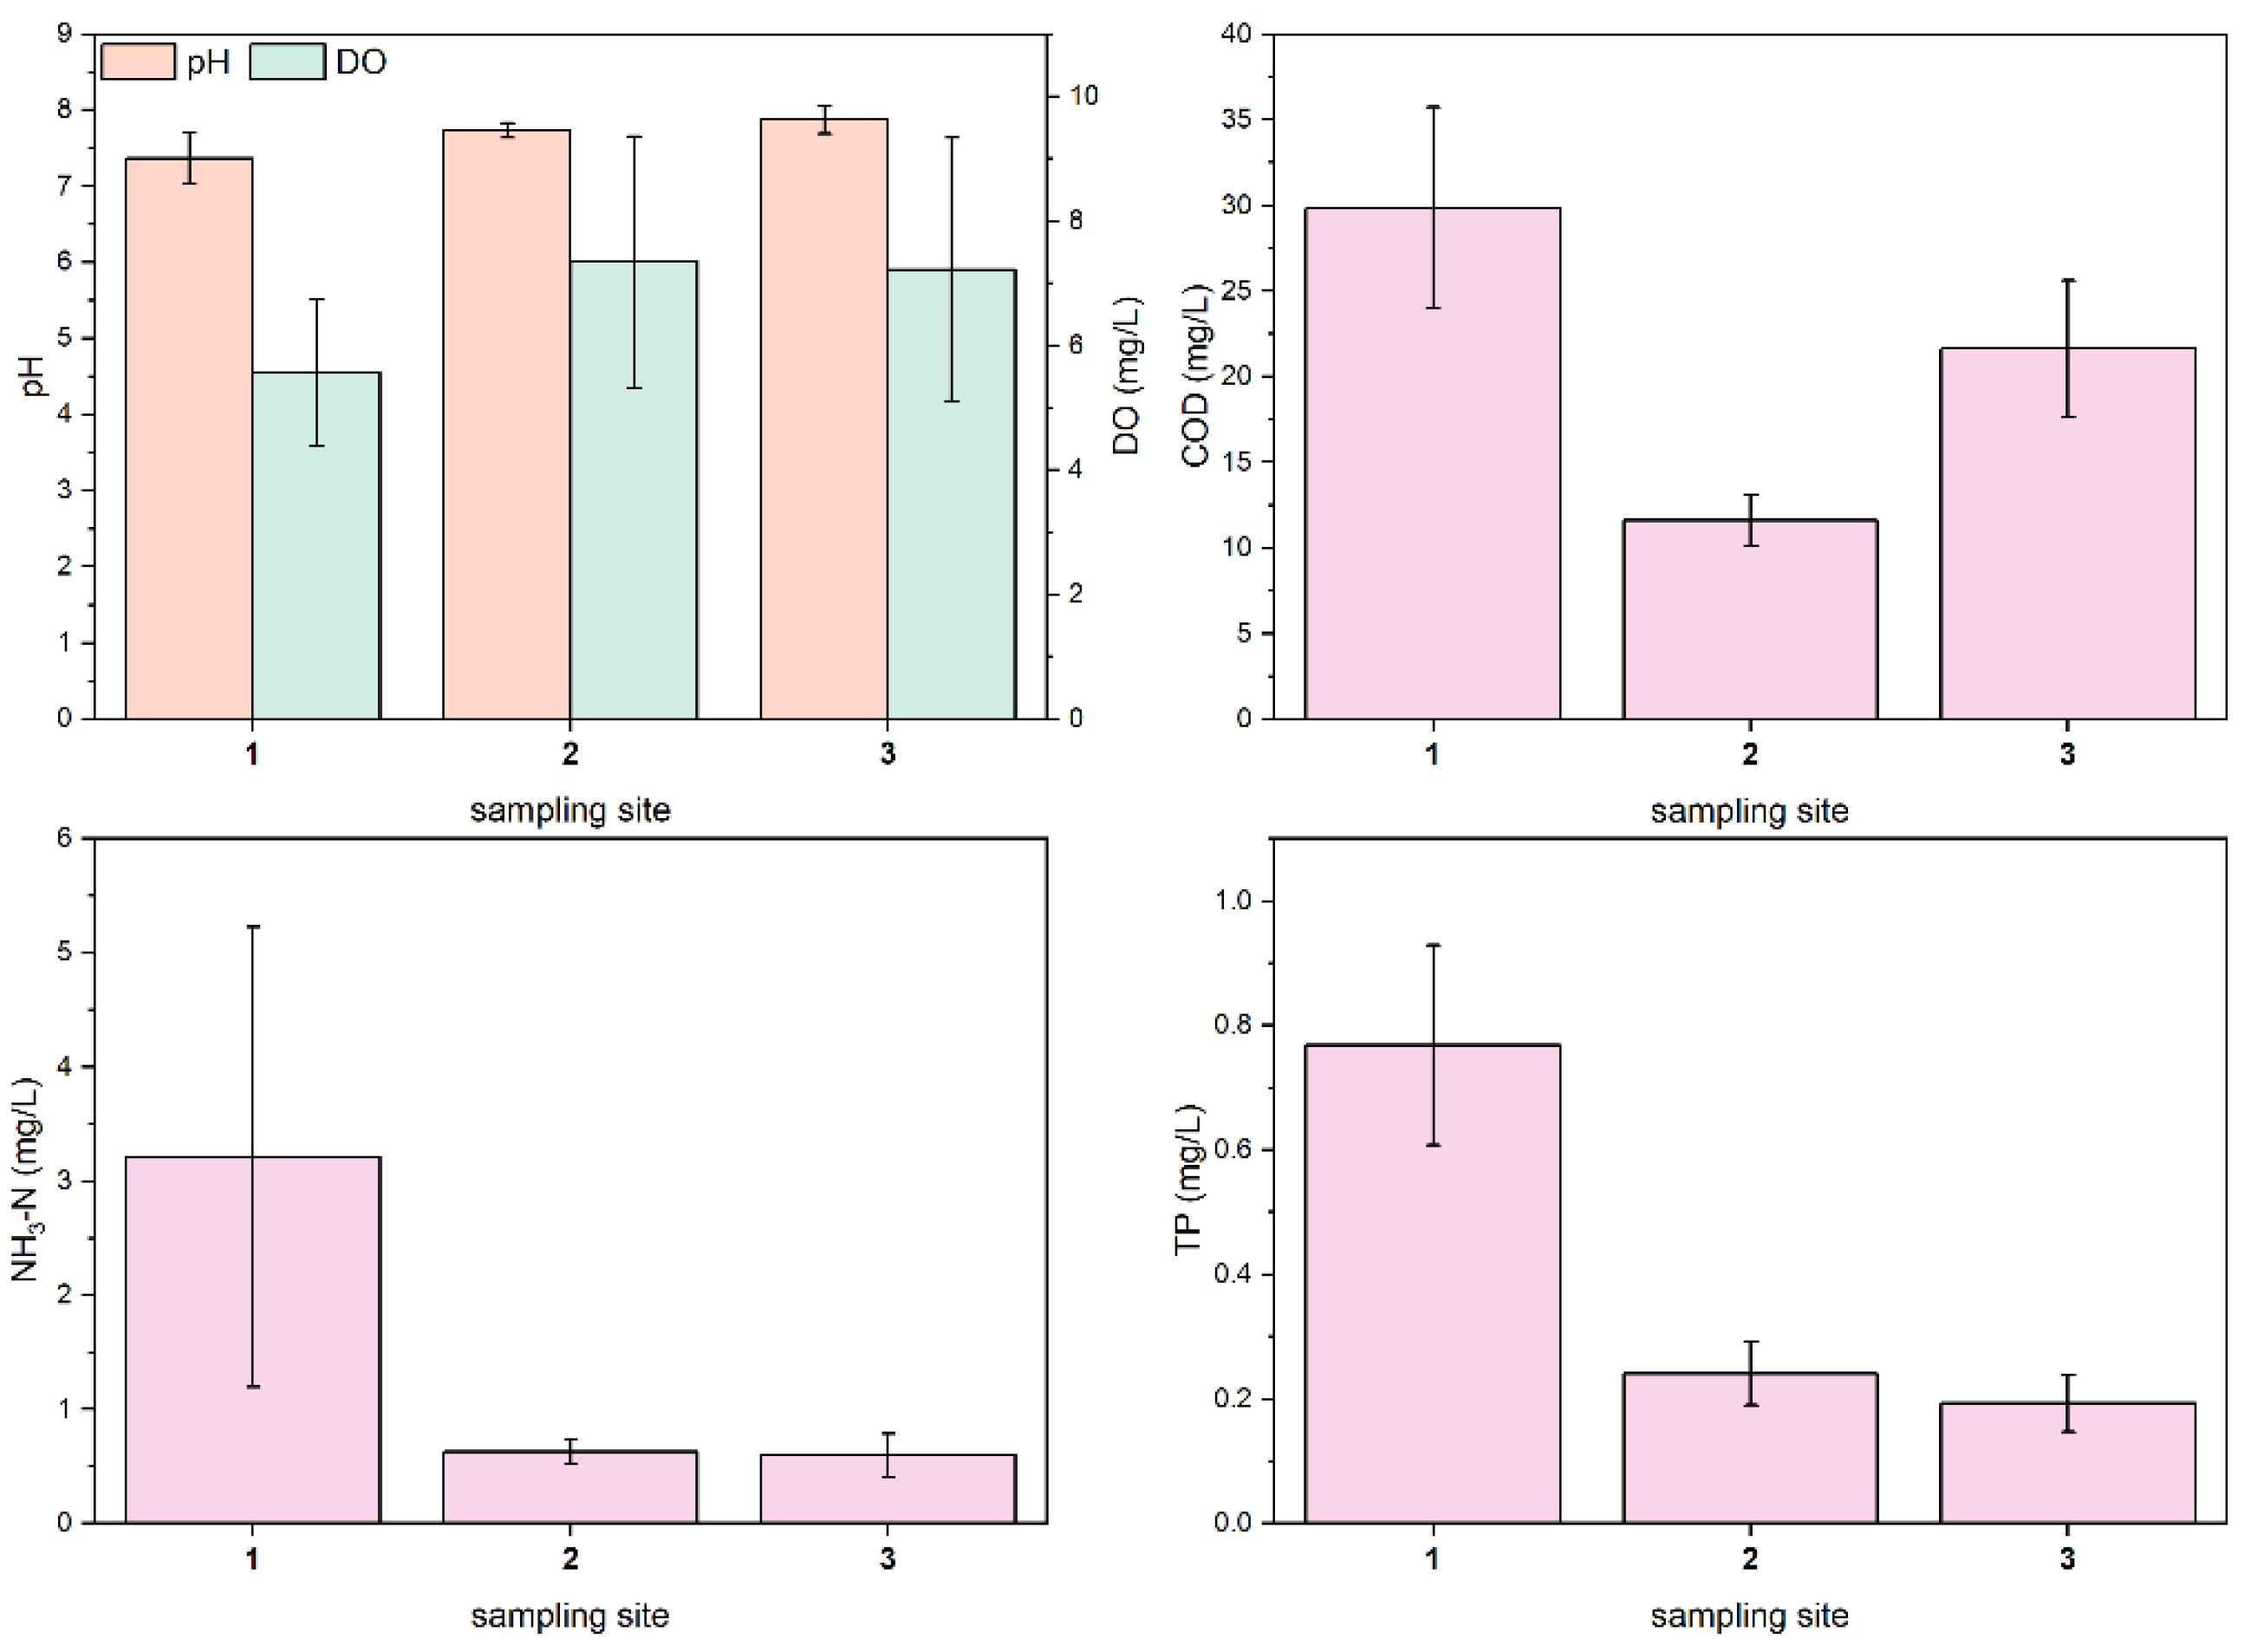
Figure 2 shows the histogram of the mean values of each water quality parameter. According to the Chinese Surface Water Class III Standard (pH: 6–9; DO ≥ 5 mg/L; COD ≤ 20 mg/L; NH3-N ≤ 1 mg/L; TP ≤ 0.2 mg/L), all sampling sites do not meet water quality standards. Using sampling site 1 to represent the upstream section of the Shuangji River in Xinmi city, sampling site 2 to represent the midstream section, and sampling site 3 to represent the downstream section. The average COD values of the upstream reach, the middle reach, and the downstream reach were 29.88 ± 5.86, 11.59 ± 1.51 and 21.63 ± 3.97 mg/L, respectively. The average values of NH3-N were 3.21 ± 2.02, 0.63 ± 0.10, and 0.60 ± 0.19 mg/L, respectively. The mean values of TP were 0.77 ± 0.16, 0.24 ± 0.05, and 0.19 ± 0.05 mg/L. The mean pH values were 7.37 ± 0.34, 7.74 ± 0.10 and 7.87 ± 0.18. The mean values of DO were 5.56 ± 1.18, 7.34 ± 2.02 and 7.21 ± 2.12 mg/L, respectively. We found that, along the river flow: pH gradually increased; DO first increased and then decreased; COD first decreased and then increased; NH3-N and TP concentrations decreased sharply and then slowly. The Kruskal-Wallis test results (Table 2) showed that there were significant differences in pH, DO, COD, NH3-N, and TP in the upper reaches, middle reaches, and downstream reaches (p < 0.01). The main reason for the significant difference in pollutant concentration between different river sections is the difference in the types of overlying water. The water in the upper reaches of the river mainly comes from the effluent of the two domestic sewage plants, and the characteristics of the river’s water quality depend on the pollutant treatment efficiency of the domestic sewage plants. Groundwater from coal mining flows into the river, greatly diluting the concentration of pollutants in the middle reaches of the river. In the downstream reach, the overlying water is a mixture of coal mine well water, papermaking wastewater treatment plant tailwater, and domestic wastewater plant tailwater, with a high organic content in the tailwater from the paper wastewater treatment plant, resulting in an increase in COD in the river water.
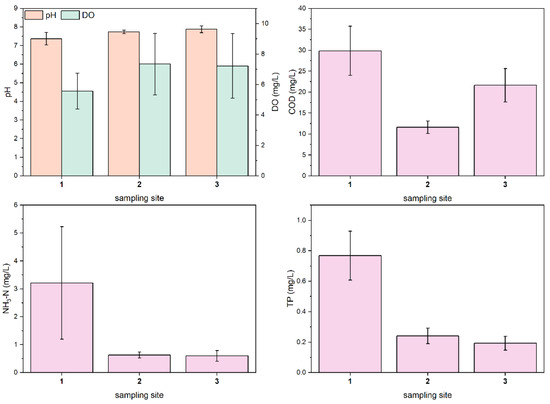
Figure 2.
Mean values of water quality parameters at three sampling sites in the Shuangji River, Xinmi City.

Table 2.
Kruskal–Wallis Test Statistics.
3.2. Spatial and Temporal Distribution Characteristics of Phosphorus in the Overlying Water
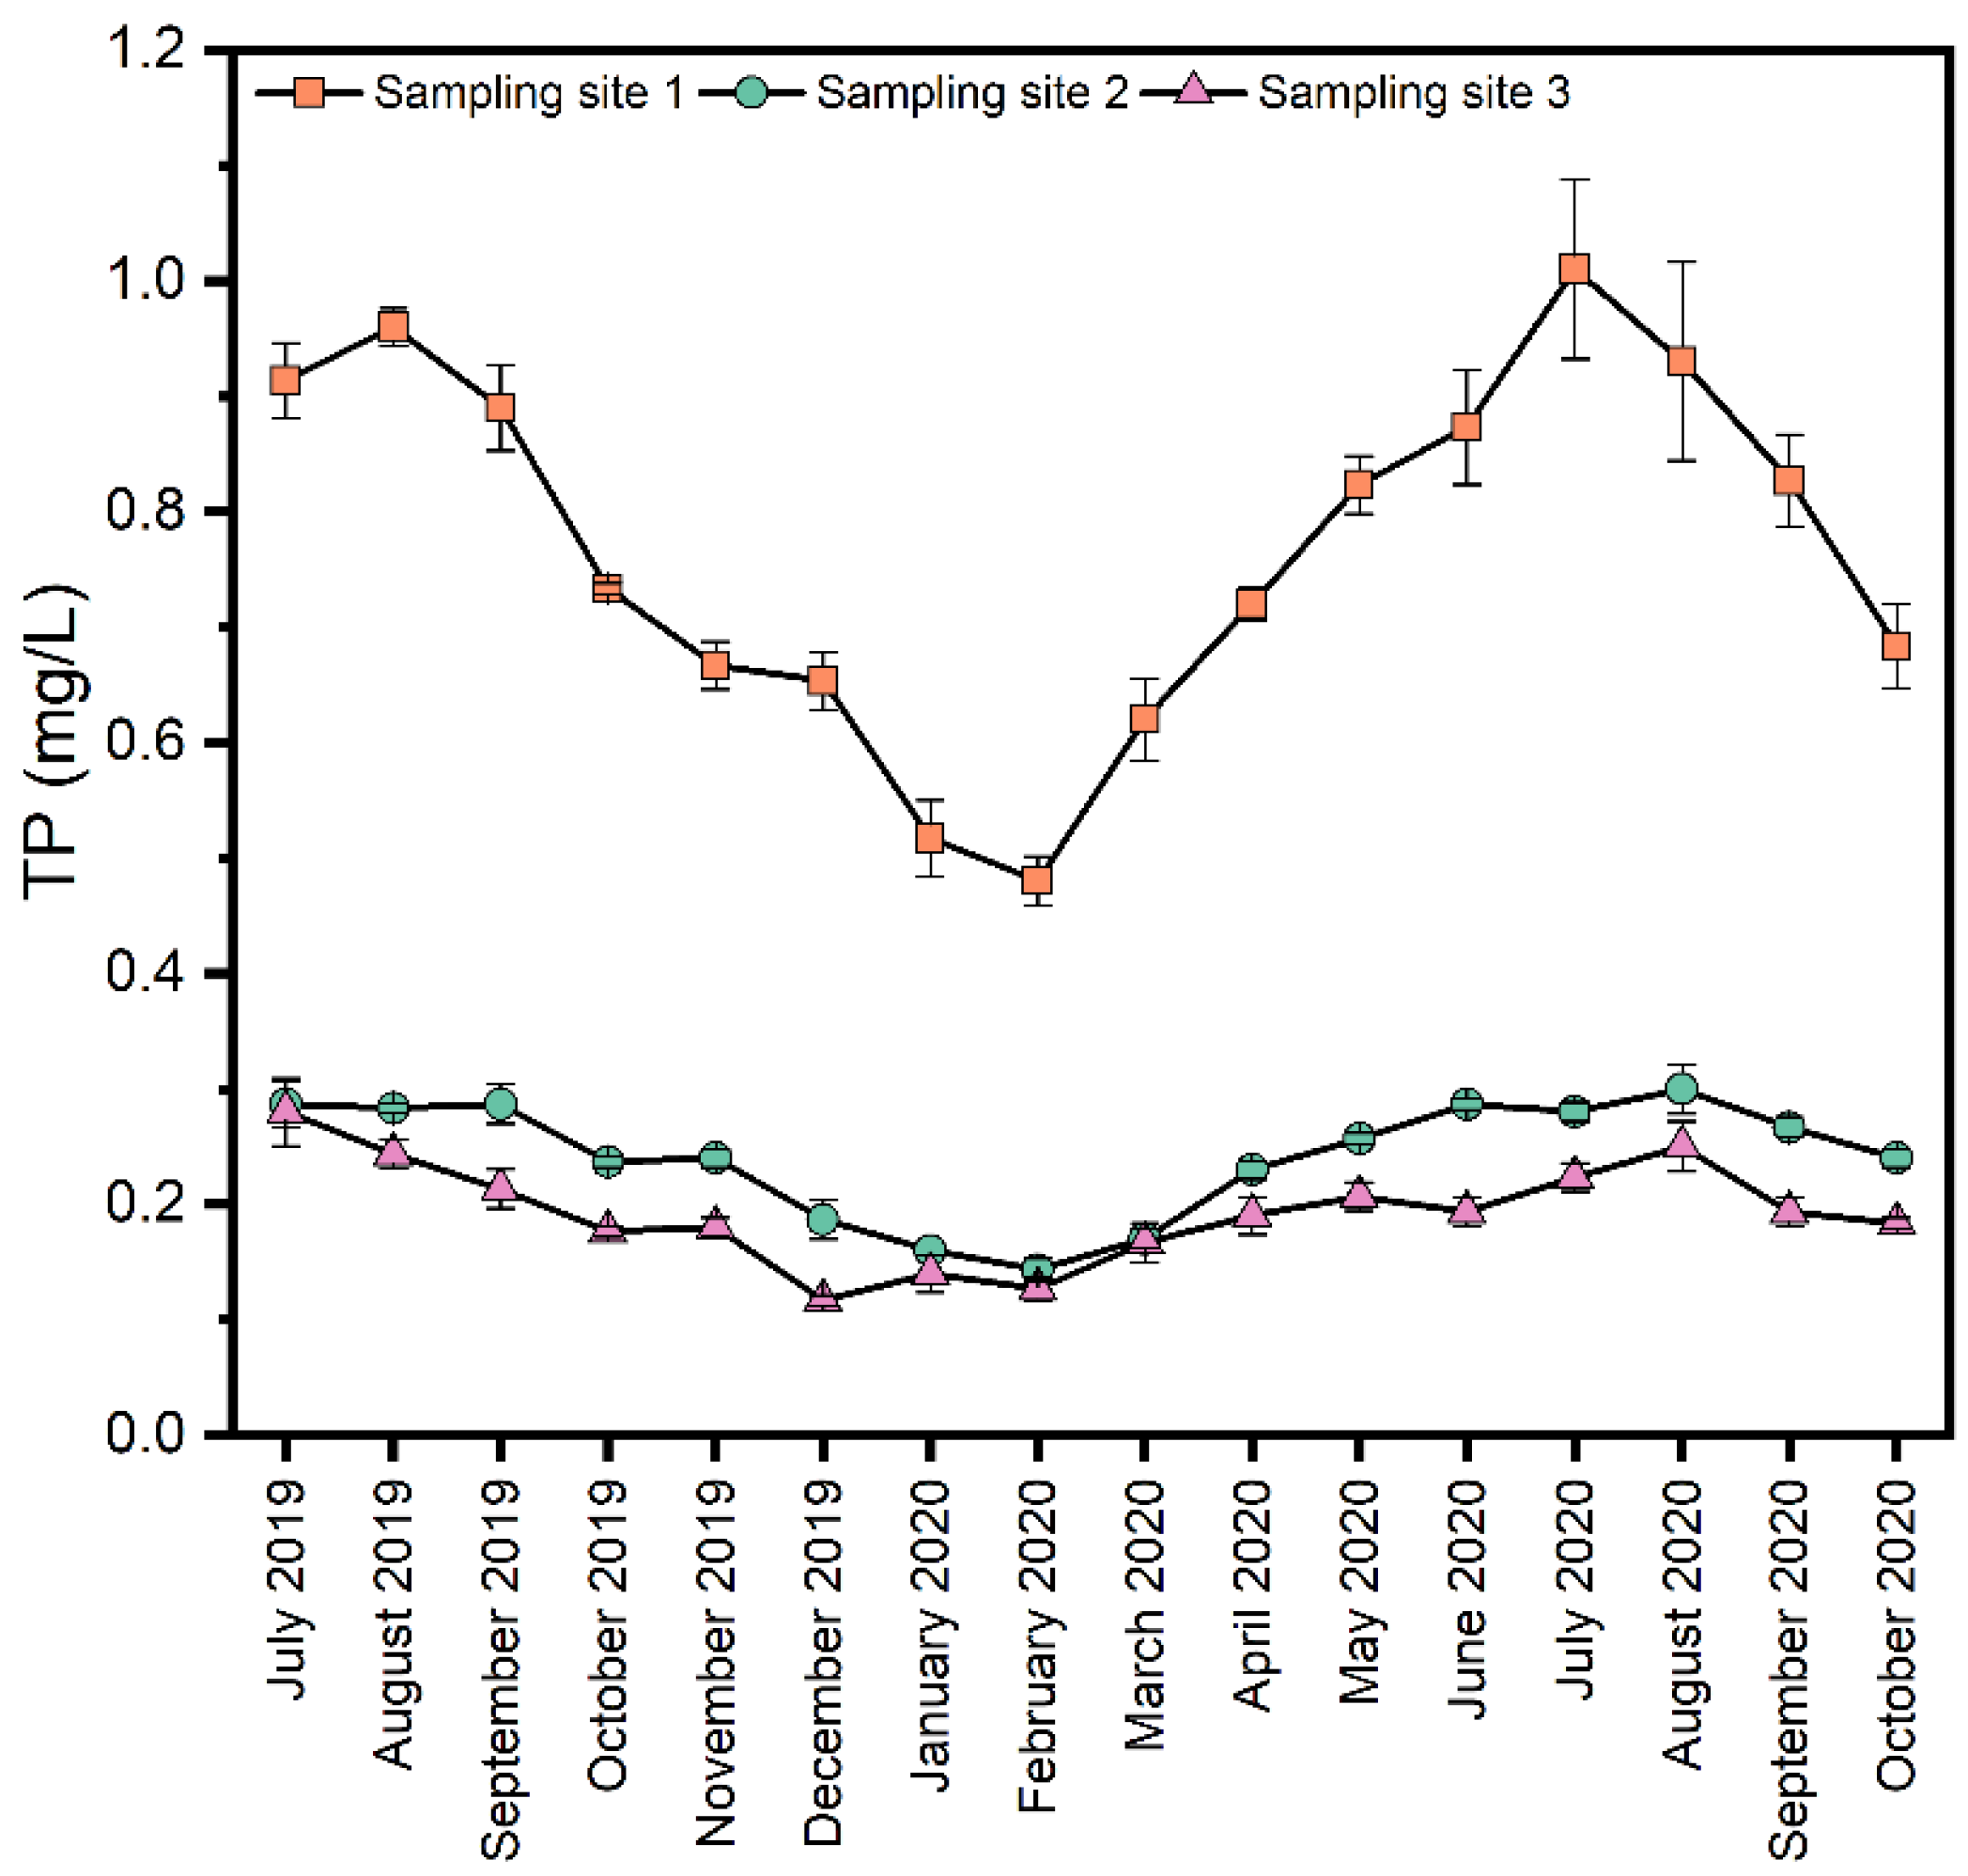
As shown in Figure 3, in terms of spatial distribution, the TP concentration in the upstream river section was much higher than that in the midstream and downstream river sections. The water in the upper reaches mainly comes from the effluent from two domestic sewage plants, and there is no dilution of clean water sources. In addition, there is some domestic sewage directly discharged into the river, resulting in high phosphorus concentration in the water body. The water in the middle reaches mainly comes from the discharge of groundwater generated during coal mining. The phosphorus in this reach mainly comes from the effluent from the rural sewage treatment station along the river and the discharge from a small amount of rubber dams. Therefore, a large amount of clean groundwater significantly dilutes the pollution in the water body. In terms of temporal distribution, the TP in the overlying water in the whole river section of Xinmi City was high in summer and autumn and low in winter. The correlation (Table 3) between water quality parameters showed that TP and DO were negatively correlated. Numerous investigations have shown that the high temperature and low dissolved oxygen in summer and autumn led to the reduction of redox potential in the sediment, Fe3+ was reduced to Fe2+ and phosphorus was released from the sediment to the water, resulting in higher TP concentration in the water [6,31,32,33]. The sediment’s increased biological activity during the summer and autumn seasons, coupled with the influence of hydraulic flow, caused the sediment’s resuspension, resulting in increased turbidity and increased particulate phosphorus content in the water, which further increased the TP content in the water. The TP negatively correlated with pH at sampling sites 3 in the downstream section of the river, indicating a slight increase in pH would reduce the water’s TP content. Due to the different pulping processes used by dozens of paper enterprises in Dajui Town, tailwater discharge is not continuous and stable but concentrated at certain times, leading to unstable pH in the downstream section of the Shuangji River. According to continuous monitoring results, the overall trend of pH in the downstream section of the river is slightly higher than that in the midstream section, which may be one of the reasons why the TP concentration in the downstream section of the river is slightly higher than that in the midstream section.
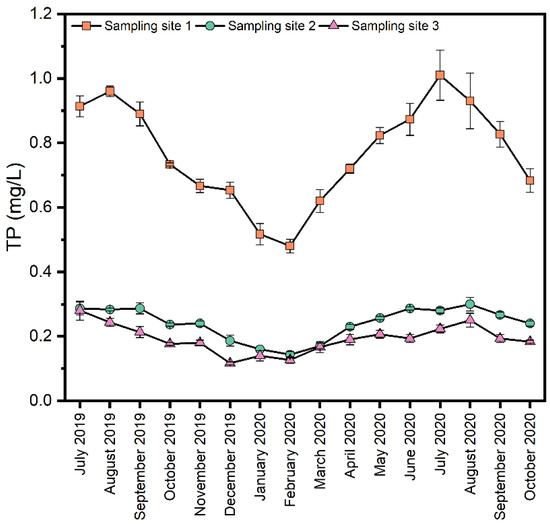
Figure 3.
Spatial and temporal trends of TP concentrations in the Shuangji River, Xinmi City.

Table 3.
Correlation between water quality parameters.
3.3. Sediment Phosphorus Fraction
The results of the four sediment sampling and phosphorus composition measurements in 2020 are shown in Table 4, which shows that the phosphorus content in the surface sediments of the upstream, midstream, and downstream reaches of the Shuangji River in Xinmi City varied greatly. IP content was dominant in all three sampling sites, accounting for 55.5%, 67.6%, and 56.7%, respectively, indicating that phosphorus in the sediment mainly existed in the form of IP.

Table 4.
Average content of different phosphorus forms in surface sediments of three sampling sites.
OP is phosphorus-bound to humic acid through biomineralization and chemical decomposition and can promote the growth of phytoplankton as it degrades into soluble reactive phosphorus that algae can easily absorb [4]. As can be seen from Figure 4, sampling sites 1 and 3 had a high proportion of OP, 44.46% and 43.31%, with levels of 723 and 447 mg/kg, respectively, while the midstream reaches only had 176 mg/kg of OP. Some studies have shown that OP in sediments is related to biotic action and is more influenced by humans [21]. For IP, sampling sites 1 and 3 contained relatively high Fe-P levels at 389 and 196 mg/kg, respectively, accounting for 23.92% and 18.99%, respectively, much higher than sampling site 2 in the middle reaches. Fe-P is a redox-sensitive phosphorus component in sediments, mainly as a combination of phosphorus and iron hydroxides or manganese oxides, and is considered a potential mobile pool; Fe-P is highly mobile in sediments, and its release potential is influenced by many environmental factors such as particle size, pH, and redox potential [34,35,36]. Higher Fe-/Al-P is usually derived from anthropogenic inputs, particularly industrial wastewater and domestic sewage [20,21]. The proportion of Ca-P at sampling site 2 is high at 53.25%, while Fe-P is relatively small at 7.79%. Ca-P is usually closely associated with the endogenous elemental accumulation of carbonate in watershed rock fragments and soils and is a relatively stable inorganic phosphorus component that is released to water under acidic conditions. Res-P is extraordinarily stable and, similar to Ca-P, can accumulate permanently in the sediment through burial processes. Except the res-P, the other phosphorus fraction were significantly different under different sampling sites (p < 0.05).

Figure 4.
The proportion of each phosphorus fraction to TP in the surface sediments of the Shuangji River, Xinmi City.
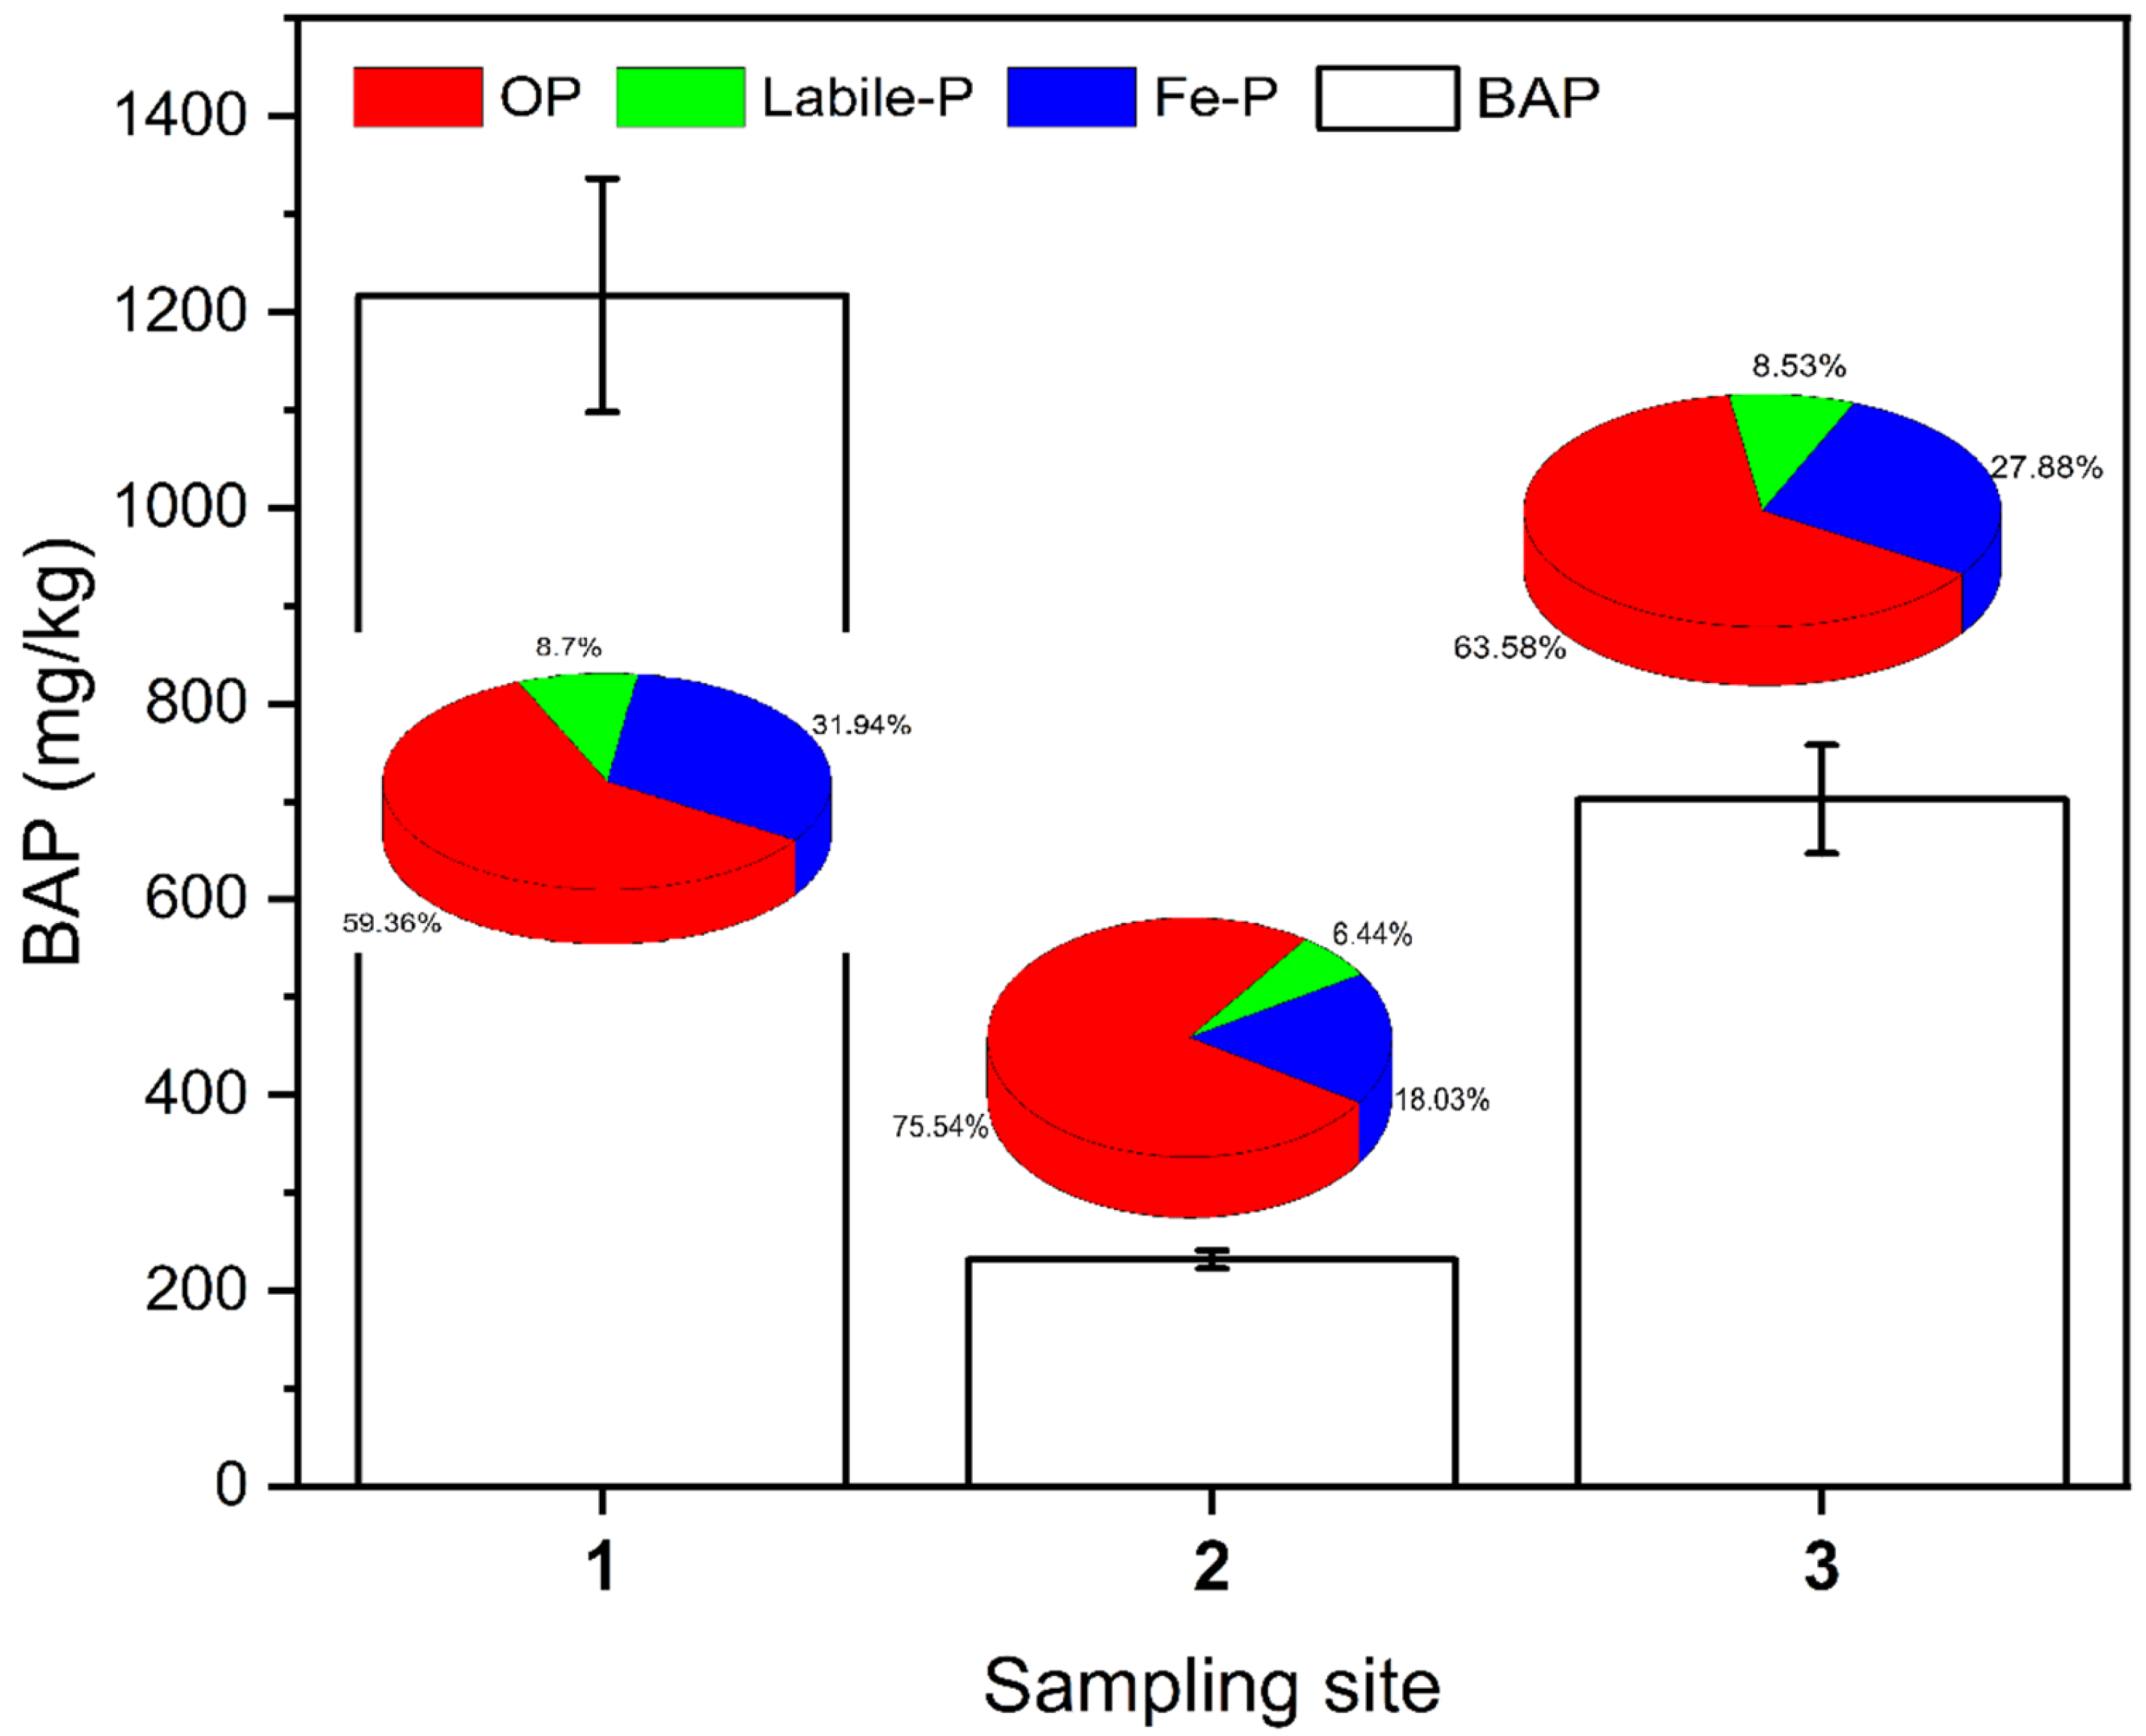
Biologically active phosphorus (BAP) refers to phosphorus that is easily released from the sediment and used by algae and phytoplankton [4,34]. Based on the neutral or alkaline hydrological characteristics of the Shuangji River basin in Xinmi City, Ca-P is not easily released. Labile-P, Fe-P, and OP were used as biologically active phosphorus in this study, and the BAP content was calculated as shown in Figure 5. The mean value of BAP in the surface sediment at sampling site 1 in the upstream section was 1218 mg/kg, at sampling site 2 in the midstream section was 233 mg/kg, and at sampling site 3 in the downstream section was 703 mg/kg, and there was a significant difference in BAP content among different river sections (p < 0.05). The BAP had a very high percentage of OP, with 59.36%, 75.54%, and 63.58%, respectively (Figure 5). For the upstream and downstream reaches, which are heavily influenced by human activities, the Fe-P composition is significantly higher than that of the midstream reaches.
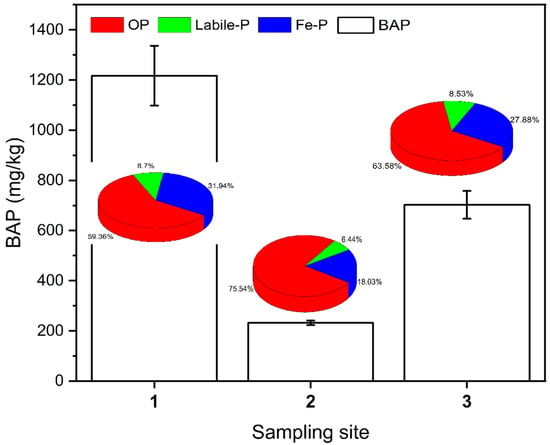
Figure 5.
BAP content and proportion of each component in the surface sediments of the Shuangji River, Xinmi City.
In general, the phosphorus content and distribution in the surface sediments of the Shuangji River in Xinmi City are influenced by human activities. The discharge of domestic sewage and industrial wastewater increases the sediment’s phosphorus content, especially OP and Fe-P.
3.4. Factors Influencing Phosphorus Release from Sediments
3.4.1. Effect of Temperature on Phosphorus Release from Sediments
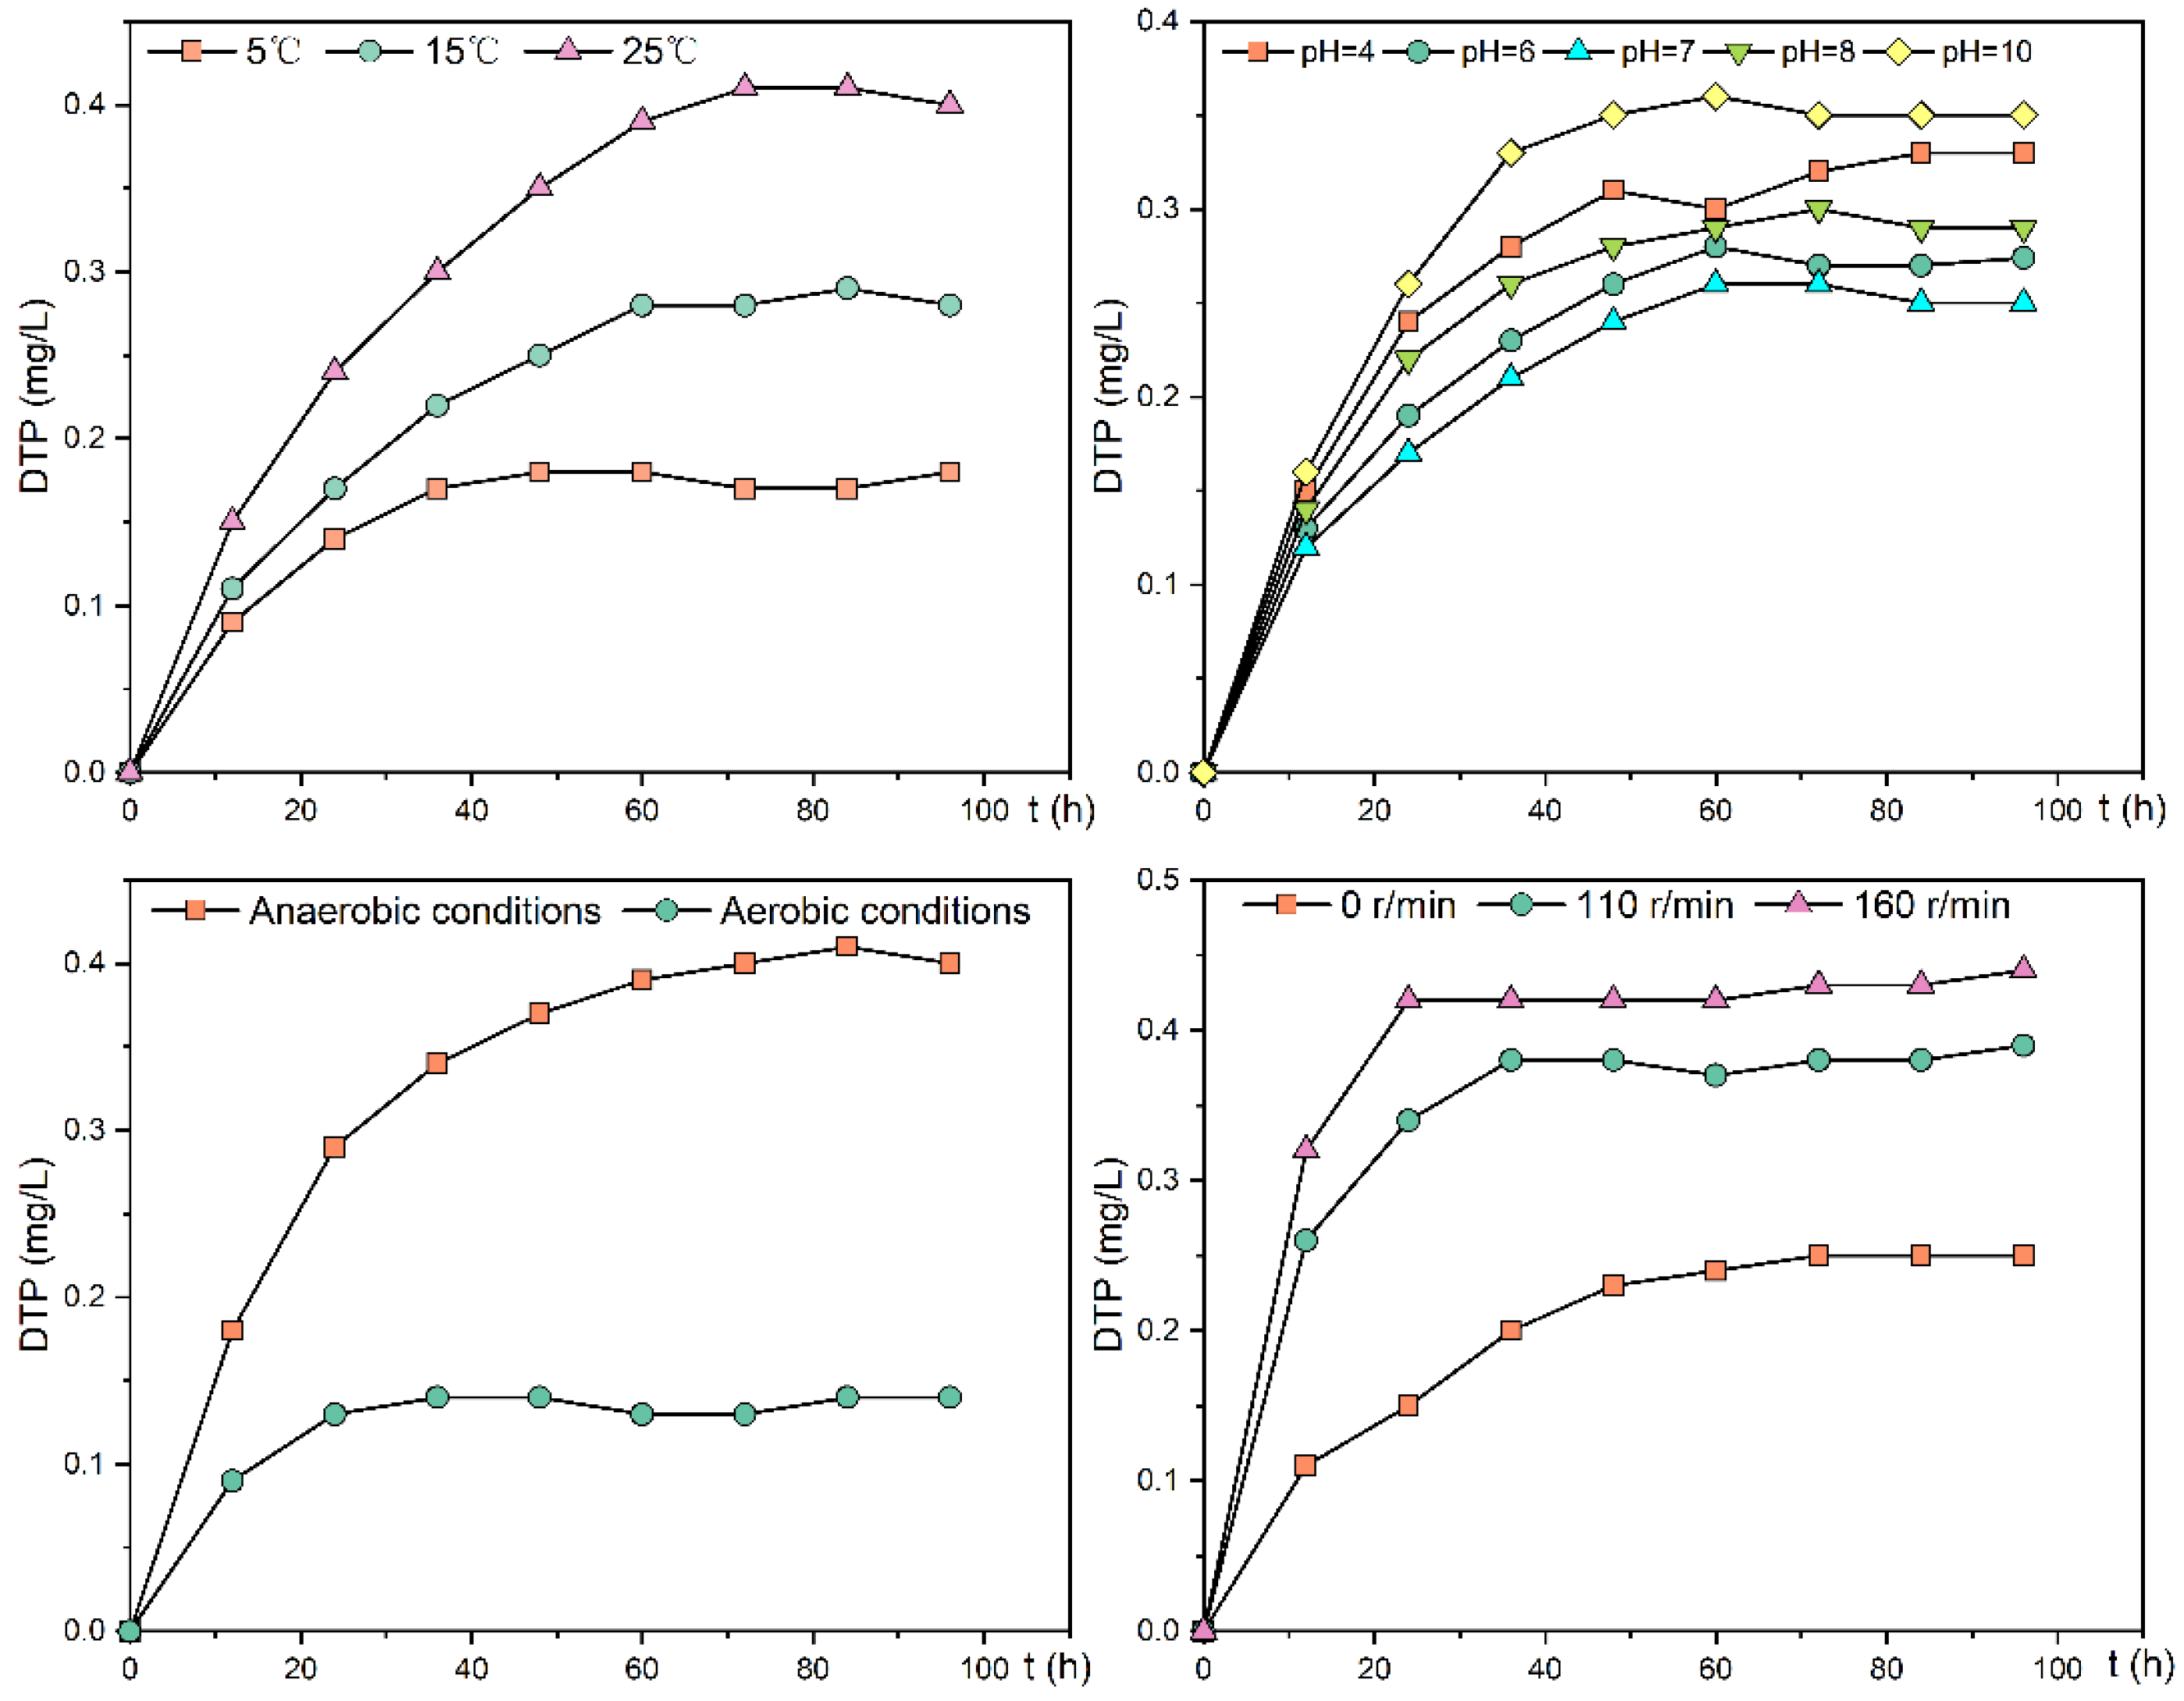
DTP concentration trends in the overlying water at sampling site 3 at 5, 15, and 25 °C were shown in Figure 6. DTP concentration in the overlying water at sampling sites 3 increased with the increase in experimental temperature, with the lowest concentration at 5 °C and the highest concentration at 25 °C. The release process can be divided into the rapid release stage, the slow-release stage, and the equilibrium stage.
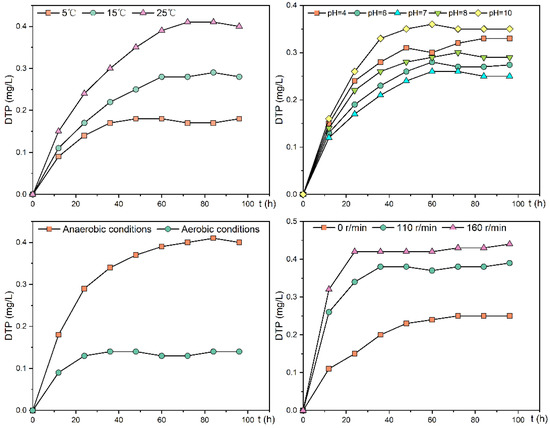
Figure 6.
Change trend of DTP concentration in the overlying water of the experimental group under different environmental factors.
For sampling site 3, the time required to reach equilibrium DTP concentration in the overlying water was 36, 60, and 72 h at 5, 15, and 25 °C, and the equilibrium DTP concentrations were 0.17, 0.28, and 0.41 mg/L, respectively, with the fastest average release rates in the first 12 h at 0.332, 0.405, and 0.553 mg/(m2·h). At 5 °C, the release rate gradually slowed down during 36–48 h, with an average release rate of 0.062 mg/(m2·h); at 15 and 25 °C, the release rate was still fast during 36–60 h, with an average release rate of 0.184 and 0.259 mg/(m2·h), respectively. The cumulative release at 5, 15, and 25 °C was 0.112, 0.172, and 0.245 mg, respectively, indicating that the phosphorus exchange between sediment and overlying water gradually increased with increasing temperature, and was about 2.2 times higher at 25 °C than at 5 °C. The Kruskal–Wallis test showed that the average release rate and cumulative release amount of DTP varied significantly under different temperatures (p < 0.05).
The effect of temperature on sediment phosphorus release is reflected through indirect effects, with increased temperature accelerating the rate of physical, chemical, and biological reactions in the sediment. Firstly, the increased temperature reduces the ability of the substrate to absorb phosphorus [17,19]; secondly, increased temperature increases microbial activity in the sediment, with increased micro life and bacterial activity and accelerated organic matter decomposition, facilitating the conversion of organic to inorganic phosphorus as well as dissolved phosphorus in the sediment. Increased oxygen consumption by microorganisms at elevated temperatures reduces the sediment’s redox potential, allowing for reducing large amounts of Fe3+ to Fe2+ in the sediment, increasing phosphorus release [26,27]. In this study, we measured the trend of phosphorus content of each form in the sediment at sampling site 3 in the release experiment at different temperatures, as shown in Table 5. It can be seen that the trend of decreasing Fe-P and OP content in the sediment was more evident with increasing temperature. At 25 °C, the Fe-P content decreased by about 4.54%, and OP content decreased by about 4.15%, indicating that increasing the temperature is beneficial to Fe-P and OP release. For Al-P and Ca-P, the content changes were not significant, indicating that they were less affected by temperature. Labile-P is the more reactive phosphorus component of the surface sediments, and changes in its content are usually the result of a combination of free release through interstitial water, infiltration, and transformation of other forms of phosphorus [4].

Table 5.
Phosphorus fractions changes in the sediments of the release experiment at different temperatures.
For the Shuangji River basin in Xinmi, elevated temperatures release OP from the sediment through the conversion to inorganic forms of phosphorus. Simultaneously, lower redox potentials result in the reduction of Fe3+ to Fe2+ in the sediment, which is less able to bind to phosphorus and thus released from the sediment. According to the characteristics of high phosphorus concentration in the water body of Shuangji River in summer (Figure 3), combined with the experiment of the influence of temperature on phosphorus release, it can be considered that temperature is an important factor affecting phosphorus cycle. Controlling the redox potential of sediments will be an important phosphorus control measure.
3.4.2. Effect of pH on Sediment Phosphorus Release
The trends in DTP concentrations in the overlying water of the phosphorus release experiment at sampling site 3 at pH 4, 6, 7, 8, and 10 are shown in Figure 6. After the release reached equilibrium, the highest DTP concentration of approximately 0.35 mg/L was found in the overlying water under an alkaline environment (pH = 10), and the lowest concentration of approximately 0.25 mg/L was found under a neutral environment (pH = 7). The amount and rate of phosphorus release increased under both acidic and alkaline environments compared with the neutral environment (Table 5), with the highest average release rate at a pH equal to 10 of 0.201 mg/(m2·h). In the release experiment, DTP concentrations increased rapidly during the first 12 h and slowly from 12–60 h. The Kruskal–Wallis test showed that the average release rate and cumulative release amount of DTP were significantly different at different pHs (p < 0.05).
The effect of pH on sediment phosphorus release was mainly through influencing sediment adsorption and ion exchange of phosphorus. Under acidic conditions, as the pH decreased, the amount of Ca-P and Al-P content in the experimental group’s sediments decreased by a larger amount. In contrast, the Fe-P and OP amount changed insignificantly (Table 6), mainly because the dissolution of calcium-bound phosphorus occurred under acidic conditions. Furthermore, under acidic conditions, hydroxide colloids that have adsorbed phosphorus will also be dissolved [37]. Under alkaline conditions, the release of Fe-P and Al-P gradually increases with increasing pH, mainly because phosphorus release under alkaline conditions is dominated by ion exchange, and OH− in the water column reacts readily with Al3+ and Fe3+ in the sediment to produce more stable hydroxides, increasing Fe-P and Al-P release. The amount of change in OP in the sediment is not significant under either acidic or alkaline conditions. Labile-P is the more reactive phosphorus component in the surface sediments, and the change in its content is usually the result of a combination of free release through interstitial water, infiltration, and transformation of other forms of phosphorus. It has also been shown that sediments differ in their ability to adsorb different phosphate forms. When pH is less than 7.2, phosphate exists mainly as H2PO4−, and at a pH equal to 7.2, it exists as both H2PO4− and HPO42−, with H2PO4−, and HPO42− being the forms most readily adsorbed by the sediment. When the pH is greater than 10, the PO4− content gradually increases and is less likely to be adsorbed by the sediment [38].

Table 6.
Phosphorus fraction changes in the sediments of the release experiment at different pHs.
In general, the release of phosphorus from the sediment is mainly facilitated by promoting the dissolution of phosphate under acidic conditions while, under alkaline conditions, the release of phosphorus from the sediment is mainly enhanced by ion exchange, and changes in phosphorus morphology are also an influential factor in the amount of release. The pH range of Shuangji River Basin in Xinmi City is 7.37–7.87 (Figure 2). According to the experiment on how pH affects the phosphorus release of sediment, the adsorption of phosphorus by sediment is stable and the release amount is the least in this neutral pH range. Therefore, the phosphorus control measures should be to maintain the stability of effluent quality of sewage plant and papermaking wastewater treatment plant and avoid the abrupt change in pH of water body.
3.4.3. The Effect of Dissolved Oxygen on Sediment Phosphorus Release
The trend of DTP concentration in the overlying water during the anaerobic and aerobic phosphorus release experiments is shown in Figure 6; the average release rate was 0.332 mg/(m2·h) during 0–12 h under aerobic conditions, and 0.079 mg/(m2·h) during 12–48 h under slow release. Under anaerobic conditions, the average release rate was 0.548 mg/(m2·h) during the 0–24 h period and 0.172 mg/(m2·h) during the 24–60 h period. The average release rate was 0.172 mg/(m2·h), and the DTP concentration in the overlying water reached equilibrium after 60 h. The equilibrium concentration was about 0.40 mg/L. The average release rate for the whole release experiment was 0.228 mg/(m2·h), and the cumulative release amount was 0.248 mg, which was 2.8 times higher than that in the aerobic condition. The experimental results show that anaerobic conditions increase the release rate and amount of phosphorus released from the sediment. The Kruskal–Wallis test showed that the average release rate and cumulative release amount of DTP were significantly between aerobic and anaerobic conditions (p < 0.05).
As shown in Table 7, the change in dissolved oxygen status of the overlying water column mainly affects the sediment’s Fe-P content. Under aerobic conditions (DO > 5 mg/L), the sediment’s Fe-P content increased significantly, and under anaerobic conditions, the Fe-P content in the sediment decreased significantly. OP was released in a relatively large amount under both aerobic and anaerobic conditions. However, the difference between the two was not significant. Under aerobic conditions, OP was heavily degraded by microorganisms and converted to dissolved inorganic phosphorus, released from the sediment. Organic matter in the sediment under anaerobic conditions was decomposed by humification to produce humic substances, released into the overlying water through a hydrolytic process by phosphorus bacteria. The changes in Ca-P and Al-P in the sediment were small in both aerobic and anaerobic conditions. However, the content changes did not respond significantly to changes in dissolved oxygen in the overlying water. Labile-P is the more reactive phosphorus component in the surface sediment. Its content changes are usually the result of a combination of free release through interstitial water, infiltration, and transformation of other forms of phosphorus and is strongly influenced by changes in the content of Fe-P, OP, etc., in the sediment. It is strongly influenced by changes in Fe-P, OP, etc., in the sediment.

Table 7.
Phosphorus fractions changes in the sediments of the release experiment at aerobic and anaerobic conditions.
Dissolved oxygen indirectly affects sediment phosphorus release by changing the sediment’s redox potential, mainly by changing Fe’s chemical valence in the sediment. When dissolved oxygen decreases, the sediment’s redox potential also decreases, generally below 200 mV [39], and some of the Fe3+ in the surface sediment is gradually reduced to Fe2+. The phosphorus previously adsorbed by Fe(OH)3 dissolved and released into the water. Besides, under anaerobic conditions, microorganisms may use Fe3+ as an alternative electron acceptor (e.g., in the process of denitrification under anoxic conditions), further facilitating phosphorus release. When the overlying water is under high dissolved oxygen conditions, the aerobic layer of the interstitial sediment-water is thickened, invariably increasing the phosphorus transport resistance between the sediment-overlying water and inhibiting phosphorus release.
DO is an important factor affecting phosphorus cycle in watershed. Many studies have shown that an anaerobic state can greatly promote the release of phosphorus and increase the concentration of phosphorus in water [40,41,42]. In conclusion, the effect of the overlying water dissolved oxygen status on sediment phosphorus release is achieved by changing the sediment redox potential to convert Fe3+ to Fe2+.
3.4.4. The Effects of Disturbance on Sediment Phosphorus Release
The DTP concentration trend in the overlying water of the experimental group under the disturbance condition was shown in Figure 6. Under the conditions of 110 and 160 r/min, the sediment release rate was the fastest during the first 12 h in the rapid release phase, with the average release rate of 0.958 and 1.180 mg/(m2·h) during this phase, respectively. At 110 r/min, the slow-release phase was during 12–36 h. During this phase, the average release rate was 0.265 mg/(m2·h) and reached equilibrium after 36 h. The DTP concentration in the overlying water at equilibrium was approximately 0.38 mg/L, with a cumulative release of 0.2448 mg, which was 1.59 times higher than that under static conditions. At this stage, the average release rate was 0.416 mg/(m2·h) and reached equilibrium after 24 h. At equilibrium, the DTP concentration in the overlying water was around 0.43 mg/L, and the cumulative release was 0.2772 mg, about 1.80 times that of the static condition. The Kruskal–Wallis test showed that the average release rate and cumulative release amount of DTP were significantly under different disturbance conditions (p < 0.05).
As shown in Table 8, the disturbance conditions mainly altered the sediment’s labile-P content, with a significant increase in labile-P content reduction in the sediment as this disturbance speed increased. Under static conditions, the release of phosphorus from the substrate is mainly through the dissolution of phosphorus first into the capillary water, and then to the water by diffusion. Disturbance accelerates this process, particularly by accelerating the diffusion of the more reactive adsorbed labile-P in the sediment and phosphorus in interstitial water to overlying water, and disturbance promotes resuspension of substrate particles, which can significantly increase phosphorus exchange. The slight increase in OP reduction in the sediment under different disturbance conditions is likely due to the increased dissolved oxygen in the water and the accelerated rate of desorption of the resuspended state of organic matter by the disturbance.

Table 8.
Phosphorus fraction changes in the sediments of the release experiment at different oscillation speeds.
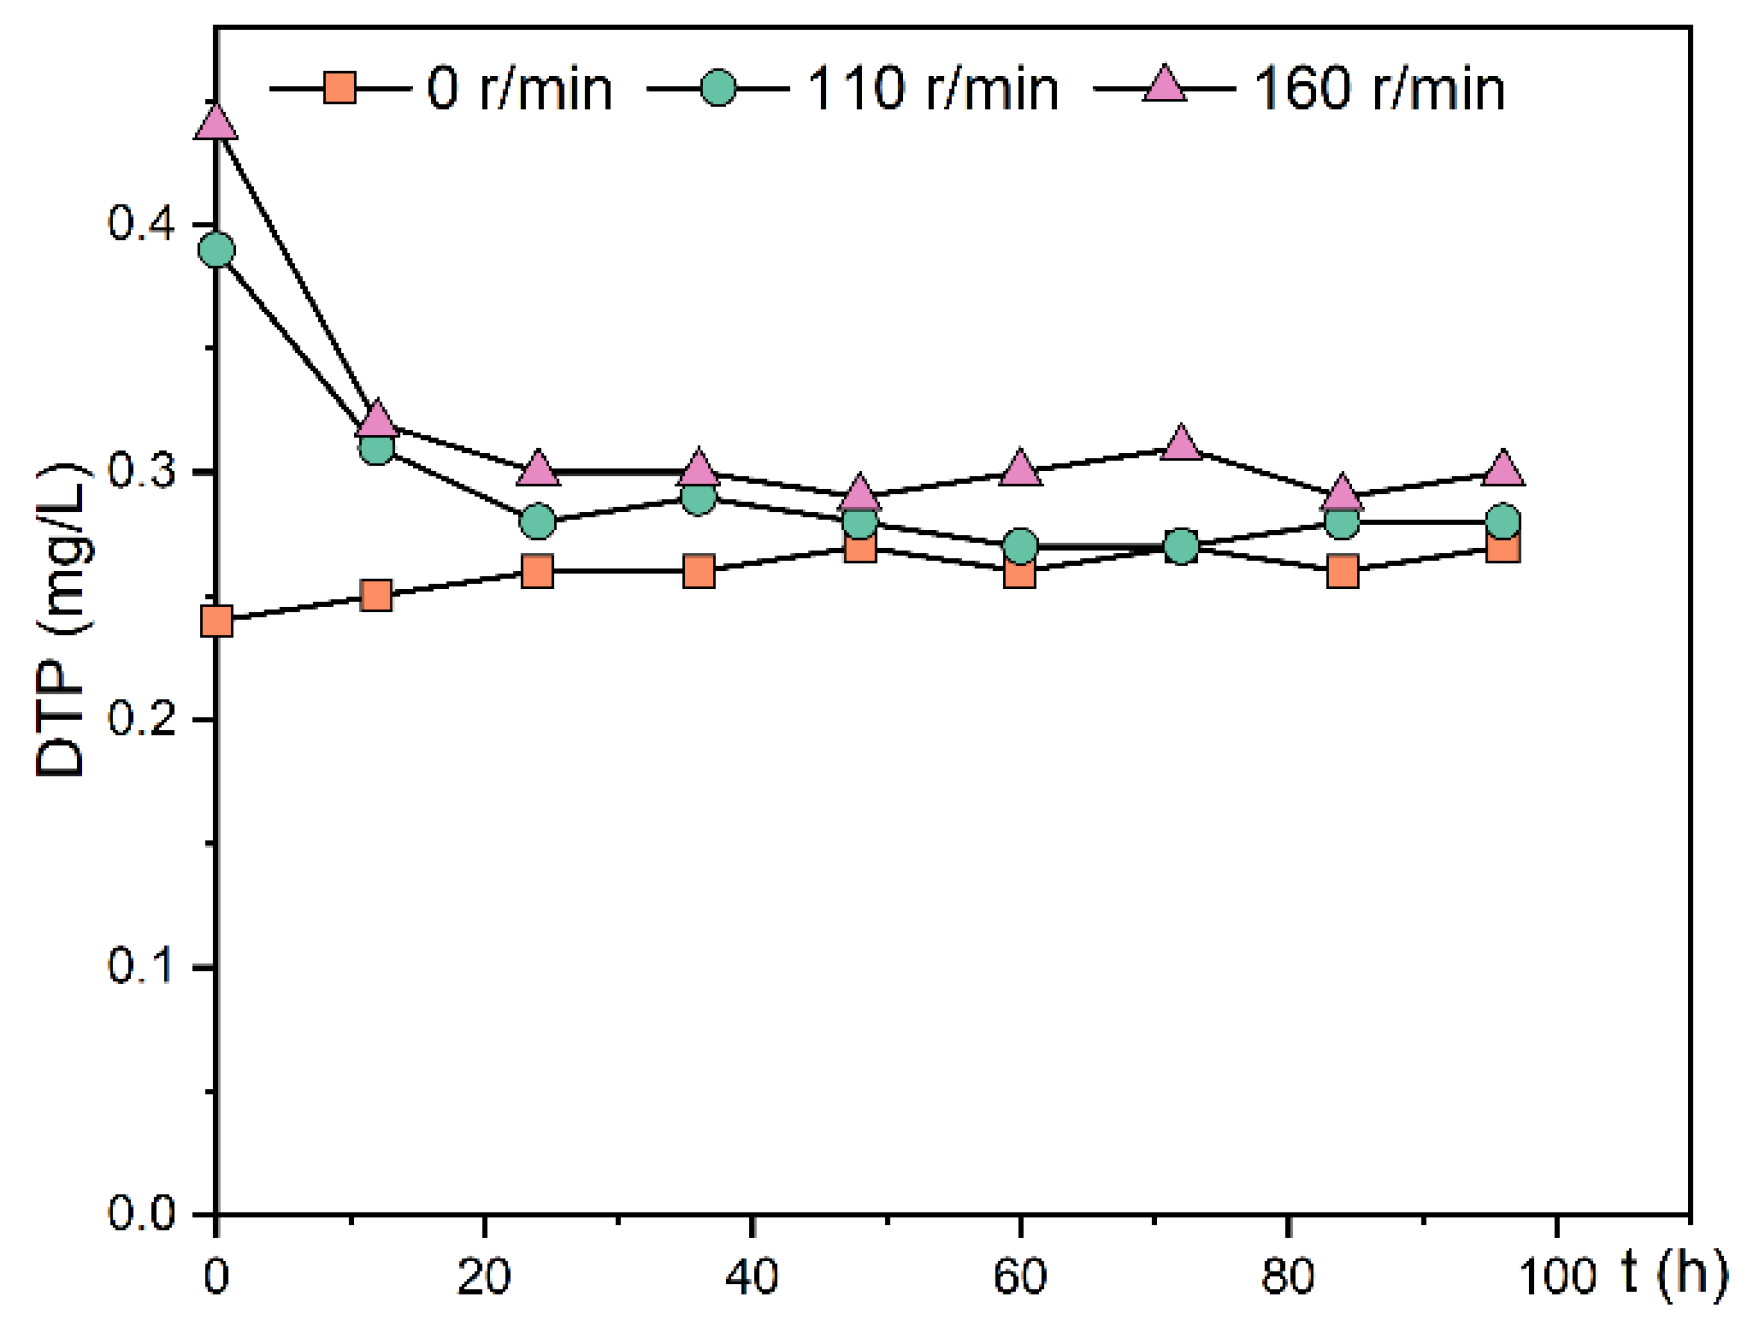
In this experiment, the change in DTP concentration in the overlying water after stopping the disturbance was measured, as shown in Figure 7. After the cessation of disturbance, the DTP concentration in the overlying water of the 110 and 160 r/min experimental groups decreased rapidly within 12 h. After 24 h, the DTP concentration in the overlying water no longer changed because the sediment underwent a resorption process for phosphorus after the cessation of disturbance. There was a slight increase in DTP concentration in the overlying water in the static experimental group, possibly due to a gradual decrease in the amount of dissolved oxygen in the sediment over time and a decrease in redox potential, which prompted the release of Fe3+-bound phosphorus. There was no significant difference in DTP among the three groups 96 h after the disturbance stopped (p > 0.05). The final concentrations of DTP in the overlying water were similar in the three experimental groups after standing, ranging from 0.27–0.30 mg/L.
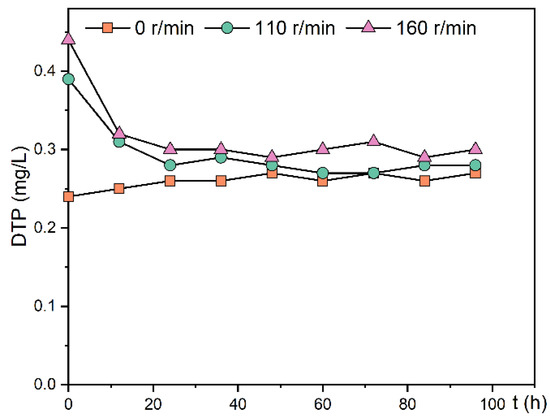
Figure 7.
Change trend of DTP concentration in the overlying water of the experimental group after stopping the oscillation.
Disturbance mainly promotes the release of phosphorus through physical action. The disturbance increased the resuspension of sediment, promoted the diffusion of labile-P to the overlying water, and increased the phosphorus exchange capacity. However, after re-standing, the sediment reabsorbed the phosphorus in the overlying water, so that the phosphorus concentration remained in a certain range [28].
3.5. Sediment Phosphorus Control Measures
By studying the impact of environmental conditions on phosphorus release from sediment, it can effectively guide phosphorus control in the watershed. According to the distribution characteristics of phosphorus in the sediment of Shuangji River in Xinmi City, sediment dredging can be applied to the upstream reach. Sediment dredging is an effective and thorough method to treat the sediment, which can permanently eliminate the impact of sediment on water quality and significantly improve the water quality in a short time. When the temperature is high in summer, aeration technology can be used to increase the DO in water to avoid an anaerobic state in the sediment. The use of aquatic plants to remove P has a good effect. Both emergent plants and submerged plants can absorb part of the nutrients in the sediment or water, reducing the amount of phosphorus released. The extract of emergent plants has a chemical inhibitory effect on algae and can also reduce the flow rate and hydrodynamic disturbance of water, stabilize sediments, and make them difficult to suspend, thereby improving water transparency [43]. According to the hydrological characteristics of the Shuangji River Basin in Xinmi City, phytoremediation technology can be used in the downstream reach.
4. Conclusions
In this study, the water quality and phosphorus content of surface sediments under different overlying water types of the Shuangji River in Xinmi City were studied, and the influence of environmental factors on the release of phosphorus from sediments was discussed. The following conclusions were drawn:
- Due to the different impacts of human activities, the water quality of the Shuangji River presents different spatial distributions. Sediment releases phosphorus in summer and autumn, resulting in high TP concentration in the water body;
- Influenced by human activities, the content and proportion of phosphorus in Shuangji River’s sediments are different. The discharge of the tailwater of the domestic sewage plant and the tailwater of the papermaking wastewater treatment plant increases OP and Fe-P’s content, thereby increasing BAP content. Increasing the risk of phosphorus release;
- The release of phosphorus from the sediment was greatly facilitated by high temperatures, where the OP in the sediment was released from the sediment by conversion to inorganic phosphorus. At the same time, it reduces redox potential, resulting in the reduction of Fe3+ to Fe2+ in the sediment, which is less able to bind phosphorus. Changes in pH affect the release of phosphorus from sediments, mainly by promoting the dissolution of phosphate under acidic conditions and by ion-exchange under alkaline conditions, mainly to increase the release of phosphorus from the sediment. Dissolved oxygen has an indirect effect on sediment phosphorus release mainly by altering the sediment’s redox potential by changing the chemical valence of the Fe element in the sediment. A decrease in dissolved oxygen results in a significant increase in Fe-P release from the sediment. Disturbance promotes the release of phosphorus mainly through physical effects. Disturbance increases the sediment’s resuspension and promotes the diffusion of labile-P into the overlying water, increasing the amount of phosphorus exchanged. However, after re-settlement, the sediment resorbs phosphorus from the overlying water, keeping the phosphorus concentration in a certain range.
Author Contributions
Conceptualization, H.X. and S.H.; methodology, S.H.; investigation, S.H., J.L., R.L., Q.T. and D.S.; writing—original draft preparation, S.H.; writing—review and editing, S.H.; project administration, H.X.; funding acquisition, H.X. All authors have read and agreed to the published version of the manuscript.
Funding
This research was funded by the Major Science and Technology Program for Water Pollution Control and Treatment of China. Grant number: 2017ZX07602-001-002.
Data Availability Statement
This paper has presented the valid data of all the experiments in this study, and the original data are available on request from the corresponding author.
Acknowledgments
The authors are grateful for the data support provided by the Xinmi Branch of the Zhengzhou Bureau of Ecology and Environment.
Conflicts of Interest
The authors declare no conflict of interest.
References
- Ni, Z.; Wang, S.; Cai, J.; Li, H.; Jenkins, A.; Maberly, S.; May, L. The Potential Role of Sediment Organic Phosphorus in Algal Growth in a Low Nutrient Lake. Environ. Pollut. 2019, 255, 113235. [Google Scholar] [CrossRef]
- Smith, D.; Jarvie, H.; Bowes, M. Carbon, Nitrogen, and Phosphorus Stoichiometry and Eutrophication in River Thames Tributaries, UK. Agric. Environ. Lett. 2017, 2. [Google Scholar] [CrossRef]
- Varol, M.; Gökot, B.; Bekleyen, A.; Şen, B. Geochemistry of the Tigris River Basin, Turkey: Spatial and Seasonal Variations of Major Ion Compositions and Their Controlling Factors. Quat. Int. 2013. [Google Scholar] [CrossRef]
- Wen, S.; Wang, H.; Wu, T.; Yang, J.; Jiang, X.; Zhong, J. Vertical Profiles of Phosphorus Fractions in the Sediment in a Chain of Reservoirs in North China: Implications for Pollution Source, Bioavailability, and Eutrophication. Sci. Total Environ. 2019, 704, 135318. [Google Scholar] [CrossRef]
- Zeinalzadeh, K.; Rezaei, E. Determining Spatial and Temporal Changes of Surface Water Quality Using Principal Component Analysis. J. Hydrol. Reg. Stud. 2017, 13, 1–10. [Google Scholar] [CrossRef]
- Gao, Y.; Liang, T.; Tian, S.; Wang, L.; Holm, P.; Hansen, H. High-Resolution Imaging of Labile Phosphorus and Its Relationship with Iron Redox State in Lake Sediments. Environ. Pollut. 2016, 219. [Google Scholar] [CrossRef]
- Petticrew, E.; Arocena, J. Evaluation of Iron-Phosphate as a Source of Internal Lake Phosphorus Loadings. Sci. Total Environ. 2001, 266, 87–93. [Google Scholar] [CrossRef]
- Pu, J.; Ni, Z.; Wang, S. Characteristics of Bioavailable Phosphorus in Sediment and Potential Environmental Risks in Poyang Lake: The Largest Freshwater Lake in China. Ecol. Indic. 2020, 115, 106409. [Google Scholar] [CrossRef]
- Dan, S.; Lan, W.; Yang, B.; Han, L.; Xu, C.; Lu, D.; Kang, Z.; Huang, H.; Ning, Z. Bulk Sedimentary Phosphorus in Relation to Organic Carbon, Sediment Textural Properties and Hydrodynamics in the Northern Beibu Gulf, South China Sea. Mar. Pollut. Bull. 2020, 155, 111176. [Google Scholar] [CrossRef] [PubMed]
- Rydin, E.; Malmaeus, M.; Karlsson, M.; Jonsson, P. Phosphorus Release from Coastal Baltic Sea Sediments as Estimated from Sediment Profiles. Estuar. Coast. Shelf Sci. 2011, 92, 111–117. [Google Scholar] [CrossRef]
- Jin, X.; He, Y.; Kirumba, G.; Younas, H.; Li, J. Phosphorus Fractions and Phosphate Sorption-Release Characteristics of the Sediment in the Yangtze River Estuary Reservoir. Ecol. Eng. 2013, 55, 62–66. [Google Scholar] [CrossRef]
- Ni, Z.; Wang, S.; Zhang, B.-T.; Wang, Y.; Li, H. Response of Sediment Organic Phosphorus Composition to Lake Trophic Status in China. Sci. Total Environ. 2019, 652, 495–504. [Google Scholar] [CrossRef]
- Pulatsü, S.; Kırkaǧaç, A.T.M.; Köksal, G. Sediment Phosphorus Characteristics in the Clearwater State of Lake Mogan, Turkey. Lakes Reserv. Sci. Policy Manag. Sustain. Use 2008, 13, 197–205. [Google Scholar] [CrossRef]
- Gao, L.; Zhou, J.; Yang, H.; Chen, J. Phosphorus Fractions in Sediment Profiles and Their Potential Contributions to Eutrophication in Dianchi Lake. Environ. Geol. 2006, 49, 792. [Google Scholar] [CrossRef]
- Ni, Z.; Wang, S.; Wang, Y. Characteristics of Bioavailable Organic Phosphorus in Sediment and Its Contribution to Lake Eutrophication in China. Environ. Pollut. 2016, 219. [Google Scholar] [CrossRef]
- Kaiserli, A.; Voutsa, D.; Samara, C. Phosphorus Fractionation in Lake Sediments-Lakes Volvi and Koronia N Greece. Chemosphere 2002, 46, 1147–1155. [Google Scholar] [CrossRef]
- Soliman, N.; El-Zokm, G.; Okbah, M. Evaluation of Phosphorus Bioavailability in El Mex Bay and Lake Mariut Sediments. Int. J. Sediment Res. 2017, 32. [Google Scholar] [CrossRef]
- Gireeshkumar, T.R.; Deepulal, P.M.; Chandramohanakumar, N. Phosphorous Speciation in Surface Sediments of the Cochin Estuary. Environ. Monit. Assess. 2012, 185. [Google Scholar] [CrossRef]
- Zhou, Q.; Gibson, C.; Zhu, Y. Evaluation of Phosphorus Bioavailability in Sediments of Three Contrasting Lakes in China and the UK. Chemosphere 2001, 42, 221–225. [Google Scholar] [CrossRef]
- Ruban, V.; López-Sánchez, J.; Pardo, P.; Rauret, G.; Muntau, H.; Quevauviller, P. Harmonized Protocol and Certified Reference Material for the Determination of Extractable Contents of Phosphorus in Freshwater Sediments–A Synthesis of Recent Works. Fresenius J. Anal. Chem. 2001, 370, 224–228. [Google Scholar] [CrossRef]
- Ni, Z.; Wang, S.; Yue, W.; Pu, J. Response of Phosphorus Fractionation in Lake Sediments to Anthropogenic Activities in China. Sci. Total Environ. 2019, 699, 134242. [Google Scholar] [CrossRef] [PubMed]
- Ivanoff, D.B.; Reddy, K.R.; Robinson, S. Chemical fractionation of organic phosphorus in selected histosols1. Soil Sci. 1998, 163, 36–45. [Google Scholar] [CrossRef]
- Xiaolu, L.; Guo, M.; Duan, X.; Zhao, J.; Hua, Y.; Zhou, Y.; Liu, G.; Dionysiou, D. Distribution of Organic Phosphorus Species in Sediment Profiles of Shallow Lakes and Its Effect on Photo-Release of Phosphate during Sediment Resuspension. Environ. Int. 2019, 130. [Google Scholar] [CrossRef]
- Gardolinski, P.; Worsfold, P.; McKelvie, I. Seawater Induced Release and Transformation of Organic and Inorganic Phosphorus from River Sediments. Water Res. 2004, 38, 688–692. [Google Scholar] [CrossRef]
- Feng, W.; Wu, F.; He, Z.; Song, F.; Zhu, Y.; Wang, Y.; Qin, N.; Zhang, C.; Chen, H.; Sun, F. Simulated Bioavailability of Phosphorus from Aquatic Macrophytes and Phytoplankton by Aqueous Suspension and Incubation with Alkaline Phosphatase. Sci. Total Environ. 2017, 616–617. [Google Scholar] [CrossRef]
- Jiang, X.; Jin, X.; Yao, Y.; Li, L.; Wu, F. Effects of Biological Activity, Light, Temperature and Oxygen on Phosphorus Release Processes at the Sediment and Water Interface of Taihu Lake, China. Water Res. 2008, 42, 2251–2259. [Google Scholar] [CrossRef]
- Li, Q.; Shi, W. Effects of Sediment Oxidation on Phosphorus Transformation in Three Large Shallow Eutrophic Lakes in China. Environ. Sci. Pollut. Res. 2020, 27, 1–8. [Google Scholar] [CrossRef]
- Wang, S.; Jin, X.; Zhao, H.; Wu, F. Phosphorus Release Characteristics of Different Trophic Lake Sediments under Simulative Disturbing Conditions. J. Hazard. Mater. 2008, 161, 1551–1559. [Google Scholar] [CrossRef]
- Ruban, V.; López-Sánchez, J.; Pardo, P.; Rauret, G.; Muntau, H.; Quevauviller, P. Development of a Harmonised Phosphorus Extraction Procedure and Certification of a Sediment Reference Material. Journal of environmental monitoring. JEM 2001, 3, 121–125. [Google Scholar] [CrossRef]
- Wang, H.; Pang, Y. Numerical Simulation on Hydrodynamic Character for Algae Growth. Environ. Sci. 2008, 29, 884–889. (In Chinese) [Google Scholar]
- Danen-Louwerse, H.; Lijklema, L.; Coenraats, M. Iron Content of Sediment and Phosphate Adsorption Properties. Hydrobiologia 1993, 253, 311–317. [Google Scholar] [CrossRef]
- Chen, Q.; Chen, J.; Wang, J.; Guo, J.; Jin, Z.; Yu, P.; Ma, Z. In Situ, High-Resolution Evidence of Phosphorus Release from Sediments Controlled by the Reductive Dissolution of Iron-Bound Phosphorus in a Deep Reservoir, Southwestern China. Sci. Total Environ. 2019, 666, 39–45. [Google Scholar] [CrossRef] [PubMed]
- Murray, G.; Hesterberg, D. Iron and Phosphate Dissolution during Abiotic Reduction of Ferrihydrite-Boehmite Mixtures. Soil Sci. Soc. Am. J. SSSAJ 2006, 70. [Google Scholar] [CrossRef]
- Amirbahman, A.; Lake, B.; Norton, S. Seasonal Phosphorus Dynamics in the Surficial Sediment of Two Shallow Temperate Lakes: A Solid-Phase and Pore-Water Study. Hydrobiologia 2012, 701. [Google Scholar] [CrossRef]
- Lake, B.; Coolidge, K.; Norton, S.; Amirbahman, A. Factors Contributing to the Internal Loading of Phosphorus from Anoxic Sediments in Six Maine, USA, Lakes. Sci. Total Environ. 2007, 373, 534–541. [Google Scholar] [CrossRef]
- Berbel, G.; Favaro, D.; Braga, E. Impact of Harbour, Industry and Sewage on the Phosphorus Geochemistry of a Subtropical Estuary in Brazil. Mar. Pollut. Bull. 2015, 93. [Google Scholar] [CrossRef]
- Temporetti, P.; Beamud, S.; Nichela, D.; Baffico, G.; Pedrozo, F. The Effect of PH on Phosphorus Sorbed from Sediments in a River with a Natural PH Gradient. Chemosphere 2019, 228. [Google Scholar] [CrossRef] [PubMed]
- Gong, C. Study on Small Urban Shallow Lake Inner Pollution Source and Environmental Dredging Depth—Taken Lake Xuanwu in Nanjing as the Research Object. Ph.D. Thesis, Hohai University, Nanjing, China, 2007. (In Chinese). [Google Scholar]
- Boström, B.; Andersen, J.; Fleischer, S.; Jansson, M. Exchange of Phosphorus across the Sediment-Water Interface. Hydrobiologia 1988, 170, 229–244. [Google Scholar] [CrossRef]
- Li, H.; Liang, L.; Li, M.; Zhang, X. Effects of ph, temperature, dissolved oxygen, and flow rate on phosphorus release processes at the sediment and water interface in storm sewer. J. Anal. Methods Chem. 2013, 104316. [Google Scholar] [CrossRef]
- Wu, Y.; Wen, Y.; Zhou, J.; Wu, Y. Phosphorus release from lake sediments: Effects of pH, temperature and dissolved oxygen. KSCE J. Civ. Eng. 2014, 18, 323–329. [Google Scholar] [CrossRef]
- Wang, S.; Jin, X.; Bu, Q.; Jiao, L.; Wu, F. Effects of dissolved oxygen supply level on phosphorus release from lake sediments. Colloids Surf. Physicochem. Eng. Asp. 2008, 316, 245–252. [Google Scholar] [CrossRef]
- Horppila, J.; Nurminen, L. Effects of different macrophyte growth forms on sediment and p resuspension in a shallow lake. Hydrobiologia 2005, 545, 167–175. [Google Scholar] [CrossRef]
Publisher’s Note: MDPI stays neutral with regard to jurisdictional claims in published maps and institutional affiliations. |
© 2021 by the authors. Licensee MDPI, Basel, Switzerland. This article is an open access article distributed under the terms and conditions of the Creative Commons Attribution (CC BY) license (https://creativecommons.org/licenses/by/4.0/).

