
Indicators and Framework for Measuring Industrial Sustainability in Italian Footwear Small and Medium Enterprises


Abstract
:1. Introduction
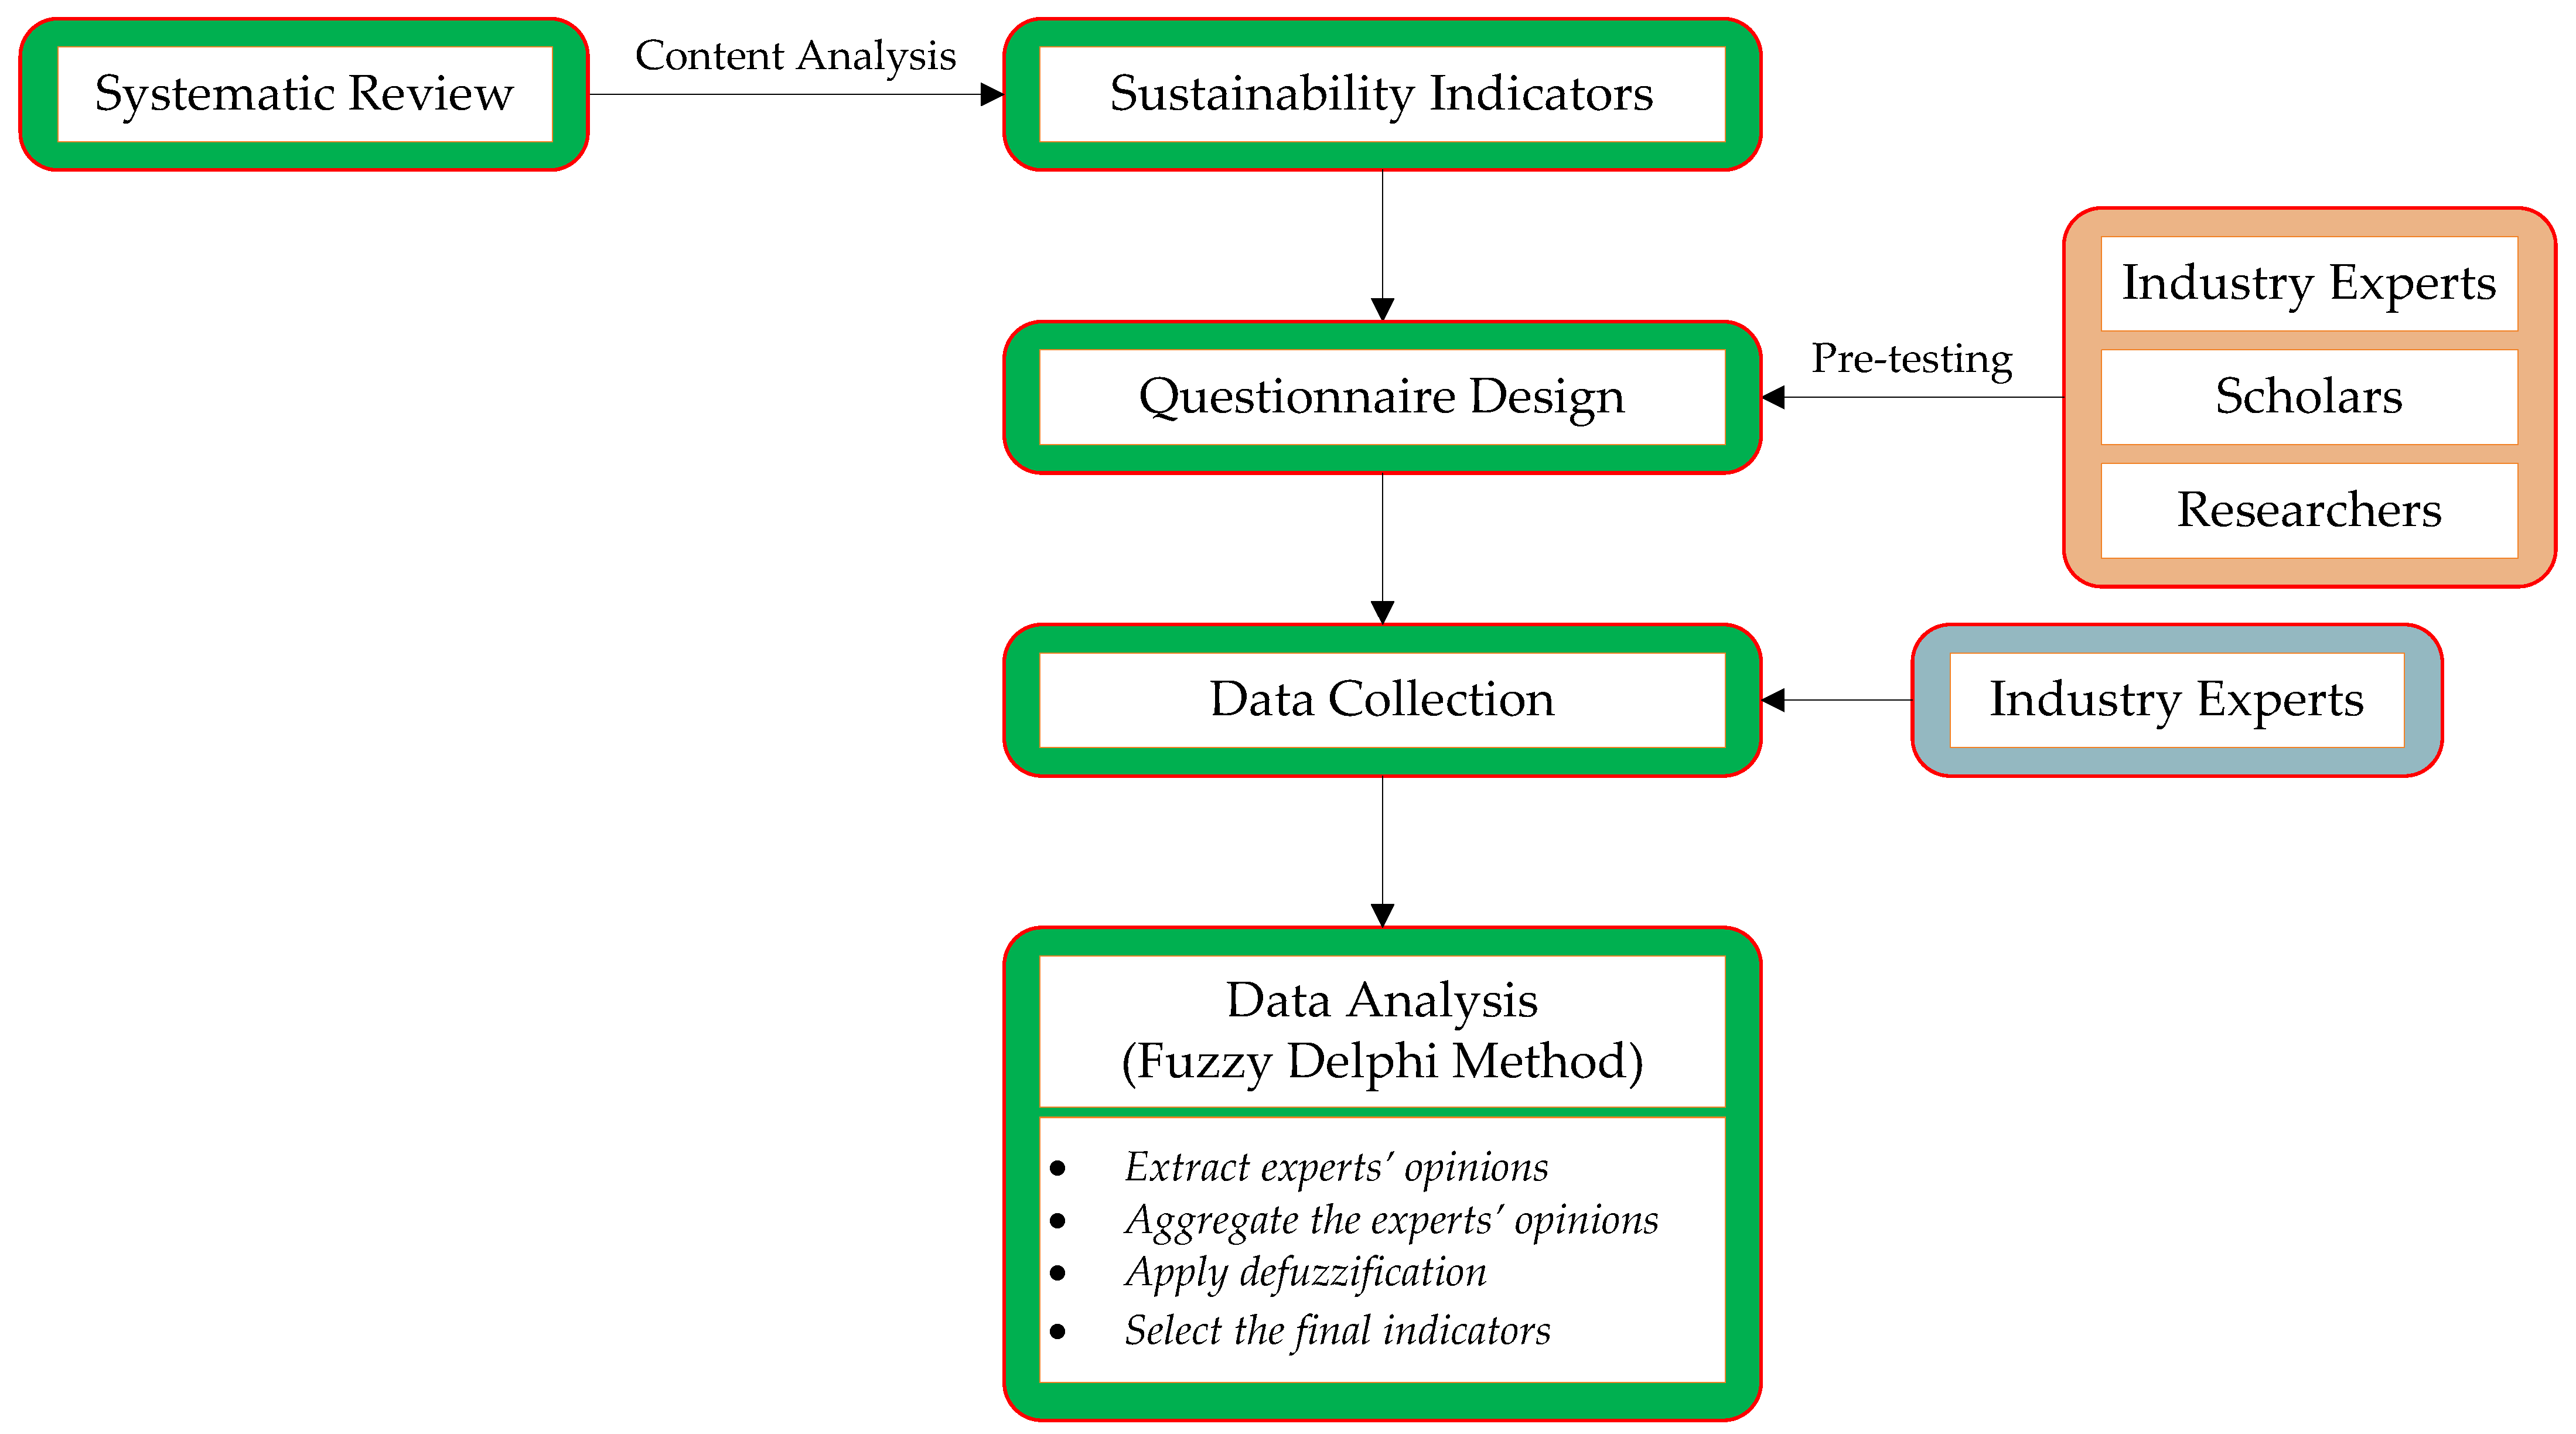
2. Methodology
2.1. Identification of Potential Sustainability Indicators
2.2. Questionnaire Design
2.3. Data Collection
2.4. Data Analysis: Fuzzy Delphi Method (FDM)
- 1.
- Extract experts’ opinions: collect and organize the assessment scores given by each expert for each sustainability indicator in the questionnaire.
- 2.
- Aggregate the experts’ opinions: first, convert the linguistic variables used to assess the indicators (i.e., the experts’ opinions) into triangular fuzzy numbers [47], as shown in Table 2. The linguistic variables are used to represent the experts’ opinions on the importance (i.e., usefulness and applicability) of the indicator.
- 3.
- Apply defuzzification: apply the center of gravity method (CGM) to defuzzify the aggregate triangular fuzzy number of the indicator:where Si is the final defuzzified score that indicates the aggregate importance of each indicator (i).
- 4.
- Select the final indicators: compare the defuzzified value (Si) with a threshold value (d):
- If Si ≥ d, the indicator is selected.
- If Si < d, the indicator is not selected.
3. Results
3.1. Potential Sustainability Indicators
3.2. Selected Indicators
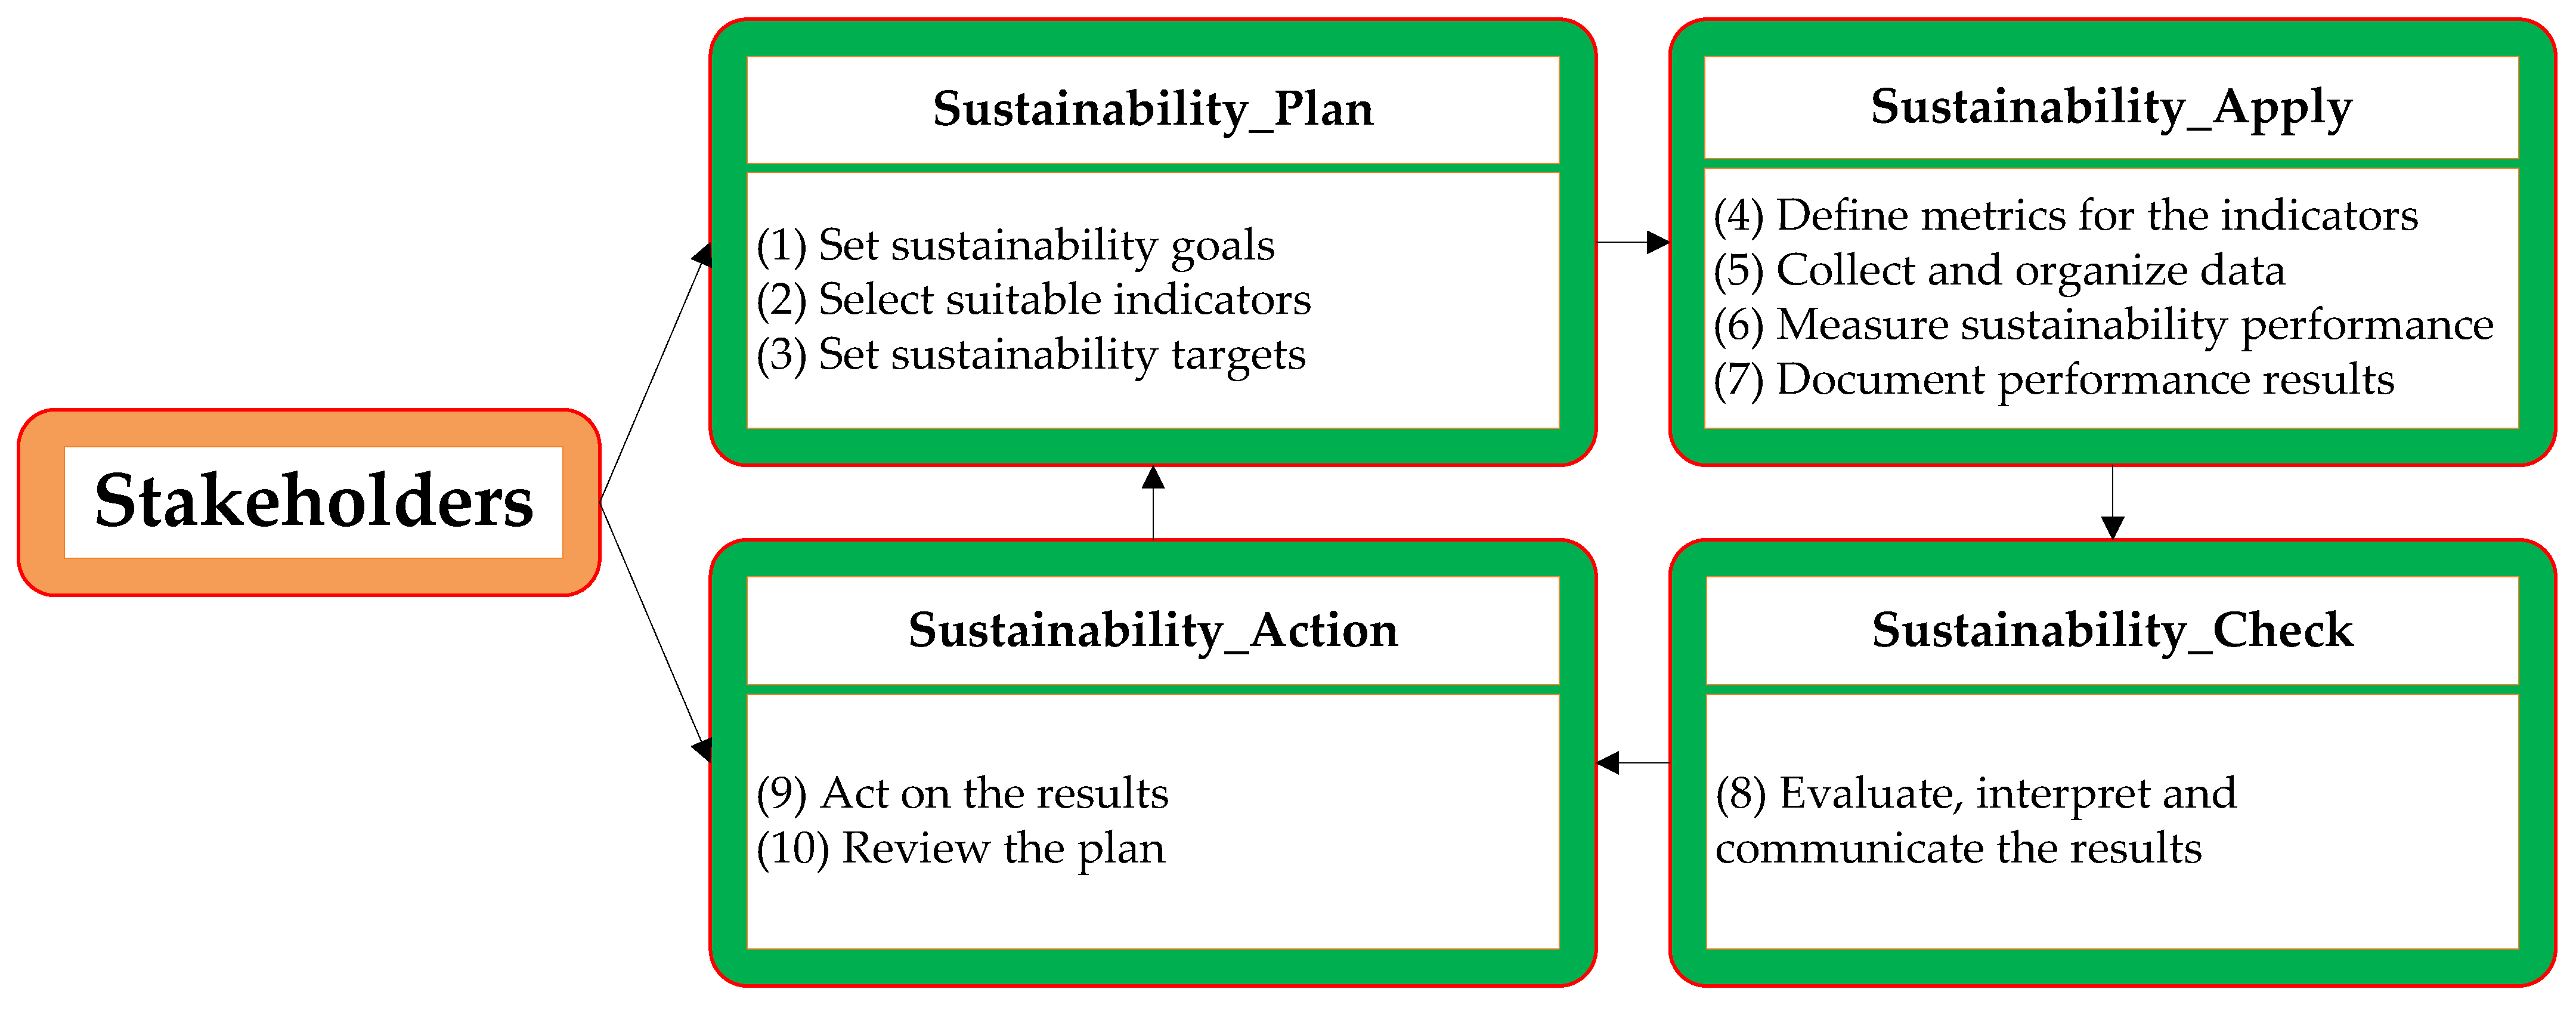
4. Discussion
- Sustainabilty_Plan: this stage includes setting sustainability goals to improve industrial sustainability performance, selecting indicators to measure progress towards achieving the goals and setting sustainability targets. A manufacturing firm can specify targets in consultation with stakeholders [74]. The target could be critical loads, acceptable limits, or standards set by governmental or non-governmental organizations [51].
- Sustainability_Apply: this involves defining metrics for the indicators, collecting and organizing data, measuring the sustainability performance for a reporting period (e.g., fiscal year, calendar year, six months, quarter, month [74]), and documenting the results.
- Sustainability_Check: this focuses on comparing the performance results obtained with the targets, interpreting the comparison results to check whether the performance of the firm is sustainable or not, and communicating the results to the stakeholders to have a common understanding and for taking actions.
- Sustainability_Action: this consists of taking actions regarding sustainability performance that needs improvement, and reviewing the plan for continuous improvement.
5. Conclusions
Author Contributions
Funding
Institutional Review Board Statement
Informed Consent Statement
Data Availability Statement
Acknowledgments
Conflicts of Interest
References
- Huang, A.; Badurdeen, F. Metrics-based approach to evaluate sustainable manufacturing performance at the production line and plant levels. J. Clean. Prod. 2018, 192, 462–476. [Google Scholar] [CrossRef]
- Trianni, A.; Cagno, E.; Neri, A. Modelling barriers to the adoption of industrial sustainability measures. J. Clean. Prod. 2017, 168, 1482–1504. [Google Scholar] [CrossRef]
- Cagno, E.; Neri, A.; Howard, M.; Brenna, G.; Trianni, A. Industrial sustainability performance measurement systems: A novel framework. J. Clean. Prod. 2019, 230, 1354–1375. [Google Scholar] [CrossRef]
- Neri, A.; Cagno, E.; Di Sebastiano, G.; Trianni, A. Industrial sustainability: Modelling drivers and mechanisms with barriers. J. Clean. Prod. 2018, 194, 452–472. [Google Scholar] [CrossRef]
- Galal, N.M.; Moneim, A.F.A. A Mathematical Programming Approach to the Optimal Sustainable Product Mix for the Process Industry. Sustainability 2015, 7, 13085–13103. [Google Scholar] [CrossRef] [Green Version]
- Zeng, S.X.; Liu, H.C.; Tam, C.M.; Shao, Y.K. Cluster analysis for studying industrial sustainability: An empirical study in Shanghai. J. Clean. Prod. 2008, 16, 1090–1097. [Google Scholar] [CrossRef]
- Trianni, A.; Cagno, E.; Neri, A.; Howard, M. Measuring industrial sustainability performance: Empirical evidence from Italian and German manufacturing small and medium enterprises. J. Clean. Prod. 2019, 229, 1355–1376. [Google Scholar] [CrossRef]
- Zarte, M.; Pechmann, A.; Nunes, I.L. Indicator framework for sustainable production planning and controlling. Int. J. Sustain. Eng. 2019, 12, 149–158. [Google Scholar] [CrossRef]
- Ocampo, L.A.; Clark, E.E.; Promentilla, M.A.B. Computing sustainable manufacturing index with fuzzy analytic hierarchy process. Int. J. Sustain. Eng. 2016, 9, 305–314. [Google Scholar] [CrossRef]
- Beekaroo, D.; Callychurn, D.S.; Hurreeram, D.K. Developing a sustainability index for Mauritian manufacturing companies. Ecol. Indic. 2019, 96, 250–257. [Google Scholar] [CrossRef]
- Wang, C.; Wang, L.; Dai, S. An indicator approach to industrial sustainability assessment: The case of China’s Capital Economic Circle. J. Clean. Prod. 2018, 194, 473–482. [Google Scholar] [CrossRef]
- Samuel, V.B.; Agamuthu, P.; Hashim, M.A. Indicators for assessment of sustainable production: A case study of the petrochemical industry in Malaysia. Ecol. Indic. 2013, 24, 392–402. [Google Scholar] [CrossRef]
- Paramanathan, S.; Farrukh, C.; Phaal, R.; Probert, D. Implementing Industrial Sustainability: The Research Issues in Technology Management. R D Manag. 2004, 34, 527–537. [Google Scholar] [CrossRef]
- Tseng, M.L.; Divinagracia, L.; Divinagracia, R. Evaluating firm’s sustainable production indicators in uncertainty. Comput. Ind. Eng. 2009, 57, 1393–1403. [Google Scholar] [CrossRef]
- Veleva, V.; Bailey, J.; Jurczyk, N. Using Sustainable Production Indicators to Measure Progress in ISO 14001, EHS System and EPA Achievement Track. Corp. Environ. Strategy 2001, 8, 326–338. [Google Scholar] [CrossRef]
- Tonelli, F.; Evans, S.; Taticchi, P. Industrial Sustainability: Challenges, perspectives, actions. Int. J. Bus. Innov. Res. 2013, 7, 1751-0252. [Google Scholar] [CrossRef]
- Elkington, J. Cannibals with Forks: The Triple Bottom Line of 21st Century Business, 1st ed.; Capstone: Oxford, UK, 1997; pp. 69–94. [Google Scholar]
- Ahmad, S.; Wong, K.Y. Development of weighted triple-bottom line sustainability indicators for the Malaysian food manufacturing industry using the Delphi method. J. Clean. Prod. 2019, 229, 1167–1182. [Google Scholar] [CrossRef]
- Ahmad, S.; Wong, K.Y.; Zaman, B. A Comprehensive and Integrated Stochastic-Fuzzy Method for Sustainability Assessment in the Malaysian Food Manufacturing Industry. Sustainability 2019, 11, 948. [Google Scholar] [CrossRef] [Green Version]
- Ghadimi, P.; Azadnia, A.H.; Yusof, N.M.; Saman, M.Z.M. A weighted fuzzy approach for product sustainability assessment: A case study in automotive industry. J. Clean. Prod. 2012, 33, 10–21. [Google Scholar] [CrossRef]
- Watanabe, E.H.; da Silva, R.M.; Tsuzuki, M.S.G.; Junqueira, F.; dos Santos Filho, D.J.; Miyagi, P.E. A Framework to Evaluate the Performance of a New Industrial Business Model. IFAC-PapersOnLine 2016, 49, 61–66. [Google Scholar] [CrossRef]
- Lacasa, E.; Santolaya, J.L.; Biedermann, A. Obtaining sustainable production from the product design analysis. J. Clean. Prod. 2016, 139, 706–716. [Google Scholar] [CrossRef]
- Eastwood, M.D.; Haapala, K.R. A unit process model based methodology to assist product sustainability assessment during design for manufacturing. J. Clean. Prod. 2015, 108, 54–64. [Google Scholar] [CrossRef]
- Haapala, K.R.; Zhao, F.; Camelio, J.; Sutherland, J.W.; Skerlos, S.; Dornfeld, D.; Rickli, J.L. A Review of Engineering Research in Sustainable Manufacturing. J. Manuf. Sci. Eng. 2013, 135, 041013. [Google Scholar] [CrossRef] [Green Version]
- Sajan, M.P.; Shalij, P.R.; Ramesh, A.; Biju, A.P. Lean manufacturing practices in Indian manufacturing SMEs and their effect on sustainability performance. J. Manuf. Technol. Manag. 2017, 28, 772–793. [Google Scholar]
- Kassem, E.; Trenz, O. Automated Sustainability Assessment System for Small and Medium Enterprises Reporting. Sustainability 2020, 12, 5687. [Google Scholar] [CrossRef]
- Lopes de Sousa Jabbour, A.B.; Ndubisi, N.O.; Roman Pais Seles, B.M. Sustainable development in Asian manufacturing SMEs: Progress and directions. Int. J. Prod. Econ. 2020, 225, 107567. [Google Scholar] [CrossRef]
- Belas, J.; Strnad, Z.; Gavurová, B.; Cepel, M.; Bilan, Y. Business environment quality factors research—Sme management´s platform. Pol. J. Manag. Stud. 2019, 20, 64–75. [Google Scholar]
- Mitchell, S.; O’Dowd, P.; Dimache, A. Manufacturing SMEs doing it for themselves: Developing, testing and piloting an online sustainability and eco-innovation toolkit for SMEs. Int. J. Sustain. Eng. 2020, 13, 159–170. [Google Scholar] [CrossRef]
- Journeault, M.; Perron, A.; Vallières, L. The collaborative roles of stakeholders in supporting the adoption of sustainability in SMEs. J. Environ. Manag. 2021, 287, 112349. [Google Scholar] [CrossRef]
- Choi, S.; Lee, J.Y. Development of a framework for the integration and management of sustainability for small- and medium-sized enterprises. Int. J. Comput. Integr. Manuf. 2017, 30, 1190–1202. [Google Scholar] [CrossRef]
- Hsu, C.H.; Chang, A.Y.; Luo, W. Identifying key performance factors for sustainability development of SMEs—Integrating QFD and fuzzy MADM methods. J. Clean. Prod. 2017, 161, 629–645. [Google Scholar] [CrossRef]
- Singh, S.; Olugu, E.U.; Fallahpour, A. Fuzzy-based sustainable manufacturing assessment model for SMEs. Clean Technol. Environ. Policy 2014, 16, 847–860. [Google Scholar] [CrossRef]
- Winroth, M.; Almstrom, P.; Andersson, C. Sustainable production indicators at factory level. J. Manuf. Technol. Manag. 2016, 27, 842–873. [Google Scholar] [CrossRef]
- Deselnicu, V.; Crudu, M.; Zãinescu, G.; Albu, M.G.; Deselnicu, D.C.; Guţã, S.A.; Bostaca, G. Innovative materials and technologies for sustainable production in leather and footwear sector. Rev. Piel. Incaltaminte 2014, 14, 147–158. [Google Scholar] [CrossRef]
- Subic, A.; Shabani, B.; Hedayati, M.; Crossin, E. Performance analysis of the capability assessment tool for sustainable manufacturing. Sustainability 2013, 5, 3543–3561. [Google Scholar] [CrossRef] [Green Version]
- Assocalzaturifici. The Italian Footwear Industry—2019 Preliminary Results; Confindustria Moda Research Centre: Milan, Italy, 2020. [Google Scholar]
- Ahi, P.; Searcy, C. An analysis of metrics used to measure performance in green and sustainable supply chains. J. Clean. Prod. 2015, 86, 360–377. [Google Scholar] [CrossRef]
- Ahmad, S.; Wong, K.Y.; Rajoo, S. Sustainability indicators for manufacturing sectors: A literature survey and maturity analysis from the triple-bottom line perspective. J. Manuf. Technol. Manag. 2019, 30, 312–334. [Google Scholar] [CrossRef]
- Forza, C. Survey research in operations management: A process-based perspective. Int. J. Oper. Prod. Manag. 2002, 22, 152–194. [Google Scholar] [CrossRef] [Green Version]
- Padilla-Rivera, A.; do Carmo, B.B.T.; Arcese, G.; Merveille, N. Social circular economy indicators: Selection through fuzzy delphi method. Sustain. Prod. Consum 2021, 26, 101–110. [Google Scholar] [CrossRef]
- Tahriri, F.; Mousavi, M.; Hozhabri Haghighi, S.; Zawiah Md Dawal, S. The application of fuzzy Delphi and fuzzy inference system in supplier ranking and selection. J. Ind. Eng. Int. 2014, 10, 66. [Google Scholar] [CrossRef] [Green Version]
- Clayton, M.J. Delphi: A technique to harness expert opinion for critical decision-making tasks in education. Educ. Psychol. 1997, 17, 373–386. [Google Scholar] [CrossRef]
- Tsai, H.-C.; Lee, A.-S.; Lee, H.-N.; Chen, C.-N.; Liu, Y.-C. An Application of the Fuzzy Delphi Method and Fuzzy AHP on the Discussion of Training Indicators for the Regional Competition, Taiwan National Skills Competition, in the Trade of Joinery. Sustainability 2020, 12, 4290. [Google Scholar] [CrossRef]
- Lee, C.-H.; Wu, K.-J.; Tseng, M.-L. Resource management practice through eco-innovation toward sustainable development using qualitative information and quantitative data. J. Clean. Prod. 2018, 202, 120–129. [Google Scholar] [CrossRef]
- Hsu, Y.-L.; Lee, C.-H.; Kreng, V.B. The application of Fuzzy Delphi Method and Fuzzy AHP in lubricant regenerative technology selection. Expert Syst. Appl. 2010, 37, 419–425. [Google Scholar] [CrossRef]
- Zhang, J. Evaluating regional low-carbon tourism strategies using the fuzzy Delphi- analytic network process approach. J. Clean. Prod. 2017, 141, 409–419. [Google Scholar] [CrossRef]
- Ma, Z.; Shao, C.; Ma, S.; Ye, Z. Constructing road safety performance indicators using Fuzzy Delphi Method and Grey Delphi Method. Expert Syst. Appl. 2011, 38, 1509–1514. [Google Scholar] [CrossRef]
- Kuo, Y.-F.; Chen, P.-C. Constructing performance appraisal indicators for mobility of the service industries using Fuzzy Delphi Method. Expert Syst. Appl. 2008, 35, 1930–1939. [Google Scholar] [CrossRef]
- Vitale, G.; Cupertino, S.; Rinaldi, L.; Riccaboni, A. Integrated Management Approach Towards Sustainability: An Egyptian Business Case Study. Sustainability 2019, 11, 1244. [Google Scholar] [CrossRef] [Green Version]
- Song, Z.; Moon, Y. Sustainability metrics for assessing manufacturing systems: A distance-to-target methodology. Environ. Dev. Sustain. 2019, 21, 2811–2834. [Google Scholar] [CrossRef]
- Agrawal, R.; Vinodh, S. Sustainability evaluation of additive manufacturing processes using grey-based approach. Grey Syst. Theory Appl. 2020, 10, 393–412. [Google Scholar] [CrossRef]
- Singh, R.K.; Modgil, S.; Tiwari, A.A. Identification and evaluation of determinants of sustainable manufacturing: A case of Indian cement manufacturing. Meas. Bus. Excell. 2019, 23, 24–40. [Google Scholar] [CrossRef]
- Abedini, A.; Li, W.; Badurdeen, F.; Jawahir, I.S. A metric-based framework for sustainable production scheduling. J. Manuf. Syst. 2020, 54, 174–185. [Google Scholar] [CrossRef]
- Hasan, M.S.; Ebrahim, Z.; Wan Mahmood, W.H.; Ab Rahman, M.N. Sustainable-ERP system: A preliminary study on sustainability indicators. JAMT 2017, 11, 61–74. [Google Scholar]
- Wu, K.J.; Tseng, M.L.; Lim, M.K.; Chiu, A.S.F. Causal sustainable resource management model using a hierarchical structure and linguistic preferences. J. Clean. Prod. 2019, 229, 640–651. [Google Scholar] [CrossRef]
- Raj, A.; Srivastava, S.K. Sustainability performance assessment of an aircraft manufacturing firm. Benchmarking 2018, 25, 1500–1527. [Google Scholar] [CrossRef]
- Huang, A.; Badurdeen, F. Sustainable manufacturing performance evaluation at the enterprise level: Index- And value-based methods. Smart Sustain. Manuf. Syst. 2017, 1, 178–203. [Google Scholar] [CrossRef]
- Moldavska, A.; Welo, T. Testing and verification of a new corporate sustainability assessment method for manufacturing: A multiple case research study. Sustainability 2018, 10, 4121. [Google Scholar] [CrossRef] [Green Version]
- Demartini, M.; Pinna, C.; Aliakbarian, B.; Tonelli, F.; Terzi, S. Soft Drink Supply Chain Sustainability: A Case Based Approach to Identify and Explain Best Practices and Key Performance Indicators. Sustainability 2018, 10, 3540. [Google Scholar] [CrossRef] [Green Version]
- Elhuni, R.M.; Ahmad, M.M. Key Performance Indicators for Sustainable Production Evaluation in Oil and Gas Sector. Procedia Manuf. 2017, 11, 718–724. [Google Scholar] [CrossRef]
- Feil, A.A.; de Quevedo, D.M.; Schreiber, D. Selection and identification of the indicators for quickly measuring sustainability in micro and small furniture industries. Sustain. Prod. Consum. 2015, 3, 34–44. [Google Scholar] [CrossRef]
- Harik, R.; El Hachem, W.; Medini, K.; Bernard, A. Towards a holistic sustainability index for measuring sustainability of manufacturing companies. Int. J. Prod. Res. 2015, 53, 4117–4139. [Google Scholar] [CrossRef]
- Moldavska, A.; Welo, T. A Holistic approach to corporate sustainability assessment: Incorporating sustainable development goals into sustainable manufacturing performance evaluation. J. Manuf. Syst. 2019, 50, 53–68. [Google Scholar] [CrossRef]
- Singh, S.; Olugu, E.U.; Musa, S.N.; Mahat, A.B. Fuzzy-based sustainability evaluation method for manufacturing SMEs using balanced scorecard framework. J. Intell. Manuf. 2018, 29, 1–18. [Google Scholar] [CrossRef]
- Vinodh, S.; Ben Ruben, R.; Asokan, P. Life cycle assessment integrated value stream mapping framework to ensure sustainable manufacturing: A case study. Clean Technol. Environ. Policy 2016, 18, 279–295. [Google Scholar] [CrossRef]
- Lee, J.Y.; Kang, H.S.; Noh, S.D. MAS2: An integrated modeling and simulation-based life cycle evaluation approach for sustainable manufacturing. J. Clean. Prod. 2014, 66, 146–163. [Google Scholar] [CrossRef]
- Yakovleva, N.; Flynn, A. Innovation and sustainability in the food system: A case of chicken production and consumption in the UK. J. Environ. Policy Plan. 2004, 6, 227–250. [Google Scholar] [CrossRef]
- Shuaib, M.; Seevers, D.; Zhang, X.; Badurdeen, F.; Rouch, K.E.; Jawahir, I.S. Product sustainability index (ProdSI): A metrics-based framework to evaluate the total life cycle sustainability of manufactured products. J. Ind. Ecol. 2014, 18, 491–507. [Google Scholar] [CrossRef]
- Li, T.; Zhang, H.; Yuan, C.; Liu, Z.; Fan, C. A PCA-based method for construction of composite sustainability indicators. Int. J. Life Cycle Assess 2012, 17, 593–603. [Google Scholar] [CrossRef]
- OECD. OECD Glossary of Statistical Terms; OECD Publishing: Paris, France, 2008. [Google Scholar]
- GRI. GRI Standards Glossary; GRI: Amsterdam, The Netherlands, 2020. [Google Scholar]
- Tseng, M.L. Modeling sustainable production indicators with linguistic preferences. J. Clean. Prod. 2013, 40, 46–56. [Google Scholar] [CrossRef]
- Veleva, V.; Ellenbecker, M. Indicators of sustainable production: Framework and methodology. J. Clean. Prod. 2001, 9, 519–549. [Google Scholar] [CrossRef]
- GRI. GRI Sustainability Reporting Standards (GRI Standards); GRI: Amsterdam, The Netherlands, 2016. [Google Scholar]
- Staikos, T.; Rahimifard, S. An end-of-life decision support tool for product recovery considerations in the footwear industry. Int. J. Comput. Integr. Manuf. 2007, 20, 602–615. [Google Scholar] [CrossRef]
- Sellitto, M.A.; de Almeida, F.A. Strategies for value recovery from industrial waste: Case studies of six industries from Brazil. Benchmark. Int. J. 2019, 27, 867–885. [Google Scholar] [CrossRef]
- Scott, A.J. The Changing Global Geography of Low-Technology, Labor-Intensive Industry: Clothing, Footwear, and Furniture. World Dev. 2006, 34, 1517–1536. [Google Scholar] [CrossRef]
- Grecu, V.; Ciobotea, R.-I.-G.; Florea, A. Software Application for Organizational Sustainability Performance Assessment. Sustainability 2020, 12, 4435. [Google Scholar] [CrossRef]


| Variable | Position | Frequency | Percentage (%) |
|---|---|---|---|
| Position | Chief Executive Officer/General Manager | 21 | 44% |
| Production Manager | 7 | 15% | |
| Operation Manager | 9 | 19% | |
| Expert/Professional Employee of Sustainability | 6 | 13% | |
| Others | 5 | 10% | |
| Work Experience | Over 20 years | 23 | 49% |
| 15 to 20 years | 4 | 9% | |
| 10 to 15 years | 10 | 21% | |
| 5 to 10 years | 6 | 13% | |
| Less than 5 years | 4 | 9% |
| Fuzzy Scales | Linguistic Variables | Triangular Fuzzy Numbers (a, b, c) |
|---|---|---|
| 1 | Not important (NI) | (1, 1, 3) |
| 3 | Slightly important (SI) | (1, 3, 5) |
| 5 | Moderately important (MI) | (3, 5, 7) |
| 7 | Important (I) | (5, 7, 9) |
| 9 | Very important (VI) | (7, 9, 9) |
| Frequency of Use | Identified Indicators | Frequency of Use | Identified Indicators |
|---|---|---|---|
| 1 | 860 | 15 | |
| 2 | 58 | 16 | |
| 3 | 35 | 17 | 1 |
| 4 | 16 | 18 | 1 |
| 5 | 13 | 19 | |
| 6 | 10 | 20 | |
| 7 | 6 | 21 | |
| 8 | 1 | 22 | |
| 9 | 1 | 23 | |
| 10 | 1 | 24 | |
| 11 | 4 | 25 | |
| 12 | 1 | 26 | 1 |
| 13 | 1 | 27 | 1 |
| 14 | 2 | Total | 1013 |
| Indicators for Economic Dimension | Frequency of Use | Indicators for Environmental Dimension | Frequency of Use | Indicators for Social Dimension | Frequency of Use |
|---|---|---|---|---|---|
| Profit | 14 | Water consumption | 27 | Employment/Job opportunity | 11 |
| Research and development expenditure | 14 | Energy consumption | 26 | Employee turnover | 11 |
| Product quality | 13 | Greenhouse gas emissions | 18 | Work-related injuries | 10 |
| Revenue | 12 | Material consumption | 17 | Customer satisfaction | 7 |
| Material cost | 11 | Renewable energy use | 9 | Employee satisfaction | 6 |
| Labor cost | 11 | Recycled water use | 7 | Working hours | 6 |
| Energy cost | 8 | Recycled material use | 7 | Corruption | 6 |
| Operating/Operational cost | 7 | Wastewater discharge | 7 | Occupational health and safety | 5 |
| Maintenance cost | 6 | Hazardous waste | 7 | Training and development | 5 |
| Production cost | 6 | Land use | 6 | Fair salary | 5 |
| Packaging cost | 6 | Solid waste | 6 | Customer complaints | 5 |
| Lead time | 6 | Recyclable waste | 6 | Lost working days | 5 |
| Inventory cost | 5 | Packaging material consumption | 5 | ||
| On-time delivery | 5 | Electricity consumption | 5 | ||
| Air emissions | 5 | ||||
| Global warming potential | 5 | ||||
| Energy efficiency | 5 | ||||
| Energy intensity | 5 |
| Sustainability Dimensions | Indicators | Short Descriptions |
|---|---|---|
| Economic | Profit | Excess revenue over the cost of producing the product [71] |
| Revenue | Value of output (product) sold, i.e., the number of products sold times the unit price [71] | |
| Research and development expenditure | Expenses allocated to carry out research and development (R&D) activities [71] | |
| Material cost | Cost of input materials used to produce the product [71] | |
| Labor cost | Salaries and wages of active employees, pensions, various social charges, and related costs [71] | |
| Energy cost | Cost allocated for the quantity of energy consumed [71] | |
| Maintenance cost | Costs (such as expenses for lubricants, spare parts, tools and equipment, and maintenance crew) incurred to carry out maintenance activities [71] | |
| Packaging cost | Cost allocated for packaging material | |
| Inventory cost | Expenses associated with holding and storing raw materials and products | |
| Product quality | Features incorporated that can meet customer needs | |
| Lead time | Time between order placement and shipment | |
| On-time delivery | Delivery of finished products on time | |
| Environmental | Water consumption | Use of water for processing, washing, drinking, and related activities [71] |
| Recycled water use | Reuse of wastewater after treatment [8] | |
| Energy consumption | Use of energy (electricity, fuel) for manufacturing process, lighting, heating, and other purposes [71] | |
| Renewable energy use | Use of energy comes from renewable sources such as solar, wind, hydro, biomass, and others [72] | |
| Energy efficiency | Ratio of energy used in manufacturing process, heating, lighting, and other purposes to input energy [51] | |
| Material consumption | Input materials consumed to produce the output (product) [19] | |
| Recycled material use | Use of recycled input materials by replacing virgin materials [72] | |
| Packaging material consumption | Use of materials such as containers or wrapping for handling, protecting, and marketing the product | |
| Land use | Use of land for industrial activities [71] | |
| Greenhouse gas emissions | Release of greenhouse gases (GHGs) such as carbon dioxide (CO2), nitrous oxide (N2O), methane (CH4), chlorofluorocarbons (CFCs), and others contributing to the greenhouse effect/global warming [71] | |
| Wastewater discharge | Industrial sewage (used water) released to surface water, groundwater, seawater, or a third party [72] | |
| Hazardous waste | Waste with toxic, infectious, radioactive, or flammable properties that poses a potential hazard to human health, other living organisms, and the environment [71] | |
| Solid waste disposal | Disposal of solid waste (waste with low liquid content) that is not recycled [71] | |
| Recyclable waste | Waste that can be used in the production and consumption processes [71] | |
| Social | Employment/Job opportunity | Opportunities created for employment [71] |
| Fair salary | Regular fair payments to employees for their service [71] | |
| Employee turnover | Employees leaving the organization voluntarily or due to dismissal, retirement, or death [72] | |
| Employee satisfaction | Contentment of employees with their job | |
| Occupational health and safety | Promotion of employee health and safety by preventing work-related injuries and illnesses [72] | |
| Training and development | Organizational activities to enhance employees’ knowledge and skills for the better performance of specific tasks | |
| Working conditions | Promoting a safe working environment by preventing work-related injuries and illnesses due to exposure to hazardous substances, dust, high temperature, loud noise, and other risk factors | |
| Work-related injuries | Injuries arising from exposure to hazards and accidents at work [72] | |
| Working hours | Hours that employees spend doing paid work [71] | |
| Lost Working days | Lost days due to work-related injuries and illnesses [73,74] | |
| Customer health and safety | Systematic efforts to address incidents concerning the health and safety impacts of products and services on customers [75] | |
| Customer satisfaction | How well customers’ needs are met by the products and services offered | |
| Customer complaints | Customers’ feedback on the products and services that did not meet their needs | |
| Corruption | Abuse of power in leadership for personal, financial, or other benefits [71,72] |
| Sustainability Dimensions | Indicators (i) | Aggregate Fuzzy Opinion | Defuzzified Score (Si) | Selected | ||
|---|---|---|---|---|---|---|
| Min (lij) | Optimum (mij) | Max (uij) | ||||
| Economic | Profit | 4.82 | 6.97 | 8.38 | 6.72 | Yes |
| Revenue | 4.43 | 6.56 | 8.29 | 6.43 | Yes | |
| Research and development expenditure | 4.11 | 6.18 | 7.84 | 6.04 | Yes | |
| Material cost | 3.67 | 5.76 | 7.69 | 5.71 | Yes | |
| Labor cost | 4.05 | 6.21 | 7.94 | 6.06 | Yes | |
| Energy cost | 3.26 | 5.54 | 7.48 | 5.42 | ||
| Maintenance cost | 2.92 | 4.71 | 6.86 | 4.83 | ||
| Packaging cost | 2.45 | 4.53 | 6.67 | 4.55 | ||
| Inventory cost | 2.68 | 4.51 | 6.72 | 4.64 | ||
| Product quality | 6.07 | 8.16 | 8.84 | 7.69 | Yes | |
| Lead time | 5.55 | 7.61 | 8.72 | 7.29 | Yes | |
| On-time delivery | 5.89 | 7.94 | 8.86 | 7.56 | Yes | |
| Environmental | Water consumption | 2.28 | 3.49 | 5.72 | 3.83 | |
| Recycled water use | 2.36 | 3.40 | 5.70 | 3.82 | ||
| Energy consumption | 3.48 | 5.36 | 7.35 | 5.40 | ||
| Renewable energy use | 3.23 | 5.28 | 7.17 | 5.23 | ||
| Energy efficiency | 3.80 | 5.81 | 7.55 | 5.72 | Yes | |
| Energy intensity | 2.97 | 4.91 | 6.96 | 4.95 | ||
| Material consumption | 4.51 | 6.66 | 8.16 | 6.44 | Yes | |
| Recycled material use | 3.98 | 6.10 | 7.81 | 5.96 | Yes | |
| Packaging material consumption | 3.53 | 5.26 | 7.28 | 5.36 | ||
| Land use | 2.17 | 3.72 | 5.90 | 3.93 | ||
| Greenhouse gas emissions | 2.49 | 4.32 | 6.32 | 4.37 | ||
| Wastewater discharge | 2.28 | 3.83 | 5.97 | 4.03 | ||
| Solid waste disposal | 3.13 | 5.16 | 7.13 | 5.14 | ||
| Recyclable waste | 3.05 | 5.12 | 7.00 | 5.05 | ||
| Social | Employment/Job opportunity | 4.61 | 6.78 | 8.41 | 6.60 | Yes |
| Fair salary | 5.15 | 7.22 | 8.59 | 6.99 | Yes | |
| Employee turnover | 3.78 | 5.86 | 7.66 | 5.77 | Yes | |
| Employee satisfaction | 5.43 | 7.49 | 8.72 | 7.22 | Yes | |
| Occupational health and safety | 5.31 | 7.42 | 8.57 | 7.10 | Yes | |
| Training and development | 4.94 | 7.00 | 8.59 | 6.84 | Yes | |
| Working conditions | 5.67 | 7.73 | 8.72 | 7.37 | Yes | |
| Work-related injuries | 5.51 | 7.57 | 8.72 | 7.27 | Yes | |
| Working hours | 4.33 | 6.50 | 8.15 | 6.32 | Yes | |
| Lost working days | 3.74 | 5.97 | 7.73 | 5.81 | Yes | |
| Customer health and safety | 5.22 | 7.17 | 8.44 | 6.94 | Yes | |
| Customer satisfaction | 6.34 | 8.38 | 8.91 | 7.88 | Yes | |
| Customer complaints | 5.60 | 7.70 | 8.71 | 7.34 | Yes | |
| Corruption | 3.20 | 4.53 | 6.65 | 4.79 | ||
| Indicators | Metrics | Adapted From | |
|---|---|---|---|
| Absolute | Relative | ||
| Profit | Net profit gained during the reporting period (USD, Euro) | Net profit to total revenue ratio (%) | [61] |
| Revenue | Total revenue generated during the reporting period (USD, Euro) | Revenue generated per unit of product sold (USD, Euro/uop) | [19] |
| Research & development expenditure | R&D spending during the reporting period (USD, Euro) | R&D spending to total revenue ratio (%) | [19,79] |
| Material cost | Total material cost during the reporting period (USD, Euro) | Percentage of material cost relative to total revenue (%) | [19] |
| Labor cost | Total labor cost during the reporting period (USD, Euro) | Percentage of labor cost relative to total revenue (%) | [19] |
| Product quality | Number of products that met customer requirements during the reporting period (#) | Percentage of products that met customer requirements (%) | Proposed metrics |
| Lead time | Total number of products produced within the required lead time (#) | Percentage of products produced within the required lead time (%) | Proposed metrics |
| On-time delivery | Total number of products delivered on time during the reporting period (#) | Percentage of products delivered on time (%) | Proposed metrics |
| Material consumption | Total weight or volume of materials consumed during the reporting period (kg, m3, L, m2, pc) | Material consumption per unit of product produced (kg, m3, l, m2, pc/uop); material efficiency (%); percentage of biodegradable materials used (%); percentage of renewable materials used (%); percentage of hazardous materials used (%) | [1,74] |
| Recycled material use | Total weight or volume of recycled materials used during the reporting period (kg, m3, L, m2, pc) | Percentage of recycled materials used (%) | [1] |
| Energy efficiency | ---- | Ratio of final energy used for production to the total input energy (%) | [51] |
| Employment/Job opportunity | Total number of new employees hired during the reporting period (#) | Recruitment efficiency (%) | [75] |
| Fair salary | ---- | Average salary per employee (USD, Euro/emp) | [19] |
| Employee turnover | Total number of employee turnover during the reporting period (#) | Percentage of employee turnover (%) | [1,75] |
| Employee satisfaction | Total number of employees who reported job satisfaction during the reporting period (#) | Percentage of employees who reported job satisfaction (%) | [1,74] |
| Occupational health and safety (OHS) | Total number of employees covered by the OHS program (#); total number of fatalities as a result of work-related injuries (#); total number of fatalities as a result of work-related illnesses (#); total number of cases of work-related illnesses during the reporting period (#) | Percentage of employees covered by OHS program (%); percentage of fatalities as a result of work-related injuries (%); percentage of fatalities as a result of work-related illnesses (%); percentage of cases of work-related illnesses (%) | [75] |
| Training and development | Total number of total employees who received a regular performance and career development review (#); total training hours during the reporting period (h) | Percentage of employees who received a regular performance and career development review (%); average training hours per employee (h/emp) | [75] |
| Working conditions | Total number of employees working in decent conditions (#) | Percentage of employees working in decent conditions (%) | Proposed metrics |
| Work-related injuries | Total number of work-related injuries during the reporting period (#) | Work-related injuries per employee (#/emp) | [75] |
| Working hours | Total working hours during the reporting period (h) | Average working hours per employee (h/emp) | [8] |
| Lost Working days | Total lost working days due to injuries and illnesses during the reporting period (day) | Percentage of lost working days due to injuries and illnesses (%) | [73,74] |
| Number of employees | Total number of active employees during the reporting period (#) | Number of active employees per unit of product produced (#/uop) | [3,74] |
| Customer health and safety | Total number of incidents concerning the health and safety impacts of the products and services provided during the reporting period (#) | Number of health and safety incidents per unit of product sold (#/uop) | [75] |
| Customer satisfaction | Total number of customers who reported satisfaction with the products and services offered during the reporting period (#) | Percentage of customers who reported satisfaction with the products and services offered (%) | [19] |
| Customer complaints | Total number of customer complaints during the reporting period (#) | Customer complaints per unit of product sold (#/uop) | [19,74] |
Publisher’s Note: MDPI stays neutral with regard to jurisdictional claims in published maps and institutional affiliations. |
© 2021 by the authors. Licensee MDPI, Basel, Switzerland. This article is an open access article distributed under the terms and conditions of the Creative Commons Attribution (CC BY) license (https://creativecommons.org/licenses/by/4.0/).
Share and Cite
Mengistu, A.T.; Panizzolo, R. Indicators and Framework for Measuring Industrial Sustainability in Italian Footwear Small and Medium Enterprises. Sustainability 2021, 13, 5472. https://doi.org/10.3390/su13105472
Mengistu AT, Panizzolo R. Indicators and Framework for Measuring Industrial Sustainability in Italian Footwear Small and Medium Enterprises. Sustainability. 2021; 13(10):5472. https://doi.org/10.3390/su13105472
Chicago/Turabian StyleMengistu, Azemeraw Tadesse, and Roberto Panizzolo. 2021. "Indicators and Framework for Measuring Industrial Sustainability in Italian Footwear Small and Medium Enterprises" Sustainability 13, no. 10: 5472. https://doi.org/10.3390/su13105472