Article

The Selection of Intermodal Transport System Scenarios in the Function of Southeastern Europe Regional Development

1
Logistic Department, Faculty of Transport and Traffic Engineering, University of Belgrade, 11000 Belgrade, Serbia
2
Department of Technology Management and Economics, Chalmers University of Technology, 41296 Gothenburg, Sweden
3
Faculty of Transport and Traffic Sciences, University of Zagreb, 10000 Zagreb, Croatia
*
Author to whom correspondence should be addressed.
Sustainability 2021, 13(10), 5590; https://doi.org/10.3390/su13105590
Submission received: 15 April 2021 / Revised: 7 May 2021 / Accepted: 14 May 2021 / Published: 17 May 2021
(This article belongs to the Special Issue Dry Port Management and Sustainable Regional Development)

Abstract

:
The development of intermodal transportation (IT) systems is of vital importance for the sustainability of logistics activities. The existing research point at individual directions of action for system improvement and increase of IT participation in overall transportation, thus reducing negative impacts of logistics on sustainability. However, there is a lack of research defining complex scenarios that unite existing ideas and concepts of IT system development and improvement. Accordingly, this article deals with the definition and selection of the most appropriate IT development scenario for the region of Southeastern Europe. Six different potential scenarios that differ in the network configuration, the required level of logistics infrastructure development, the role of different IT terminal categories, the involvement of different transportation modes, and goods flows’ transformation degree, are defined. The scenarios are analyzed according to four stakeholder groups and twelve defined criteria. A novel hybrid multi-criteria decision-making model, based on fuzzy Delphi, fuzzy Factor Relationship (FARE), and fuzzy Measurement of Alternatives and Ranking according to Compromise Solution (MARCOS) methods, is developed for solving the problem. The definition and analysis of the problem, the way of establishing the scenarios, as well as the development of a novel hybrid model are the main contributions of this article. A significant contribution is also the consideration of the Dry Port (DP) concept for the first time in the context of river ports. The results indicate that the scenario referring to the development of the IT core network with the Danube DP terminals is potentially the most appropriate scenario for the Southeastern Europe IT system.

1. Introduction

Caused by the ongoing global market trends, the efficiency of businesses in all economy branches directly depends on the efficiency of logistics processes/activities that are being realized. Logistics systems must be able to respond to market changes, the growing trend of global trade of goods, changes in ways of doing business, strong competition, demographic, economic and political changes. It can be stated that the modern way of living greatly depends on the efficiency of logistics systems.
Transportation is the logistics activity with the most negative consequences—the most dominant of which are air pollutant emissions, noise, traffic congestions and safety risks, and as such, challenges the sustainability of logistics systems the most. To make logistics systems more sustainable, intensive planning and development of intermodal transportation (IT) systems are necessary [1]. IT is defined as the movement of goods in one and the same loading unit or vehicle, which successively uses two or more transportation modes, without handling the goods themselves when changing the modes [2]. The main idea of IT is the utilization of alternative transportation modes (rail, inland waterway, and sea) for making the logistics system more efficient through cost reduction and time savings [3]. Furthermore, through the utilization of IT, negative environmental impacts of logistics activities are reduced [4].
The planning and development of IT systems are not simple processes because they involve a large number of actors [5], a complex problem structure [6], and many criteria [7] according to which the stakeholders potentiate the direction of actions. The development of IT systems must be preceded by the definition and selection of appropriate scenarios in accordance with the specific conditions and interests of all stakeholders, with the aim of acceptability and sustainability [8,9]. The development of an IT system, based on the selected scenario, sets the direction of regional development by affecting not only logistics growth but the economic, social, and environmental aspects of modern lifestyle [10]. It is obvious that the selection of IT system development direction should be treated as one of the most important problems regarding the strategic decision-making level in IT.
The aim of this paper is to develop a model for selecting the most appropriate IT system scenario among the defined scenarios and according to the defined criteria. The problem is solved in the function of regional development of Southeastern Europe. Six scenarios, that differ in the network configuration, the required level of logistics infrastructure development, the role of different IT terminal categories, the involvement of different transportation modes, and goods flows’ transformation degree, are defined. The problem is analyzed according to four stakeholder groups—logistics service users, logistics service providers, administration (authorities, institutions, organizations), residents, and twelve scenario evaluation criteria. Due to the presence of different interpretations, attitudes, incomplete information and the nature of some criteria, the process of problem-solving is conducted in the fuzzy environment. A novel hybrid multi-criteria decision-making (MCDM) model, based on fuzzy Delphi-based fuzzy Factor Relationship (FARE) (fuzzy D-FARE) and fuzzy Measurement of Alternatives and Ranking according to Compromise Solution (MARCOS), is developed for solving the problem. An innovative approach of defining and selecting the IT system scenario, introduction of the Dry Port (DP) concept in the river ports context, as well as the development of a novel hybrid MCDM model are the main contributions of this article.
The article is organized as follows. The next section contains a literature review concerning the analyzed problem and the methods used for solving it. Section 3 explains the newly developed hybrid MCDM model, based on the fuzzy D-FARE and fuzzy MARCOS methods. IT system development scenarios for the region of Southeastern Europe and the criteria used for their evaluation are presented in Section 4. The application of the hybrid MCDM model for the analyzed problem, as well as the setup of input parameters, is described in Section 5. Section 6 contains the results and discussion, which is followed by a section containing the concluding remarks and implications for future research directions.

2. Literature Review

This section provides an overview of the current state and treatment of IT in the scientific literature, its status in Southeastern Europe, the main problems that require attention during the planning, development and expansion of the IT networks, MCDM methods and models used for solving IT-related problems, as well as the most common criteria considered in solving those problems.

2.1. Treatment of IT in the Scientific Literature and Its Status in Southeastern Europe

The research regarding IT can be classified on those mainly dealing with [11]: regulatory frameworks that would stimulate the IT development [12,13], terminal network planning [14,15], IT service network design [16,17], routing in IT [18,19], drayage operations [20,21], innovations that support the IT development [22,23]. In contrast with the scientific literature where clear research boundaries, goals, methods, and conclusions exist, the area of IT is differently treated in official development plans of countries.
West European countries like Germany, Austria, Belgium, The Netherlands, etc., in their plans, have precisely defined directions of the IT development, they are engaged in the promotion of alternative transportation modes and have established funding sources for IT projects [24]. The state of the IT system in most of the countries of Southeastern Europe is not at a satisfactory level and greatly falls behind the IT system of Western Europe [25]. The European Union has funded several projects, such as LOGIQ, PROMOTIQ, SULOGTRA, RECORDIT, PACT, Marco Polo I, Marco Polo II, intending to promote IT usage, but specific measures for improving the participation of IT in overall transportation is still absent [26,27]. A large number of small-capacity IT terminals exist in the region of Southeastern Europe, but they are mainly underdeveloped, unutilized and inadequately included in the realization of goods flows [28].
One of the reasons for insufficient IT participation in overall transportation in Europe is the inadequate connection between rail and inland waterway transportation modes as alternatives to road transportation [16]. During the planning of the IT network expansion, the existing IT terminals must be considered so that the newly-developed ones would not endanger their profitability and efficiency by causing additional competitive pressure [15,29]. The lack of regulatory frameworks, responsible institutions, international harmonization, and the required collaboration among stakeholders are still the main obstacles for developing IT systems [30]. Besides the regional and intercontinental goods flows, IT should also be developed in the direction of including the flows of lesser volumes and on shorter distances [31,32].
Special attention in the literature is focused on the DP concept as a direction of a seaport hinterland IT system development. Precisely, DP is a subsystem of a seaport terminal that is physically located in the continent hinterland, has established regular rail connection with its seaport terminal, and offers all services of the seaport terminal but in the continent hinterland [33]. The DP concept enhances the performances of the seaport terminals, provides them with the required capacities, improves the available services that a seaport terminal could offer to the market, and therefore it greatly affects their competitiveness, which results in the attraction of greater container flow volumes [34] and efficiency improvement of the whole hinterland IT system. Besides the common main features, DP terminals can also differ in the location and functions (close, mid-range, distant), development direction (inside-out, outside-in, in one direction, bidirectional, land-driven, sea-driven), dedication (private, public, shared, dedicated for specific enterprises and flows), catchment area (local, regional), dominant transportation mode (road, rail, inland waterway) [35].
The existing research of the DP concept focused exclusively on the container flows that pass through seaport terminals. Having in mind that the profitability of IT mainly varies according to the analyzed flows, state of the market, spatial and geographic characteristics and logistics systems development degree, it is important to define the development direction of the DP concept and the IT system as well [36]. More or less, all regions of the world have been analyzed through the concept of DP [37,38,39,40,41,42,43], therefore several research articles covering this topic for the region of Southeastern Europe exist as well [44,45,46,47,48]. The main advantage of the DP concept in the context of IT network modelling is its adaptiveness and configurability to different structures of IT systems, geographical regions, and different goods flow categories. So far, the researchers have not considered the DP concept in the context of river ports, and that literature gap is filled with this article.

2.2. Review of MCDM Methods and Models Used for Problem-Solving in the Area of IT

Application of MCDM methods has a strong presence in the area of IT because, in most cases, the problems have multi-criterial character caused by the presence of different stakeholders, thus requiring a compromise solution [49]. The following text highlights some of the methods and models that have been lately used in this research area.
A hybrid fuzzy SWARA and fuzzy MARCOS model is used for the assessment of IT system conditions in the countries of the Danube region [25]. The fuzzy AHP method is, in the combination with artificial neural networks, used for the problem of route selection in IT [50]. The same problem is also solved with a fuzzy Delphi and fuzzy ELECTRE I model [51]. The prioritization of IT terminal development characteristics is conducted through the application of a combined Delphi, ANP and QFD model in the fuzzy environment [1]. The problem of handling equipment selection for an IT terminal is solved by a fuzzy SWARA and fuzzy BWM model [52]. The interdependence analysis among factors that influence the development of sustainable IT systems and their prioritization is performed by applying the grey-DANP method [53]. The selection of Roll-on Roll-off seaport for the realization of an IT chain is conducted with a combined CRITIC and EDAS model [54], while the seaport terminal selection for the realization of observed flows is carried out with a hybrid TOPSIS and AHP model [55]. MCDM methods are also widely used for solving the problems of IT terminal locations. Some of the combinations used for solving this class of problems are SWOT, AHP and PROMETHEE [56], fuzzy AHP and artificial neural networks [57] and fuzzy Delphi, fuzzy ANP and fuzzy VIKOR [58]. So far, the combination of fuzzy D-FARE and fuzzy MARCOS methods for solving MCDM problems was not considered in any research area.

2.3. Review of Relevant Criteria for Decision-Making in the Area of IT

Various criteria have been considered in the literature for solving individual IT problems in accordance with the research topic, problem type, applied method, but also the considered stakeholders. A brief review of relevant criteria from the literature is shown in Table 1.
By reviewing the literature, no examples of scenario definition and evaluation for the development of IT systems were identified. According to this, the main contribution of this article is in defining IT system scenarios, as well as in defining the criteria set used for their evaluation.

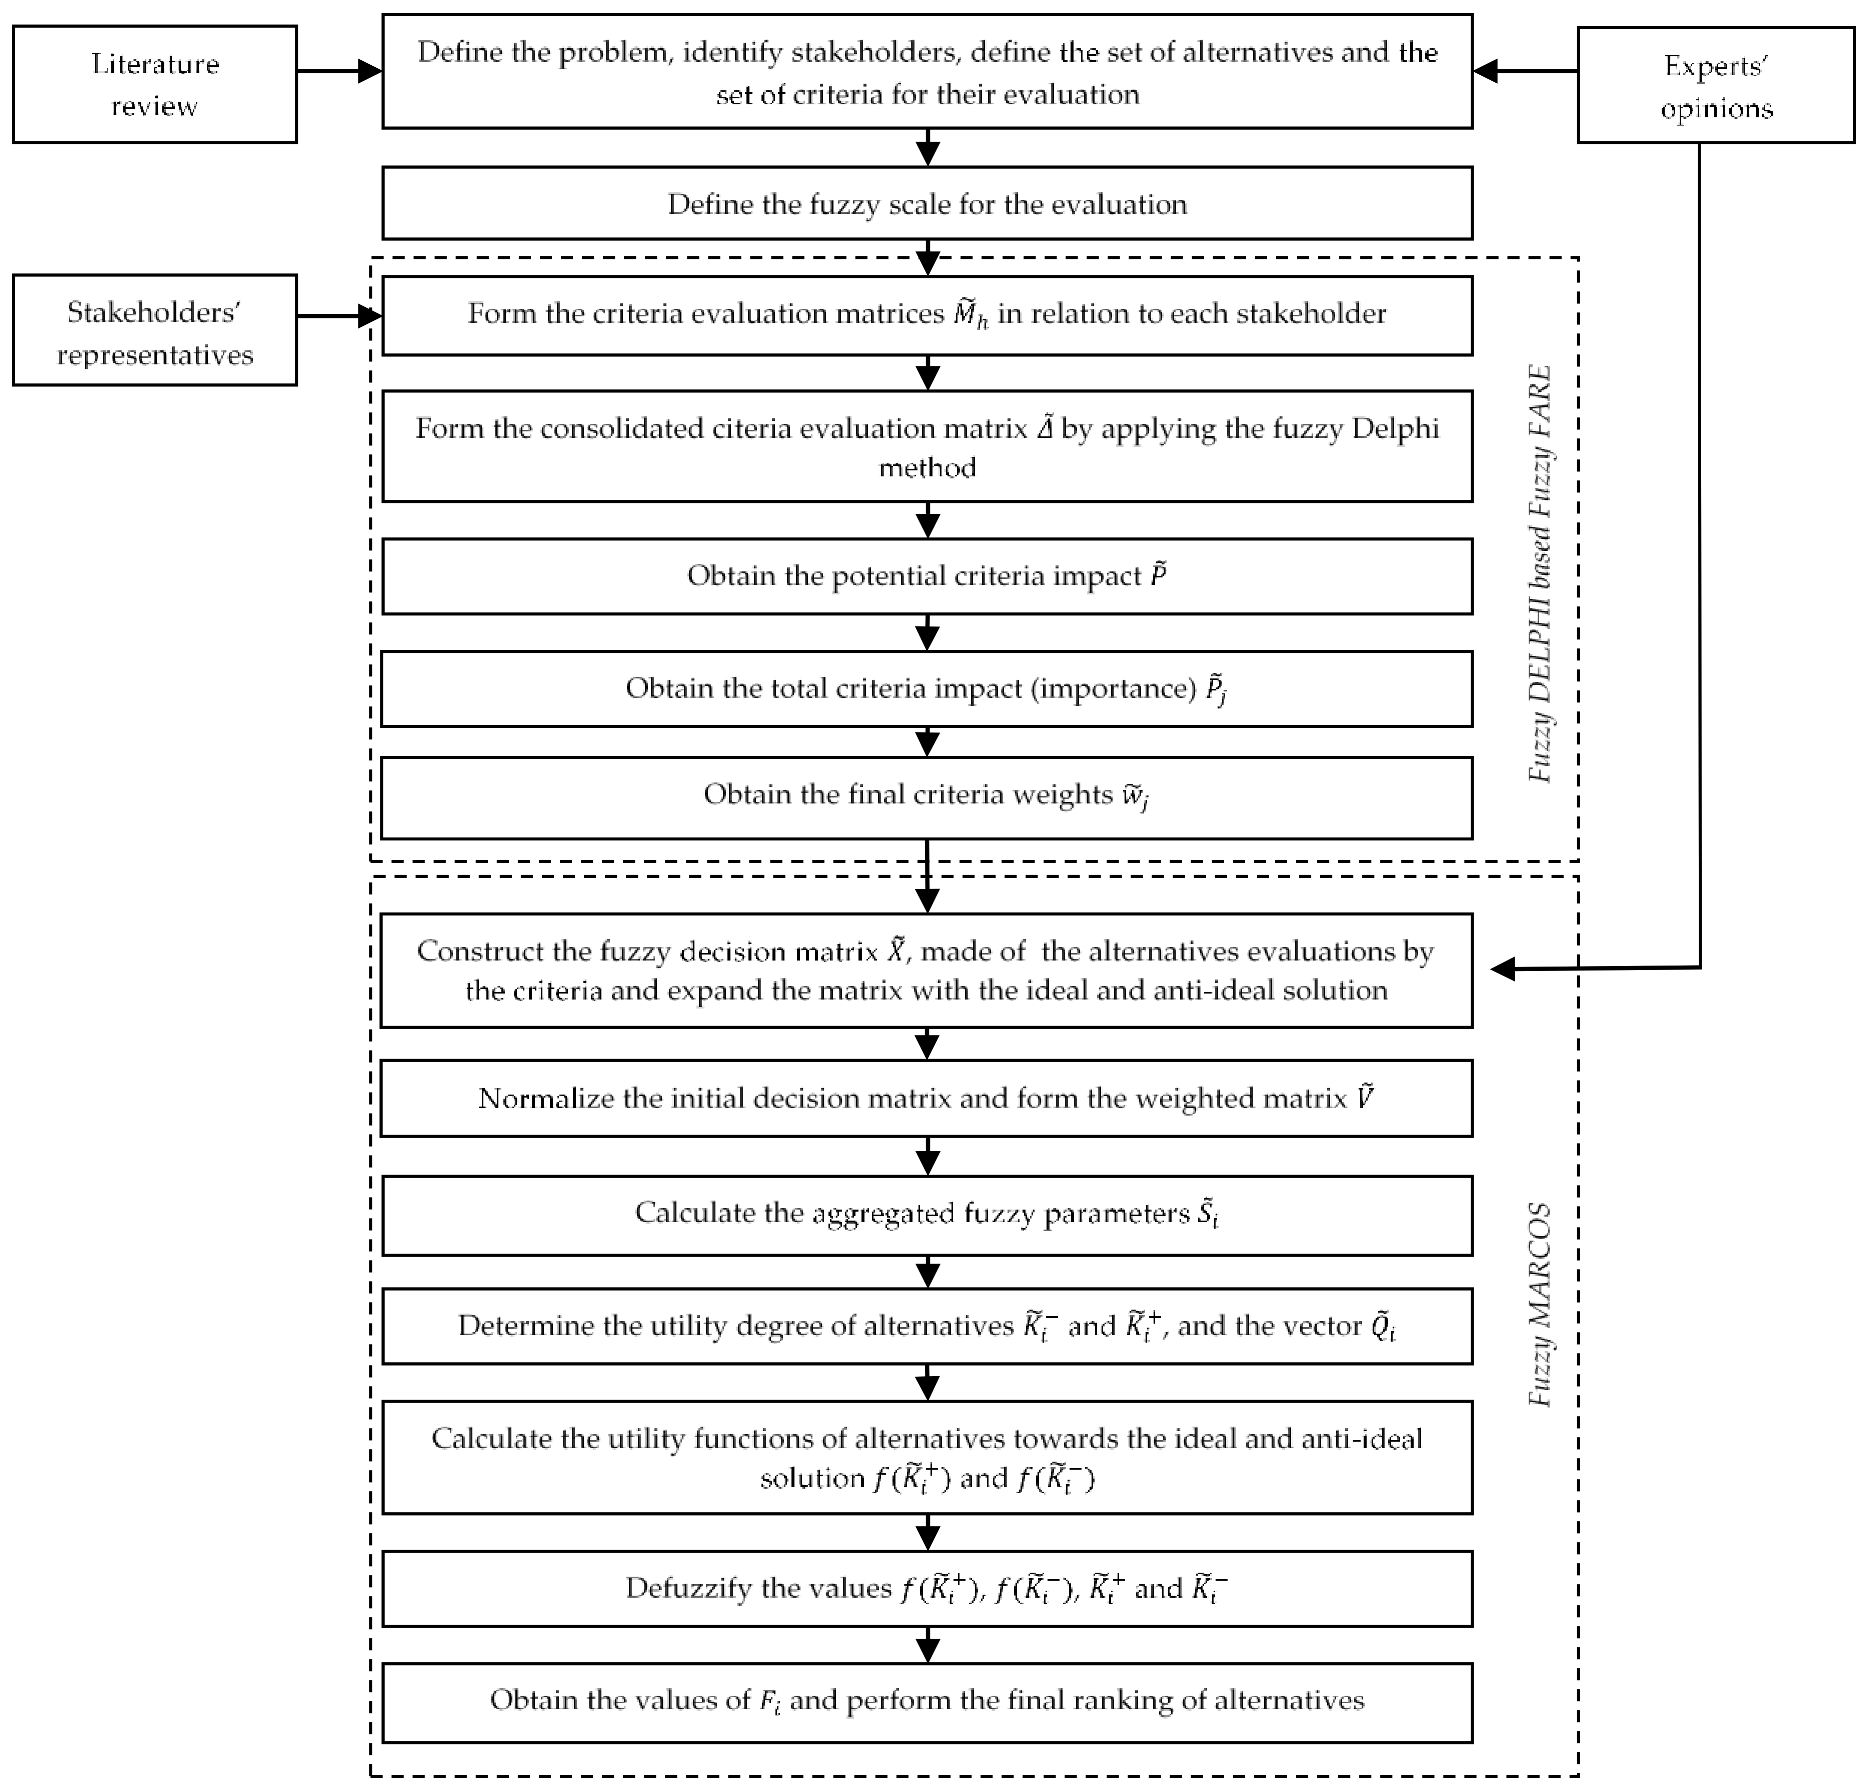
3. The Hybrid Delphi-Based Fuzzy FARE and Fuzzy MARCOS Model

The developed model in this article combines the fuzzy Delphi, fuzzy FARE and fuzzy MARCOS methods for solving the problem of selecting the IT system development scenario for Southeastern Europe. In the following text, a short review of the three methods is given, highlighting the advantages of their application, as well as the detailed description of the application steps for the newly-developed hybrid model.
Criteria prioritization in MCDM problems is of great importance for finding compromise solutions. In the existing literature, a wide variety of methods is used for determining the criteria weight coefficients, and some of the most frequently used are AHP [83], ANP [84], SWARA [85], DEMATEL [86], entropy method [87], FUCOM [88] and KEMIRA [89]. In this article, a combination of the Delphi and FARE methods in the fuzzy environment (fuzzy D-FARE) is used for determining the criteria weight coefficients.
The Delphi method is used during a decision-making process that requires an iterative process for finding a consensus in the opinions/attitudes of decision-makers [90]. With this method, the convergence of preferences regarding the observed problem is ensured through an iterative process [91], and its main advantages are feedback control, the possibility of statistical processing of group answers, and stability in decision-making evaluations [92]. The Delphi method has a wide range of applications in its conventional form, as well as in the fuzzy environment [93].
The FARE method, introduced in [94], is based on defining the relationships between decision-making elements—in this case, the criteria. In order to establish the existence of influences among individual decision-making elements, as well as the type and strength of the influence, in the first phase of its application, the method requires a minimal amount of initial data received from the decision-makers [89]. In the next phase, the influence between remaining elements is determined analytically, thus greatly reducing the number of required evaluations by the decision-makers, which represents the main advantage of this method compared to the other methods based on pairwise criteria comparison (such as AHP, ANP and DEMATEL) [95]. Besides its conventional form, the FARE method is also developed in the fuzzy environment [96]. The combination of the Delphi and FARE methods encompasses their advantages in a singular method for criteria weights extraction. These methods are combined in the paper in the fuzzy environment.
The basic idea of the MARCOS method is to define the position of the observed alternatives (in this case the IT system development scenarios) in regard to the ideal and anti-ideal solutions [97]. The method is proven to be stable in a dynamic environment and insensitive to the change in measurement scales [98]. The MARCOS method, although relatively new in the literature, found its application in problem-solving in its conventional form, as well as in the fuzzy environment [99]. Besides its standalone application, the MARCOS method is combined with other MCDM methods, some of which are AHP [61], SWARA [25] and FUCOM [97], but never in the combination with the fuzzy D-FARE method. The algorithm steps of the hybrid fuzzy D-FARE and fuzzy MARCOS model are shown in Figure 1 and explained in the following text.
Step 1.
Define the problem structure, identify the stakeholders, their goals, demands and priorities, form the sets of alternatives and the criteria used for their evaluation.
Step 2.
Define the set of linguistic terms that would be used for criteria pairwise comparison by the stakeholders and alternative evaluation according to the criteria as well as the corresponding fuzzy values. Linguistic terms and the corresponding fuzzy values that are used in this article are shown in Table 2.
Step 3.
Determine the criteria weight coefficients through the application of the fuzzy Delphi-based FARE method.
Step 3.1.
Form the criteria evaluation matrices M ˜ h according to the linguistic terms of decision-makers which can be transformed into fuzzy values according to the relations from Table 2:
M ˜ h = a ˜ z j h n × n ,   h = 1 , , p
where a ˜ z j h = l h a ,   m h a ,   u h a represents the influence strength (importance) of criterion z in comparison with criterion j according to stakeholder h. l h a , m h a , and u h a are the lower, middle, and upper value of the triangular fuzzy value a ˜ z j h , n is the number of considered criteria, and p is the number of stakeholders involved in the evaluation. When forming the matrix M ˜ h the following condition must be satisfied:
a ˜ j z h = a ˜ z j h .
The evaluation is considered consistent if the following applies:
j = 1 n u h a = j = 1 n l h a ,   h = 1 , , p
Step 3.2.
Form the aggregated matrix Δ ˜ of criteria values by applying the fuzzy Delphi method [100]:
Δ ˜ = δ ˜ z j n × n
δ ˜ z j = l h δ , m h δ , u h δ
l h δ = m i n l h a ,   h = 1 , , p
m h δ = h = 1 p m h a 1 / p ,   h = 1 , , p
u h δ = m a x u h a ,   h = 1 , , p ,
where l h δ , m h δ , and u h δ are the lower, middle and upper values of the unique fuzzy number δ ˜ i j , and the condition l h δ m h δ u h δ is satisfied.
Step 3.3.
Determine the potential criteria influence:
P ˜ = H ˜ n 1 ,
where P ˜ represents the influence potential (importance) of all the criteria, and H ˜ is the largest value in the used comparison scale.
Step 3.4.
Determine the overall influence (importance) of criteria P ˜ j by applying the Equation:
P ˜ j = i = 1 n δ ˜ z j ,   j = 1 , , n ,   j z .
Step 3.5.
Determine the fuzzy criteria weights w ˜ j by applying the Equation:
w ˜ j = P ˜ j r / P ˜ H ,   j = 1 , , n ,
where P ˜ H represents the overall influence potential (importance) of the observed criteria set, determined in the following way:
P ˜ H = n × P ˜ .
P ˜ j r represents the real influence of criterion j determined by:
P ˜ j r = P ˜ j + P ˜ ,   j = 1 , , n
Step 3.6.
Determine the final crisp criteria weights w j by applying:
w j = m i n j c r i s p w ˜ j + c r i s p w ˜ j m i n j ( c r i s p w ˜ j ) m i n j ( c r i s p w ˜ j ) ,
where c r i s p w ˜ j stands for the defuzzified values of the fuzzy criteria weights w ˜ j determined by the following Equation:
c r i s p ( T ˜ ) = l T + 4 m T + u T / 6
while T ˜ represents the triangular fuzzy value that requires defuzzification.
Step 4.
Apply the fuzzy MARCOS methods for alternatives ranking according to the criteria. The input parameters of the MARCOS method are the set of alternatives ( A i ), the number of alternatives (r), the set of criteria ( C j ) with weight coefficients ( w j ), and the decision matrix X, composed of the evaluations of alternatives according to the criteria ( x i j ). In the fuzzy MARCOS method, the alternatives are evaluated with linguistic terms which can be transformed into fuzzy values x ˜ i j = l i j x , m i j x , u i j x , where l i j x , m i j x , and u i j x are the lower, middle and upper values of the triangular fuzzy number x ˜ i j . The procedure of the fuzzy MARCOS method is adapted from [99], and the algorithmic steps of the method are explained in the following text.
Step 4.1.
Expand the initial decision matrix X ˜ with the fuzzy ideal A i d and fuzzy anti-ideal A a i solutions:
X ˜ = C 1 C 2 C n A a i A 1 A 2 A r A i d [ x ˜ a i 1 x ˜ a i 2 x ˜ a i n x ˜ 11 x ˜ 12 x ˜ 1 n x ˜ 21 x ˜ 22 x ˜ 2 n x ˜ r 1 x ˜ r 2 x ˜ r n x ˜ i d 1 x ˜ i d 2 x ˜ i d n ]
Let C m a x be the set of all maximization criteria, and let C m i n be the set of all minimization criteria. In that case, A i d and A a i can be determined in the following way:
A a i = m i n 1 i r   x i j ,   j C m a x   a n d   m a x 1 i r   x i j ,   j C m i n
A i d = m a x 1 i r   x i j ,   j C m a x   a n d   m i n 1 i r   x i j ,   j C m i n .
Step 4.2.
Form the normalized fuzzy decision matrix D ˜ = d ˜ i j r × n according to:
d ˜ i j = l i j d , m i j d , u i j d = l i d x u i j x , l i d x m i j x , l i d x l i j x , j C m i n l i j x u i d x , m i j x u i d x , u i j x u i d x , j C m a x
Step 4.3.
Form the weighted matrix V ˜ = v ˜ i j r × n by multiplying the elements of U ˜ with corresponding criteria weight coefficients:
v ˜ i j = l i j v , m i j v , u i j v = w j · l i j d , w j · m i j d , w j · u i j d .
Step 4.4.
Calculate the aggregated fuzzy parameter S ˜ i for every alternative, based on:
S ˜ i = l i s , m i s , u i s = j = 1 n l i j v , j = 1 n m i j v , j = 1 n u i j v .
Step 4.5.
Determine the utility degrees of alternatives K ˜ i and K ˜ i + , where S ˜ i d and S ˜ a i represent the values of the aggregated fuzzy parameter S ˜ i for the ideal and anti-ideal solution:
K ˜ i = l i k , m i k , u i k = S ˜ i S ˜ a i = l i s u a i s , m i s m a i s , u i s l a i s
K ˜ i + = l i k + , m i k + , u i k + = S ˜ i S ˜ i d = l i s u i d s , m i s m i d s , u i s l i d s .
Step 4.6.
Determine the fuzzy vector Q ˜ i and the fuzzy value G ˜ i :
Q ˜ i = l i q , m i q , u i q = K ˜ i K ˜ i + = l i k + l i k + , m i k + m i k + , u i k + u i k +
G ˜ = l g , m g , u g = m a x 1 i r   Q ˜ i .
where G represents the defuzzified value of G ˜ according to the formula (15).
Step 4.7.
Determine the utility functions of alternatives towards the ideal and anti-ideal solution:
f K ˜ i + = K i G = l i k G , m i k G , u i k G
f K ˜ i = K i + G = l i k + G , m i k + G , u i k + G .
Step 4.8.
Defuzzify the values K ˜ i , K ˜ i + , f ( K ˜ i ) , and f ( K ˜ i + ) by applying the Equation (15) and according to their crisp values determine the final scores of alternatives:
F i = K i + + K i 1 + 1 f K i + f K i + + 1 f K i f K i .
where K i , K i + , f ( K i ) , and f ( K i + ) represent the defuzzified values of the parameters K ˜ i , K ˜ i + , f ( K ˜ i ) , and f ( K ˜ i + ) .
Step 4.9.
Rank the alternatives according to the parameter F i . Alternatives with higher values of F i are considered better.

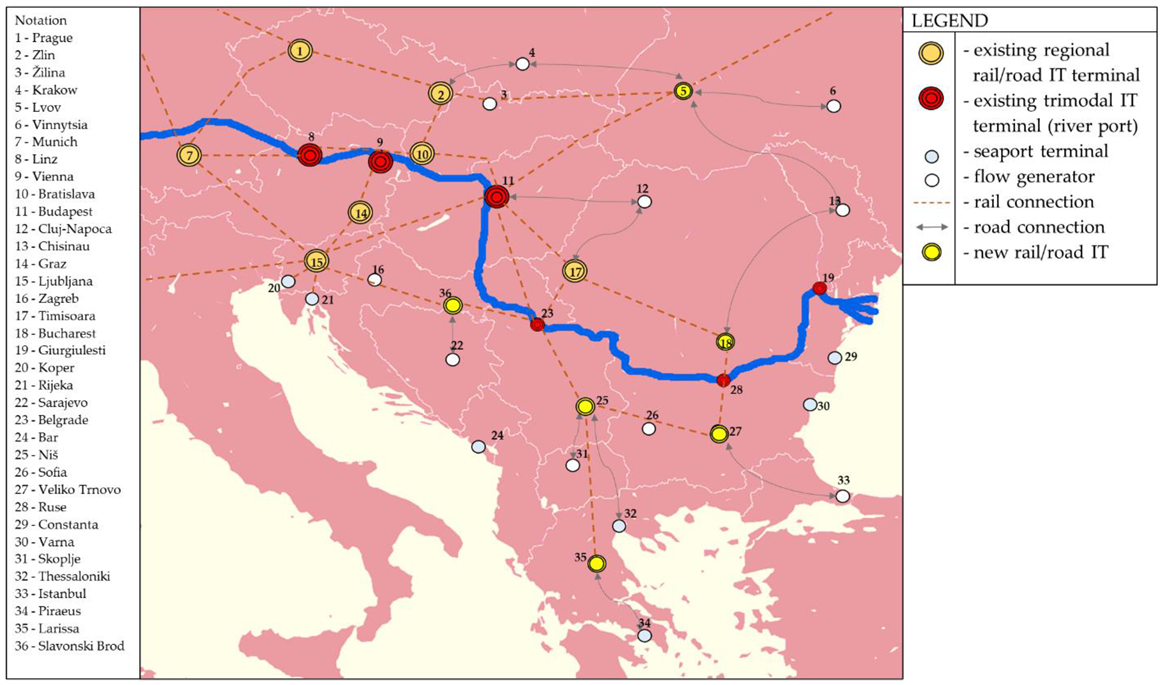
4. IT development Scenarios for the Region of Southeastern Europe

In this section, IT development scenarios for the region of Southeastern Europe are defined and explained. The scenarios differ in the network configuration, the required level of logistics infrastructure development, the role of different IT terminal categories, the involvement of different transportation modes, and goods flows’ transformation degree.

4.1. Cooperation among Logistics Providers—Scenario 1

The idea of scenario 1 (Figure 2) is the cooperation in the realization of regional goods flows among logistics providers [81,82]. Through provider cooperation, the consolidation of goods flows along transport corridors would be enabled, thus reducing transportation unit costs. The consolidation would be realized in the existing logistics centers of providers. The consolidated flows could access the European IT network through the existing regional IT terminals (Ljubljana, Timisoara and Budapest).
The advantages of this scenario are the flexibility in goods flow realization, minimal infrastructural investments, and practical feasibility in given circumstances. Its disadvantages are the exclusive focus on road transportation mode, low integration level with the IT network, and insignificant reduction of logistics activities’ negative environmental impact.

4.2. Revitalization of Existing Local IT Terminals—Scenario 2

Scenario 2 refers to the functional revitalization of local, already existing small-capacity and medium-capacity rail-road IT terminals, and the development of new local IT terminals along transport corridors [101] if necessary (Figure 3). In the project [28], it is already highlighted that a significant number of IT terminals exist for the observed region, but they are underdeveloped and derelict. Revitalized and newly-developed terminals would be of local significance and in the function of local consolidation centers.
The advantages of this scenario are its practical feasibility and the fact that it would represent the embryo of IT network development for the countries of Southeastern Europe. Its disadvantages are still inadequate integration in the existing European IT system which poses a risk for neglection of further system development.

4.3. Regional DP Terminals for Balkan Seaports—Scenario 3

The idea of scenario 3 is the development of regional DP terminals and the transformation of existing rail-road terminals with the goal of transferring a portion of regional flows on the rail and sea transportation modes (Figure 4). Network development in this scenario is directed towards more efficient involvement of Balkan seaport terminals in the realization of regional flows. DP terminals would serve as regional consolidation centers, and would have the access to the European IT network through the connection with neighboring IT terminals. In the context of existing scientific literature on this topic, this scenario represents a typical DP system structure and the number of scientific papers analyzing such scenario is relatively large [33,45,46,47,102,103].
The advantages of this scenario are the greater involvement of Balkan seaport terminals in the realization of goods flows, enabling the sea transportation mode, and efficient region integration with DP terminals in the IT network. The disadvantages of the scenario are unlikely results of application in the realization of regional flows and the neglect of regions that are further away from Balkan coastlines (Eastern Europe).

4.4. Local Terminals in the Function of DP for DANUBE Ports—Scenario 4

The focus of scenario 4 is the increase of inland waterway transportation participation in the realization of regional flows (Figure 5). This scenario refers to the development of new and the transformation of existing IT terminals into DP terminals for Danube river ports. The terminals would play the role of local consolidation centers and would have a rail connection with Danube river port terminals. The main reason for defining such a scenario is the attempt to overcome the problem reported in [16]—the inadequate connection between rail and inland waterway transportation modes. In order to improve the flexibility in goods flow realization, DP terminals would serve as road transportation mode consolidation centers for areas that are outside the catchment area of Danube ports, as well as for flow categories that are incompatible with inland-waterway transportation mode. With the development of DP terminals, Danube river ports would be transformed into regional logistics centres [104] which would result in better integration of inland waterway transportation in the existing European IT system [105]. The concept of DP for river ports is novel and unexplored in the existing literature.
The advantages of this scenario are the involvement of Danube river terminals in the realization of goods flows and the availability of inland waterway transportation mode. The disadvantages of this scenario are the dominant role of road transportation mode as an element that improves the flexibility of the scenario, partial integration of regional flows, selective development focus directed only towards the regions in the close proximity of the Danube river ports, and incomplete integration of the system in the existing IT network.

4.5. The IT Core Network with the Danube DP Terminals—Scenario 5

Scenario 5 focuses on the development of the IT core network instead of the individual transportation modes (Figure 6). The development of the IT core network refers to the identification of appropriate and efficient categories of the IT terminals for the development and establishment of adequate connections among terminals. A more efficient way of integrating river DP terminals would be enabled through the establishment of the rail connections between the terminals, thus overcoming the disadvantages of the previous scenario. In this way, the participation of road transportation would be reduced and more appropriate integration of the region in the European IT system would be enabled.
The advantages of this scenario are good modal shift, flexibility, flow coverage, reduced environmental impact, an excellent possibility for integration in the European IT system and regional development. The disadvantages of this scenario are the need for the development of a greater number of required terminals and complex practical implementation of the scenario.

4.6. Complete IT Network—Scenario 6

Scenario 6 refers to the most detailed and complex development of the IT network with hybrid terminals in the function of DP for the Danube ports and seaports (Figure 7). It also includes a complete network connection with rail transportation mode, accompanied by the development of new and modernization of existing rail-road IT terminals at strategically important locations in the continent hinterland [1,106].
The advantages of this scenario are the maximum modal shift and environmental acceptability, complete integration in the European IT network but also in the global IT chains, as well as the stimulation of regional development. The disadvantages of the scenario are the need for the development of a large number of different terminal categories, a greater focus on intercontinental flows, and the greatest regional flow realization complexity.

4.7. Criteria for Selecting IT System Development Scenarios

This section describes the criteria used for the evaluation of IT system development scenarios for the region of Southeastern Europe. According to the review of relevant criteria from the literature (Table 1), understanding of the problem and the current state of IT in the region [24,25,107], twelve criteria are defined for the evaluation of potential IT development scenarios for the region of Southeastern Europe.
The complexity of network development ( C 1 ) refers to the practical feasibility of the development and it includes the complexity degree of required infrastructural works that would make the network development possible (the development of terminals and transportation infrastructure). The complexity is the consequence of procedures, processes, and the involvement of different organs and national governments in the project of network development.
The required financial investments ( C 2 ) refer to the number of financial assets required for funding the IT terminal and transportation infrastructure development, acquisition of handling equipment, etc.
Logistics chain realization complexity ( C 3 ) includes the procedures and processes that must be completed during flow realization. The greater the transformation degree of flows, the scenarios perform worse according to this criterion.
Flexibility ( C 4 ) refers to the capability of system adaptation to the changes in the environment and demand.
Efficiency ( C 5 ) refers to the optimization degree of logistics activities along chains—the utilization of system capacities, savings in energy and fuel consumption, etc. The criterion refers also to the possibility of efficient utilization of the advantages of transportation modes (rail and inland waterway) in the observed scenarios.
Environmental performance ( C 6 ) refers to the reduction of air pollutant emissions, noises and vibrations, as well as the safety improvement that are the consequences of IT system development for the observed region.
Availability of logistics services and accessibility ( C 7 ) investigates the service availability for IT users in the observed regions. A more developed network that covers a wider range of flows improves the availability of services for the users.
Modal split of transport work ( C 8 ) describes the degree to which the observed scenario promotes and enables the utilization of alternative transportation modes that consume less energy and fuel and have greater transport capacity—rail, sea and inland waterway.
Cooperation stimulation in the IT system ( C 9 ) refers to the contribution of the observed scenarios to the integration of all stakeholders in the flow realization, as well as the establishment of cooperation among them.
Flow coverage ( C 10 ) refers to the network structure’s possibility of attracting different categories of goods flows.
Stimulation of regional development ( C 11 ) refers to the influence of IT system development, according to the defined scenarios, on the economic development of Southeastern European countries.
Operational costs of regional flows realization ( C 12 ) describe at what level the observed scenarios are appropriate for the integration of regional IT flows in the European IT system from the aspect of transportation, transhipment and storage costs.

5. Evaluation of the IT System Scenarios in Southeastern Europe Using Hybrid Fuzzy D-FARE and Fuzzy MARCOS Model

The evaluation and selection of the most appropriate IT system scenarios for the region of Southeastern Europe is conducted in this section through the application of a novel hybrid fuzzy D-FARE and fuzzy MARCOS model. In the first phase of the model application, the fuzzy D-FARE method is used for the extraction of criteria weight coefficients. The criteria are evaluated from the perspective of four stakeholder groups—IT service users, IT service providers, administration (local, national, and regional authorities, organizations, and institutions), and residents. IT service users demand the availability and accessibility of IT services, high system flexibility, as well as the possibility of IT utilization for different goods flow categories. For this stakeholder group, the most important criteria are C 7 , C 10 , C 4 and C 12 . IT service providers demand the development of an efficient IT system and require logistical infrastructure in order to maximize profits and minimize costs. The criteria C 5 , C 7 , C 3 , C 8 and C 12 are the most important for this stakeholder group. The administration strives for the development of an IT system that would provide prosperity for other stakeholders. They represent the key actor in stimulating others on collaboration and solving conflicts between their goals. For this stakeholder group, the most important criteria are C 11 , C 2 , C 6 , C 1 and C 10 . Residents demand the reduction of the negative environmental impact of logistics, but also the availability of goods and services at all times. Therefore, criteria C 6 , C 11 and C 8 are the most important for them. The criteria importance evaluation from the aspects of the stakeholders and their preferences are shown in Table 3.
By transforming the linguistic terms, using the relations given in Table 2, the criteria evaluation matrix (1) is formed, subject to the constraints (2) and (3). By applying Equations (4)–(8), the consolidated criteria evaluation matrix is formed, and by applying Equation (9), the potential criteria influence is determined. The final influence (importance) of criteria is determined with (10), and by applying the Equations (11)–(15), the final criteria weight coefficients are extracted ( w 1 , w 2 , w 3 , w 4 , w 5 , w 6 , w 7 , w 8 , w 9 , w 10 , w 11 , w 12 ) = (0.099, 0.148, 0.160, 0.140, 0.178, 0.178, 0.260, 0.213, 0.143, 0.242, 0.263, 0.149).
This article approaches the alternative assessment according to the criteria in a qualitative manner. Although exact numerical values for some of the criteria (e.g., C 2 , C 5 , C 6 , C 8 , C 10 and C 12 ) can be roughly determined with the application of adequate models (simulation, optimization, and analytic models), which is far beyond the scope of this paper. Based on the existing scientific literature, author experience in the field, surveys and meetings with stakeholder representatives, the comparison of the scenarios according to the criteria is possible through linguistic (fuzzy) values. The developed model is able to tackle this kind of information and give a compromising solution. IT scenario evaluations according to the criteria (Table 4) is conducted according to the linguistic terms given in Table 2, which are transformed into corresponding fuzzy values.
The decision matrix from Table 4 is expanded by applying the Equations (16)–(18). The decision matrix is normalized by applying Equation (19), and then weighted by applying Equation (20). The aggregated parameter S ˜ i , as well as the utilization degrees K ˜ i and K ˜ i + , are determined according to (21)–(23), and then the fuzzy vector Q ˜ i is determined by applying Equation (24). The fuzzy value G ˜ and its crisp value are determined according to (25). Based on the ratio between K ˜ i and G, as well as the ratio K ˜ i + and G from the Equations (26) and (27), the utilization functions of alternatives according to the ideal and anti-ideal solution are determined— f ( K ˜ i + ) and f ( K ˜ i ) . In the end, the final scenario scores F i , are determined by applying Equation (28), thus making the final ranking of the IT development scenarios possible. According to the results, shown in Table 5, scenario 5 is the best-ranked IT development scenario.

6. Result Discussion

IT core network development with the DP terminals for the Danube river ports (Scenario 5) is the best-ranked IT development scenario for the region of Southeastern Europe. The development of DP terminals for the river ports enables the efficient modal shift of transport work, improves the participation of inland waterway transportation, and expands the catchment area of the existing river terminals. With the establishment of rail connections between located DP terminals, the flexibility of the system is improved by enabling the use of combined road-rail-inland waterway and road-rail transportation, which also improves the attraction degree of different flow categories. The establishment of connections between developed terminals improves the integration possibility with the existing European IT network. Although a bit complex, this scenario is practically feasible and it could stimulate the overall regional development, especially in the context of IT system development.
The second-best is scenario 6, which refers to the development of a complete IT network with different terminal categories. Despite the fact that the positive effects of this scenario are the most significant, its practical feasibility is questionable, especially in the case of underdeveloped regions such as Southeastern Europe. The complexity of this scenario requires a definition of several terminal categories with different roles and structures, as well as a more complex process of their development and implementation. The third-best is scenario 2 which refers to the revitalization of existing, inadequately utilized IT terminals, which indicates that the previous attempts for IT system development in the region were unsuccessful. Other scenarios are lower-ranked because of their inappropriate network structure, partial utilization of the region’s spatial characteristics advantages and the inability of integrating a wider set of different flow categories. Scenario 3, which implies the development of the DP terminals for seaports, could also achieve significant sustainability effects but would include only intercontinental flows from Central and part of Southeastern Europe that pass through the Balkan seaports. On the other side, scenario 4, which refers to the development of local DP terminals for river ports, is incapable of integrating different flow categories, therefore its disadvantages are overcome in scenario 5. Scenario 1 is ranked as the worst because it relies solely on-road transportation.
The previous section successfully demonstrated the applicability of the developed MCDM model. It showed that the FARE method is very suitable for criteria weight extraction because, as a result, it gives consistent values based on a small number of criteria comparisons. This characteristic would be even more evident in the case of considering a larger number of criteria. The Delphi method ensured a simple aggregation of criteria evaluations from the different stakeholder groups, which is the first step in finding a compromise solution. The MARCOS method provided the possibility of scenario evaluation and finding a compromise solution in accordance with the defined criteria and the attitudes of the involved stakeholders. The combination of these methods in the fuzzy environment, which ensured an adequate perception of ambiguity and imprecision in the decision-making evaluations, has contributed to the quality of the obtained results.
The defined scenarios and their visual representation in the figures are only illustrative and are based on real-life transport corridors between the largest flow generators in the observed region. For every scenario, the network structure is roughly determined according to the spatial and geographical characteristics, yet further analyses are required in order to determine the exact network structure for every scenario. Corresponding analytical models could be developed for every scenario to better evaluate the potential effects of their implementation, which is one of the key directions of future research regarding this topic.
The results of this article can help the decision-makers, policy creators, and planners in defining potential IT system development directions, assessing the advantages and disadvantages of the considered scenarios, and selecting the most appropriate IT development scenario in the practice. The approach and the model are developed for this particular problem, but are universally applicable and after required adjustments could be used for solving other problems from this or any other research area.

7. Conclusions

The problem of selecting the most appropriate IT system scenario for the region of Southeastern Europe is presented and solved in this article. Six different scenarios are defined, and their evaluation is conducted according to the attitudes of four stakeholder groups and twelve defined criteria. For solving the problem, a novel hybrid MCDM model, based on fuzzy D-FARE and fuzzy MARCOS methods, is developed. Development of the IT system based on the selected scenario would provide a significant contribution to the regional development of Southeastern Europe.
According to the results of the model application, the best scenario of the IT system development refers to the establishment of DP terminals for Danube river ports, with an improved degree of network connectivity between the terminals via rail transportation mode. This scenario would transform the existing Danube river terminals into regional logistics centers, expand their catchment area, and enable the attraction of greater flow volumes towards the inland waterway transportation mode. At the same time, efficient integration of the system into the European IT network would be possible through the establishment of rail connections between the terminals.
Six scenarios of the IT system development are defined, but this set could definitively be expanded and elaborated in more detail depending on the future research focus. Besides the results of this article, future research could include the development of quantitative models for more detailed identification and analysis of the effects that would accompany the implementation of individual scenarios/solutions. Every scenario can be elaborated in more detailed subcategories during the analysis. Future research could also include a simulation analysis in a stochastic-dynamic environment in order to further examine performances such as flexibility, reliability, resilience, and efficiency of the observed IT system.
Special attention in future research could be set towards the analysis of the DP concept in the function of river ports. This concept stands out as a potentially efficient way of integrating inland waterways into the existing IT systems, which would contribute to overall sustainability.
In the end, the developed MCDM model is universally applicable, therefore it can be used for solving other problems in this or any other area. The defined model could also serve as a base for developing some new hybrid models, in combination with other MCDM or nonparametric methods, in conventional form or in the environment of intuitionistic or interval sets (for example fuzzy, rough, grey).

Author Contributions

Conceptualization, S.T., M.K. (Milovan Kovač), M.K. (Mladen Krstić), V.R. and N.B.; methodology, S.T., M.K. (Milovan Kovač) and M.K. (Mladen Krstić); software, S.T., M.K. (Milovan Kovač) and M.K. (Mladen Krstić); validation, S.T., M.K. (Milovan Kovač) and M.K. (Mladen Krstić); formal analysis, S.T., M.K. (Milovan Kovač), M.K. (Mladen Krstić), V.R. and N.B.; investigation, S.T., M.K. (Milovan Kovač) and M.K. (Mladen Krstić); writing—original draft preparation, S.T., M.K. (Milovan Kovač), M.K. (Mladen Krstić), V.R. and N.B.; writing—review and editing, S.T., M.K. (Milovan Kovač) and M.K. (Mladen Krstić); visualization, S.T. and M.K. (Milovan Kovač); supervision, S.T. All authors have read and agreed to the published version of the manuscript.

Funding

This research received no external funding.

Institutional Review Board Statement

Not applicable.

Informed Consent Statement

Not applicable.

Conflicts of Interest

The authors declare no conflict of interest.

References

  1. Tadić, S.; Krstić, M.; Roso, V.; Brnjac, N. Planning an intermodal terminal for the sustainable transport network. Sustainability 2019, 11, 4102. [Google Scholar] [CrossRef] [Green Version]
  2. European Conference of Ministers of Transport. Terminology on Combined Transport; European Conference of Ministers of Transport: Paris, France, 1993. [Google Scholar]
  3. Arnold, P.; Peeters, D.; Thomas, I. Modelling a rail/road intermodal transportation system. Transp. Res. Part E Logist. Transp. Rev. 2004, 40, 255–270. [Google Scholar] [CrossRef]
  4. Agamez-Arias, A.; Moyano-Fuentes, J. Intermodal transport in freight distribution: A literature review. Transp. Rev. 2017, 37, 782–807. [Google Scholar] [CrossRef]
  5. Prata, J.; Arsenio, E. Assessing intermodal freight transport scenarios bringing the perspective of key stakeholders. Transp. Res. Procedia 2017, 25, 900–915. [Google Scholar] [CrossRef]
  6. Caris, A.; Macharis, C.; Janssens, G.K. Planning Problems in Intermodal Freight Transport: Accomplishments and Prospects. Transp. Plan. Technol. 2008, 31, 277–302. [Google Scholar] [CrossRef] [Green Version]
  7. Kudlac, S.; Gasparik, J.; Dedik, M.; Kurenkov, P. Identification of Restricting Criteria for Comprehensive Assessment of Logistics Chains in Intermodal Transport. LOGI Sci. J. Transp. Logist. 2018, 9, 18–27. [Google Scholar] [CrossRef] [Green Version]
  8. Kumar, A.; Anbanandam, R. Evaluating the interrelationships among inhibitors to intermodal railroad freight transport in emerging economies: A multi-stakeholder perspective. Transp. Res. Part A Policy Pract. 2020, 132, 559–581. [Google Scholar] [CrossRef]
  9. Bask, A.; Rajahonka, M. The role of environmental sustainability in the freight transport mode choice: A systematic literature review with focus on the EU. Int. J. Phys. Distrib. Logist. Manag. 2017, 47, 560–602. [Google Scholar] [CrossRef]
  10. Monios, J. Intermodal transport as a regional development strategy: The case of Italian freight villages. Growth Chang. 2015, 47, 363–377. [Google Scholar] [CrossRef]
  11. Caris, A.; Macharis, C.; Janssens, G.K. Decision support in intermodal transport: A new research agenda. Comput. Ind. 2013, 64, 105–112. [Google Scholar] [CrossRef]
  12. Macharis, C.; Caris, A.; Jourquin, B.; Pekin, E. A decision support framework for intermodal transport policy. Eur. Transp. Res. Rev. 2011, 3, 167–178. [Google Scholar] [CrossRef] [Green Version]
  13. Ge, J.; Shi, W.; Wang, X. Policy agenda for sustainable intermodal transport in China: An application of the multiple streams framework. Sustainability 2020, 12, 3915. [Google Scholar] [CrossRef]
  14. Teye, C.; Bell, M.; Bliemer, M. Locating urban and regional container terminals in a competitive environment: An entropy maximising approach. Transp. Res. Part B Methodol. 2018, 117, 971–985. [Google Scholar] [CrossRef]
  15. Vidović, M.; Zečević, S.; Kilibarda, M.; Vlajić, J.; Bjelić, N.; Tadić, S. The p-hub model with hub-catchment areas, existing hubs and simulation: A case study of Serbian intermodal terminals. Netw. Spat. Econ. 2011, 11, 295–314. [Google Scholar] [CrossRef]
  16. Tawfik, C.; Limbourg, S. Scenario-based analysis for intermodal transport in the context of service network design models. Transp. Res. Interdiscip. Perspect. 2019, 2, 100036. [Google Scholar] [CrossRef]
  17. Zhao, Y.; Xue, Q.; Cao, Z.; Zhang, X. A two-stage chance constrained approach with application to stochastic intermodal service network design problems. J. Adv. Transp. 2018, 2018, 1–18. [Google Scholar] [CrossRef]
  18. Sun, Y. Green and Reliable Freight Routing Problem in the Road-Rail Intermodal Transportation Network with Uncertain Parameters: A Fuzzy Goal Programming Approach. J. Adv. Transp. 2020, 2020, 7570686. [Google Scholar] [CrossRef] [Green Version]
  19. Heggen, H.; Molenbruch, Y.; Caris, A.; Braekers, K. Intermodal container routing: Integrating long-haul routing and local drayage decisions. Sustainability 2019, 11, 1634. [Google Scholar] [CrossRef] [Green Version]
  20. Escuderp-Santana, A.; Munuzuri, J.; Cortes, P.; Onieva, L. The one container drayage problem with soft time windows. Res. Transp. Econ. 2020, 100884. [Google Scholar] [CrossRef]
  21. Benantar, A.; Abourraja, M.N.; Boukachour, J.; Boudebous, D.; Duvallet, C. On the integration of container availability constraints into daily drayage operations arising in France: Modelling and optimization. Transp. Res. Part E Logist. Transp. Rev. 2020, 140, 101969. [Google Scholar] [CrossRef]
  22. Carboni, A.; Deflorio, F. Performance indicators and automatic identification systems in inland freight terminals for intermodal transport. IET Intell. Transp. Syst. 2018, 12, 309–318. [Google Scholar] [CrossRef]
  23. Vural, C.A.; Roso, V.; Halldorsson, A.; Stahle, G.; Yaruta, M. Can digitalization mitigate barriers to intermodal transport? An exploratory study. Res. Transp. Bus. Manag. 2020, 37, 100525. [Google Scholar] [CrossRef]
  24. Tadić, S.; Zečević, S.; Milenković, D. Intermodal transport treatment in developed and developing countries. Tehnika 2017, 72, 897–902. [Google Scholar] [CrossRef] [Green Version]
  25. Tadić, S.; Kilibarda, M.; Kovač, M.; Zečević, S. The assessment of intermodal transport in countries of the Danube region. Int. J. Traffic Transp. Eng. 2021, 11. in press. [Google Scholar]
  26. Suarez-Aleman, A.; Trujillo, L.; Medda, F. Short sea shipping as intermodal competitor: A theoretical analysis of European transport policies. Marit. Policy Manag. 2014, 42, 1–18. [Google Scholar] [CrossRef]
  27. Tsamboulas, D.; Vrenken, H.; Lekka, A.-M. Assessment of a transport policy potential for intermodal mode shift on a European scale. Transp. Res. Part A Policy Pract. 2007, 41, 715–733. [Google Scholar] [CrossRef]
  28. FTTE. Transport Study for the Danube Region—Study of Intermodal Transport Users’ Needs in the Danube Region; Faculty of Transport and Traffic Engineering, University of Belgrade: Belgrade, Serbia, 2018. [Google Scholar]
  29. Meers, D.; Macharis, C. Are additional intermodal terminals still desirable? An analysis for Belgium. Eur. J. Transp. Infrastruct. Res. 2014, 14, 176–196. [Google Scholar] [CrossRef]
  30. Ge, J.; Wang, X.; Shi, W.; Wan, Z. Investigating the Practices, Problems, and Policies for Port Sea–Rail Intermodal Transport in China. Transp. Res. Rec. 2020, 2674, 33–44. [Google Scholar] [CrossRef]
  31. Barthel, F.; Woxenius, J. Developing intermodal transport for small flow over short distance. Transp. Plan. Technol. 2004, 27, 403–424. [Google Scholar] [CrossRef]
  32. Reis, V. Analysis of mode choice variables in short-distance intermodal freight transport using an agent-based model. Transp. Res. Part A Policy Pract. 2014, 61, 100–120. [Google Scholar] [CrossRef]
  33. Roso, V.; Woxenius, J.; Lumsden, K. The dry port concept: Connecting container seaports with the hinterland. J. Transp. Geogr. 2009, 17, 338–345. [Google Scholar] [CrossRef]
  34. Jeevan, J.; Chen, S.L.; Cahoon, S. The impact of dry port operations on container seaports competitiveness. Marit. Policy Manag. 2019, 46, 4–23. [Google Scholar] [CrossRef]
  35. Khaslavskaya, A.; Roso, V. Dry ports: Research outcomes, trends, and future implications. Marit. Econ. Logist. 2020, 22, 265–292. [Google Scholar] [CrossRef] [Green Version]
  36. Roso, V. Sustainable intermodal transport via dry ports—Importance of directional development. World Rev. Intermodal Transp. Res. 2013, 4, 140–156. [Google Scholar] [CrossRef]
  37. Onwuegbuchunam, D.; Ekwenna, D. Analysing the Determinants of Dry Port Selection by Shippers in Nigeria. J. Res. Natl. Dev. 2008, 6, 15–24. [Google Scholar] [CrossRef]
  38. Black, J.; Roso, V.; Marušić, E.; Brnjac, N. Issues in dry port location and implementation in metropolitan areas: The case of sydney, Australia. Trans. Marit. Sci. 2018, 7, 41–50. [Google Scholar] [CrossRef] [Green Version]
  39. Chang, Z.; Notteboom, T.; Lu, J. A two-phase model for dry port location with an application to the port of Dalian in China. Transp. Plan. Technol. 2015, 38, 442–464. [Google Scholar] [CrossRef]
  40. Abbasi, M.; Pishvaee, M.S. A two-stage GIS-based optimization model for the dry port location problem: A case study of Iran. J. Ind. Syst. Eng. 2018, 11, 50–73. [Google Scholar]
  41. Ng, A.K.Y.; Padilha, F.; Pallis, A.A. Institutions, bureaucratic and logistical roles of dry ports: The Brazilian experiences. J. Transp. Geogr. 2013, 27, 46–55. [Google Scholar] [CrossRef]
  42. Rodrigue, J.P.; Debrie, J.; Fremont, A.; Gouvernal, E. Functions and actors of inland ports: European and North American dynamics. J. Transp. Geogr. 2010, 18, 519–529. [Google Scholar] [CrossRef]
  43. Bentaleb, F.; Mabrouki, C.; Semma, A. Dry Port Development: A Systematic Review. J. ETA Marit. Sci. 2015, 3, 75–96. [Google Scholar] [CrossRef]
  44. Tadić, S.; Krstić, M.; Kovač, M. Implementation of the dry port concept in central and Southeastern Europe logistics network. World Rev. Intermodal. Transp. Res. 2021, in press. [Google Scholar]
  45. Tadić, S.; Krstić, M.; Roso, V.; Brnjac, N. Dry port terminal location selection by applying the hybrid grey MCDM model. Sustainability 2020, 12, 6983. [Google Scholar] [CrossRef]
  46. Tadić, S.; Krstić, M.; Kovač, M. Location of Dry Port terminals: Case study for the territory of republic of Serbia. In Proceedings of the Fifth Scientific Conference with International Participation “Politehnika”, Belgrade, Serbia, 13 December 2019; Beogradska Politehnika: Belgrade, Serbia, 2019; pp. 558–563. [Google Scholar]
  47. Tadić, S.; Kovač, M.; Zečević, S.; Krstić, M. Implementation of the dry port concept in the West Balkans region. In Proceedings of the VII International symposium: New Horizons of Transport and Communications, Doboj, Republic of Srpska, 29–30 November 2019; University of East Sarajevo, Faculty of Transport and Traffic Engineering Doboj: Doboj, Republic of Srpska, 2019; pp. 422–427. [Google Scholar]
  48. Krstić, M.; Kovač, M.; Tadić, S. Dry Port Location Selection: Case Study for the Adriatic Ports. In Proceedings of the XLVI Symposium on Operational Research—SYM-OP-IS 2019, Kladovo, Serbia, 15–17 September 2019; University of Belgrade, Faculty of Organizational Sciences: Belgrade, Serbia, 2019; pp. 303–308. [Google Scholar]
  49. Mardani, A. Multiple criteria decision-making techniques in transportation systems: A systematic review of the state of the art literature. Transport 2016, 31, 359–385. [Google Scholar] [CrossRef] [Green Version]
  50. Qu, L.; Chen, Y. A hybrid MCDM method for route selection of multimodal transportation network. In Advances in Neural Networks. Lecture Notes in Computer Science; Sun, F., Zhang, J., Tan, Y., Cao, J., Yu, W., Eds.; Springer: Berlin/Heidelberg, Germany, 2008; Volume 5263, pp. 374–383. [Google Scholar]
  51. Wang, Y.; Yeo, G.-T. Intermodal route selection for cargo transportation from Korea to Central Asia by adopting Fuzzy Delphi and Fuzzy ELECTRE I methods. Marit. Policy Manag. 2018, 45, 3–18. [Google Scholar] [CrossRef]
  52. Krstić, M.; Tadić, S.; Brnjac, N.; Zečević, S. Intermodal terminal handling equipment selection using a fuzzy multi-criteria decision-making model. PROMET Traffic Transp. 2019, 31, 89–100. [Google Scholar] [CrossRef]
  53. Kumar, A.; Anbanandam, R. Analyzing interrelationships and prioritising the factors influencing sustainable intermodal freight transport system: A grey-DANP approach. J. Clean. Prod. 2020, 252, 119769. [Google Scholar] [CrossRef]
  54. Gorcun, O.F.; Kucukonder, H. An integrated MCDM approach for evaluating the Ro-Ro marine port selection process: A case study in Black Sea region. Aust. J. Marit. Ocean Aff. 2021, 1–21. [Google Scholar] [CrossRef]
  55. Sayareh, J.; Alizmini, H.R. A hybrid decision-making model for selecting container seaport in the Persian Gulf. Asian J. Shipp. Logist. 2014, 30, 75–95. [Google Scholar] [CrossRef] [Green Version]
  56. Stilova, S.D.; Martinov, S.V. Selecting a location for establishing a rail-road intermodal terminal by using a hybrid SWOT/MCDM model. In Proceedings of the IOP Conference Series: Materials Science and Engineering, 8th International Scientific Conference “TechSys 2019”, Plovdiv, Bulgaria, 16–18 May 2019; IOP Publishing Ltd.: Bristol, UK, 2019; pp. 1–12. [Google Scholar]
  57. Kayikci, Y. A conceptual model for intermodal freight logistics centre location decision. Procedia Soc. Behav. Sci. 2010, 2, 6297–6311. [Google Scholar] [CrossRef] [Green Version]
  58. Zečević, S.; Tadić, S.; Krstić, M. Intermodal transport terminal location selection using a novel hybrid MCDM model. Int. J. Uncertain. Fuzziness Knowl. Based Syst. 2017, 25, 853–876. [Google Scholar] [CrossRef]
  59. Eftestol-Wilhelmsson, E.; Bask, A.; Rajahonka, M. Intermodal Transport Research: A Law and Logistics Literature Review with EU Focus. Eur. Transp. Law 2014, 49, 609–674. [Google Scholar]
  60. Eng-Larsson, F.; Kohn, C. Modal shift for greener logistics—The shipper’s perspective. Int. J. Phys. Distrib. Logist. Manag. 2012, 42, 36–59. [Google Scholar] [CrossRef]
  61. Tadić, S.; Krstić, M.; Kovač, M. Assessment of city logistics initiative categories sustainability. Environ. Dev. Sustain. 2021, in press. [Google Scholar]
  62. Ambrosino, D.; Ferrari, C.; Sciomachen, A.; Tei, A. Intermodal nodes and external costs: Re-thinking the current network organization. Res. Transp. Bus. Manag. 2016, 19, 106–117. [Google Scholar] [CrossRef] [Green Version]
  63. Dai, Q.; Yang, J.; Li, D. Modeling a Three-Mode Hybrid Port-Hinterland Freight Intermodal Distribution Network with Environmental Consideration: The Case of the Yangtze River Economic Belt in China. Sustainability 2018, 10, 3081. [Google Scholar] [CrossRef] [Green Version]
  64. Ghane-Ezabadi, M.; Vergara, H.A. Decomposition approach for integrated intermodal logistics network design. Transp. Res. Part E Logist. Transp. Rev. 2016, 89, 53–69. [Google Scholar] [CrossRef]
  65. Fotuhi, F.; Huynh, N. Reliable Intermodal Freight Network Expansion with Demand Uncertainties and Network Disruptions. Netw. Spat. Econ. 2017, 17, 405–433. [Google Scholar] [CrossRef]
  66. Notteboom, T.E. A carrier’s perspective on container network configuration at sea and on land. J. Int. Logist. Trade 2004, 1, 65–87. [Google Scholar] [CrossRef]
  67. Lam, J.S.L.; Gu, Y. A market-oriented approach for intermodal network optimisation meeting cost, time and environmental requirements. Int. J. Prod. Econ. 2016, 171, 266–274. [Google Scholar] [CrossRef]
  68. Resat, H.G.; Turkay, M. Design and operation of intermodal transportation network in the Marmara region of Turkey. Transp. Res. Part E Logist. Transp. Rev. 2015, 83, 16–33. [Google Scholar] [CrossRef]
  69. Ertem, M.A.; Isbilir, M.; Arslan, S. Review of intermodal freight transportation in humanitarian logistics. Eur. Transp. Res. Rev. 2017, 9, 1–11. [Google Scholar] [CrossRef] [Green Version]
  70. Demir, E.; Burhholzer, W.; Hrušovsky, M.; Arikan, E.; Jammernegg, W.; Van Woensel, T. A green intermodal service network design problem with travel time uncertainty. Transp. Res. Part B Methodol. 2015, 93, 789–807. [Google Scholar] [CrossRef]
  71. Bouchery, Y.; Fransoo, J. Cost, carbon emissions and modal shift in intermodal network design decisions. Int. J. Prod. Econ. 2015, 164, 388–399. [Google Scholar] [CrossRef]
  72. Uddin, M.; Huynh, N. Routing Model for Multicommodity Freight in an Intermodal Network Under Disruptions. Transp. Res. Rec. 2016, 2548, 71–80. [Google Scholar] [CrossRef]
  73. Mostert, M.; Caris, A.; Limbourg, S. Road and intermodal transport performance: The impact of operational costs and air pollution external costs. Res. Transp. Bus. Manag. 2017, 23, 75–85. [Google Scholar] [CrossRef] [Green Version]
  74. Heinold, A.; Meisel, F. Emission limits and emission allocation schemes in intermodal freight transportation. Transp. Res. Part E Logist. Transp. Rev. 2020, 141, 101963. [Google Scholar] [CrossRef]
  75. Assadipour, G.; Ke, G.Y.; Verma, M. Planning and managing intermodal transportation of hazardous materials with capacity selection and congestion. Transp. Res. Part E Logist. Transp. Rev. 2015, 76, 45–57. [Google Scholar] [CrossRef]
  76. Murillo, D.G.C.; Liedtke, G. A model for the formation of colloidal structures in freight transportation: The case of hinterland terminals. Transp. Res. Part E Logist. Transp. Rev. 2013, 49, 55–70. [Google Scholar] [CrossRef]
  77. Dong, C.; Boute, R.; McKinnon, A.; Verelst, M. Investigating synchromodality from a supply chain perspective. Transp. Res. Part D Transp. Environ. 2018, 61, 42–57. [Google Scholar] [CrossRef]
  78. Kim, N.S.; Van Wee, B. The relative importance of factors that influence the break-even distance of intermodal freight transport systems. J. Transp. Geogr. 2011, 19, 859–875. [Google Scholar] [CrossRef]
  79. Macharis, C.; Van Hoeck, E.; Pekin, E.; Van Lier, T. A decision analysis framework for intermodal transport: Comparing fuel price increases and the internalisation of external costs. Transp. Res. Part A Policy Pract. 2010, 44, 550–561. [Google Scholar] [CrossRef]
  80. Chen, L.; Miller-Hooks, E. Resilience: An Indicator of Recovery Capability in Intermodal Freight Transport. Transp. Sci. 2012, 46, 109–123. [Google Scholar] [CrossRef]
  81. Munim, Z.H.; Haralambides, H. Competition and cooperation for intermodal container transhipment: A network optimization approach. Res. Transp. Bus. Manag. 2018, 26, 87–99. [Google Scholar] [CrossRef]
  82. Saeed, N. Cooperation among freight forwarders: Mode choice and intermodal freight transport. Res. Transp. Econ. 2013, 42, 77–86. [Google Scholar] [CrossRef]
  83. Tadić, S.; Zečević, S.; Krstić, M. Assessment of the political city logistics initiatives sustainability. Transp. Res. Procedia 2018, 30, 285–294. [Google Scholar] [CrossRef]
  84. Kuo, R.J.; Hsu, C.W.; Chen, Y.L. Integration of fuzzy ANP and fuzzy TOPSIS for evaluating carbon performance of suppliers. Int. J. Environ. Sci. Technol. 2015, 12, 3863–3876. [Google Scholar] [CrossRef] [Green Version]
  85. Mishra, A.R.; Rani, P.; Pandey, K.; Mardani, A.; Streimikis, J.; Streimikiene, D.; Alrasheedi, M. Novel multi-criteria intuitionistic fuzzy SWARA-COPRAS approach for sustainability evaluation of the bioenergy production process. Sustainability 2020, 12, 4155. [Google Scholar] [CrossRef]
  86. Büyüközkan, G.; Ifi, G. A novel hybrid MCDM approach based on fuzzy DEMATEL, fuzzy ANP and fuzzy TOPSIS to evaluate green suppliers. Expert Syst. Appl. 2012, 39, 3000–3011. [Google Scholar] [CrossRef]
  87. Barukab, O.; Abdullah, S.; Ashraf, S.; Arif, M.; Khan, S.A. A new approach to fuzzy TOPSIS method based on entropy measure under spherical fuzzy information. Entropy 2019, 21, 1231. [Google Scholar] [CrossRef] [Green Version]
  88. Pamučar, D.; Stević, Ž.; Sremac, S. A new model for determiningweight coefficients of criteria in MCDM models: Full Consistency Method (FUCOM). Symmetry 2018, 10, 393. [Google Scholar] [CrossRef] [Green Version]
  89. Krylovas, A.; Zavadskas, E.; Kosareva, N.; Dadelo, S. New KEMIRA method for determining criteria priority and weights in solving MCDM problem. Int. J. Inf. Technol. Decis. Mak. 2014, 13, 1119–1133. [Google Scholar] [CrossRef]
  90. Dalkey, N.; Helmer, O. An experimental application of the Delphi method to the use of experts. Manag. Sci. 1963, 9, 458–467. [Google Scholar] [CrossRef]
  91. Delbecq, A.; Van de Ven, A.; Gustafson, D. Group Techniques for Program Planning: A Guide to Nominal Group and Delphi Processes; Scot Foresman: Glenview, IL, USA, 1975. [Google Scholar]
  92. Shen, Y.-C.; Lin, G.T.R.; Tzeng, G.-H. Combined DEMATEL techniques with novel MCDM for the organic light emitting diode technology selection. Expert Syst. Appl. 2011, 38, 1468–1481. [Google Scholar] [CrossRef]
  93. Murry, T.J.; Pipino, L.L.; Gigch, J.P. A pilot study of fuzzy set modification of Delphi. Hum. Syst. Manag. 1985, 5, 76–80. [Google Scholar] [CrossRef]
  94. Ginevičius, R. A new determining method for the criteria weights in multicriteria evaluation. Int. J. Inf. Technol. Decis. Mak. 2011, 10, 1067–1095. [Google Scholar] [CrossRef]
  95. Chatterjee, P.; Mondal, S.; Boral, A.; Banerjee, A.; Chakraborty, S. A novel hybrid method for non-traditional machining process selection using factor relationship and multi-attributive border approximation. FU Mech. Eng. 2017, 15, 439–456. [Google Scholar] [CrossRef] [Green Version]
  96. Roy, J.; Pamučar, D.; Kar, S. Evaluation and selection of third party logistics provider under sustainability perspectives: An interval valued fuzzy-rough approach. Ann. Oper. Res. 2020, 293, 669–714. [Google Scholar] [CrossRef]
  97. Stević, Ž.; Brković, N. A Novel Integrated FUCOM-MARCOS Model for Evaluation of Human Resources in a Transport Company. Logistics 2020, 4, 4. [Google Scholar] [CrossRef] [Green Version]
  98. Stević, Ž.; Pamučar, D.; Puška, A.; Chatterjee, P. Sustainable supplier selection in healthcare industries using a new MCDM method: Measurement of alternatives and ranking according to COmpromise solution (MARCOS). Comput. Ind. Eng. 2020, 140, 106231. [Google Scholar] [CrossRef]
  99. Stanković, M.; Stević, Ž.; Das, D.K.; Subotić, M.; Pamučar, D. A new fuzzy marcos method for road traffic risk analysis. Mathematics 2020, 8, 457. [Google Scholar] [CrossRef] [Green Version]
  100. Hsu, T.H.; Yang, T.H. Application of fuzzy analytic hierarchy process in the selection of advertising media. J. Manag. Syst. 2000, 7, 19–39. [Google Scholar]
  101. Bergqvist, R.; Falkemark, G.; Woxenius, J. Establishing intermodal terminals. World Rev. Intermodal. Transp. Res. 2010, 3, 285–302. [Google Scholar] [CrossRef]
  102. Wei, H.; Sheng, Z. Dry ports-seaports sustainable logistics network optimization: Considering the environment constraints and the concession cooperation relationships. Pol. Marit. Res. 2017, 24, 143–151. [Google Scholar] [CrossRef] [Green Version]
  103. Feng, X.; Zhang, Y.; Li, Y.; Wang, W. A location-allocation model for seaport-dry port system optimization. Discret. Dyn. Nat. Soc. 2013, 2013, 1–9. [Google Scholar] [CrossRef]
  104. Bojić, S.; Georgijević, M.; Brcanov, D. Transformation of the Danube Ports into Logistics Centers and Their Integration in the EU Logistics Network. Towards Innov. Freight Logist. 2016, 2, 217–229. [Google Scholar] [CrossRef]
  105. Caris, A.; Limbourg, S.; Macharis, C.; van Lier, T.; Cools, M. Integration of inland waterway transport in the intermodal supply chain: A taxonomy of research challenges. J. Transp. Geogr. 2014, 41, 126–136. [Google Scholar] [CrossRef] [Green Version]
  106. Tadić, S.; Krstić, M.; Brnjac, N. Selection of efficient types of inland intermodal terminals. J. Transp. Geogr. 2019, 78, 170–180. [Google Scholar] [CrossRef]
  107. Tadić, S.; Zečević, S.; Milenković, D. Problems regarding intermodal transport in the Danube Region. In Proceedings of the 4th International Conference on Traffic and Transport Engineering, ICTTE, Belgrade, Serbia, 27–28 September 2018; City Net Scientific Research Center Ltd. Belgrade: Belgrade, Serbia, 2018; pp. 483–489. [Google Scholar]
Figure 1. Algorithmic steps of the hybrid fuzzy D-FARE and fuzzy MARCOS model.
Sustainability 13 05590 g001
Figure 2. IT system development Scenario 1: Cooperation among logistics providers.
Sustainability 13 05590 g002
Figure 3. IT system development Scenario 2: Revitalization of existing local IT terminals.
Sustainability 13 05590 g003
Figure 4. IT system development Scenario 3: Regional DP terminals for Balkan seaports.
Sustainability 13 05590 g004
Figure 5. IT system development Scenario 4: Local terminals in the function of DP for Danube ports.
Sustainability 13 05590 g005
Figure 6. IT system development Scenario 5: IT core network with Danube DP terminals.
Sustainability 13 05590 g006
Figure 7. IT system development Scenario 5: Complete IT network.
Sustainability 13 05590 g007
Table 1. Review of relevant criteria in the literature.
Criteria GroupCriteriaRelated LiteratureCriteria GroupCriteriaRelated Literature
TechnicalEfficiency[1,25,59,60,61]EconomicImplementation costs, Funding source[1,11,24,45,61,62,63,64]
Transit times[11,45,50,60,63,65,66,67,68,69,70]Operational costs[1,11,50,59,60,62,63,64,65,66,67,68,69,70,71,72,73,74,75,76,77,78,79]
Density and balance of cargo flows[45,66]Equipment acquisition costs[75]
Distribution of service demand[66]Terminal charges[66]
Modal shift[25,61,71]Economy of scale[11,76]
Flexibility[1,11,60,72,77]Contribution to economic development[1,45,61]
Availability[11,25,69]SocialSafety[1,45,50,60,61,69,75,79]
Service quality/Service level[11,25,60,65,69,74,80]Noise, Vibrations[1,62,79]
Terminal congestions[50,75]Congestions[1,11,45,50,79]
Diversity, Versatility[1,45,69,76]Competition[25,81]
Resilience[1,80]Cooperation[24,81,82]
Reliability[1,60,77]EnvironmentalEmissions[1,11,45,60,61,62,63,67,70,71,73,74,77]
Spatial characteristics[45,78]Energy conservation/consumption[45]
Available infrastructure[1,24,25,45,66]Institutional/PoliticalRegulations, Policies, Institutions[1,24,25,45,59,79]
Implementation possibility, Possibility for expansion[1,61]International harmonization[45,50,59]
Internalization of external costs[59,79]
Table 2. Linguistic terms and their corresponding fuzzy values.
Linguistic TermAbbreviationFuzzy Scale
NoneN(0.1, 0.1, 1)
Extremely LowEL(1, 2, 3)
Very LowVL(2, 3, 4)
LowL(3, 4, 5)
Medium LowML(4, 5, 6)
MediumM(5, 6, 7)
Medium HighMH(6, 7, 8)
HighH(7, 8, 9)
Very HighVH(8, 9, 10)
Extremely HighEH(9, 10, 10)
Table 3. Criteria comparison according to stakeholder groups (Residents/Service providers/Service users/Administration).
C1C2C3C4C5C6C7C8C9C10C11C12
C1(/, /, /, /)(/, /, /, /)(/, /, /, M)(/, /, /, MH)(/, /, /, ML)(/, L, /, /)(/, /, /, VL)(/, /, /, L)(/, /, /, L)(/, /, /, EL)(/, /, /, /)(/, /, /, H)
C2(EL, M, EL, VL)(/, /, /, /)(/, /, /, MH)(/, ML, /, H)(/, /, /, M)(/, H, /, VL)(/, /, /, L)(/, /, /, ML)(/, VL, /, ML)(/, VL, /, VL)(/, L, /, /)(/, /, /, VH)
C3(VL, H, MH, /)(VL, L, MH, /)(/, /, /, /)(/, MH, /, VL)(/, /, ML, /)(/, EH, M, /)(/, /, /, /)(/, VL, L, /)(/, ML, VL, /)(/, ML, /, /)(/, M, VL, /)(/, L, /, ML)
C4(L, VL, VH, /)(L, /, VH, /)(VL, /, L, /)(/, /, /, /)(/, /, MH, /)(/, ML, H, /)(/, /, /, /)(/, /, M, /)(/, /, ML, /)(/, /, /, /)(/, /, ML, /)(VL, /, VL, VL)
C5(MH, H, L, /)(MH, L, L, /)(M, EL, /, VL)(ML, MH, /, L)(/, /, /, /)(/, EH, VL, /)(VL, EL, /, /)(/, VL, /, /)(VL, ML, /, /)(VL, ML, /, /)(/, M, /, /)(M, L, /, L)
C6(EH, /, VL, EL)(EH, /, VL, /)(VH, /, /, M)(H, /, /, MH)(ML, /, /, ML)(/, /, /, /)(M, /, /, VL)(VL, /, /, L)(M, /, /, L)(M, /, /, EL)(EL, /, /, /)(VH, /, /, H)
C7(M, H, EH, /)(M, L, EH, /)(ML, EL, ML, ML)(L, MH, VL, M)(/, /, H, L)(/, EH, VH, /)(/, /, /, /)(/, VL, MH, VL)(EL, ML, M, VL)(EL, ML, EL, /)(/, M, M, /)(ML, L, L, MH)
C8(VH, MH, ML, /)(VH, VL, ML, /)(H, /, /, L)(MH, M, /, ML)(L, /, VL, VL)(/, VH, L, /)(ML, /, /, /)(/, /, /, /)(ML, L, /, /)(ML, L, /, /)(/, ML, /, /)(H, VL, /, M)
C9(M, ML, M, /)(M, /, M, /)(ML, /, /, L)(L, L, /, ML)(/, /, L, VL)(/, MH, ML, /)(/, /, /, /)(/, /, VL, EL)(/, /, /, /)(EL, EL, /, /)(/, VL, EL, /)(ML, /, /, M)
C10(M, ML, EH, /)(M, /, EH, /)(ML, /, ML, M)(L, L, VL, MH)(/, /, H, ML)(/, MH, VH, /)(/, /, /, VL)(/, /, MH, L)(/, /, M, L)(/, /, /, /)(/, VL, M, /)(ML, /, L, H)
C11(EH, L, M, L)(EH, /, M, VL)(VH, /, /, H)(L, VL, /, VH)(ML, /, L, MH)(/, M, ML, L)(M, /, /, ML)(VL, /, VL, M)(M, /, /, M)(M, /, /, L)(/, /, /, /)(VH, /, /, EH)
C12(VL, M, H, /)(VL, EL, H, /)(EL, /, VL, /)(/, ML, /, /)(/, /, M, /)(/, H, MH, /)(/, /, /, /)(/, /, ML, /)(/, VL, L, /)(/, VL, /, /)(/, L, L, /)(/, /, /, /)
Table 4. IT scenario evaluation according to the criteria.
ScenariosC1C2C3C4C5C6C7C8C9C10C11C12
Scenario 1EHEHEHHNNELNVLEHNMH
Scenario 2HHHMHMHMMHMLMLHMHML
Scenario 3MHMHMLMLMHMHMHLMEL
Scenario 4MHMMLLMHMMMVLMLEL
Scenario 5LVLMLVHVHVHVHVHVHVHVHVL
Scenario 6NNVLEHEHEHEHEHEHEHEHN
Table 5. Output results of the hybrid fuzzy D-FARE and fuzzy MARCOS model.
Scenario K i + K i f ( K i + ) f ( K i ) F i Rank
Scenario 10.4793.7170.0690.5380.2746
Scenario 20.7045.4720.1020.7920.6133
Scenario 30.6054.7190.0880.6830.4484
Scenario 40.5444.2530.0790.6160.3605
Scenario 50.7896.1190.1140.8860.7781
Scenario 60.7715.9290.1120.8580.7342
Publisher’s Note: MDPI stays neutral with regard to jurisdictional claims in published maps and institutional affiliations.

