Abstract
Distracted driving is an important risk factor for traffic accidents. In particular, smartphone use while driving has become the leading cause of distraction in recent years, with the advent of smartphones and their extended functions. One noteworthy change is the addictiveness and dependency on smartphones. This study was conducted to investigate the effect of smartphone dependency on the use of smartphones while driving. A survey of 948 Korean drivers assessed smartphone dependency as well as driver experiences of calling and manipulating the smartphone while driving. Based on the survey, the relationship between smartphone dependency and the use of smartphones was examined using factor analysis and binary logistic regression. Results reveal that drivers who had high smartphone dependency were more likely to use their smartphones while driving, and the effect of smartphone dependency on manipulation was more influential than it was on calls. The results provide compelling evidence that patterns of dependent smartphone usage affect the use of smartphones while driving, especially regarding manipulation. These findings explore smartphone usage whilst driving and can provide a stepping stone toward the formulation of future policies for traffic safety.
1. Introduction
Distracted driving includes actions that divert the attention of drivers while they are driving. Traffic safety statistics and studies in many countries show that this distracted behavior is considered a major risk factor in traffic safety [1,2,3]. Among the many distractive factors in driving, calling and texting via mobile phones are the leading causes of distraction. Previous studies show that distraction by calling and texting substantially deteriorates driving performance, increasing the risk of crashes and severe injuries [4,5,6,7,8,9,10,11].
Research has been conducted to determine the motivation for the use of cellphones while driving, and has found that psychological factors, such as normative beliefs of cellphone use, perceived risk of accident, perceived risk of fines, attitude toward using cellphones while driving, and perceived importance of calling, all affect the use of cellphones while driving [11,12,13,14].
In recent years, smartphones that allow wireless access to the internet and which are able to perform many functions of a computer have replaced traditional mobile phones that were limited only to calling and texting. As smartphones become ever more widely available, there is growing concern about their impact on traffic safety. This is not only because the extended functions of smartphones distract drivers to a greater degree than calling and texting, but also because smartphones induce dependent usage patterns [15,16].
In Korea, smartphones have rapidly penetrated the market and, as of 2020, 93.4% of the population own smartphones [17]. In a survey conducted by the National Information Society Agency [18], over thirty thousand Korean smartphone users were asked about their smartphone usage patterns. The survey showed that dependency on smartphones is a serious social issue: 23.3% of Korean smartphone users were considered as over-dependent on smartphones, which is more than twice as high as the figure for 2013 (11.8%).
With the high penetration rate of smartphones and changes in their usage patterns, smartphone use while driving is considered a serious threat to traffic safety. There have been, however, only a few studies that have evaluated the effect of dependent usage patterns on smartphone use while driving. For this reason, the objective of this study was to examine how dependency on smartphones motivates the use of smartphones while driving.
To this end, we designed a survey using which we could collect information on driver behaviors in terms of smartphone use, including smartphone dependency. We collected responses from 948 participants (Section 2). The survey responses were analyzed using factor analysis and statistical analysis to represent smartphone dependency as a quantitative variable and to evaluate what driver characteristics affect smartphone dependency and its use while driving (Section 3). Finally, we discuss the findings and implications that can be used to discourage the use of smartphones while driving (Section 4).
2. Survey
The survey participants were Korean drivers who drive in their daily lives and own smartphones. Data were collected over a period of one month in December 2013 using both online and offline surveys. The total sample was 948. Online participants numbered 739; offline participants numbered 209. Ethical clearance was granted by the Korea Transportation Safety Authority. All survey questions and their descriptive statistics are presented in Table 1.

Table 1.
Survey design and statistics.
2.1. Demographic Characteristics
A 21-item questionnaire was designed to measure driver characteristics, patterns of smartphone usage while driving, and smartphone dependency. In the first section, demographic factors related to smartphone use were investigated. There were five questions related to demographics and driving attributes such as gender, age, average driving time, and driving frequency, as well as one additional item concerning the experience of traffic accidents. With driving frequency, participants were asked how many days they drove within one month and were requested to type a value between 1 and 30. Average driving time per drive was assessed with three categorical variables: (1) less than one hour, (2) more than one hour and less than three hours, and (3) more than three hours. Descriptive statistics of the general demographics of participants are presented in Table 1a.
2.2. Using a Smartphone While Driving
To measure the use of smartphones while driving, we asked if participants had: (1) experience of talking on a smartphone in hand (excluding hands-free and Bluetooth systems), and (2) experience of manipulation of a smartphone, including texting, SNS access, and internet access. These questions were measured with an item asking participants, “In your 10 most recent drives, have you had the experience of talking on a smartphone?” with response options of “yes” or “no”. Smartphone manipulation was considered the same way, only with participants being asked about their manipulation of smartphones instead of their talking on smartphones.
In addition, to compare smartphone-related distracted behaviors with other driving-safety behaviors, seatbelt use was selected as the criterion variable. For several items included in the psychological factors and in the experience of distracted driving behavior, the same questions had been asked regarding seatbelt use. The reason for selecting seatbelt usage was that wearing a seatbelt is commonly accepted as a basic safety behavior while driving, and has been a compulsory requirement by law for a long time.
The patterns of smartphone use while driving are presented in Table 1b. Regarding the items asking about the experience of smartphone use in the 10 most recent drives, 71% of participants responded that they had the experience of talking on smartphones; 56% of those responded that they had the experience of manipulating their smartphones while driving. These numbers are relatively high in comparison to those for “not wearing a seatbelt”: 25% of those surveyed had the experience of not wearing a seatbelt in the 10 most recent drives.
2.3. Perceived Risk from Using a Smartphone While Driving
Two types of perceived risk characteristics were assessed: perceived collision risk and perceived enforcement risk, because risk perception is one of the key psychological factors associated with cellphone use while driving [12,13,14]. Efforts to discourage smartphone use while driving have focused on two kinds of countermeasures: (1) Campaigns and education to emphasize the risk of smartphone use while driving and (2) Traffic enforcement by police officers. Based on previous research and those ongoing countermeasures, this study adopted perceived collision risk and perceived enforcement risk as risk perception factors. Both of these risks were assessed with one item on a 7-point Likert scale (1 = Not at all risky to 7 = Extremely risky) asking “How risky is it to talk on (or manipulate) smartphones while driving in terms of traffic collision,” and “How risky is it to talk on (or manipulate) smartphones while driving in terms of traffic enforcement.”
With respect to perceived collision risk, measured on a 1 to 7 Likert scale (see Table 1c), participants responded that both talking and manipulation of smartphones are risky. Over 80% of participants answered that talking on smartphones while driving is risky; somewhat risky (27.6%), risky (34.8%), or extremely risky (22.3%). In terms of the manipulation of smartphones, over 90% of participants responded that manipulation of smartphones while driving is risky; somewhat risky (10.1%), risky (28.8%), and extremely risky (51.7%). It is worth noting that over half of the participants responded that the manipulation of smartphones is “extremely risky”, which is significantly higher than for a phone call. This is because drivers can talk on the phone while looking forward, while drivers should point their eyes to a smartphone when manipulating it.
Perceived enforcement risk was more evenly distributed compared to perceived collision risk (which was left-skewed: see Table 1c). About 50% of participants answered that talking on smartphones while driving was risky; somewhat risky (22.4%), risky (19.1%), or extremely risky (8.6%). Manipulation of smartphones while driving had a similar pattern of response; somewhat risky (20.1%), risky (17.6%), or extremely risky (10.0%). Compared to the perceived enforcement risk of not wearing a seatbelt, both calling and manipulation had relatively low perceived enforcement risk. About 70% of participants answered that not wearing a seatbelt is risky with regard to traffic enforcement; somewhat risky (24.2%), risky (28.7%), or extremely risky (17.9%). This means that participants usually consider not wearing a seatbelt to be a higher risk for traffic enforcement than calling and smartphone manipulation.
2.4. Smartphone Dependency
Finally, seven questions related to smartphone dependency were included. Smartphone dependency is a latent concept which is difficult to measure with a single item. As such, multiple items were used to represent smartphone dependency. The items were rooted in the Korean Children and Youth Panel Survey [19]. The items consisted of the following statements: (1) I am becoming more and more dependent on my smartphone; (2) I am nervous without my smartphone; (3) I am nervous when there are no messages for a long time; (4) Playing with my smartphone makes time fly; (5) I feel bored without my smartphone; (6) I feel isolated without my smartphone; and (7) I cannot bear to be without my smartphone. These were evaluated on a 5-point Likert scale (1 = strongly disagree to 5 = strongly agree).
The survey results of smartphone dependency are presented in Table 1d. Most of the items were evenly distributed, but with the items asking about nervousness without smartphones and increasing dependency on using smartphones, participants had a tendency toward reporting being nervous without smartphones and increasingly dependent on smartphones.
3. Statistical Analysis
3.1. Quantifying Smartphone Dependency
To investigate the relationship between smartphone dependency and the use of a smartphone while driving, various statistical techniques and models were applied by using statistical software program, R. To quantify the smartphone dependency of participants, factor analysis was utilized. Factor analysis is a statistical method used to find potentially unobserved variables underlying manifest variables. Because smartphone dependency is a latent variable that cannot be observed and measured directly using a single item, a single factor model was selected based on the seven items asked about smartphone use (see Figure 1). As this seven-item scale has already been validated by the Korean Children and Youth Panel Survey, we proposed a single factor model that consists of seven items. Arrows from smartphone dependency to items () indicate that latent smartphone dependency affects the respondents’ response scores, which were manifest and measurable factors, and that the rest of the variance can be explained by the error terms ().
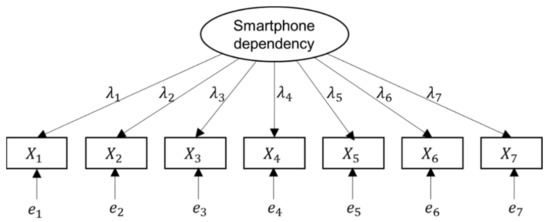
Figure 1.
Single-factor model of smartphone dependency.
In other words, this single factor model includes seven linear equations represented as follows:
where
: Standardized scores of ith question item of jth participant
: Factor loadings of ith item
: Smartphone dependency of jth participant
: Residual terms for the corresponding manifest variable of ith item of jth participant
With the covariance matrix of and the rotation matrix method, factor loadings (s) that indicate the correlation coefficient between the latent construct and the respective observed items are estimated. Maximum likelihood estimation is used to estimate the factor loadings. We used varimax rotation for factor rotation and principal axis factoring for factoring method. All factor loadings and their standardized values are presented in Table 2. A lower factor loading shows that the corresponding manifest variable cannot be well explained by the latent variable. It is desirable that the standardized factor loading be greater than at least 0.5 [20]. In this study, all standardized factor loadings were above the desired value and had statistical significance with low p-values (less than 0.01).
Table 2.
Results of factor analysis.
Three reliability and validity indices of factor analysis were examined to describe how consistently the surveyed question items represented smartphone dependency. Table 3 summarizes the three indices. To measure reliability, referring to the consistency of measurement, Cronbach’s alpha test was employed. The seven items measuring smartphone dependency had internal consistency with a 0.91 value of Cronbach’s alpha (a score higher than 0.7 is recommended [21]). Validity refers to the extent to which the instruments measure what they are intended to measure. In this study, validity was examined using composite reliability and average variance extracted (AVE). Construct reliability, reflecting the internal consistency of the indicators measuring smartphone dependency, was 0.86 (a score > 0.7 is recommended [22]). AVE assesses the amount of variance captured by an underlying factor. Though it is preferable to have a value above 0.5, the AVE of this model was 0.48, which is close to 0.5, and, thus roughly acceptable [20].
Table 3.
Indices for reliability and validity.
3.2. Effect of Demographic Factors on Smartphone Dependency and Use of Smartphones
To explore the difference in smartphone dependency among the different demographic groups, an analysis of variance (ANOVA) was performed in this study. A two-way analysis of variance, which is an extension of the one-way ANOVA, examines the effect of two different categorical independent variables on one continuous dependent variable. The two-way ANOVA not only aims to assess the main effect of each independent variable, but also considers the interaction between them. In this study, the two-way ANOVA model was fitted to investigate the effect of age and gender on smartphone dependency. The factor score of smartphone dependency derived from factor analysis was used as a dependent variable.
Figure 2 shows an interaction plot displaying the levels of gender on the x-axis and the mean response for each case on the y-axis. It shows that smartphone dependency is lower for males than for females, and between age groups, the over-50 age group has the lowest smartphone dependency compared to other groups. It is worth noting that, except for over-50 age group, the effect of age on smartphone dependency is different according to gender. It is obvious that the smartphone dependency of female drivers increases as their age increases, whereas in the male it is the opposite.
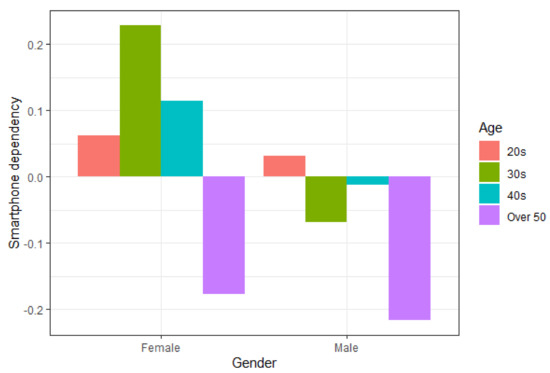
Figure 2.
Smartphone dependency by gender and age groups.
Table 4 shows the results of the two-way ANOVA. The test for the effect of gender shows a significant gender effect on smartphone dependency at a 0.05 significance level. However, the test for the effect of age tells us that there is not a significant age effect on smartphone dependency. Finally, there is also no evidence of a significant interaction effect of gender and age. We, therefore, cannot conclude that there is an interaction between age and gender.
Table 4.
ANOVA for smartphone dependency.
To investigate the detailed mean change between the age groups, a pairwise t-test was performed. The p-value matrix of the t-test results is presented in Table 5. It shows that the over-50 age group had a significant difference in smartphone dependency compared to other age groups, and that there were no significant differences between the 20s, 30s, and 40s age groups.
Table 5.
Pairwise comparison matrix for smartphone dependency.
We determined that the smartphone usage pattern while driving is different across demographic groups. Table 6 shows the proportion of participants who had experience with calling and manipulating smartphones while driving by age and gender. It shows that age is also a crucial factor affecting the use of smartphones while driving. Overall, older drivers are more inclined to make phone calls than to manipulate a cell phone while driving, and vice versa in the case of younger drivers. The proportion of experience of phone calls in the over-50 age group was the highest (78.8%), while those in their 20s had the lowest (64.6%). In the case of manipulation, the proportion of the 20s was the highest (70.2%), whereas the over-50s group showed the lowest proportion (36.3%). With respect to gender, on the other hand, there were only slight differences by gender, in the ratio of those both making a phone call and manipulating smartphones.
Table 6.
Different uses of a smartphone while driving by demographic factors.
Table 7 shows the results of performing the chi-square test to statistically verify the difference in usage patterns between groups. Differences by gender were not significant, but those by age showed significant differences in both calling and manipulation.
Table 7.
Result of the chi-square test for the use of a smartphone while driving.
3.3. Effect of Smartphone Dependency and the Use of Smartphones While Driving
To investigate the impact of various factors on the use of a smartphone while driving, two binary logistic regression models were constructed: (1) Making a call, and (2) Manipulating smartphones while driving were used as response variables. All demographic and driving characteristics and psychological factors including smartphone dependency were used as explanatory variables.
Because age and driving time were categorical variables having more than two levels, those variables were transformed into dummy variables. Age, which included four categories (20s, 30s, 40s, and >50), was dummy coded with the 20s age group as a comparison group. Driving time, which had three categories (less than 1 h, 1–3 h, and more than 3 h), was dummy coded with the “less than 1 h” driving time group as a comparison group.
The perceived collision risk and enforcement risk, which were categorical variables measured on 1 to 7 point Likert scales, were also dummy coded. There needed to be six dummy variables to represent each of the perceived risks because they were categorized into seven groups; however, this made the constructed model too complicated. For this reason, the risk perception variables were categorized into smaller numbers of groups. For the perceived collision risk variable, the distribution was extremely left-skewed, as shown on Table 1c. To secure sufficient samples in each group, the perceived collision risk was reclassified into two groups: a high perceived collision risk group in which respondents checked 6 or 7 (on the 1 to 7 Likert scale), and a low perceived collision risk group in which participants checked numbers lower than 6. Perceived enforcement risk was relatively equally distributed, so it was divided into three groups: a high perceived enforcement risk group (participants checked 6 or 7), a medium perceived enforcement risk group (participants checked 4 or 5), and a low perceived enforcement risk group (participants checked numbers lower than 4).
Finally, to set smartphone dependency as an explanatory variable, factor scores derived from factor analysis were used as predictor variables. There were several methods used to calculate the factor score, such as the regression method, the Barlett method, and the Anderson–Rubin method. The regression method, which has higher validity than the others [23], was adopted in this study.
The results of the logistic regressions are given in Table 8. The coefficients of age groups showed that age was significantly influential on the manipulation of smartphones, as the likelihood of manipulating smartphones decreased in the older age group; however, in terms of talking on smartphones, being in the age group > 50 significantly increased the likelihood of calling, compared to the case of the 20s age group.
Table 8.
Estimates of regression coefficients.
When focusing on perceived risk factors, perceived collision risk was statistically significant in terms of phone manipulation, but not significant in terms of calling (at 0.05 significance level). The likelihood of manipulating smartphones decreased when participants had higher perceived collision risk. The likelihood of talking on smartphones also decreased when participants had higher perceived collision risk, but the likelihood was not statistically significant with a 0.05 significance level (p-value: 0.12). Perceived enforcement risk significantly affected the likelihood of manipulating smartphones. Compared to the low perceived enforcement group, the higher perceived enforcement risk groups were associated with a higher likelihood of manipulating smartphones while driving. The probability of talking on smartphones, however, was not found to differ with differently perceived enforcement groups.
Finally, smartphone dependency was significantly associated with both talking and manipulation. The probability of using smartphones increased when a participant had greater smartphone dependency. It is notable that the coefficient of smartphone dependency regarding the manipulation of smartphones (0.502) was 1.6 times higher than that for talking on smartphones (0.310). This means that participants who had higher levels of smartphone dependency tended to use their smartphones more frequently while driving and that smartphone dependency is more influential on the manipulation of smartphones than on calls when driving.
4. Discussion
Studies have shown that factors such as age, gender, and personality of drivers have a great influence on smartphone use while driving [24,25,26,27,28]. In this study, we set those demographic factors and perceived collision and enforcement risk as control variables and explored the relationship between smartphone dependency and smartphone use while driving.
The results revealed that drivers who had high smartphone dependency tended to use their smartphones more frequently. This finding is consistent with the previous research that smartphone addiction has a significant influence on smartphone use while driving [24]. However, this study has a contribution in that it also identified that the magnitude of the effect is larger for manipulation than it was for talking on smartphones.
In addition, this study compared the driver’s perceived collision and enforcement risk, and found that drivers had high perceived collision risk and relatively less perceived enforcement risk. These findings show the need to control smartphone use while driving from a new perspective, rather than traditional methods represented by law regulation and traffic enforcement. There is much research indicating doubts about the effectiveness of legislation and traffic enforcement on smartphone manipulation and calling whilst driving. Research investigating the effectiveness of laws banning cellphone use in the U.S. indicated that the proportion of those using mobile phones decreased just after the legislation was enacted, but increased again over time [29,30,31].
The research implies that there is a need to manage people who have high smartphone dependency as much as controlling demographic groups who use smartphones a lot while driving. Many studies have focused on the relationship between age and smartphone use while driving, and they have argued that countermeasures should also focus on young age groups. However, the results of this study show that smartphone dependency is a mediating factor that connects demographic factors of people and smartphone use while driving. Therefore, measures to break the linkages between them are required.
With the efforts to reduce smartphone dependency and addictive usage patterns [15,32], there is a need to find a way to break the linkage between smartphone dependency and smartphone use while driving. One study suggested an alternative in which smartphone functions were partially blocked while driving by installing an application on a smartphone [33]. A policy calling for reduction of car insurance fees could be considered if drivers installed smartphone applications that automatically perceive when a car is being driven and restrict the smartphone functions. Another study developed a model that detects the use of a smartphone while driving based on the driver’s driving record data, and found that detection is possible with a high accuracy of 70% or more [26]. As such, in order to suppress the use of a smartphone while driving, it is necessary to grasp the basis of the driver using a smartphone and respond accordingly.
It is also necessary to acknowledge that preventing the use of smartphones while driving completely is impossible and unrealistic. A policy that allows the use of smartphones to some extent is necessary. For example, in New York, the government has added texting zones along highways so that drivers can pull over and use their smartphones [34]. The association between smartphone dependency and smartphone use while driving shows that we should consider interventions and countermeasures more flexibly.
5. Conclusions
This study was conducted to investigate the effect of smartphone dependency on the use of smartphones while driving. The investigation was performed using survey information from 948 Korean drivers and included seven items measuring smartphone dependency. Based on the survey data, smartphone dependency was quantified by factor analysis; then, logistic regression analysis was used to investigate the effect of smartphone dependency on the use of smartphones while driving, relative to demographic and perceived risk factors. We found that smartphone dependency and smartphone use while driving has a significant relationship.
These results provide compelling evidence that dependent usage patterns of smartphones are a crucial factor in explaining why drivers use smartphones while driving. These findings suggest future policies and countermeasures for discouraging smartphone use while driving. Simply imposing a fine is not enough, but efforts to discourage habitual use of smartphones while driving is necessary to develop an effective enforcement system. Moreover, from the viewpoint that drivers already perceive the collision risk of using smartphones while driving as very high (see Section 2.2), traffic safety campaigns that mainly focus on collision dangers of smartphone use while driving could also be modified to influence stress-dependent patterns of smartphone usage.
The relationship between smartphone dependency and the use of smartphones while driving indicates the limitations of current countermeasures, such as traffic enforcement and safety campaigns, because drivers who have a heavy dependency on smartphones could use their smartphones while driving unconsciously, without considering the risks of collision or enforcement. This study also shows that smartphone dependency differs by age and gender. A strategy focusing on groups with high smartphone dependency would enhance the efficiency of policies and countermeasures.
Some limitations are worth noting. Firstly, there are different usage patterns and different types of driver psychology when drivers are texting, web surfing, or watching videos; however, in this study, only two categories of smartphone use were considered: calling and manipulation. A more detailed separation should be considered. Second, traffic circumstances such as weather, traffic flow, and traffic signals can also affect smartphone use, but these environmental characteristics were not considered in this study. The various ideas mentioned in this paragraph should be considered topics for further research.
Author Contributions
Conceptualization, J.Y.; methodology, J.Y.; formal analysis, J.Y.; data curation, J.Y.; writing—original draft preparation, J.Y.; writing—review and editing, S.-H.P.; supervision, S.-H.P.; project administration, S.-H.P.; funding acquisition, S.-H.P. All authors have read and agreed to the published version of the manuscript.
Funding
This research received no external funding.
Data Availability Statement
The data presented in this study are available on request from the corresponding author. The data are not publicly available due to privacy of participants.
Conflicts of Interest
The authors declare no conflict of interest.
References
- Casado-Sanz, N.; Guirao, B.; Lara Galera, A.; Attard, M. Investigating the risk factors associated with the severity of the pedestrians injured on Spanish crosstown roads. Sustainability 2019, 11, 5194. [Google Scholar] [CrossRef]
- Eboli, L.; Forciniti, C. The severity of traffic crashes in Italy: An explorative analysis among different driving circumstances. Sustainability 2020, 12, 856. [Google Scholar] [CrossRef]
- Eboli, L.; Mazzulla, G.; Pungillo, G. The influence of physical and emotional factors on driving style of car drivers: A survey design. Travel Behav. Soc. 2017, 7, 43–51. [Google Scholar] [CrossRef]
- Beede, K.E.; Kass, S.J. Engrossed in conversation: The impact of cell phones on simulated driving performance. Accid. Anal. Prev. 2006, 38, 415–421. [Google Scholar] [CrossRef] [PubMed]
- Consiglio, W.; Driscoll, P.; Witte, M.; Berg, W.P. Effect of cellular tele-phone conversations and other potential interference on reaction time in a braking response. Accid. Anal. Prev. 2003, 35, 495–500. [Google Scholar] [CrossRef]
- Hancock, P.; Lesch, M.; Simmons, L. The distraction effects of phone use during a crucial driving maneuver. Accid. Anal. Prev. 2003, 35, 501–514. [Google Scholar] [CrossRef]
- Horrey, W.J.; Wickens, C.D. Examining the impact of cell phone conversations on driving using meta-analytic techniques. Hum. Factors 2006, 48, 196–205. [Google Scholar] [CrossRef]
- Hosking, S.G.; Young, K.L.; Regan, M.A. The effects of text messaging on young drivers. Hum. Factors 2009, 51, 582–592. [Google Scholar] [CrossRef]
- Just, M.A.; Keller, T.A.; Cynkar, J. A decrease in brain activation associated with driving when listening to someone speak. Brain Res. 2008, 1205, 70–80. [Google Scholar] [CrossRef]
- Strayer, D.L.; Johnston, W.A. Driven to distraction: Dual-task studies of simulated driving and conversing on a cellular telephone. Psychol. Sci. 2001, 12, 462–466. [Google Scholar] [CrossRef]
- Nemme, H.E.; White, K.M. Texting while driving: Psychosocial influences on young people’s texting intentions and behaviour. Accid. Anal. Prev. 2010, 42, 1257–1265. [Google Scholar] [CrossRef]
- Atchley, P.; Atwood, S.; Boulton, A. The choice to text and drive in younger drivers: Behavior may shape attitude. Accid. Anal. Prev. 2011, 43, 134–142. [Google Scholar] [CrossRef]
- Nelson, E.; Atchley, P.; Little, T.D. The effects of perception of risk and importance of answering and initiating a cellular phone call while driving. Accid. Anal. Prev. 2009, 41, 438–444. [Google Scholar] [CrossRef]
- Walsh, S.P.; White, K.M.; Hyde, M.K.; Watson, B.C. Dialling and driving: Factors influencing intentions to use a mobile phone while driving. Accid. Anal. Prev. 2008, 40, 1893–1900. [Google Scholar] [CrossRef]
- Chóliz, M. Mobile phone addiction: A point of issue. Addiction 2010, 105, 373–374. [Google Scholar]
- Bae, S.-M. The relationship between the type of smartphone use and smartphone dependence of Korean adolescents: National survey study. Child. Youth Serv. Rev. 2017, 81, 207–211. [Google Scholar] [CrossRef]
- 2012–2020 Smartphone Penetration Rate. Available online: https://www.gallup.co.kr/gallupdb/reportContent.asp?seqNo=1134 (accessed on 16 March 2021).
- The Survey on Smartphone Overdependence. Available online: https://www.nia.or.kr/site/nia_kor/ex/bbs/List.do?cbIdx=65914 (accessed on 16 March 2021).
- Korean Children and Youth Panel Survey 2010. Available online: https://www.nypi.re.kr/archive (accessed on 16 March 2021).
- Hair, J.F.; Tatham, R.L.; Anderson, R.E.; Black, W. Multivariate Data Analysis, 8th ed.; Pearson Prentice Hall: Upper Saddle River, NJ, USA, 2018; pp. 1–357. [Google Scholar]
- Cortina, J.M. What is coefficient alpha? An examination of theory and applications. J. Appl. Psychol. 1993, 78, 98. [Google Scholar] [CrossRef]
- Hatcher, L.; O’Rourke, N. A Step-by-Step Approach to Using SAS for Factor Analysis and Structural Equation Modeling, 2nd ed.; SAS Institute: Cary, NC, USA, 2014; pp. 147–150. [Google Scholar]
- DiStefano, C.; Zhu, M.; Mindrila, D. Understanding and using factor scores: Considerations for the applied researcher. Pract. Assess. Res. Evaluation 2009, 14, 1–11. [Google Scholar]
- Kita, E.; Luria, G. The mediating role of smartphone addiction on the relationship between personality and young drivers’ smartphone use while driving. Transp. Res. Part F Traffic Psychol. Behav. 2018, 59, 203–211. [Google Scholar] [CrossRef]
- Kita, E.; Luria, G. Differences between males and females in the prediction of smartphone use while driving: mindfulness and income. Accid. Anal. Prev. 2020, 140, 105514. [Google Scholar] [CrossRef]
- Papadimitriou, E.; Argyropoulou, A.; Tselentis, D.I.; Yannis, G. Analysis of driver behaviour through smartphone data: The case of mobile phone use while driving. Saf. Sci. 2019, 119, 91–97. [Google Scholar] [CrossRef]
- Demirhan, E.; Randler, C.; Horzum, M.B. Is problematic mobile phone use explained by chronotype and personality? Chronobiol. Int. 2016, 33, 821–831. [Google Scholar] [CrossRef] [PubMed]
- Sween, M.; Ceschi, A.; Tommasi, F.; Sartori, R.; Weller, J. Who is a distracted driver? Associations between mobile phone use while driving, domain-specific risk taking, and personality. Risk Anal. 2017, 37, 2119–2131. [Google Scholar] [CrossRef] [PubMed]
- McCartt, A.T.; Braver, E.R.; Geary, L.L. Drivers’ use of handheld cell phones before and after New York State’s cell phone law. Prev. Med. 2003, 36, 629–635. [Google Scholar] [CrossRef]
- McCartt, A.T.; Geary, L.L. Longer term effects of New York State’s law on drivers’ handheld cell phone use. Inj. Prev. 2004, 10, 11–15. [Google Scholar] [CrossRef] [PubMed]
- McCartt, A.T.; Hellinga, L.A. Longer-term effects of Washington, DC, law on drivers’ hand-held cell phone use. Traffic Inj. Prev. 2007, 8, 199–204. [Google Scholar] [CrossRef]
- Bianchi, A.; Phillips, J.G. Psychological predictors of problem mobile phone use. Cyber Psychol. Behav. 2005, 8, 39–51. [Google Scholar] [CrossRef]
- Oviedo-Trespalacios, O.; Briant, O.; Kaye, S.A.; King, M. Assessing driver acceptance of technology that reduces mobile phone use while driving: The case of mobile phone applications. Accid. Anal. Prev. 2020, 135, 105348. [Google Scholar] [CrossRef]
- Quisenberry, P.N. Texting and driving: Can it be explained by the general theory of crime? Am. J. Crim. Justice 2014, 40, 303–316. [Google Scholar] [CrossRef]


Publisher’s Note: MDPI stays neutral with regard to jurisdictional claims in published maps and institutional affiliations. |
© 2021 by the authors. Licensee MDPI, Basel, Switzerland. This article is an open access article distributed under the terms and conditions of the Creative Commons Attribution (CC BY) license (https://creativecommons.org/licenses/by/4.0/).