Article

Reliability Evaluation of Smart Microgrids Considering Cyber Failures and Disturbances under Various Cyber Network Topologies and Distributed Generation’s Scenarios

Department of Electrical and Computer Engineering, University of Kashan, 6 km Ghotbravandi Blvd, Kashan 8731753153, Iran
*
Author to whom correspondence should be addressed.
Sustainability 2021, 13(10), 5695; https://doi.org/10.3390/su13105695
Submission received: 25 April 2021 / Revised: 15 May 2021 / Accepted: 17 May 2021 / Published: 19 May 2021

Abstract

:
Smart microgrids (SMGs), as cyber–physical systems, are essential parts of smart grids. The SMGs’ cyber networks facilitate efficient system operation. However, cyber failures and interferences might adversely affect the SMGs. The available studies about SMGs have paid less attention to SMGs’ cyber–physical features compared to other subjects. Although a few current research works have studied the cyber impacts on SMGs’ reliability, there is a research gap about reliability evaluation simultaneously concerning all cyber failures and interferences under various cyber network topologies and renewable distributions scenarios. This article aims to fill such a gap by developing a new Monte Carlo simulation-based reliability assessment method considering cyber elements’ failures, data/information transmission errors, and routing errors under various cyber network topologies. Considering the microgrid control center (MGCC) faults in comparion to other failures and interferences is one of the major contributions of this study. The reliability evaluation of SMGs under various cyber network topologies, particularly based on an MGCC’s redundancy, highlights this research’s advantages. Moreover, studying the interactions of uncertainties for cyber systems and distributed generations (DGs) under various DG scenarios is another contribution. The proposed method is applied to a test system using actual historical data. The comparative test results illustrate the advantages of the proposed method.

1. Introduction

The microgrid (MG) concept has received a great deal of attention because of its contribution to emission mitigation and sustainable development [1,2,3]. The cyber system, including communication networks, information technologies, and smart monitoring/control systems, boosts the MGs’ reliability, efficiency, and technoeconomic aspects [4,5]. However, the cyber system impacts, such as other uncertainties, might influence smart grids and MGs’ reliability [6,7,8]. Although the impacts of the uncertainties in the output power of renewable distributed generations (DGs) on MGs’ reliability have been studied in the literature, such as in [9,10,11], less attention has been paid to the eventual cyber–power uncertainties and interdependencies of cyber–power MGs (CPMGs).
The Monte Carlo simulation (MCS) methods could help evaluate smart grids/MGs’ reliability considering cyber–power interdependencies and other stochastic behaviors [12]. The sequential MCS has been adopted to quantify the MGs’ reliability due to frequency control issues, while cyber failures have been of concern in [13]. In [14,15], the MCS-based smart grid’s reliability evaluation methods considering the impacts of direct and indirect cyber–power interdependencies have been reported, respectively. Wang et al. [16] evaluated the effects of data transmission errors, latency, cyber element defects, and routing errors on MG reliability using the MCS. Although the impacts of most essential parameters have been addressed in [16], the defects of the MG control center (MGCC) have not been considered. In addition, the CPMGs’ reliability and interaction of cyber and renewable DG uncertainties under various DG scenarios has not been studied in [16].
The computation time of MCS-based methods affects their effectiveness, particularly for reliability-oriented short-term operational decisions. Therefore, some research works have been devoted to developing non-MCS methods to speed up the smart grid/CPMG’s reliability assessment. Falahati et al. [17] reported a new probability table (P-Table)-based reliability assessment approach that considers direct cyber–power interdependencies, while other system uncertainties, such as stochastic behaviors of renewable DGs’ output power, have not been considered. The indirect cyber–power interdependencies due to malfunctions of monitoring and protection systems have been examined in [18]. Zhu et al. [19] presented an analytical method that uses complex network theory to investigate the effect of communication network interruptions and failures on smart grid reliability. The reliability of each communication device and packet transmission delay has been researched in [19]. In most non-MCS reliability evaluation methods for CPMGs, the renewable DGs uncertainties have not been researched due to their limitations compared to MCS-based ones. In a few available studies, such as [20], both the DGs and cyber–power uncertainties have been considered using non-MCS methods. Barani et al. [20] have studied the uncertainty of renewable DGs along with communication technologies and cyber networks in MGs’ reliability evaluation. Although cyber component failure impacts have been concerned in [20], various parts of networks and communication technologies, such as data transmission delay and data transfer errors, have not been considered.
In Table 1, a summary of the literature review in the area of smart grid and MGs’ reliability evaluation considering the cyber–physical challenges is presented. In light of the literature review, there is a research gap about developing a reliability evaluation method for CPMGs, which simultaneously concerns all cyber challenges, particularly the failures of MGCC. This study aims to respond to such a research gap by proposing a new MCS-based reliability evaluation method. Proposing a new method considering both uncertainties of the cyber system and renewable DGs is the major contribution of this research. Developing a new MCS-based reliability assessment method for CPMGs using the theory graph concepts based on cyber–physical interdependencies is another contribution of this study. Moreover, the CPMGs and the interactions of different cyber uncertainties with DGs’ uncertainties under various DG scenarios would be studied.
Comparing available MCS-based and non-MCS reliability assessment methods infers that the MCS-based ones could be more effective for precisely studying all uncertainties. Hence, the MCS has been selected in this research. However, the non-MCS methods that considers all cyber and physical uncertainties could be developed in future works.
The major contributions of this research are listed as follows:
  • Proposing a new MCS-based reliability evaluation of CPMGs that considers all cyber faults and interruptions, i.e., information transmission errors, routing errors, and delay of information channels;
  • Considering the MGCC faults’ impacts on CPMG’s reliability;
  • Simulating the uncertainties of the physical system of CPMG, e.g., stochastic behaviors of wind turbine (WT) and photovoltaic (PV)outputs;
  • Studying the CPMG’s reliability under different cyber network topologies, including cyber network topologies with the redundancies of the MGCC;
  • An analysis of the CPMG’s reliability under various DG scenarios;
  • Sensitivity analyses to gain insight into how the cyber failures and interruptions might affect the CPMG’s reliability.
The proposed method is compared to available ones such as in [16], which has not addressed the MGCC faults. The test results illustrate the advantages of the proposed method. In addition, the proposed method is studied under different DG scenarios, including PV and WT DGs. The sensitivity analyses are performed to obtain insight into how the changes in physical and cyber characteristics might affect the CPMGs’ reliability.
The organization of the rest of this paper is as follows: Section 2 presents the CPMG’s control/energy management structure and different cyber–power interdependencies on system reliability, Section 3 introduces the proposed reliability evaluation method and reliability modeling of CPMGs’ subsystems, Section 4 presents the simulation results and discussions are given, and, finally, the conclusion is reported in Section 5.

2. CPMG’s Architecture

In Figure 1, the architecture of the understudy CPMGs, including cyber and physical subsystems, is shown [16,20]. The subsystems of CPMGs could be categorized into two separate general networks: physical and cyber networks, as shown in Figure 1b. Moreover, the cyber network could be divided into different layers, e.g., interface, communication, and decision layers. The different layers of the CPMGs have been depicted in Figure 1c.
The CPMGs’ physical/power network consists of renewable and nonrenewable generation units such as WT, PV, microturbine (MT), energy storage system (ESS), power bus, converters, loads, etc. [23,24]. The cyber part consists of data collectors, microgrid control centers (MGCCs), controllers, data transitions, status sensors, determination devices, etc.
In this paper, the central control mode of the CPMG has been considered. MGCC makes dissension for the MG’s stability in the centralized control mode by collecting data from control devices. Accordingly, the MGCC is the most important subsystem of the CPMG, and its eventual failures might affect the CPMG dramatically. The centralized control system of the CPMG includes the MGCC and control units of sources and loads (microunit control (MC) and load control (LC)).
The MGCC must control the power balance between the supply side and demand side at each moment. In addition, the MGCC is in charge of frequency and voltage stability. The MCs and LCs are responsible for collecting DGs and loads information such as output power, voltage, and frequency, and sending these data to the MGCC. The complete MG control process could be described as follows [16]:
  • The gathering of DGs and loads information by the MCs and LCs, respectively;
  • Transmitting the information through the information channel connecting the MGCC, MCs, and LCs;
  • Checking of the power balance condition and other operation aspects by the MGCC;
  • Adopting orders based on information received, such as increasing power generation or decreasing power in the supply side, and load management strategies on the demand side;
  • Transmitting the commands generated by the MGCC using the information channel between the MGCC, MCs, and LCs; and
  • Executing the MGCCs’ generated commands by local controllers.
In CPMGs, in addition to physical failures and interruptions, the cyber system might affect the system’s reliability [25]. In this paper, the following cyber–power interdependencies are considered:
  • Failure of the cyber system’s elements: The appropriate and stable operation of CPMGs requires available power and information channels. The failures in cyber layers, e.g., in the MGCC, MCs, and LCs result in energy not being supplied, similar to failures in power elements [26,27].
  • Information transmission faults: It is essential to receive the correct information from the sensors and control units for the MGCC to make correct decisions [28]. Hence, the information transmission faults might lead to incorrect decisions. Consequently, the appropriate operation of the CPMG and its stability might be threatened.
  • Routing faults: The CPMG equipment’s real-time operation needs to receive the correct information package. Therefore, routing faults in the sending or receiving of the information package might affect the instantaneous function of the control and cyber systems [29]. Hence, the CPMG is influenced by routing faults.
  • Delay in data transfer: The fast performance of cyber elements and information channels is crucial to meet power balance conditions in CPMGs. Therefore, a delay in data transfer could cause a lack of timely communication between the control units, resulting in a loss of power balance [30].
In Table 2, the uncertainties in both cyber and power networks of CPMGs have been listed. Comprehensive consideration of all cyber and power uncertainties is one of the major contributions of this research.
As seen in Table 2, physical/power and cyber subsystem failures are major sources of a CPMG’s uncertainties. The time to failures (TTF) and time to repairs (TTR) of a CPMG’s subsystems are stochastic parameters, and their probabilistic behaviors should be concerned in reliability evaluations [31].
Table 2. Uncertainties of the CPMGs.
CPMG LayersSub-systemStochastic ParameterUncertainties’ SourceProbability Distribution
Physical networkWTWT output powerWind speed variabilityWeibull [15]
TTFRandom failureExponential [16]
TTR
PVPV output powerSolar irradiation variabilityBeta [15]
TTFRandom failureExponential [13]
TTR
MTTTFRandom failureExponential [16]
TTR
BusTTFRandom failureExponential [16]
TTR
ESSTTFRandom failureExponential [16]
TTR
Demand-sideLoad valueConsumption variabilityNormal [32]
Cyber networkMGCCTTFRandom failureExponential [13]
TTR
Information channelTTFRandom failureExponential [16]
TTR
SwitchTTFRandom failureExponential [16]
TTR
Information terminalTTFRandom failureExponential [16]
TTR
Information transmission delayDelay time in information transmission prosesRandom amountExponential [33,34]
Information transmissionPayload errorRandom faultGaussian white noise (GWN) [35,36]
Header errorRandom faultGWN [35,36]
Environmental parameters, e.g., wind speed and solar irradiance, influence renewable DGs’ output power. Hence, the uncertainties of environmental parameters should be considered in the physical/power network.
Moreover, the uncertainties and faults of information transmission delay and information transmission faults (payload errors and hear errors) are concerned in this article. The probability distributions of discussed stochastic parameters have also been presented in Table 2.

3. Modeling of the Proposed Reliability Evaluation of CPMGs

3.1. Cyber–Physical Interdependencies Due to Cyber Failures

The state of the CPMG should be determined to evaluate the system’s reliability, such as in [17,37]. The CPMG’s state, including both cyber and power elements, could be modeled using the following equation:
M S i = [ M E 1 ( t ) , , M E j ( t ) , , M E N P + N C ( t ) ] = [ M E 1 ( t ) , , M E k ( t ) , , M E N P ( t ) , , M E N P + l ( t ) , , M E N P + N C ( t ) ]   i = 1 : N M S , j = 1 : N P + N C , k = 1 : N P , l = 1 : N C
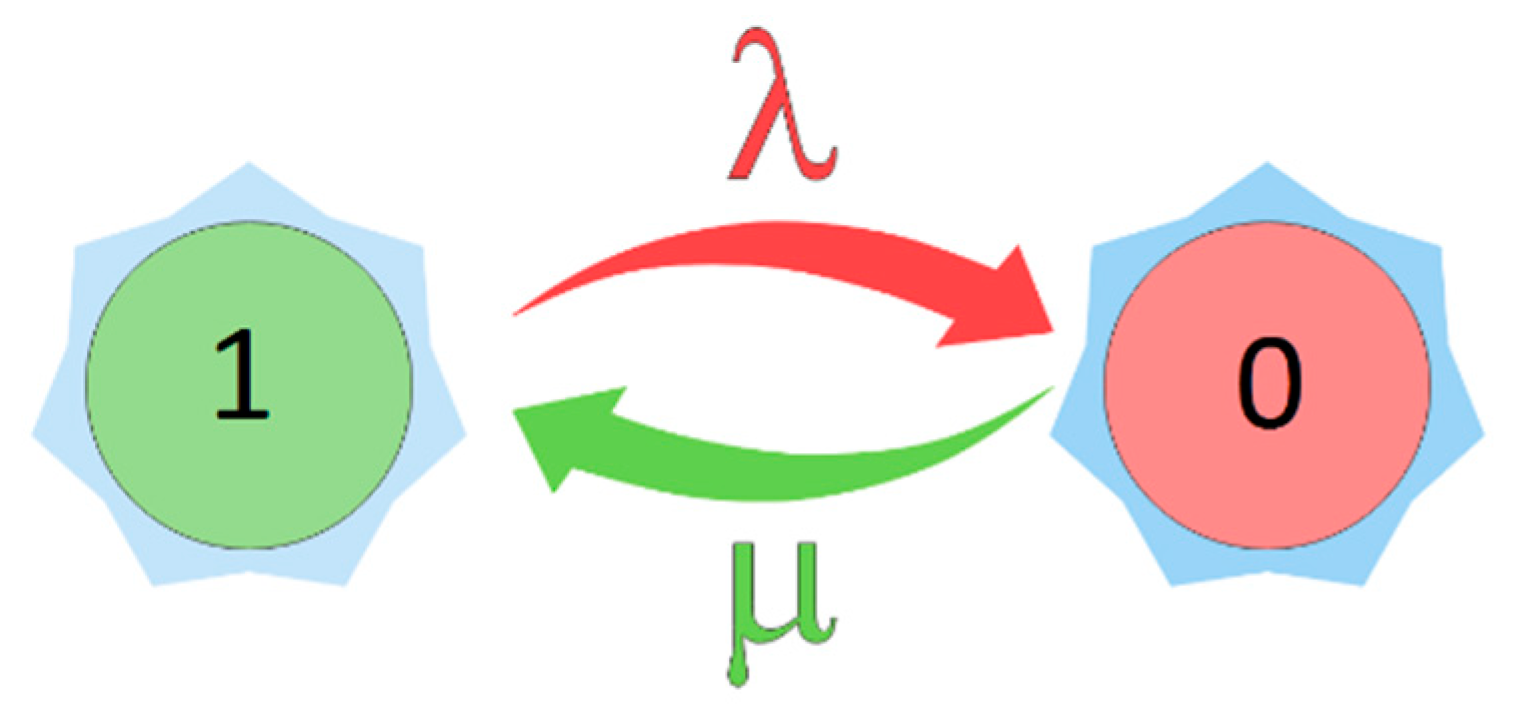
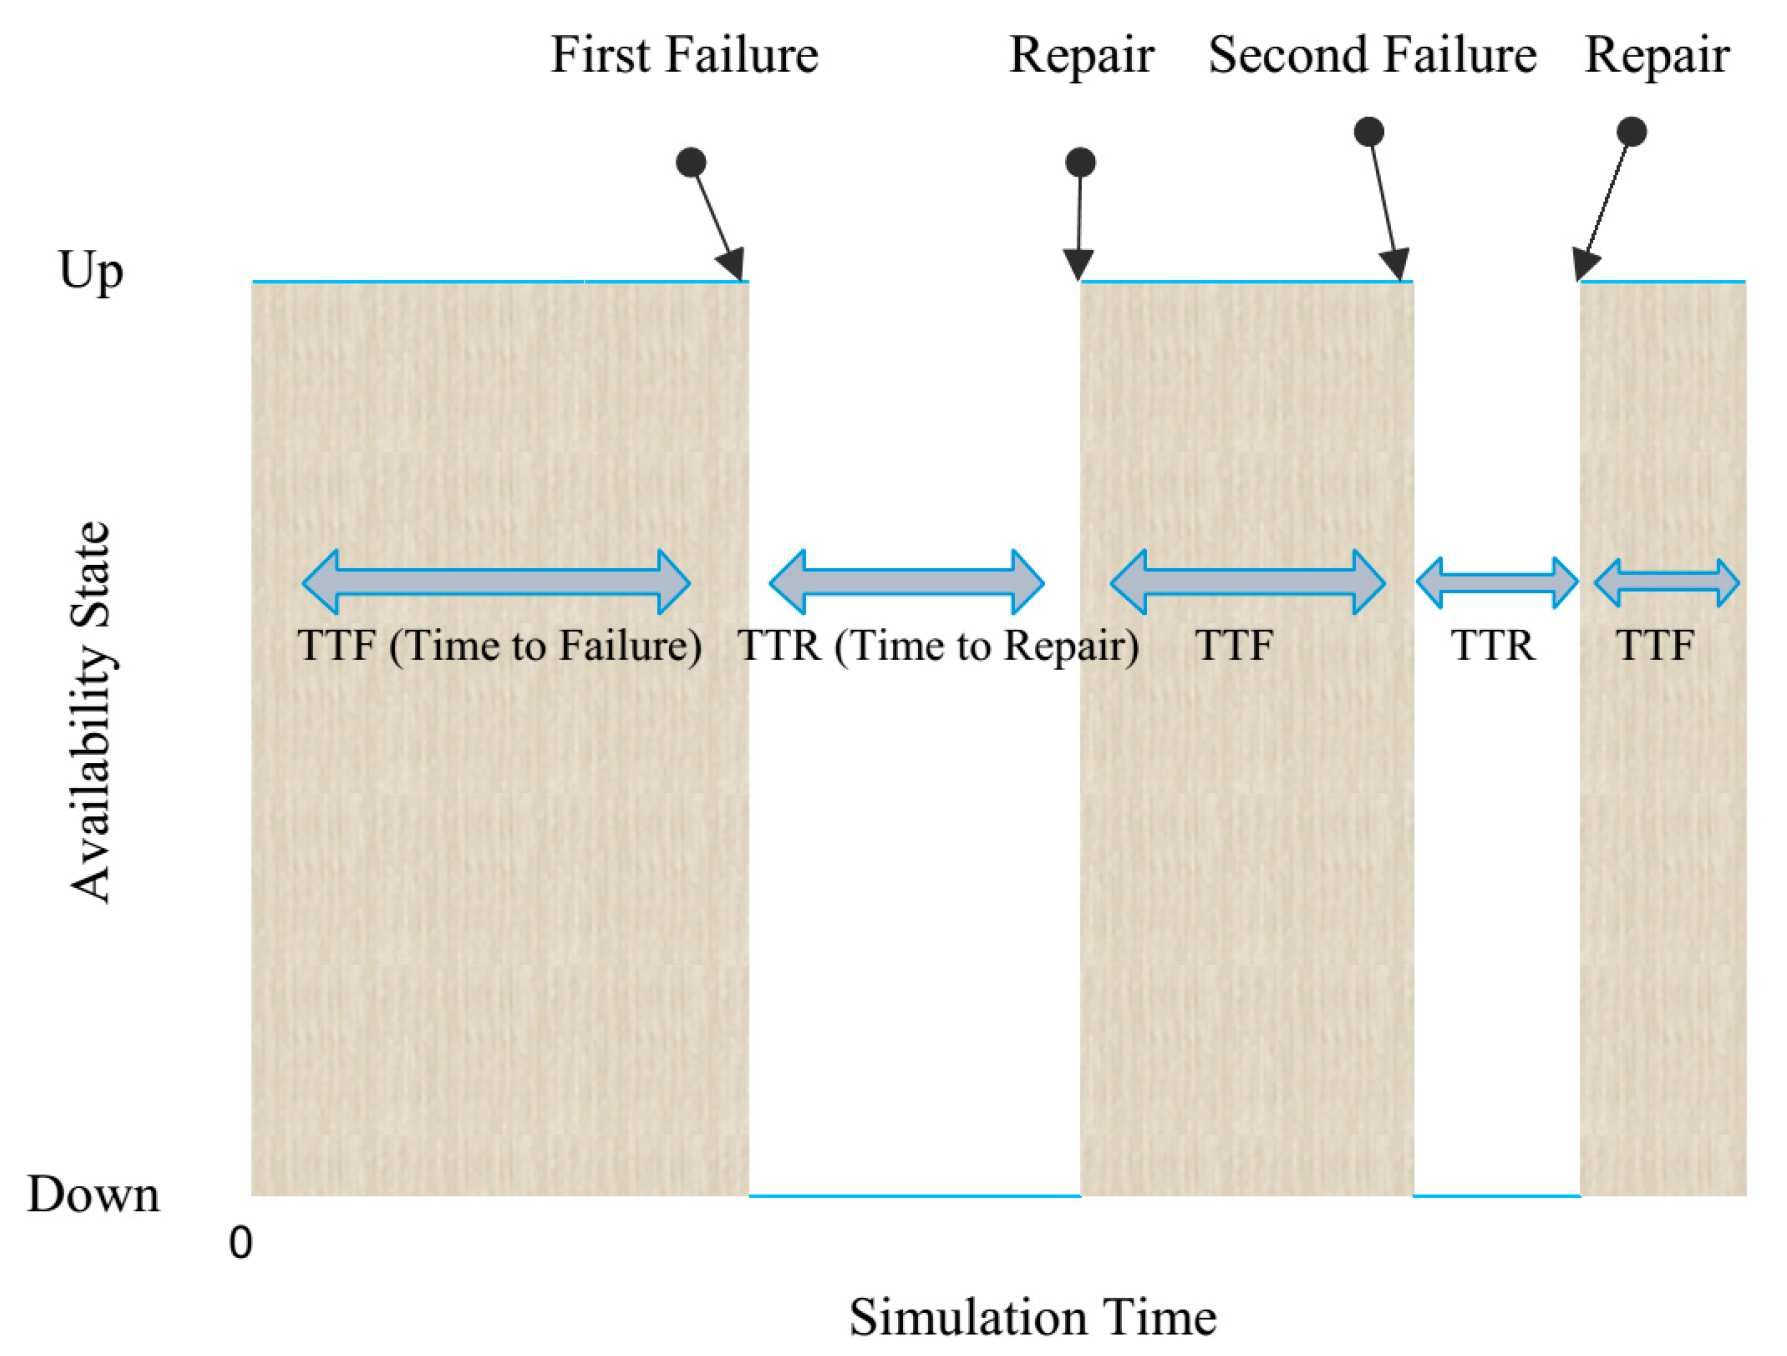
where the CPMG’s state at each time step ( M S i ( t ) ) is distinguished based on the state of its physical elements M E k ( t ) and cyber elements M S l ( t ) . The two-state reliability model is one of the most common models for modeling the CPMGs, as depicted in Figure 2 [38]. The binary variables represent the CPMG elements’ states. The zero value of each element state represents that the corresponding element is unavailable. Otherwise, the discussed element is in service [39]. The availability state of any subsystem could be represented using the time to failure (TTF) and time to repair (TTR), as shown in Figure 3 [40,41]. In this paper, the two-state reliability model has been used for both the cyber and physical networks’ elements. Hence, the failures in cyber and physical networks could be determined using the two-state reliability model. In Figure 2, λ and μ denote the failure rate and repair rate, respectively. It means that the system is transited from the Up sate to the Down state based on the failure rate ( λ ) and similarly the system transition from the Down state to the Up state occurs according to the repair rate ( μ ).
In this paper, the exponential distribution has been used to simulate the Up and Down states [43]. The availability and unavailability probabilities have been mathematically expressed in (2) and (3).
A j ( t ) = 1 exp [ λ j × t ]   j = 1 : N P + N C
U j ( t ) = 1 exp [ μ j × t ]   j = 1 : N P + N C
To simulate the stochastic time-series of CPMG elements’ availability ( M S i ( t ) | t = 1 : 8760 × T ) , the TTFs and TTRs should be generated using the MCS, as shown in (4) and (5). As seen, the mean time to failure (MTTF), mean time to repair (MTTR), and random variables uniformly distributed in (0 1) are utilized to generate the TTF and TTR.
T T F j = M T T F j × ln ( x )
T T R j = M T T R j × ln ( x )
The cyber–physical interdependencies matrix (CPIM) at each time step could be defined using (6). As shown, the CPIM consists of power interconnections, cyber interconnections, and cyber–power interdependencies. In this paper, this matrix is used to create the graph of the CPMG.
C P I M ( t ) = [ M E 1 ( t ) P P 1 , k P P 1 , N p | P C 1 , 1 P C 1 , l P C 1 , N C | P P k , 1 M E k ( t ) P P k , N p | P C k , 1 P C k , l P C k , N C | P P N p , 1 P P N p , k M E N p ( t ) | P C N p , 1 P C N p , l P C N p , N C | C P 1 , 1 C P 1 , k C P 1 , N p | M E N p + 1 ( t ) C C 1 , l C C 1 , N C | C P l , 1 C P l , k C P l , N p | C C l , 1 M E N p + l ( t ) C C l , N C | C P N C , 1 C P N C , k C P N C , N p | C C N C , 1 C C N C , l M E N p + N C ( t ) ]
Mapping the cyber failures to the physical/power network is essential for the reliability assessment of CPMGs. Hence, in the proposed method, the cyber–physical interdependencies are first concerned with mapping the unavailability of interconnected cyber elements to the physical layer by (7). If there are some cyber–power links between cyber elements and a physical element, all interconnected cyber elements’ appropriate performance and availability are necessary. The physical element state should be changed due to any failure in interconnected cyber elements.
Afterward, the CPIM should be updated due to failures in power and cyber elements because the system graph and its interconnections are affected by these failures. In (8), updating the interconnections of the CPMGs is shown.
C P I M ( t ) C P I M ( t ) : M E χ ( t ) = M E χ ( t ) × l = N P + 1 N P + N C ( M E l ( t ) | l C P N P + 1 , χ = 1 )   χ = 1 : N P
C P I M ( t ) C P I M ( t ) : { P P k , χ = M E k ( t ) × P P k , β k = 1 : N P , χ = 1 : N P P P χ , k = M E k ( t ) × P P χ , k k = 1 : N P , χ = 1 : N P P C k , ξ = M E k ( t ) × P C k , ξ k = 1 : N P , ξ = 1 : N C C C l , ξ = M E l ( t ) × C C l , ξ l = 1 : N C , ξ = 1 : N C C C ξ , l = M E l ( t ) × C C ξ , l l = 1 : N C , ξ = 1 : N C C P l , χ = M E l ( t ) × C P l , χ k = 1 : N P , l = 1 : N C
Finally, the power channels and information channels should be determined using (9)–(11). The shortest path function (SPF) based on theory graph concepts has been utilized to distinguish power and information channels. If there is a path between the power sending terminal (PST) and the power receiving terminal (PRT), the summation of the shortest path would not be zero, and it means that there is a power channel (Pch), as shown in (10). Otherwise, the power channel index would be assigned to zero, and no power channel exists between discussed terminals. Similarly, the state of the information channel (Ich) between the cyber sending terminal (CST) and the cyber receiving terminal (CRT) is determined using (11).
G r a p h ( t ) = g r a p h ( C P I M ( t ) )
P c h ( P S T q , P R T r , t ) = { 1 I f S P F ( G r a p h ( t ) , P S T q , P R T r ) 1 0 I f S P F ( G r a p h ( t ) , P S T q , P R T r ) = 0
I c h ( C S T y , C R T z , t ) = { 1 I f S P F ( G r a p h ( t ) , C S T y , C R T z ) 1 0 I f S P F ( G r a p h ( t ) , C S T y , C R T z ) = 0

3.2. Information Transmission Errors and Delays

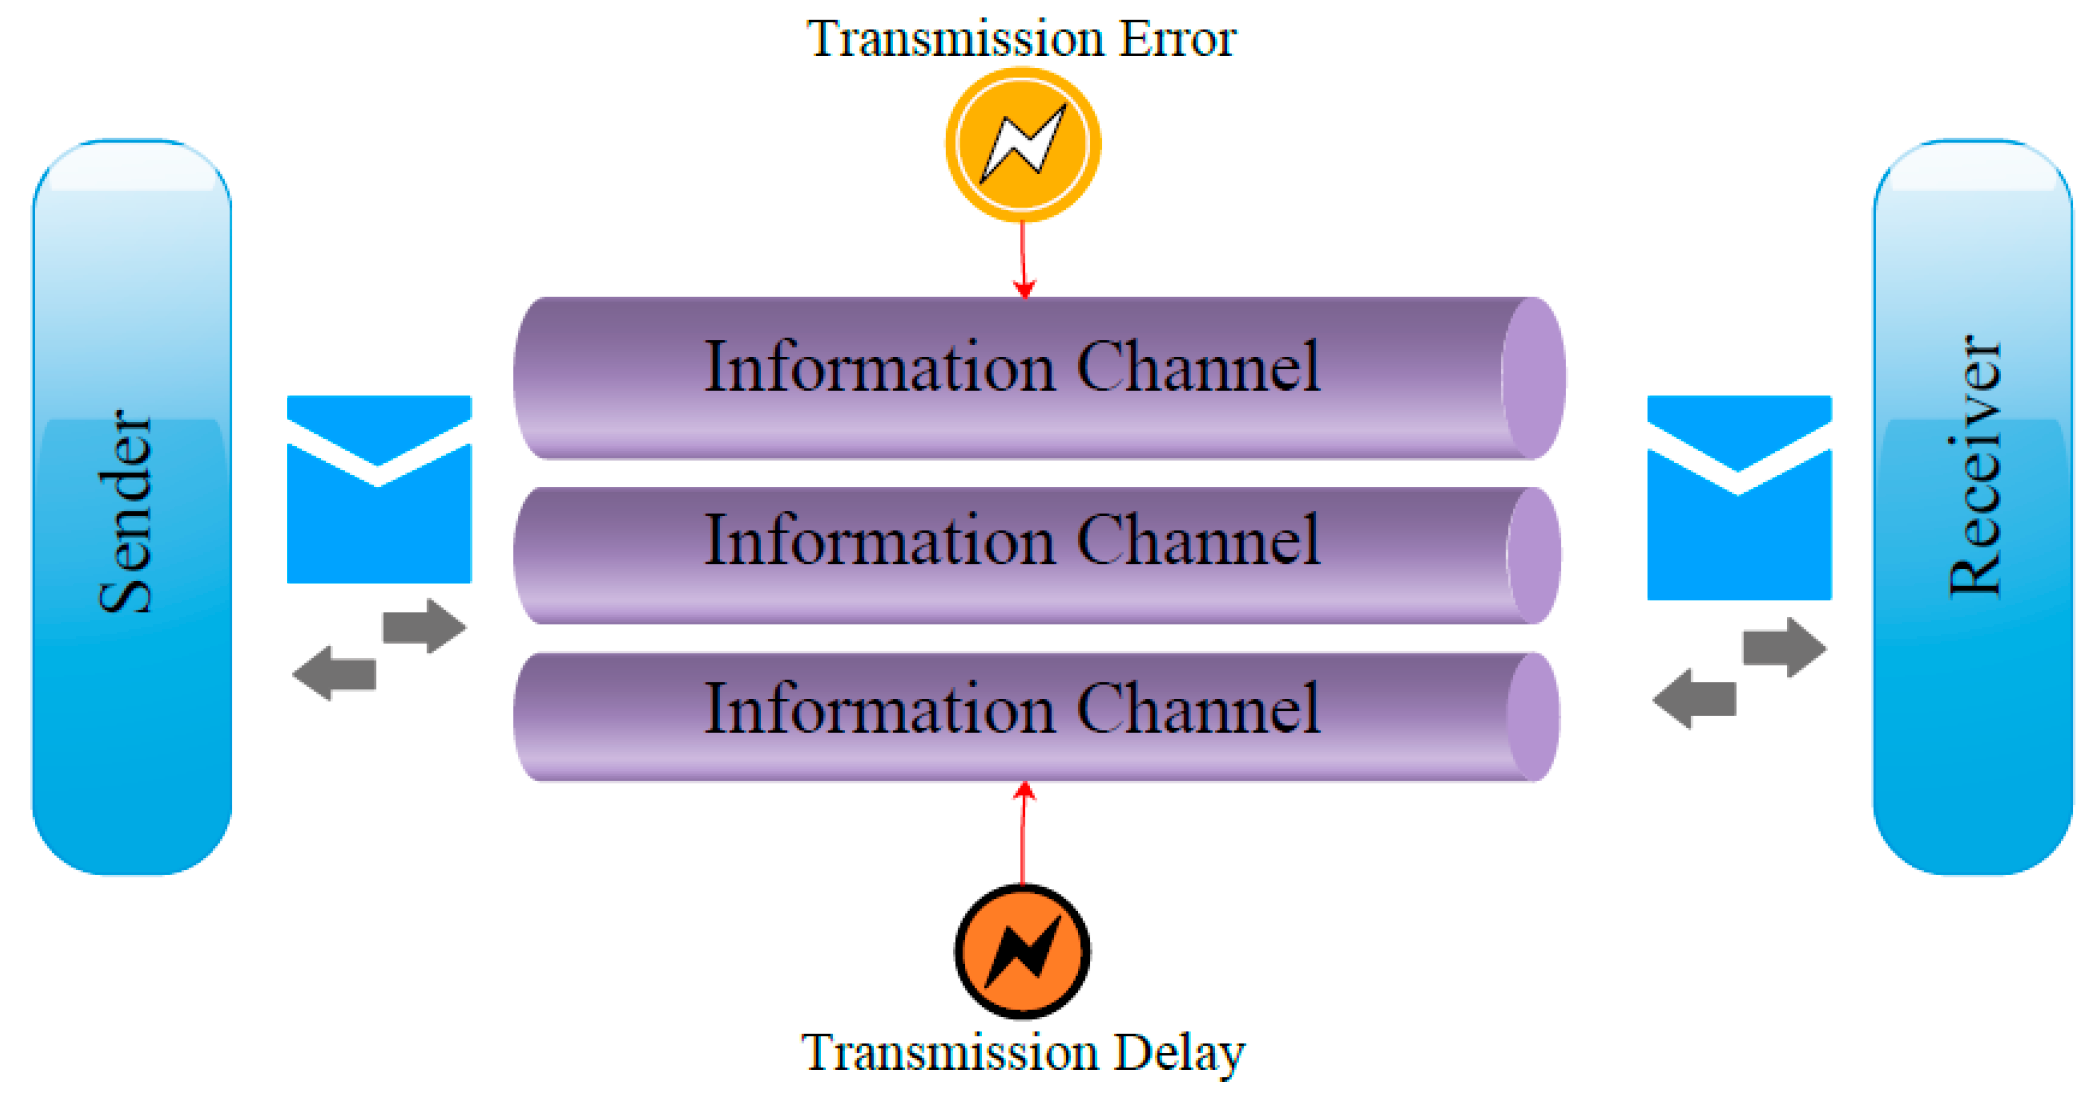
To assess the reliability of CPMGs, it is essential to concern the routing errors, data transmission delays, and dynamic transmission errors, as shown in Figure 4.
The ideal information channel could be presented using (12).
P A C R e c e i v e [ P A C R e c e i v e d f ( t ) , D E S R e c e i v e d f ] = P A C s e n t [ P A C S e n t f ( t ) , D E S S e n t f ]   f = 1 : N I c h
The transmission with delay in an information channel should be simulated according to (13). The delay might affect the information transmission if it exceeds the maximum allowed delay margin.
P A C R e c e i v e [ P A C R e c e i v e d f ( t ) , D E S R e c e i v e d f ] = P A C s e n t [ P A C S e n t f ( t + E D e l a y f ( t ) ) , D E S S e n t f ]   f = 1 : N I c h
The time delay in information transmission is probabilistic. The exponential probability distribution is one of the most well-known distributions, and has been used for simulating the statistical behaviors of time delays. The time delay at each time step could be simulated using the MCS based on (14). As demonstrated in (14), a random variable uniformly distributed in (0 1) is generated, and the mean value of time delays based on measured actual historical data is used to simulate the stochastic time delays by exponential probability distribution.
E D e l a y f ( t ) = ¯ E ¯ D e l a y f × ln ( x )
The data packet from the LC/MC to the MGCC, such as other data packets in other applications, consists of payload and header [44,45]. The first part of the data packet (payload) contains commands and information that must be transmitted, such as current, voltage, frequency, and so on. The second part (header) contains the destination address. For instance, in a typical data packet ( P A C s e n t [ P A C s e n d f ( t ) , D E S s e n t f ] ), the transmission destination and the data contents are represented by P A C s e n d f ( t ) and D E S s e n t f , respectively.
The information transmission without any errors in payloads and headers of information channels is shown in (13). However, the errors in payloads ( E P a y l o a d f ( t ) ) and headers ( E H e a d e r f ( t ) ) should be addressed to precisely calculate the reliability of CPMGs. The Gaussian distribution of white noise has been reported to study the statistical behaviors of payload and header errors in transmission information. The information transmission considering time delay, payload errors, and header errors should be simulated by the MCS. The white noise and a random variable uniformly distributed in (0 1) should be generated to simulate the payload and header errors, as mathematically expressed in (15) and (16) [16].
P A C R e c e i v e d f ( t ) = I c h × ( P A C S e n t f ( t + E D e l a y f ( t ) ) Int [ u Pr E P a y l o a d f ] × ( E P a y l o a d f ( t ) ) )
D E S R e c e i v e d f = D E S s e n t f Int [ u Pr E H e a d e r f ] × ( E H e a d e r f ( t ) )

3.3. Stochastic Simulation of Renewable-Based DGs

The wind speed and technical characteristics influence the output energy of WTs. Since the wind speed is an uncertain environmental parameter, its stochastic behavior should be simulated using the MCS. The Weibull distribution has been selected in this paper to model the statistical behaviors of wind speed, which is one of the most common distributions for simulating the wind speed’s stochastic nature [46]. As expressed in (17), the wind speed is simulated by the Weibull cumulative density function (CDF) inverse and a random variable in the proposed MCS-based method. Moreover, the WT output power is computed by (18).
v = F 1 ( x | c , k ) = c . ln ( 1 x ) 1 k = c . ln ( x ) 1 k
P W T ( v ( t ) , t ) = { 0                                                                                                             0 v ( t ) < v c i               P R a t e d × ( v ( t ) V c i ) ( V r a t e d V c i )                                                 v c i v ( t ) < v r a t e d P R a t e d                                                                                             v r a t e d v ( t ) v c o 0                                                                                                             v c o < v ( t )
The output power of PV units depends on the amount of solar radiation and the solar clearness index (SCI). Since the distribution of SCI mainly follows the Beta probability distribution [47,48], the MCS simulates the SCI by the Beta CDF inverse based on historical data. The Beta PDF and simulating the SCI using the MCS have been presented in (19) and (20) [42].
f ( S C I | α , β ) = Γ ( α + β ) Γ ( α ) × Γ ( β ) × S C I α 1 × ( 1 S C I ) β 1
S C I = F 1 ( u | α , β )
Finally, the output power of PV units should be distinguished using (21)–(24) based on environmental parameters and technical characteristics [48,49].
T c ( t ) = T a ( t ) + ( G ( t ) × ( N O T 20 ) 800 )
I ( t ) = S C I ( t ) × ( I s c + ( T c ( t ) T a ( t ) ) × K I )
V ( t ) = V o c K V × T c ( t )
P P V ( t ) = N P V × I ( t ) × V ( t ) × η

3.4. Stochastic Simulation of Loads

In this paper, the uncertainties of loads have been concerned. The normal probability distribution is one of the most common probability distributions to model the uncertainties of load values. The probabilistic load values are simulated using the normal CDF inverse by the MCS. Modeling the uncertainties of the CPMG’s load is one of this study’s contributions, which has not received a great deal of attention in current studies.

3.5. Reliability Calculations

The power balance condition should be met as depicted in (25). The adequacy assessment should be performed to check the values of the supply side, demand side, and their difference according to (26). Consequently, the load curtailment and at-risk state at each time step could be distinguished by (27) and (28) [50].
g = 1 N D G P g ( t ) P L o a d s ( t ) + P L o s s ( t )
Δ L G ( t ) = P L o a d s ( t ) + P L o s s ( t ) g = 1 N D G P g ( t )
L C ( t ) = M a x { 0 , Δ L G ( t ) }
A t r i s k ( t ) = { 0 I f   Δ L G ( t ) 0 1 I f   Δ L G ( t ) > 0
The reliability indices are determined using the load curtailment of all time steps, according to (29)–(31).
L O L P = t = 1 8760 × T A t r i s k ( t ) 8760 × T
E E N S = t = 1 8760 × T ( T × L C ( t ) )
S A I D I = t = 1 8760 × T ( T × L C ( t ) ) P ¯ L o a d
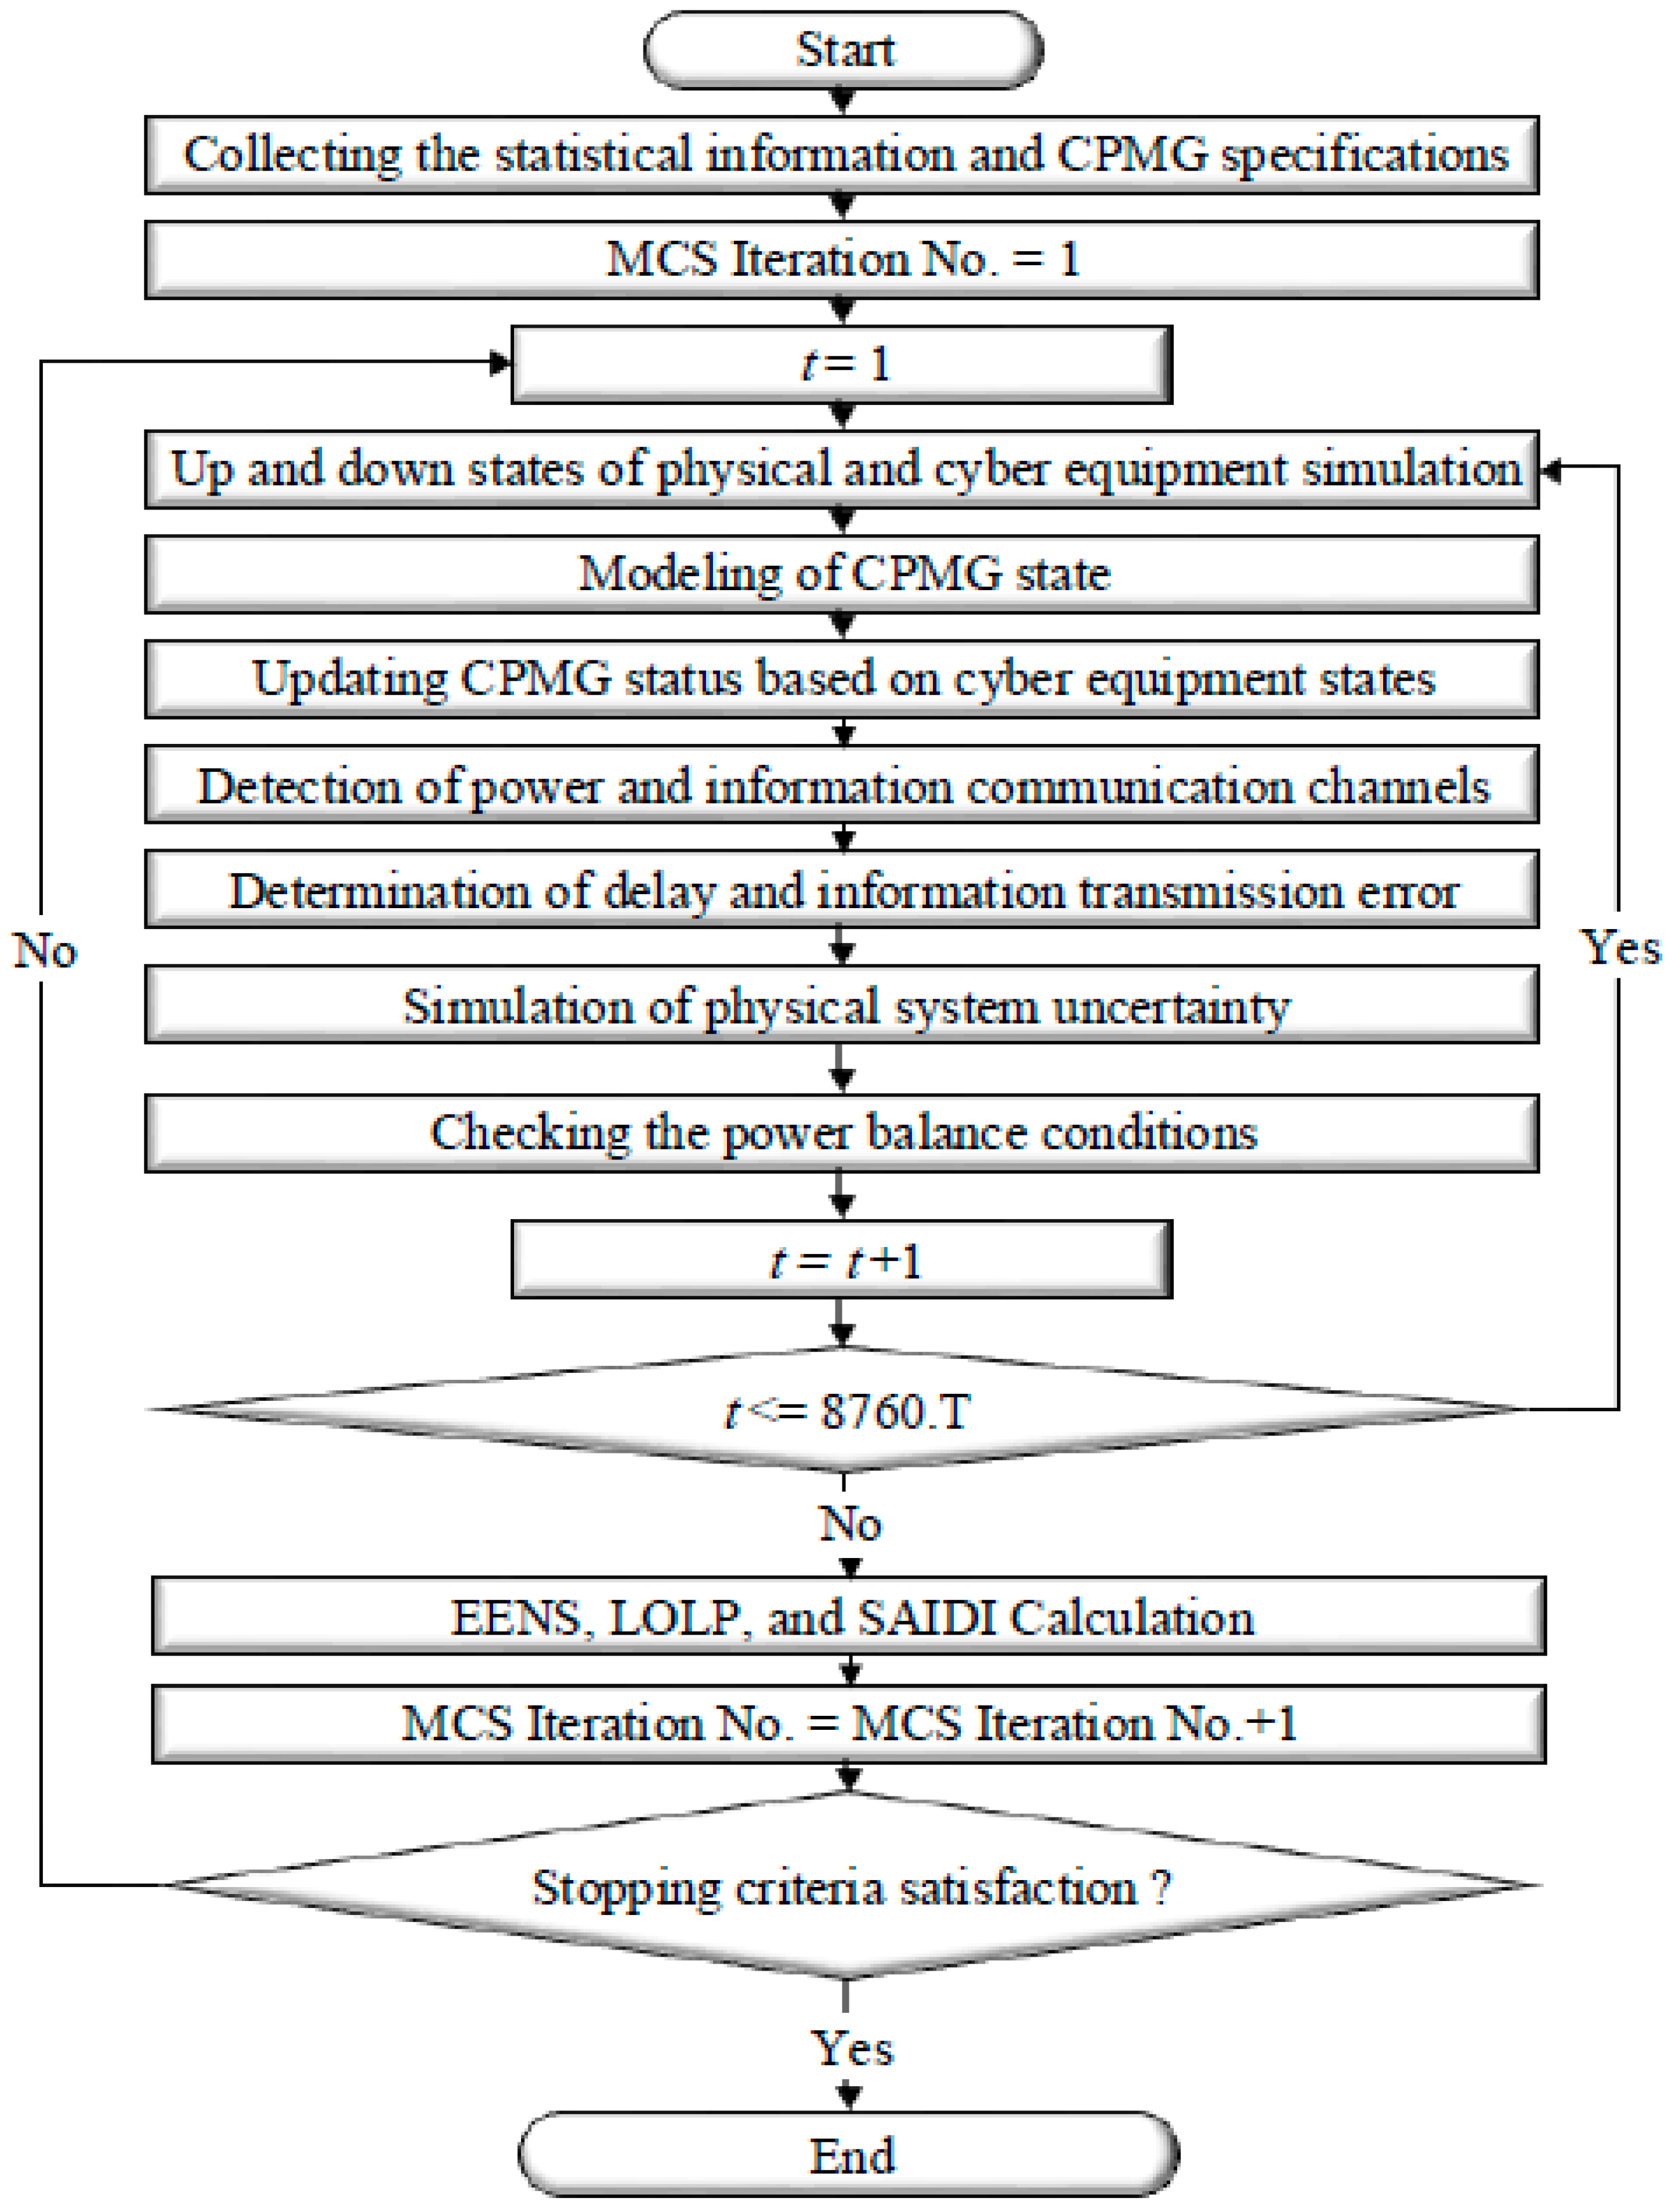
The flowchart of the proposed reliability assessment of CPMGs considering cyber–physical interdependencies, cyber failures, routing errors, time delays in information transmission, and other physical uncertainties, such as the uncertainties of renewable power output, is shown in Figure 5. In this paper, satisfying the number of MCS iterations and the accuracy level have been defined for the stopping criteria of the proposed MCS-based reliability evaluation method.

4. Test Results and Discussions

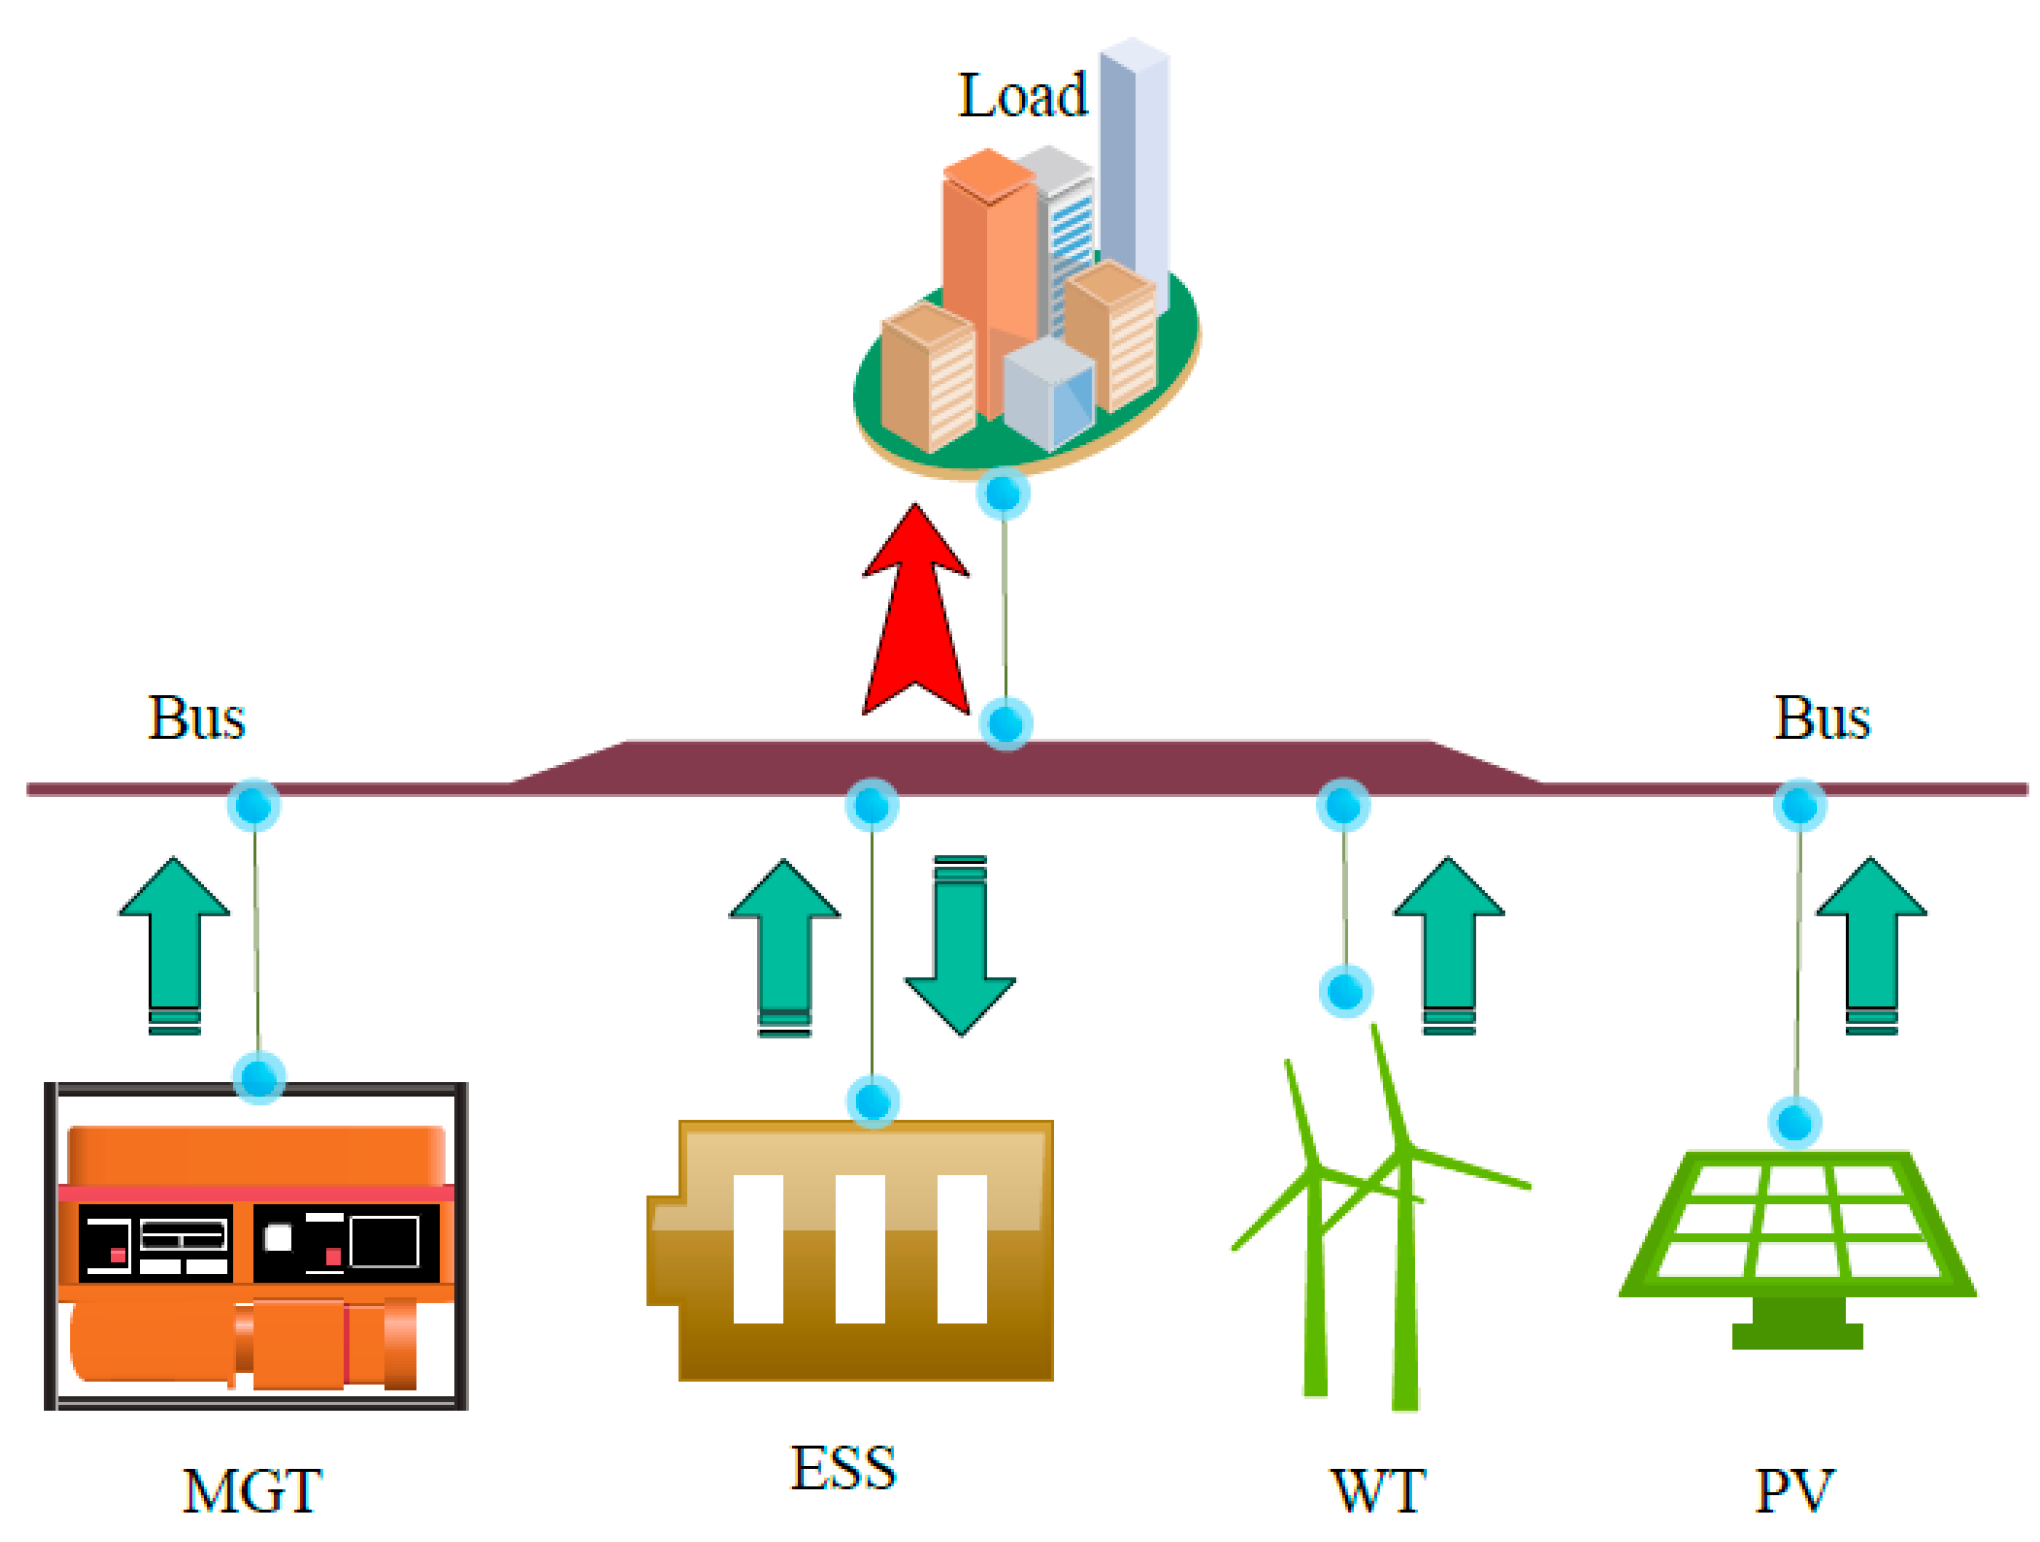
In this paper, the physical structure of the understudy CPMG is shown in Figure 6 [16].
The selected CPMG has been equipped with a 500 kWh ESS. The maximum charging and discharging rate of the ESS have been assumed to be 10 kW. The MGT’s maximum and minimum allowed output power and operating range are 100 kW and 10 kW, respectively.
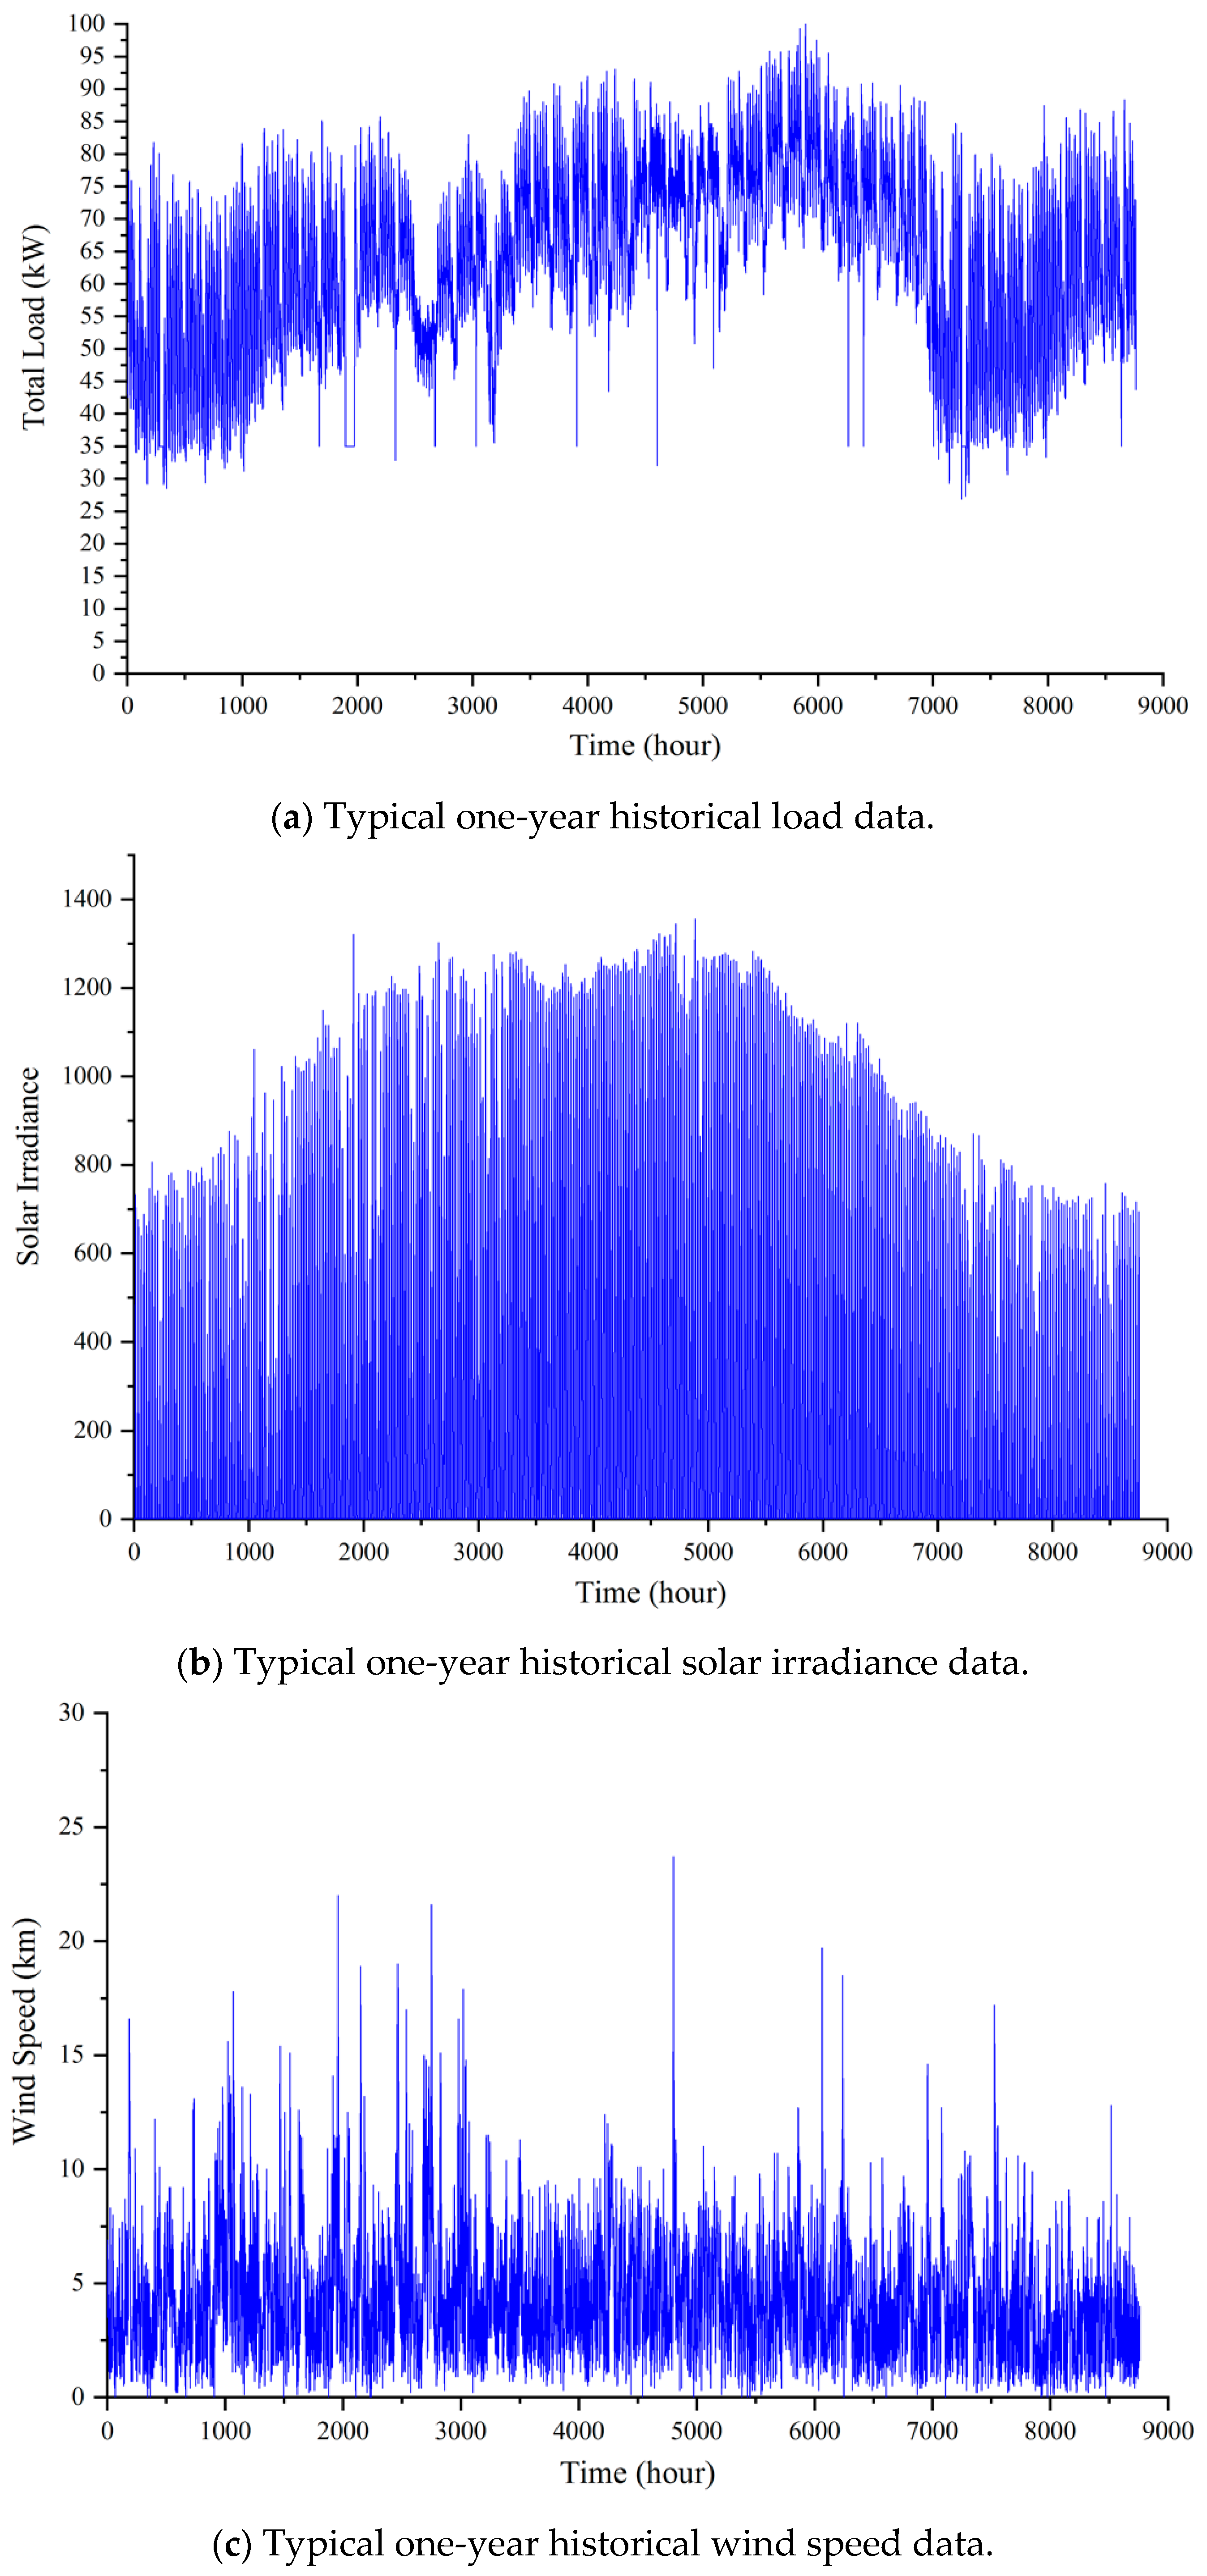
The stochastic behaviors of load value at each time step have been simulated based on 15 min load values for three years, measured by the Kashan Electrical Distribution Company. The Sanjesh Afzar Asia (a manufacturer in Tehran, Iran) measurement instruments have been used for collecting the historical data of load values. The historical wind speed and SCI data used in this study are based on actual measurements in a city located in the center of Iran [51]. In Figure 7, typical one-year historical data of load, solar irradiance, and wind speed have been shown.
The reliability specifications of the understudy CPMG’s elements are given in Table 3 [36,52,53,54] and Table 4 [13,16,55,56]. Also, in Table 5, the information transmission errors based on data of [36,52,53,54] has been demonstrated.
The selected test system is studied under the following scenarios:
  • Scenario 1 (WT-100): In the first scenario, only a WT with a maximum capacity of 50 kW is considered as the renewable DG of the CPMG.
  • Scenario 2 (PV-100): In the second scenario, only a PV with a maximum capacity of 50 kW is considered as the renewable DG of the CPMG.
  • Scenario 3 (Wt-50/PV-50): In the third scenario, a PV with a maximum capacity of 25 kW and a WT with a maximum capacity of 25 kW are considered as the hybrid renewable DGs of the CPMG.
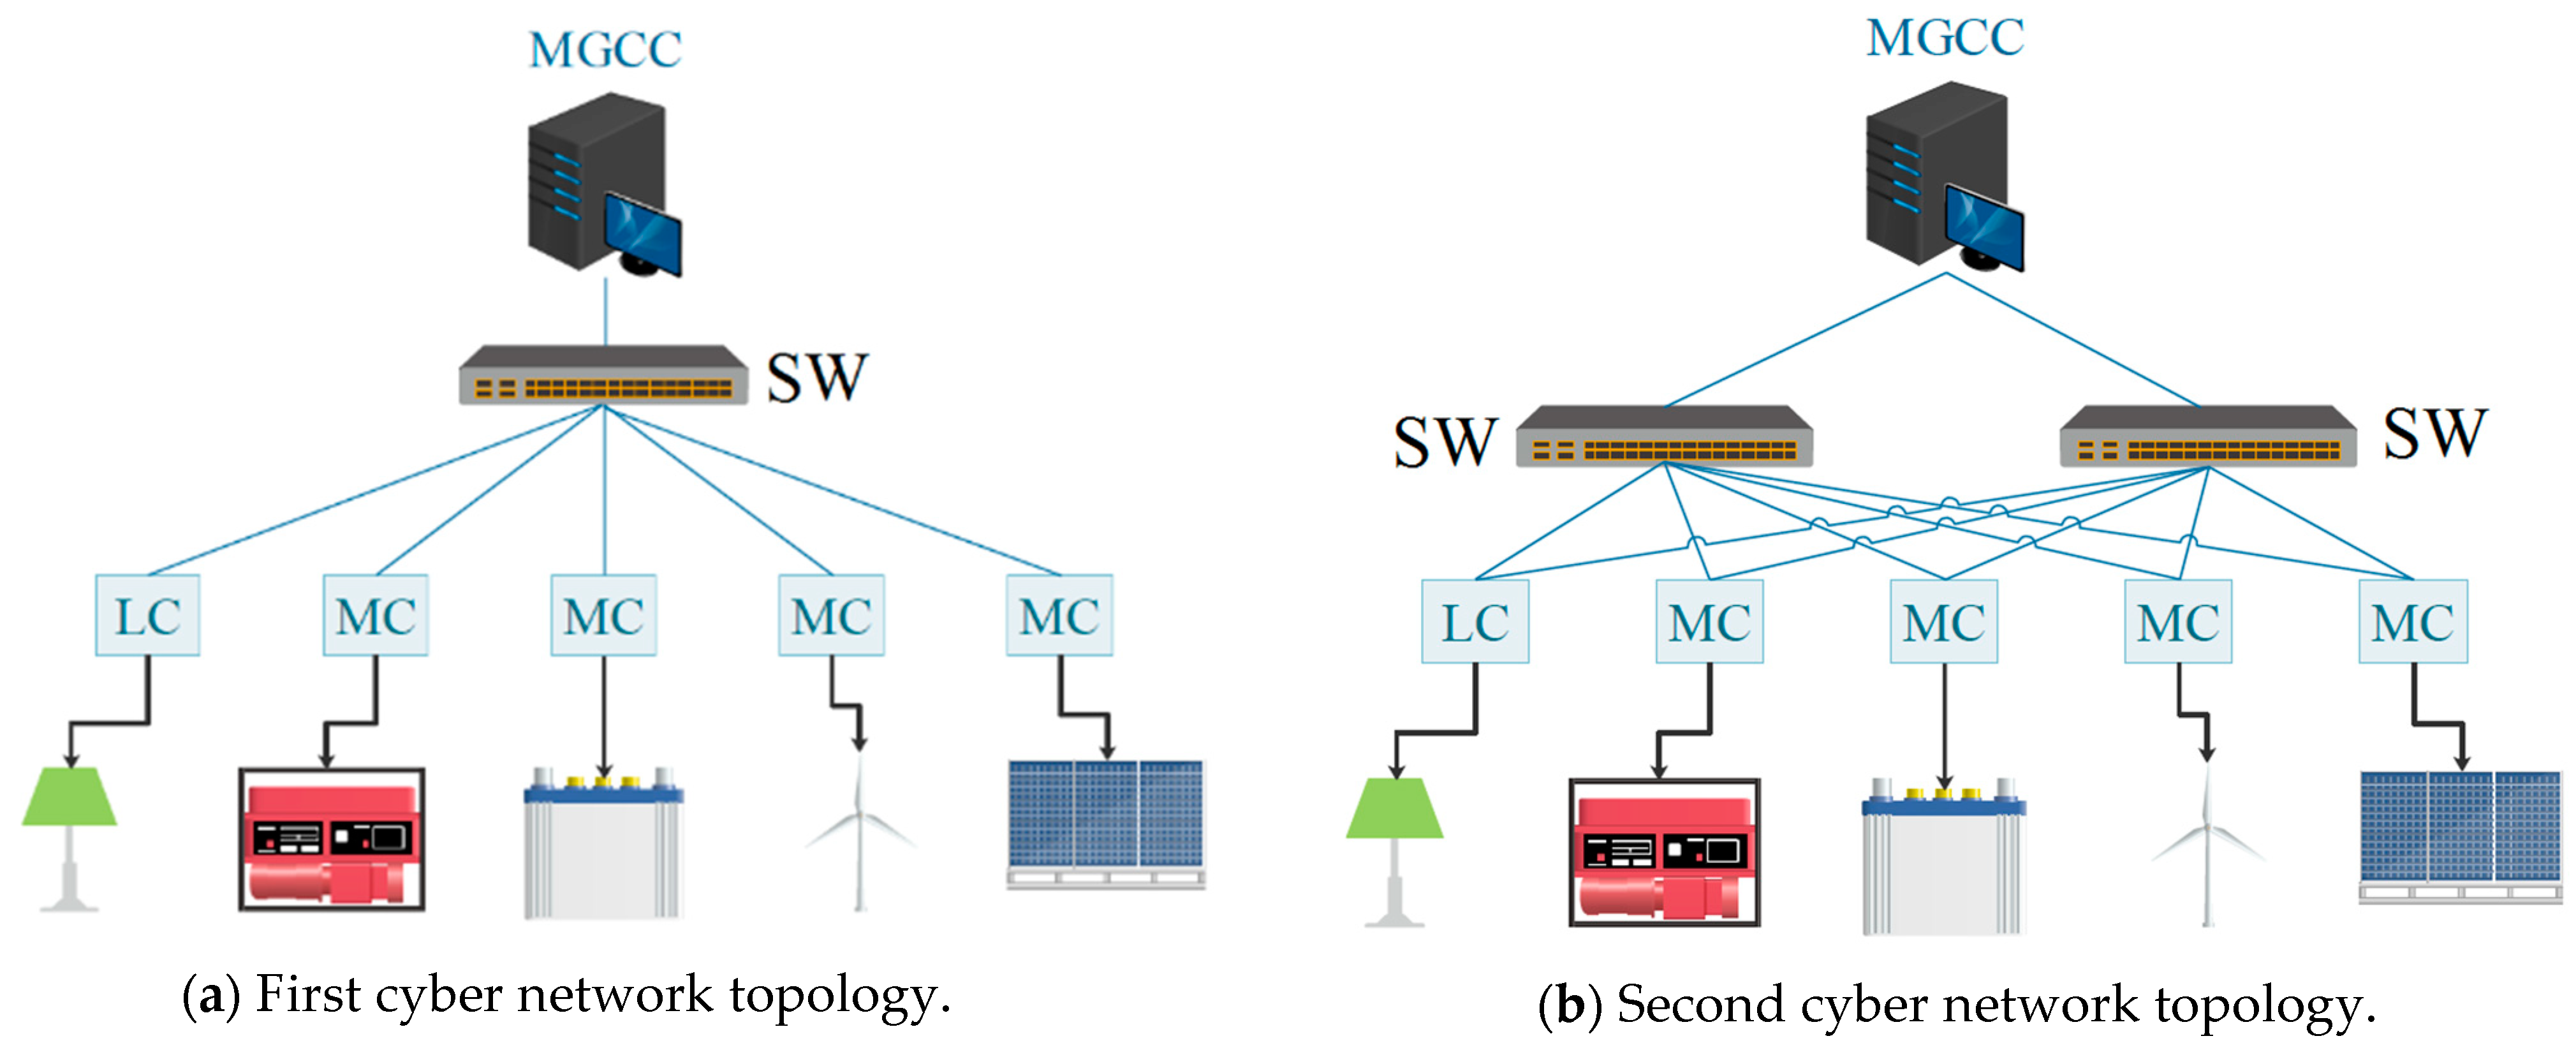
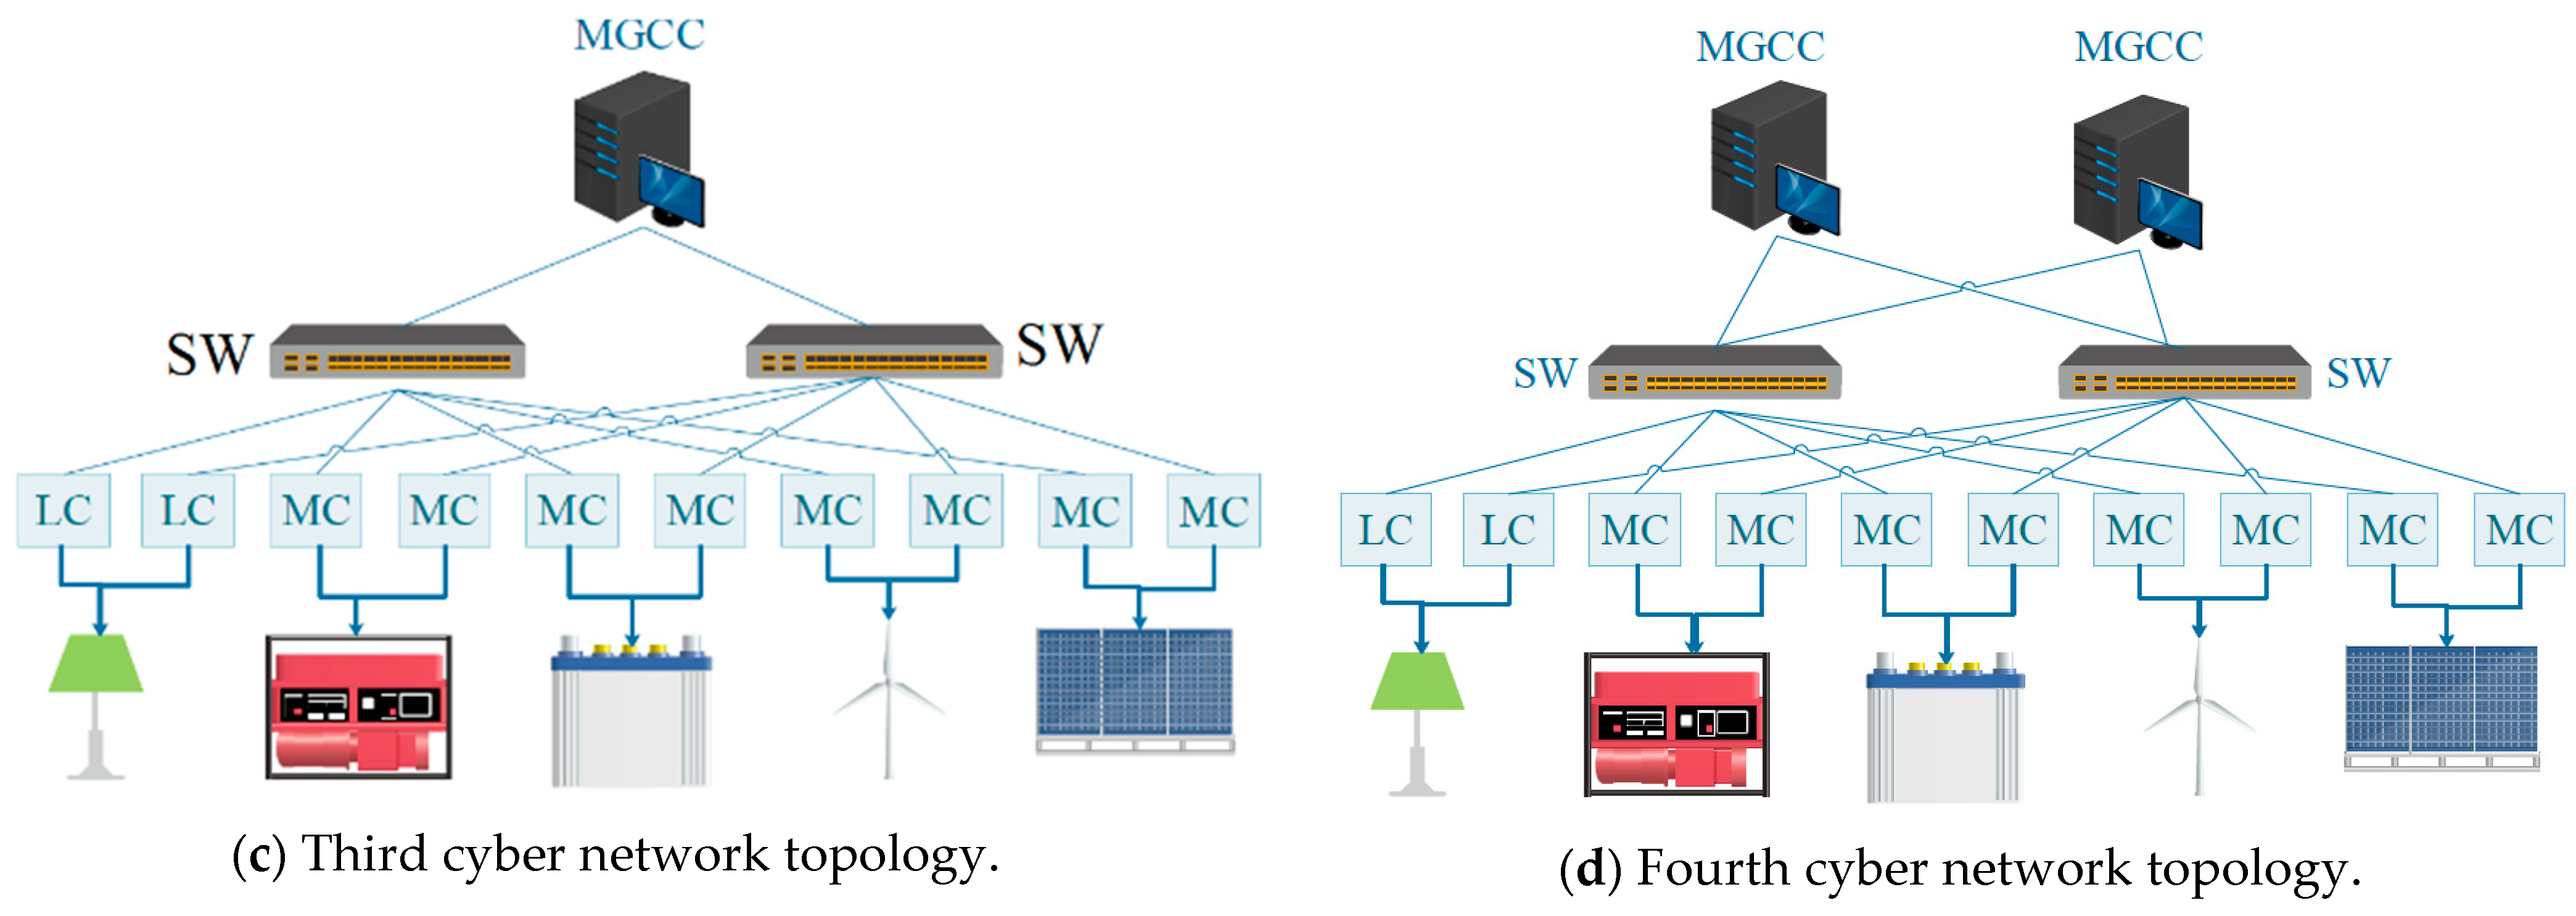
In addition, to evaluate the different cyber network topologies’ impacts on CPMG reliability, the four types of cyber network topologies are considered, as depicted in Figure 8. Topologies 1, 2, and 3 have been extracted from [16], and the fourth topology has been suggested to study the impacts of MGCC and its redundancy.
The first cyber network topology shown in Figure 8 is the base network without any redundancy. In the second topology, the redundancy for the switches and optic fibers has been considered. In the third cyber network topology, in addition to redundant switches and optic fibers, the redundant LCs and MCs have been considered. In current research works such as [16], the redundancy of CPMGs has not been considered, and is studied in the fourth suggested topology.
In the selected test system, the battery is responsible for the initial control, and the MGT is responsible for generating the power shortage in addition to the renewable DGs. The control and operation cycle has been simulated continuously for 1 min time steps in the proposed MCS-based reliability evaluation method. The iteration numbers of 1000 MCS have been simulated to guarantee the convergence of the simulation-based calculations.
In Table 6, the proposed method’s reliability evaluation results under various scenarios and cyber network topologies are presented. The reliability indices without considering the cyber failures and other cyber interruptions are demonstrated.
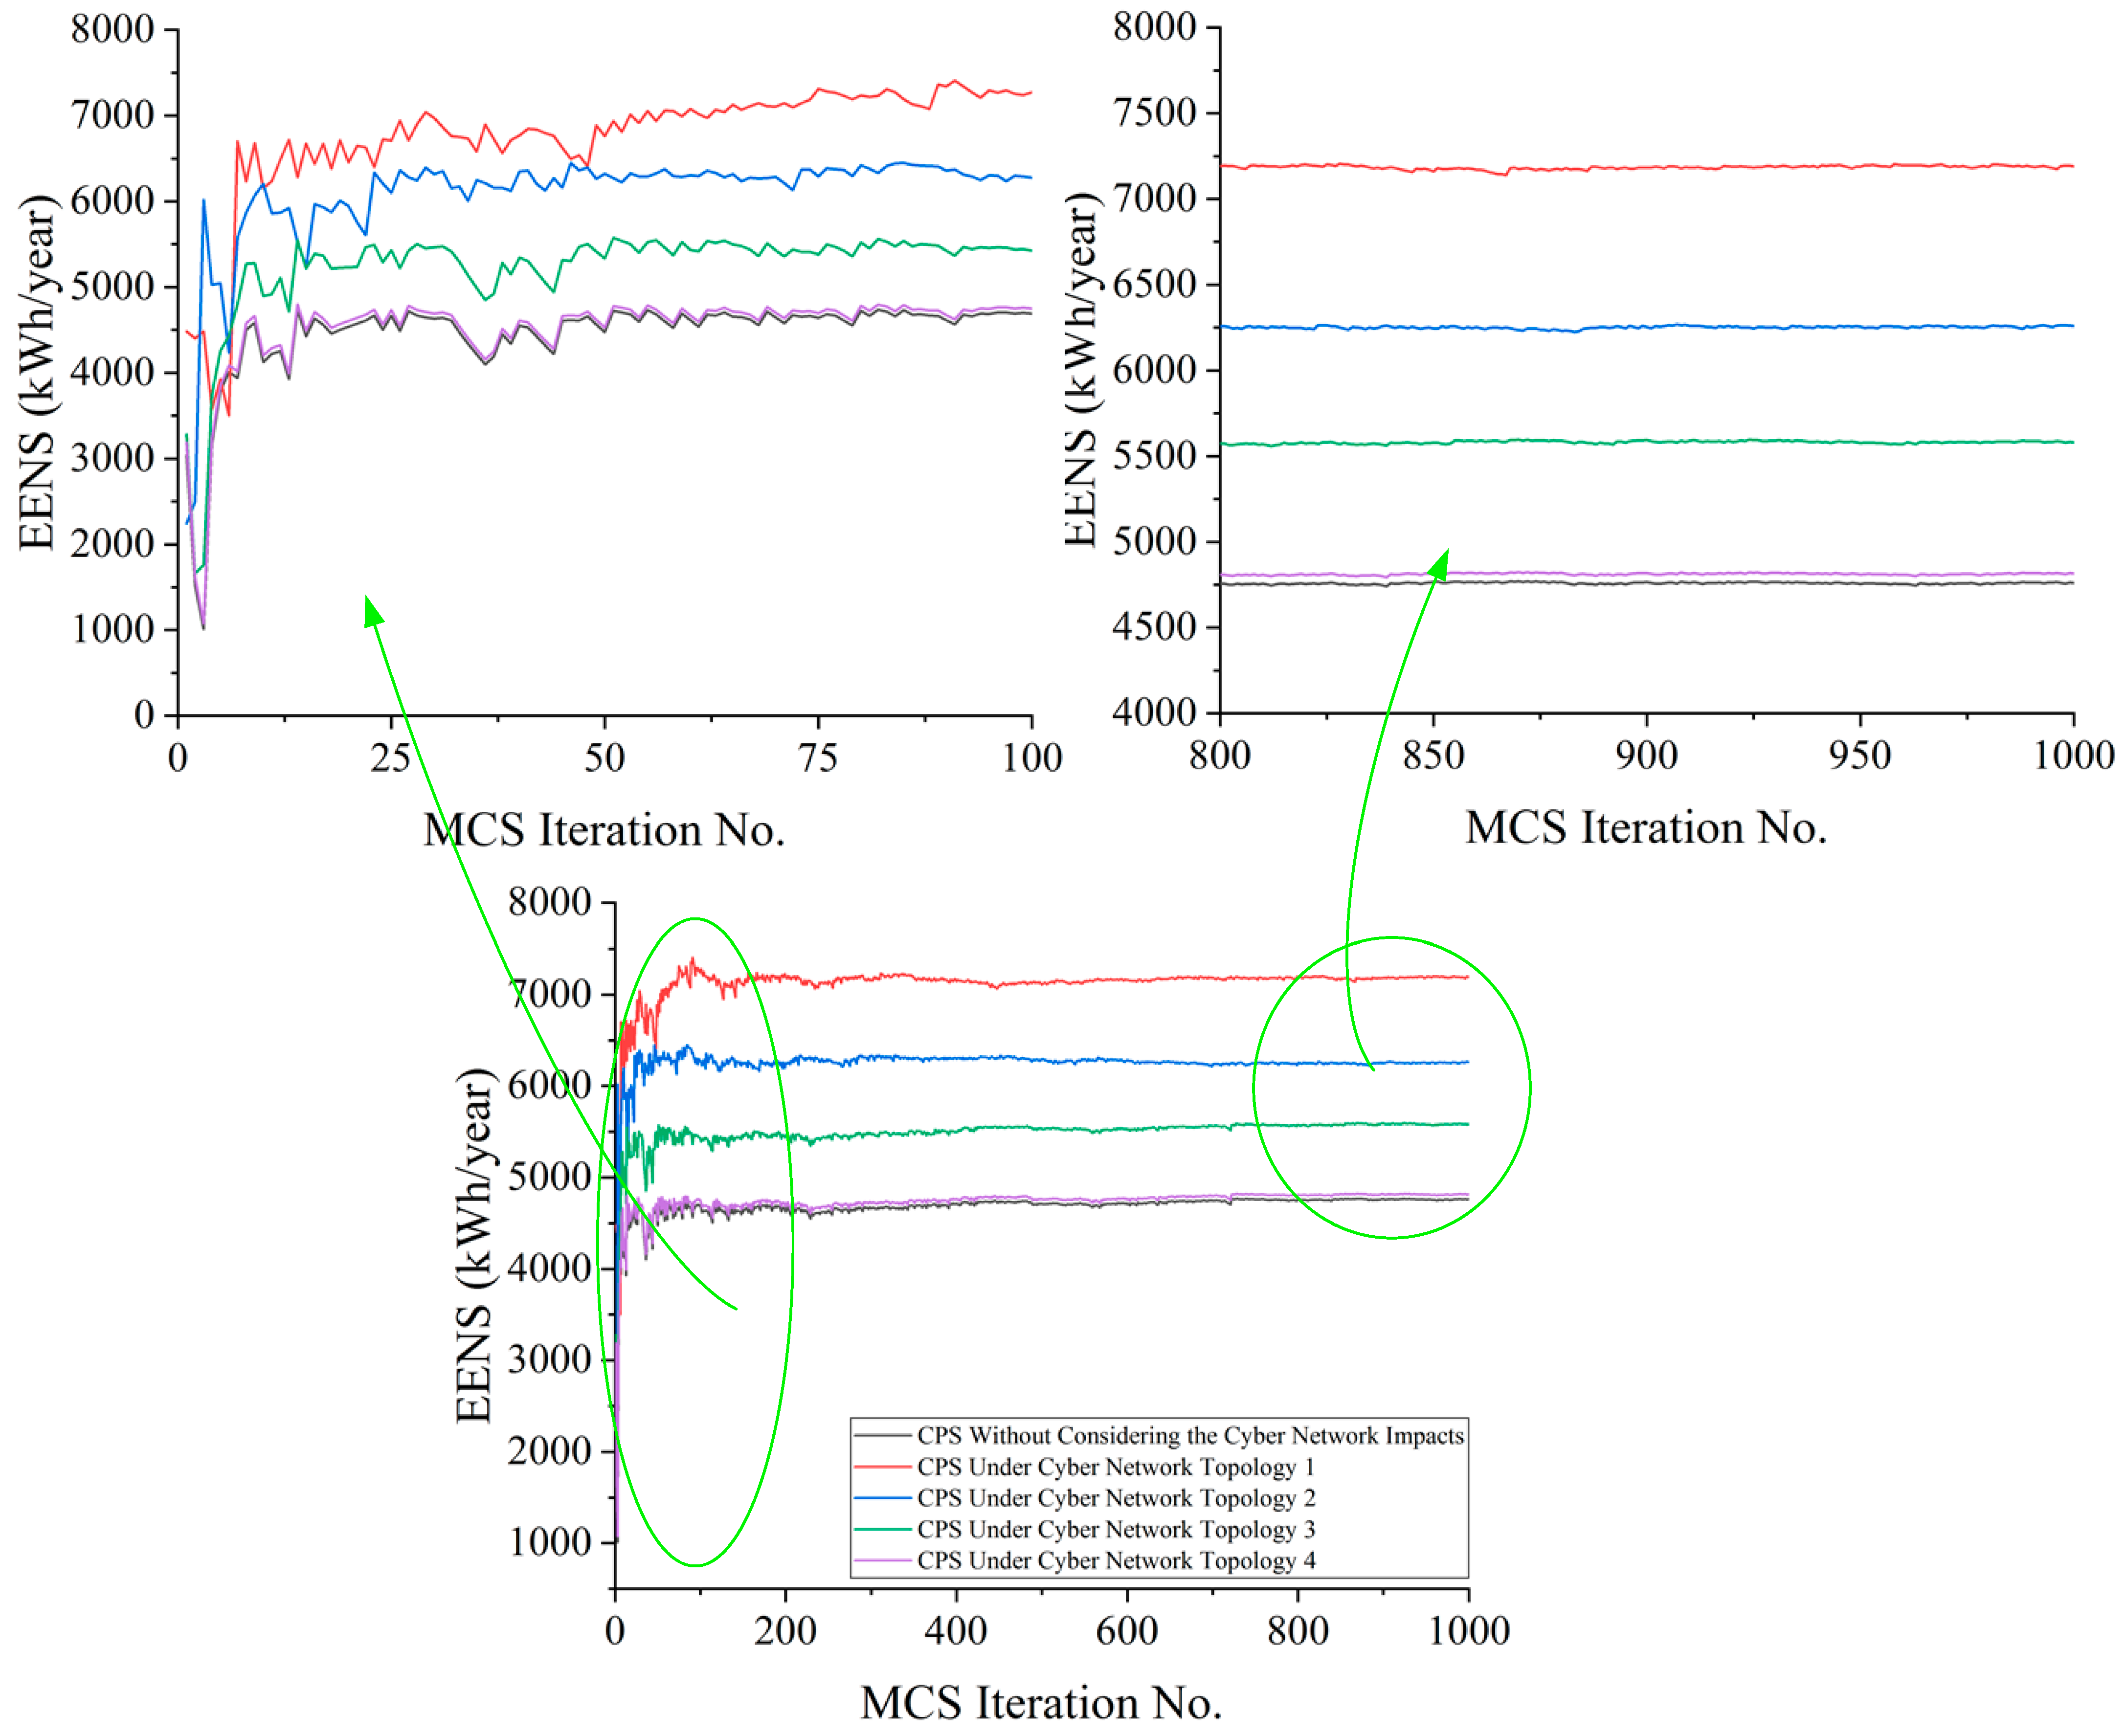
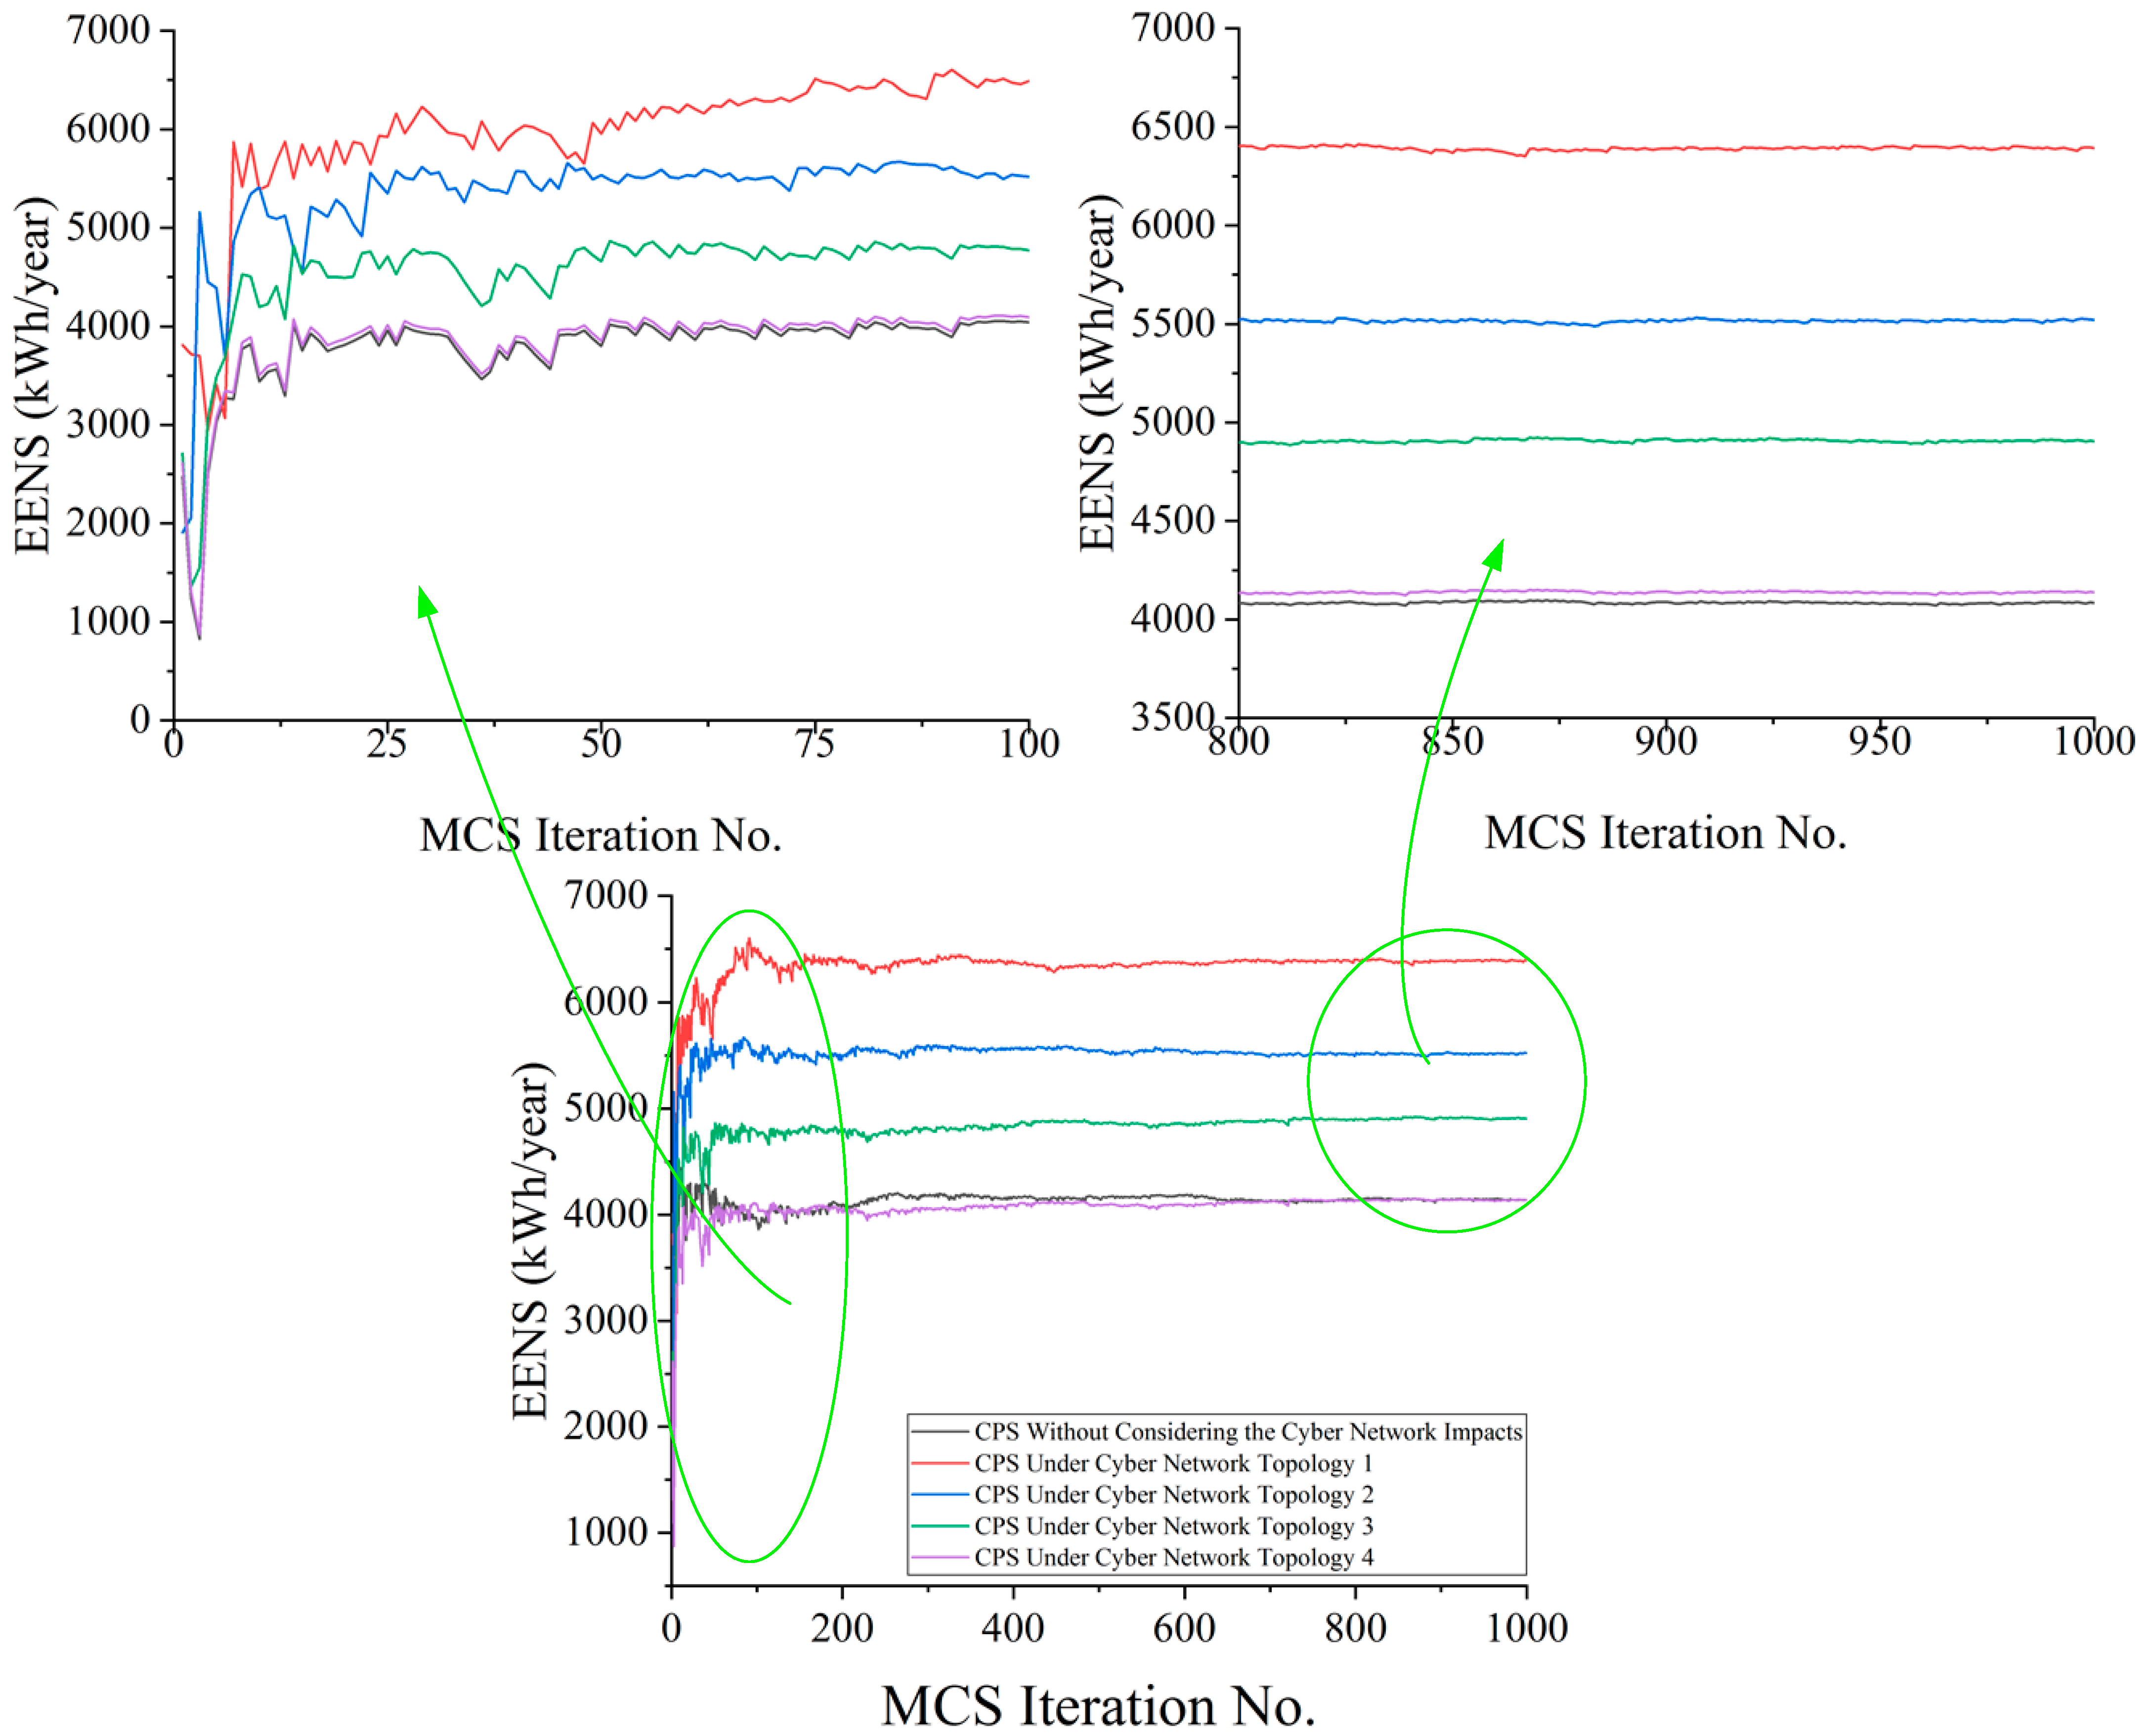
Moreover, the convergence diagrams of the MCS-based methods under Scenarios 1, 2, and 3 (PV and WT-based and hybrid renewable-based DGs scenarios) are shown in Figure 9, Figure 10 and Figure 11. As depicted, the expected energy not-supplied (EENS) of the proposed MCS-based method under different cyber network topologies and DG scenarios has been converged completely.
Test results infer that the CPMG under the first scenario (WT-100) has better reliability indices. The WT generation at all time steps and suitable wind speeds results in better adequacy and reliability indices under Scenarios 1 and 3 compared to Scenario 2 (PV-100). Selecting an appropriate CPMG structure based on studies under different scenarios leads to an improvement in system reliability.
Regardless of the renewable DG scenarios, the most impacts of the cyber network have occurred in Topology 1 without any redundancy. Test results highlight the importance of cyber impacts on CPMG’s reliability. The 55.21%, 51.24%, and 50.3% EENS increments have occurred due to the cyber impacts for Topology 1 under scenarios 1, 2, and 3, respectively. It could be concluded that the cyber impacts for Topology 1 are highlighted, while the CPMG reliability and adequacy levels are satisfying (such as Scenario 1) because of the effectiveness of renewable DGs.
Moreover, test results shown in Table 6 imply that the appropriate cyber network (such as cyber network with Topology 4) mitigates the eventual cyber impacts. As revealed by the obtained test results, the cyber impacts under Scenario 1 and Topology 4 have been reduced to 1.5% compared to 55.21% (corresponding to Topology 1).
The EENS increments due to different types of cyber failures and interruptions under various scenarios and topologies are depicted in Figure 12. The EENS value of the CPMG without considering the cyber impacts has been considered the base condition, and the EENS increases due to all cyber impacts under various scenarios have been determined. Finally, the percentage of each cyber impact has been evaluated. The MGCC impacts under all scenarios, while Topologies 1, 2, and 3 have been selected, are significantly affected by other cyber failures and interruptions. In contrast, under Topology 4 of the cyber network with the redundancy of the MGCC, the MGCC failure did not dramatically affect the system reliability. It is therefore concluded that the MGCC failures are important. However, it is possible to mitigate or decrease the negative impacts of MGCC failures on the CPMG reliability by selecting an appropriate cyber network topology.
Another notable result is the EENS increments due to routing errors and information terminal failures. Therefore, it is essential to consider these types of errors and failures in any reliability evaluation of CPMGs that considers different cyber failures and interruptions.
In Table 7, to illustrate the EENS decrements that modify the cyber network topologies, the EENS and LOLP increments due to cyber impacts for Topology 1 have been considered as the base condition, and the EENS and LOLP decrements for other network topologies compared to Topology 1 have been identified. Comparative test results infer that the cyber network topology affects the CPMG reliability effectively. Regardless of the DG scenarios, approximately 97% of negative cyber impacts could be omitted using an appropriate cyber network topology, such as Topology 4. The comparison of test results under Topologies 2 and 3 with Topology 4 highlights the importance of the MGCC failures. As observed, the redundancy of the MGCC to mitigate its eventual failures under Topology 4 results in 33%, 28%, and 35% EENS improvement.
To illustrate the contributions of the proposed research, the reliability results of the understudy CPMG that do not consider the MGCC faults, but rather consider other cyber impacts, such as in [16], are presented in Table 8. The differences in test results based on the proposed method and other available ones (without considering the MGCC faults) have been demonstrated in Table 9. The test results infer that under cyber network topologies 1, 2, and 3, considerable inaccuracy occurs in the reliability evaluation of the CPMG without considering the MGCC faults, and the advantages of the proposed method are highlighted. Moreover, the results under Topology 4 show that the impacts of MGCC faults could be completely omitted by selecting an appropriate cyber network.
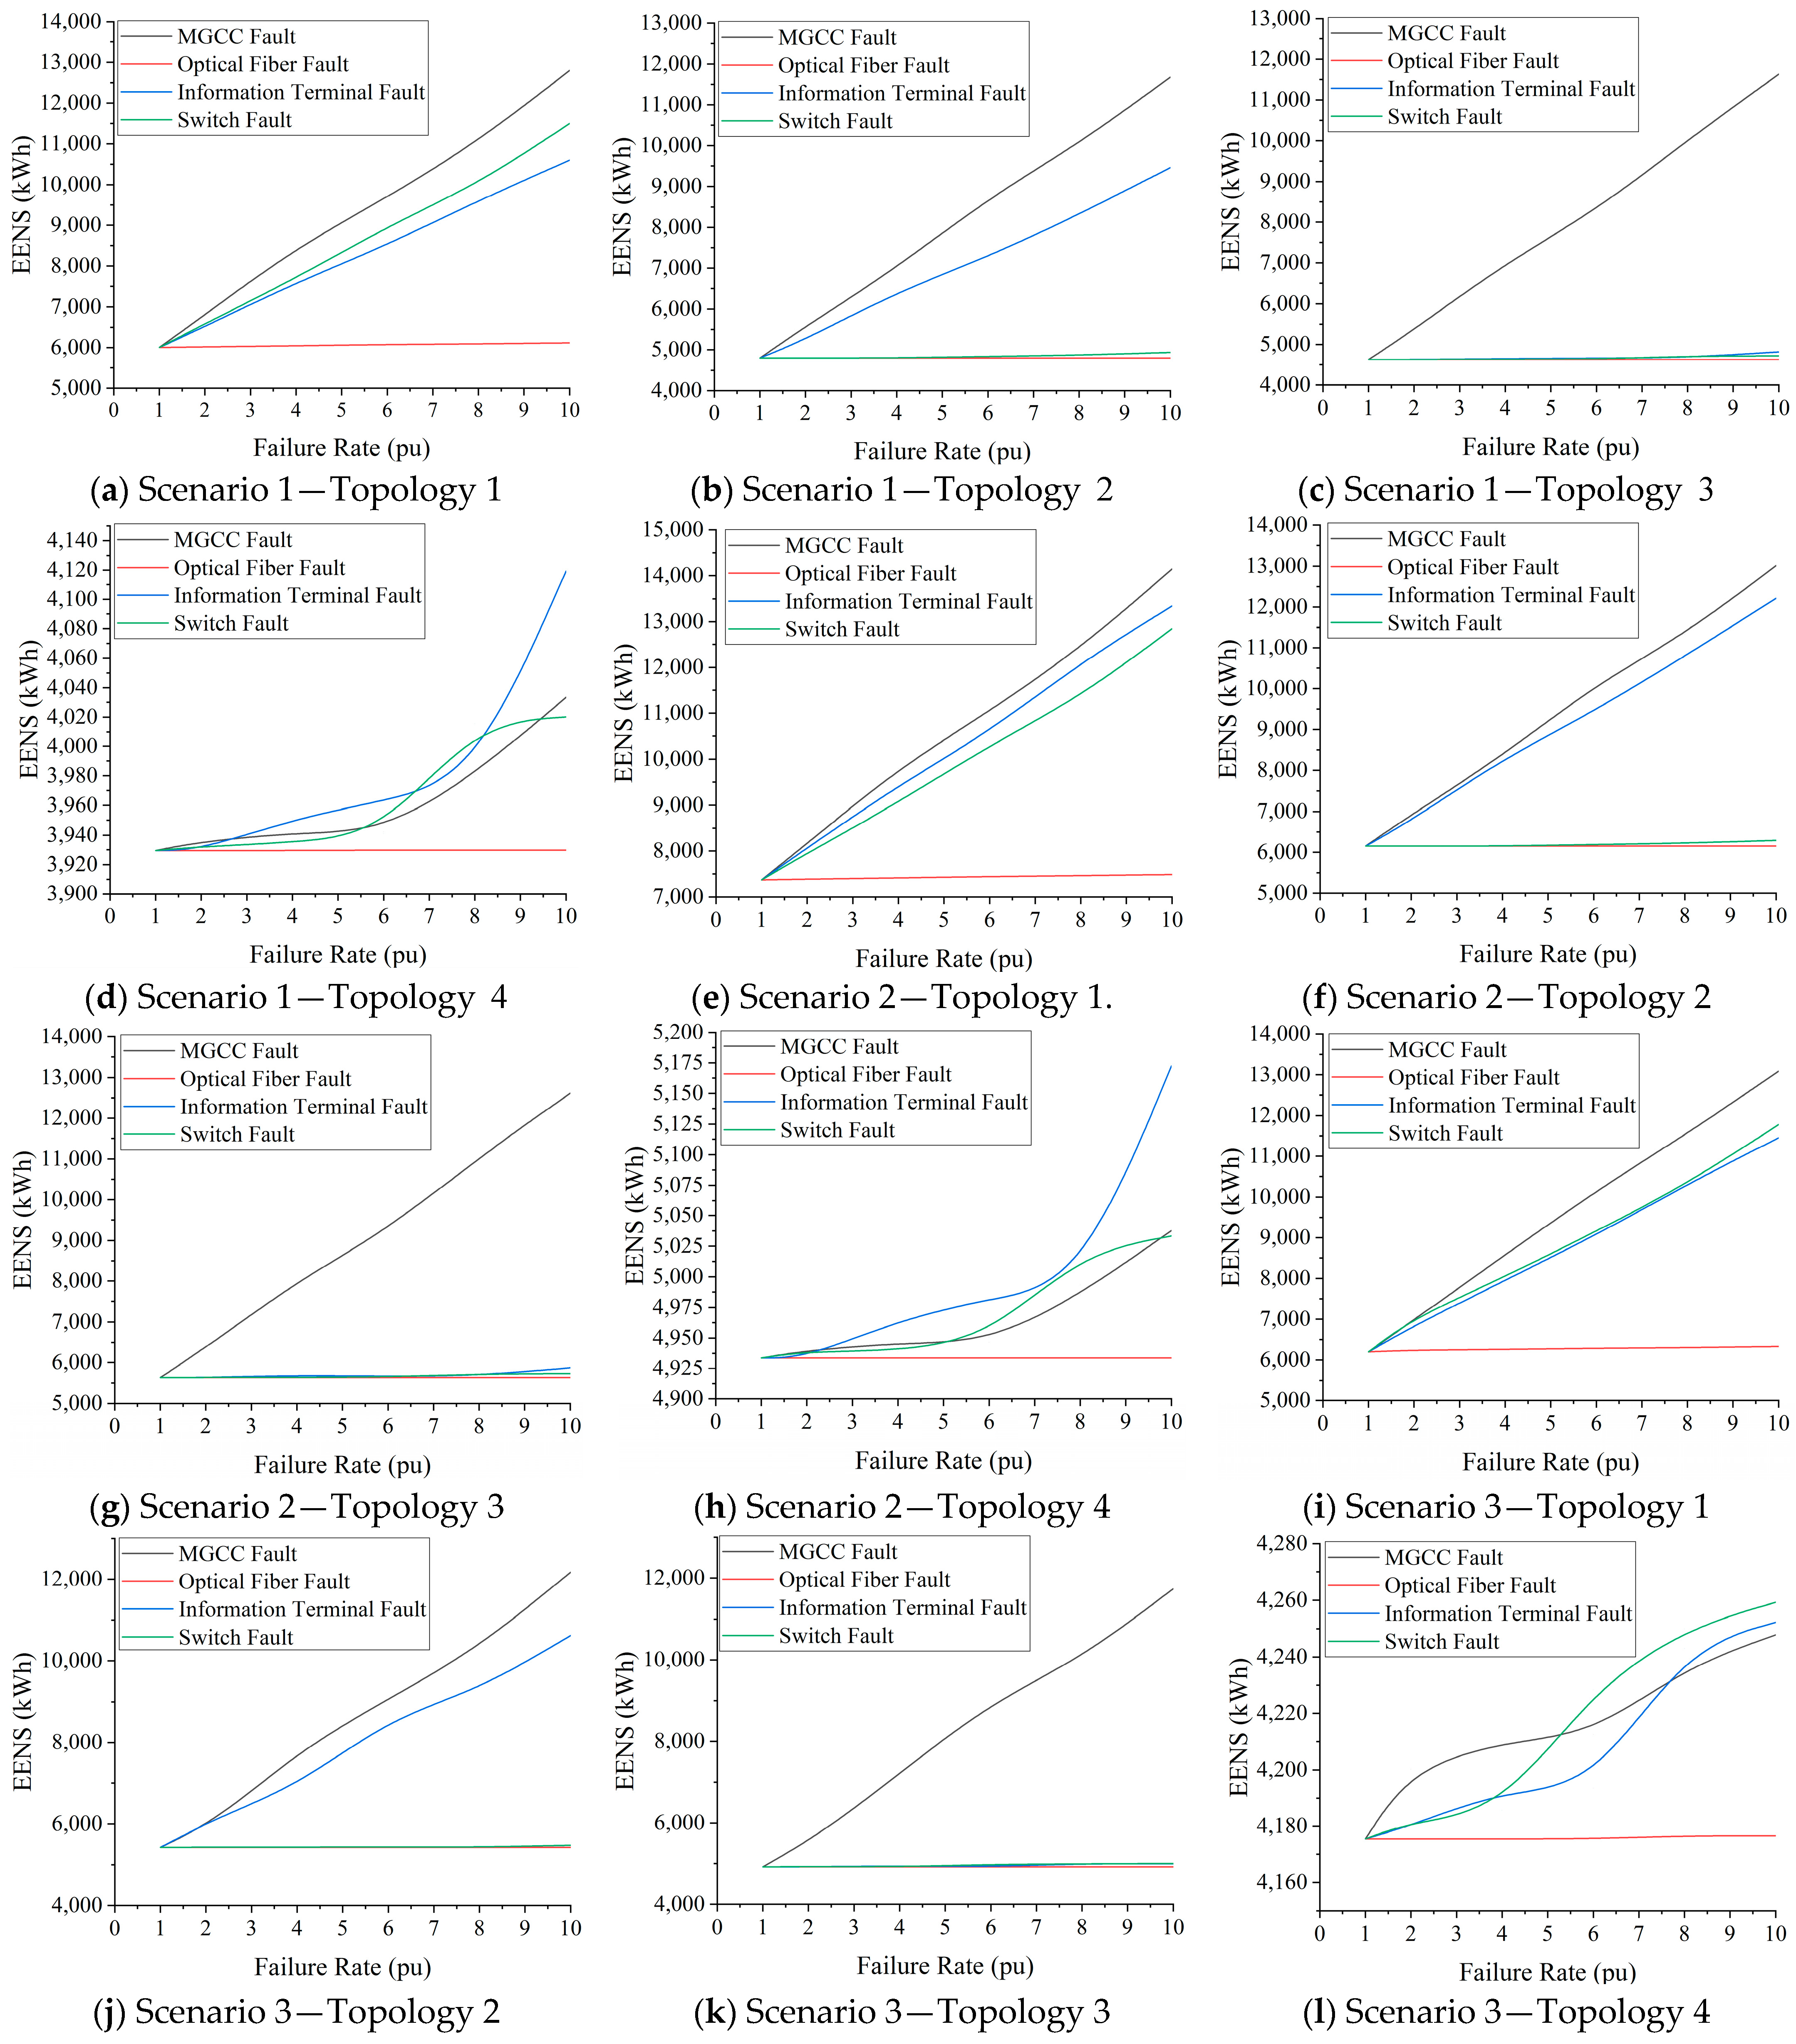
To further evaluate the impacts of each cyber element’s failure on the CPMG reliability, a sensitivity analysis has been performed to obtain insight into how the changes in failures of the cyber elements affect the CPMG reliability, as shown in Figure 13. In this analysis, the failure rates of cyber elements have gradually increased up to ten times under various scenarios.
As revealed by test results shown in Figure 13, regardless of the DG scenarios, the EENS under Topology 1 is very sensitive against the changes in MGCC failure rate. In addition, the switch and information terminal failures could influence the CPMG reliability if they would change. The failure increment of optical fibers under Topology 1 cannot negatively influence the CPMG reliability because its failure rate is very low, and its impacts are negligible compared to other element faults.
As seen, the sensitivity of the CPMG’s EENS due to the faults of switches has been solved under Topology 2. However, the changes in the MGCC and information terminal failure rates lead to a significant increment of the CPMG’s EENS. Accordingly, it is essential to modify the cyber network topology. Although the sensitivity of the CPMG’s EENS due to failures of switches and information terminals has been mitigated under Topology 3, the MGCC’s failure increment might affect the CPMG’s EENS. This means that it is not possible to calculate the CPMG’s reliability accurately without considering the MGCC faults such as in [16]. Moreover, the test results under Topology 4 emphasize the effectiveness of using an appropriate cyber network topology by the MGCC redundancy.
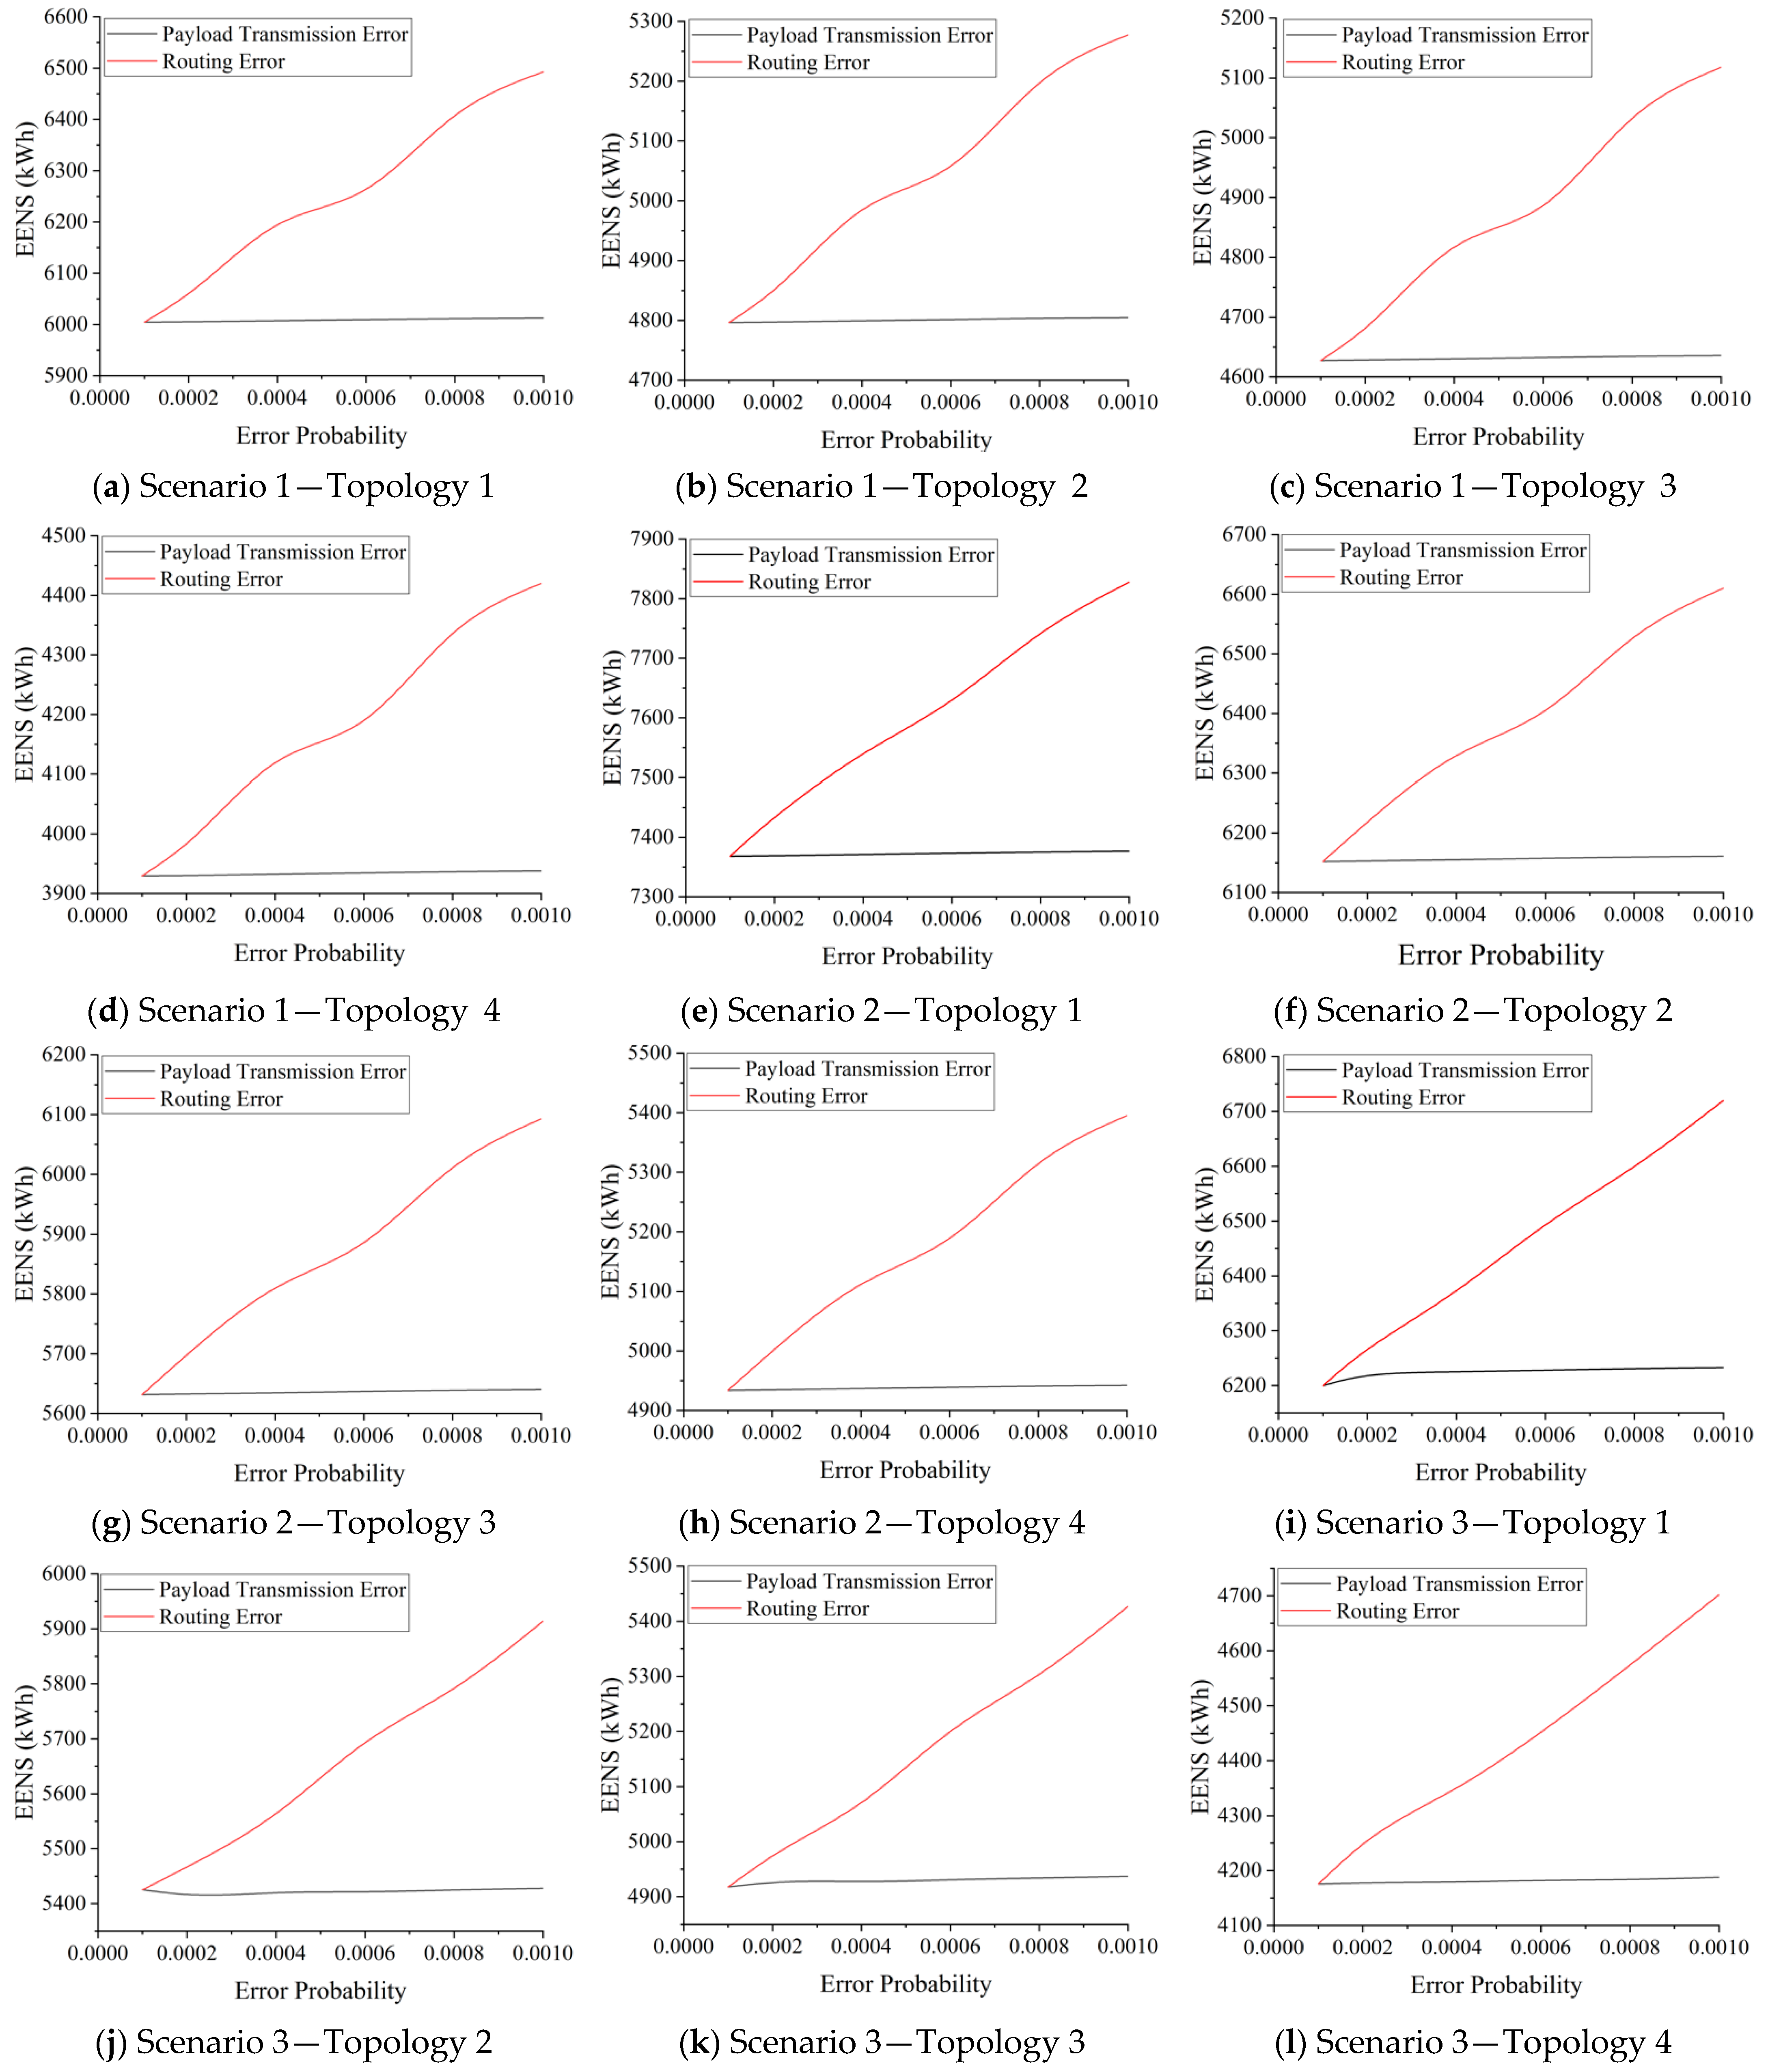
In order to evaluate the impact of data transmission quality on reliability indices, sensitivity analyses based on changes in the probability of routing errors have been performed, as depicted in Figure 14. As seen, the probability of routing errors has been gradually increased from 0.0001 to 0.001, and the CPMG’s EENS under different cyber network topologies for Scenario 3 (PV and WT-based and hybrid renewable-based DGs) has been assessed.
The test results show that the impacts of routing errors are higher than payload errors under all cyber network topologies. In addition, the EENS increase due to changes in routing and payload errors does not dramatically depend on the cyber network topology.
Furthermore, to evaluate the effect of tolerable latency, a sensitivity analysis has been performed on the CPMG information channel’s tolerable latency. In Figure 15, the maximum tolerable latency rate has been gradually increased from 1 to 10 s under different cyber network topologies and DG scenarios. Test results show that a maximum tolerable latency rate of the information channels higher than 2 s under Topologies 2, 3, and 4 is satisfactiory. However, the impacts of the maximum tolerable latency rate of the information channels on CPMG’s reliability are considerable.
As seen, if it is desired to mitigate the impacts of delays of information channels on the CPMG’s reliability, the maximum tolerable latency rate of the information channels should be greater than 6 s for Topology 1. Simulation results imply that the impacts of the maximum tolerable latency rate of the information channels depend on cyber network topology.

5. Conclusions

SMGs have received a great deal of attention in recent years because the advantages of DGs, particularly renewable DGs, are more achievable using SMGs. Although the cyber systems facilitate the energy management schemes in CPMGs, cyber faults, cyber interferences, and cyber–physical interdependencies might affect the CPMG’s reliability. A research gap exists in the field of CPMG’s reliability evaluation, simultaneously considering all cyber failures and interferences under various cyber network topologies and renewable distributions scenarios. This research tried to fill such a gap by developing a new MCS-based reliability assessment method considering cyber elements’ failures, data/information transmission errors, and routing errors under various cyber network topologies. Developing the proposed method by applying the theory graph concepts is one of the contributions of this paper. It should be noted that MGCC faults, aside from other failures and interferences, have been concerned in the proposed method, which is one of the essential contributions of this study. The test results highlighted the advantages of the proposed method considering the MGCC faults’ impacts on the CPMG’s reliability. It has been concluded based on obtained simulation results that the negative impacts of cyber faults and interruptions could be decreased effectively by selecting an appropriate cyber network topology. The simulation results inferred that the negative impacts of cyber–physical interdependencies could be limited to less than 3% using a suitable cyber network topology with the redundancy of MGCC.

Author Contributions

Conceptualization, M.A. and H.H.-D.; methodology, M.A. and H.H.-D.; software, M.A. and H.H.-D.; validation, M.A., H.H.-D., and A.K.; formal analysis, H.H.-D. and A.K.; investigation, H.H.-D. and A.K.; resources, H.H.-D. and A.K.; data curation, M.A., H.H.-D., and A.K.; writing—original draft preparation, M.A. and H.H.-D.; writing—review and editing, H.H.-D. and A.K.; visualization, H.H.-D. and A.K.; supervision, H.H.-D. and A.K.; project administration, H.H.-D. and A.K.; funding acquisition, H.H.-D. and A.K. All authors have read and agreed to the published version of the manuscript.

Funding

This research received no external funding.

Institutional Review Board Statement

Not applicable.

Informed Consent Statement

Not applicable.

Data Availability Statement

Not applicable.

Conflicts of Interest

The authors declare no conflict of interest.

Nomenclature

Indices
t Index of each control cycle time (t = 1: 8760 × T)
i Index of CPMG’s states (i = 1: NMS)
k Index of physical elements (k = 1: NP)
l Index of cyber elements (l = 1: NC)
g Index of generators (l = 1: Ng)
j Index of system elements numbers (j = 1: NP + NC)
f Index of information channel (f = 1: NIch)
y Index of cyber sender terminal (y = 1: NCST)
z Index of cyber receiver terminal (z = 1: NCRT)
q Index of power sender terminal (q = 1: NPST)
r Index of power receiver terminal (r = 1: NPRT)
Parameters
P P Power–power interconnection
C P Cyber–power interdependency
P C Power–cyber interconnection
C C Cyber–cyber interconnection
P P Updated power–power interconnection after mapping the cyber failures to physical system
C P Updated cyber–power interdependency after mapping the cyber failures to physical system
P C Updated power–cyber interconnection after mapping the cyber failures to physical system
C C Updated cyber–cyber interconnection after mapping the cyber failures to physical system
P P Updated power–power interconnection after considering the destroyed interconnections due to cyber/physical failures
C P Updated cyber–power interdependency after considering the destroyed interconnections due to cyber/physical failures
P C Updated power–cyber interconnection after considering the destroyed interconnections due to cyber/physical failures
C C Updated cyber–cyber interconnection
α , β Beta probability density function (PDF) parameters
λ Failure rate
μ Repair rate
c , k Shape and scale parameters in wind speed’s Weibull CDF
V c i Wind turbine cut-in speed (m/s)
V c o Wind turbine cut-off speed (m/s)
V r a t e d Wind turbine rated speed (m/s)
K I Coefficient of current temperature (A/°C)
T c Solar cell temperature (°C)
T a Ambient temperature (°C)
G 0 Extraterrestrial solar irradiance (kW/m2)
N O T Solar cell nominal operating temperature (°C)
I s c Photovoltaic modules short circuit current (A)
V o c Photovoltaic modules open circuit voltage (V)
K v Coefficient of voltage temperature (V/°C)
N P V Number of photovoltaic modules
η Efficiency of photovoltaic inverter
Pr E P a y l o a d Probability of payload error
Pr E H e a d e r Probability of header error
C S T Cyber sending terminal
P S T Power sending terminal
C R T Cyber receiving terminal
P R T Power receiving terminal
S P F Shortest path function
E ¯ D e l a y Average value of delays based on historical data
P ¯ l o a d Mean value of power demand
T Time interval
M T T F Mean time to failure
M T T R Mean time to repair
Variables
M S CPMG’s system state
M E The state of CPMG element
A Availability probability
U Unavailability probability
C P I M Cyber–physical interdependencies matrix
C P I M Updated cyber–physical interdependencies matrix after mapping the cyber failures to corresponding physical element
C P I M Updated cyber–physical interdependencies matrix after applying the destroyed interconnections due to cyber/physical failures
P c h Power channel
I c h Information channel
x , u The random variables uniformly distributed in (0 1)
G r a p h Microgrid graph
T T F Time to failure
T T R Time to repair
v Wind speed (m/s)
F ( v ) Weibull cumulative density function (CDF) of wind speed
P W T Wind turbine output power (W)
P R a t e d Wind turbine rated output power (W)
Γ Gamma probability distribution function
S C I Clearness index value
G Irradiance on a horizontal plane and extraterrestrial total solar irradiance (kW/m2)
I Photo voltaic modules output current (A)
V Photovoltaic modules output voltage (V)
P P V Photovoltaic module output power (W)
P A C s e n t f Payloads of the information channel at the sending terminal
P A C R e c e i v e d f Payloads of the information channel at the recieving terminal
P A C R e c e i v e Received packet data
P A C S e n t Sent packet data
E P a y l o a d Payload error
E H e a d e r Header error
D E S s e n t f Header of the information channel at the sending terminal
D E S R e c e i v e d f Header of the information channel at the recieving terminal
E d e l a y Delay
P l o a d Electrical demand
P l o s s Electrical loss
P g Electrical generated power
Δ L G Difference between the generation and load demand
L C Load curtailment
A t r i s k At-risk state
I c h Information channel state
E E N S Expected energy not supplied
L O L P Loss of load probability
S A I D I System average interruption duration index
Abbreviations
PVPhotovoltaic
WTWind turbine
MTMicro turbine
DGDistributed generations
MCSMonte Carlo Simulations
CDFCumulative distribution function
CPSCyber–physical system
EENSExpected energy not supplied
ESSEnergy storage system
LOLPLoss of load probability
SAIDISystem average interruption duration index
MGCCMicrogrid control center
SWNetwork switch
PCCPoint of common coupling
MCMicrounit controller
LCLoad controller
TTFTime to failure
TTRTime to repair
MTTRMean time to repair
MTTFMean time to failure
CSTCyber sender terminal
CRTCyber receiver terminal
PSTPower sender terminal
PRTPower receiver terminal
SMGSmart microgrid
CPMGCyber–power microgrid
P-TableProbability table
GWNGaussian white noise
CPIMCyber–physical interdependencies matrix
SPFShortest path function
PchPower channel
IchInformation channel

References

  1. Suman, G.K.; Guerrero, J.M.; Roy, O.P. Optimisation of Solar/Wind/Bio-generator/Diesel/Battery Based Microgrids for Rural Areas: A PSO-GWO Approach. Sustain. Cities Soc. 2021, 67, 102723. [Google Scholar] [CrossRef]
  2. Nasiraghdam, H.; Safari, A. Techno-economic assessment of combined power to hydrogen technology and hydrogen storage in optimal bidding strategy of high renewable units-penetrated microgrids. Sustain. Energy Technol. Assess. 2020, 42, 100832. [Google Scholar] [CrossRef]
  3. Emmanouil, S.; Philhower, J.; Macdonald, S.; Khadim, F.K.; Yang, M.; Atsbeha, E.; Nagireddy, H.; Roach, N.; Holzer, E.; Anagnostou, E.N. A Comprehensive Approach to the Design of a Renewable Energy Microgrid for Rural Ethiopia: The Technical and Social Perspectives. Sustainability 2021, 13, 3974. [Google Scholar] [CrossRef]
  4. Jimada-Ojuolape, B.; Teh, J. Surveys on the reliability impacts of power system cyber–physical layers. Sustain. Cities Soc. 2020, 62, 102384. [Google Scholar] [CrossRef]
  5. Gandhi, I.; Ravi, L.; Vijayakumar, V.; Subramaniyaswamy, V. Improving security for wind energy systems in smart grid applications using digital protection technique. Sustain. Cities Soc. 2020, 60, 102265. [Google Scholar] [CrossRef]
  6. Phommixay, S.; Doumbia, M.L.; Cui, Q. A two-stage two-layer optimization approach for economic operation of a microgrid under a planned outage. Sustain. Cities Soc. 2021, 66, 102675. [Google Scholar] [CrossRef]
  7. Mansour-Saatloo, A.; Mirzaei, M.A.; Mohammadi-Ivatloo, B.; Zare, K. A Risk-Averse Hybrid Approach for Optimal Participation of Power-to-Hydrogen Technology-Based Multi-Energy Microgrid in Multi-Energy Markets. Sustain. Cities Soc. 2020, 63, 102421. [Google Scholar] [CrossRef]
  8. Habibzadeh, H.; Nussbaum, B.H.; Anjomshoa, F.; Kantarci, B.; Soyata, T. A survey on cybersecurity, data privacy, and policy issues in cyber-physical system deployments in smart cities. Sustain. Cities Soc. 2019, 50, 101660. [Google Scholar] [CrossRef]
  9. Ding, X.; Guo, Q.; Qiannan, T.; Jermsittiparsert, K. Economic and environmental assessment of multi-energy microgrids under a hybrid optimization technique. Sustain. Cities Soc. 2021, 65, 102630. [Google Scholar] [CrossRef]
  10. Moazeni, F.; Khazaei, J. Optimal operation of water-energy microgrids; a mixed integer linear programming formulation. J. Clean. Prod. 2020, 275, 122776. [Google Scholar] [CrossRef]
  11. Geng, S.; Wu, G.; Tan, C.; Niu, D.; Guo, X. Multi-Objective Optimization of a Microgrid Considering the Uncertainty of Supply and Demand. Sustainability 2021, 13, 1320. [Google Scholar] [CrossRef]
  12. Wang, J.; Gao, X.; Sun, Z. A Multilevel Simulation Method for Time-Variant Reliability Analysis. Sustainability 2021, 13, 3646. [Google Scholar] [CrossRef]
  13. Guo, J.; Zhao, T.; Liu, W.; Zhang, J. Reliability Modeling and Assessment of Isolated Microgrid Considering Influences of Frequency Control. IEEE Access 2019, 7, 50362–50371. [Google Scholar] [CrossRef]
  14. Hashemi-Dezaki, H.; Askarian-Abyaneh, H.; Shams-Ansari, A.; DehghaniSanij, M.; Hejazi, M.A. Direct cyber-power interdependencies-based reliability evaluation of smart grids including wind/solar/diesel distributed generations and plug-in hybrid electrical vehicles. Int. J. Electr. Power Energy Syst. 2017, 93, 1–14. [Google Scholar] [CrossRef]
  15. Hashemi-Dezaki, H.; Agah, S.M.M.; Askarian-Abyaneh, H.; Haeri-Khiavi, H. Sensitivity analysis of smart grids reliability due to indirect cyber-power interdependencies under various DG technologies, DG penetrations, and operation times. Energy Convers. Manag. 2016, 108, 377–391. [Google Scholar] [CrossRef]
  16. Wang, C.; Zhang, T.; Luo, F.; Li, F.; Liu, Y. Impacts of Cyber System on Microgrid Operational Reliability. IEEE Trans. Smart Grid 2019, 10, 105–115. [Google Scholar] [CrossRef]
  17. Falahati, B.; Fu, Y.; Wu, L. Reliability assessment of smart grid considering direct cyber-power interdependencies. IEEE Trans. Smart Grid 2012, 3, 1515–1524. [Google Scholar] [CrossRef]
  18. Falahati, B.; Fu, Y. Reliability assessment of smart grids considering indirect cyber-power interdependencies. IEEE Trans. Smart Grid 2014, 5, 1677–1685. [Google Scholar] [CrossRef]
  19. Zhu, W.; Han, M.; Milanovic, J.V.; Crossley, P. Methodology for Reliability Assessment of Smart Grid Considering Risk of Failure of Communication Architecture. IEEE Trans. Smart Grid 2020, 11, 4358–4365. [Google Scholar] [CrossRef]
  20. Barani, M.; Vadlamudi, V.V.; Heegaard, P.E. Reliability analysis of cyber-physical microgrids: Study of grid-connected microgrids with communication-based control systems. IET Gener. Transm. Distrib. 2020, 15, 645–663. [Google Scholar] [CrossRef]
  21. Karimipour, H.; Dehghantanha, A.; Parizi, R.M.; Choo, K.K.R.; Leung, H. A Deep and Scalable Unsupervised Machine Learning System for Cyber-Attack Detection in Large-Scale Smart Grids. IEEE Access 2019, 7, 80778–80788. [Google Scholar] [CrossRef]
  22. Stamp, J.; McIntyre, A.; Ricardson, B. Reliability impacts from cyber attack on electric power systems. In Proceedings of the 2009 IEEE/PES Power Systems Conference and Exposition PSCE 2009, Seattle, WA, USA, 15–18 March 2009; pp. 1–8. [Google Scholar] [CrossRef]
  23. Wang, L.; Jiao, S.; Xie, Y.; Mubaarak, S.; Zhang, D.; Liu, J.; Jiang, S.; Zhang, Y.; Li, M. A Permissioned Blockchain-Based Energy Management System for Renewable Energy Microgrids. Sustainability 2021, 13, 1317. [Google Scholar] [CrossRef]
  24. Martinez-Bolaños, J.; Silva, V.; Zucchi, M.; Heideier, R.; Relva, S.; Saidel, M.; Fadigas, E. Performance Analysis of Topologies for Autonomous Hybrid Microgrids in Remote Non-Interconnected Communities in the Amazon Region. Sustainability 2021, 13, 44. [Google Scholar] [CrossRef]
  25. Wu, G.; Li, M.; Li, Z.S. Resilience-Based Optimal Recovery Strategy for Cyber–Physical Power Systems Considering Component Multistate Failures. IEEE Trans. Reliab. 2020, 1–15. [Google Scholar] [CrossRef]
  26. Sadik, S.; Ahmed, M.; Sikos, L.F.; Islam, A.K.M.N. Toward a Sustainable Cybersecurity Ecosystem. Computers 2020, 9, 74. [Google Scholar] [CrossRef]
  27. Andronie, M.; Lăzăroiu, G.; Iatagan, M.; Hurloiu, I.; Dijmărescu, I. Sustainable Cyber-Physical Production Systems in Big Data-Driven Smart Urban Economy: A Systematic Literature Review. Sustainability 2021, 13, 751. [Google Scholar] [CrossRef]
  28. Wang, Q.; Cai, X.; Tang, Y.; Ni, M. Methods of cyber-attack identification for power systems based on bilateral cyber-physical information. Int. J. Electr. Power Energy Syst. 2021, 125, 106515. [Google Scholar] [CrossRef]
  29. Gao, X.; Peng, M.; Tse, C.K. Cascading Failure A nalysis of Cyber Physical Power Systems Considering Routing Strategy. IEEE Trans. Circuits Syst. II Express Briefs 2021, 1. [Google Scholar] [CrossRef]
  30. Wang, Y.; Nguyen, T.L.; Xu, Y.; Shi, D. Distributed control of heterogeneous energy storage systems in islanded microgrids: Finite-time approach and cyber-physical implementation. Int. J. Electr. Power Energy Syst. 2020, 119, 105898. [Google Scholar] [CrossRef]
  31. Rotar, R.; Jurj, S.L.; Opritoiu, F.; Vladutiu, M. Fault Coverage-Aware Metrics for Evaluating the Reliability Factor of Solar Tracking Systems. Energies 2021, 14, 1074. [Google Scholar] [CrossRef]
  32. Hariri, A.M.; Hashemi-Dezaki, H.; Hejazi, M.A. A novel generalized analytical reliability assessment method of smart grids including renewable and non-renewable distributed generations and plug-in hybrid electric vehicles. Reliab. Eng. Syst. Saf. 2020, 196, 106746. [Google Scholar] [CrossRef]
  33. Park, J.W.; Lee, J.M. Transmission modeling and simulation for Internet-based control. In Proceedings of the IECON’01. 27th Annual Conference of the IEEE Industrial Electronics Society (Cat. No.37243), Denver, CO, USA, 29 November–2 December 2001; Volume 1, pp. 165–169. [Google Scholar] [CrossRef]
  34. Tipsuwan, Y.; Chow, M.Y. Gain scheduler middleware: A methodology to enable existing controllers for networked control and teleoperation—Part I: Networked control. IEEE Trans. Ind. Electron. 2004, 51, 1218–1227. [Google Scholar] [CrossRef] [Green Version]
  35. Rojas, A.J. Feedback control over signal-to-noise ratio constrained communication channels with channel input quantisation. In Proceedings of the 2010 American Control Conference ACC 2010, Baltimore, MD, USA, 30 June–2 July 2010; pp. 265–270. [Google Scholar] [CrossRef]
  36. Xin, S.; Guo, Q.; Sun, H.; Zhang, B.; Wang, J.; Chen, C. Cyber-Physical Modeling and Cyber-Contingency. IEEE Trans. Smart Grid 2015, 6, 2375–2385. [Google Scholar] [CrossRef]
  37. Chehri, A.; Fofana, I.; Yang, X. Security Risk Modeling in Smart Grid Critical Infrastructures in the Era of Big Data and Artificial Intelligence. Sustainability 2021, 13, 3196. [Google Scholar] [CrossRef]
  38. Zhao, S.; Yan, X.; Wang, B.; Wang, E.; Ma, L. Research on reliability evaluation method of DC circuit breaker based on Markov model. Electr. Power Syst. Res. 2019, 173, 1–5. [Google Scholar] [CrossRef]
  39. Hariri, A.-M.; Hejazi, M.A.; Hashemi-Dezaki, H. Investigation of impacts of plug-in hybrid electric vehicles’ stochastic characteristics modeling on smart grid reliability under different charging scenarios. J. Clean. Prod. 2021, 287, 125500. [Google Scholar] [CrossRef]
  40. Blokus, A.; Dziula, P. Relations of Imperfect Repairs to Critical Infrastructure Maintenance Costs. Sustainability 2021, 13, 4917. [Google Scholar] [CrossRef]
  41. Kim, W.; Eom, H.; Kwon, Y. Optimal Design of Photovoltaic Connected Energy Storage System Using Markov Chain Models. Sustainability 2021, 13, 3837. [Google Scholar] [CrossRef]
  42. Hashemi-Dezaki, H.; Hariri, A.-M.; Hejazi, M.A. Impacts of load modeling on generalized analytical reliability assessment of smart grid under various penetration levels of wind/solar/non-renewable distributed generations. Sustain. Energy Grids Netw. 2019, 20, 1–16. [Google Scholar] [CrossRef]
  43. Arya, L.D.; Choube, S.C.; Arya, R.; Tiwary, A. Evaluation of reliability indices accounting omission of random repair time for distribution systems using Monte Carlo simulation. Int. J. Electr. Power Energy Syst. 2012, 42, 533–541. [Google Scholar] [CrossRef]
  44. Bellavista, P.; Giannelli, C.; Mamei, M.; Mendula, M.; Picone, M. Application-driven Network-aware Digital Twin Management in Industrial Edge Environments. IEEE Trans. Ind. Inform. 2021, 1. [Google Scholar] [CrossRef]
  45. Song, J.; Lee, Y.; Choi, J.-W.; Gil, J.-M.; Han, J.; Choi, S.-S. Practical In-Depth Analysis of IDS Alerts for Tracing and Identifying Potential Attackers on Darknet. Sustainability 2017, 9, 262. [Google Scholar] [CrossRef] [Green Version]
  46. Vahid-Pakdel, M.J.; Nojavan, S.; Mohammadi-ivatloo, B.; Zare, K. Stochastic optimization of energy hub operation with consideration of thermal energy market and demand response. Energy Convers. Manag. 2017, 145, 117–128. [Google Scholar] [CrossRef]
  47. Hashemi-Dezaki, H.; Hamzeh, M.; Askarian-Abyaneh, H.; Haeri-Khiavi, H. Risk management of smart grids based on managed charging of PHEVs and vehicle-to-grid strategy using Monte Carlo simulation. Energy Convers. Manag. 2015, 100, 262–276. [Google Scholar] [CrossRef]
  48. Faraji, J.; Hashemi-Dezaki, H.; Ketabi, A. Optimal probabilistic scenario-based operation and scheduling of prosumer microgrids considering uncertainties of renewable energy sources. Energy Sci. Eng. 2020, 8, 3942–3960. [Google Scholar] [CrossRef]
  49. Yona, A.; Senjyu, T.; Funabashi, T. Application of Recurrent Neural Network to Short-Term-Ahead Generating Power Forecasting for Photovoltaic System. In Proceedings of the 2007 IEEE Power Engineering Society General Meeting, Tampa, FL, USA, 24–28 June 2007; pp. 1–6. [Google Scholar]
  50. Memari, M.; Karimi, A.; Hashemi-Dezaki, H. Reliability evaluation of active distribution networks based on scenario reduction method using PSO algorithm. In Proceedings of the 2020 10th Smart Grid Conference (SGC), Kashan, Iran, 16–17 December 2020; pp. 1–6. [Google Scholar]
  51. Available online: http://www.satba.gov.ir (accessed on 17 May 2021).
  52. Kounev, V.; Tipper, D.; Yavuz, A.A.; Grainger, B.M.; Reed, G.F. A Secure Communication Architecture for Distributed Microgrid Control. IEEE Trans. Smart Grid 2015, 6, 2484–2492. [Google Scholar] [CrossRef]
  53. Zheng, L.; Parkinson, S.; Wang, D.; Cai, L.; Crawford, C. Energy efficient communication networks design for demand response in smart grid. In Proceedings of the 2011 International Conference on Wireless Communications and Signal Processing (WCSP), Nanjing, China, 9–11 November 2011. [Google Scholar] [CrossRef]
  54. Shafiee, Q.; Guerrero, J.M.; Vasquez, J.C. Distributed secondary control for islanded microgrids-a novel approach. IEEE Trans. Power Electron. 2014, 29, 1018–1031. [Google Scholar] [CrossRef] [Green Version]
  55. Wang, Y.; Li, W.; Lu, J.; Liu, H. Evaluating multiple reliability indices of regional networks in wide area measurement system. Electr. Power Syst. Res. 2009, 79, 1353–1359. [Google Scholar] [CrossRef]
  56. Wang, Y.; Li, W.; Lu, J. Reliability analysis of phasor measurement unit using hierarchical markov modeling. Electr. Power Compon. Syst. 2009, 37, 517–532. [Google Scholar] [CrossRef]
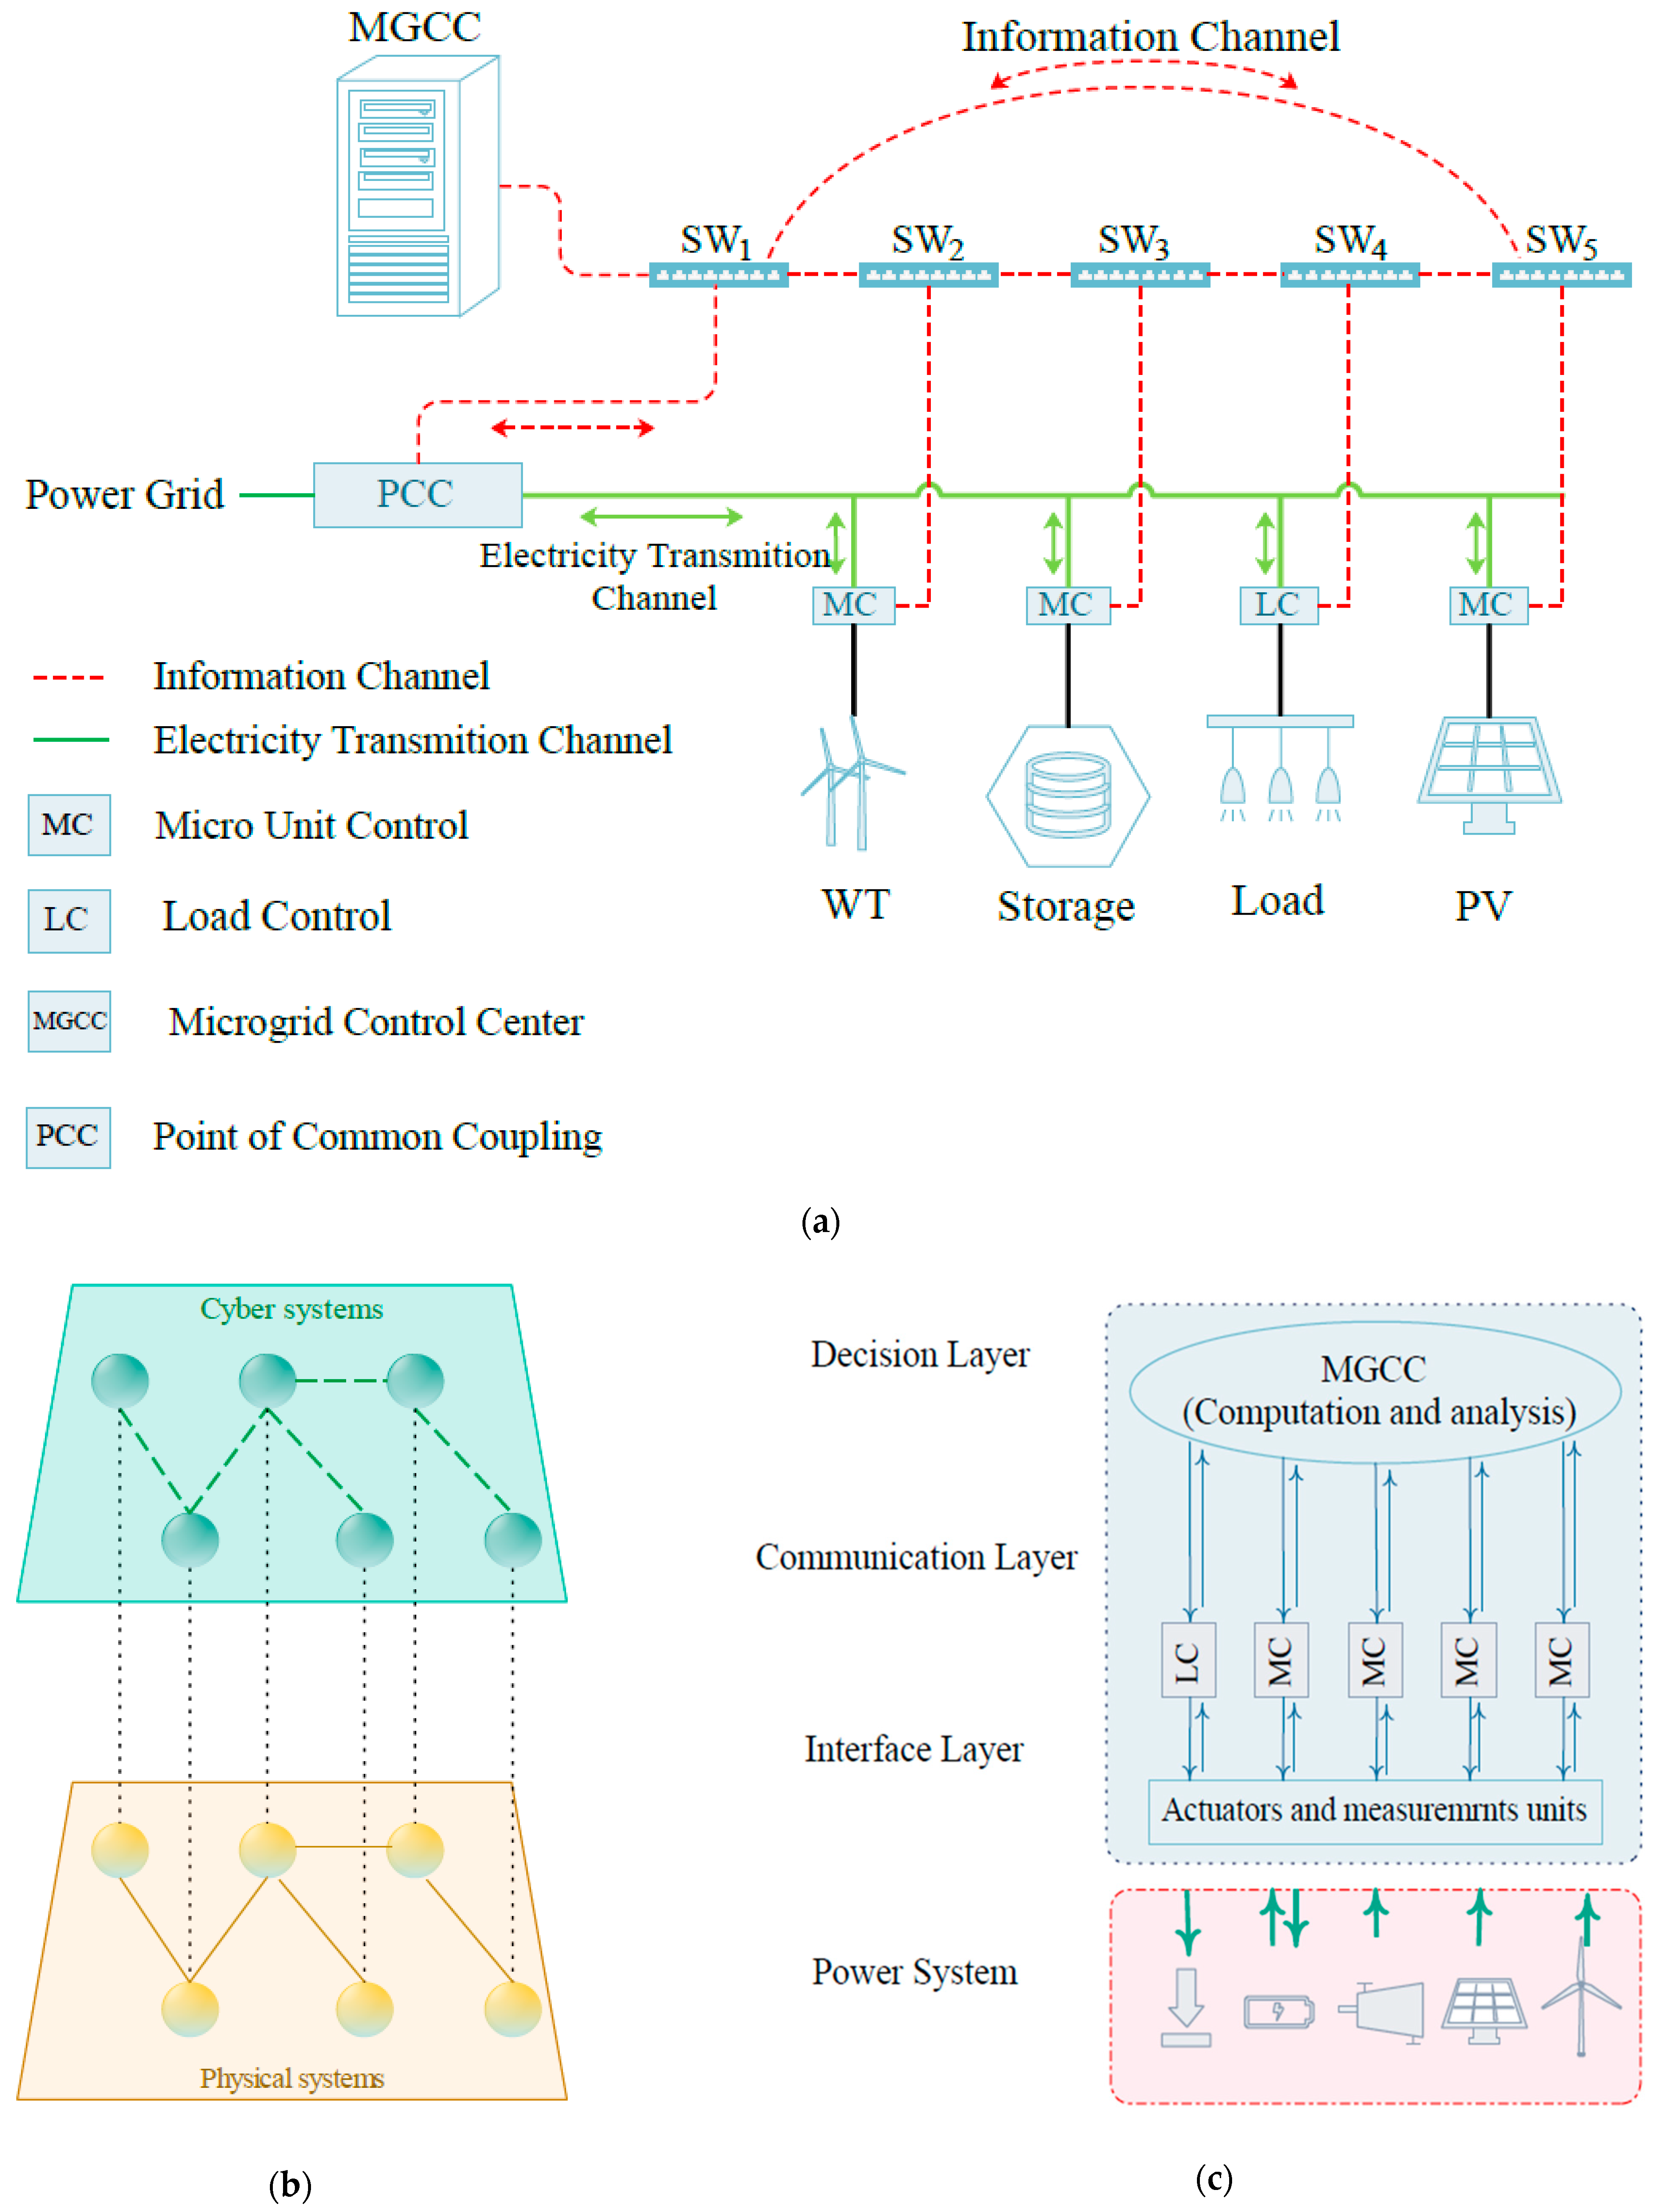
Figure 1. Architecture of the understudy CPMGs; (a) bidirectional information/power channels; (b) cyber–physical nature; (c) different layers and interfaces [16,20].
Sustainability 13 05695 g001
Figure 2. Two-state reliability model for CPMG’s elements [16].
Sustainability 13 05695 g002
Figure 3. State of CPMG’s elements based on the two-state reliability model [42].
Sustainability 13 05695 g003
Figure 4. Conceptual structure of information transmission, including transmission errors and time delays.
Sustainability 13 05695 g004
Figure 5. Flowchart of the proposed reliability assessment of CPMGs considering cyber impacts.
Sustainability 13 05695 g005
Figure 6. Understudy CPMG [16].
Sustainability 13 05695 g006
Figure 7. Typical one-year historical data of load, solar irradiance, and wind speed [51].
Sustainability 13 05695 g007
Figure 8. Different cyber network topologies [16].
Sustainability 13 05695 g008aSustainability 13 05695 g008b
Figure 9. Convergence diagram of the MCS-based reliability evaluation of the CPMG under Scenario 1 and different cyber network topologies.
Sustainability 13 05695 g009
Figure 10. Convergence diagram of the MCS-based reliability evaluation of the CPMG under Scenario 2 and different cyber network topologies.
Sustainability 13 05695 g010
Figure 11. Convergence diagram of the MCS-based reliability evaluation of the CPMG under Scenario 3 and different cyber network topologies.
Sustainability 13 05695 g011
Figure 12. Analyses of the EENS increment due to different types of cyber impacts under various scenarios.
Sustainability 13 05695 g012
Figure 13. Sensitivity analyses of EENS via the failure rate of cyber elements under various scenarios and cyber network topologies.
Sustainability 13 05695 g013
Figure 14. Sensitivity analyses of EENS via the changes in payload and routing errors under various scenarios and cyber network topologies.
Sustainability 13 05695 g014
Figure 15. Sensitivity analyses of EENS via the changes in maximum tolerable latency rate of the information channels.
Sustainability 13 05695 g015
Table 1. A summary of the literature review on SMG reliability evaluation.
Various RDERs ScenariosRDERs UncertaintyMGCCs FaultsInformation Transmission DelayRouting ErrorInformation Transmission ErrorCyber Component FailuresNon-MCS MethodMCS MethodYearReferences
🗶🗶🗶🗶🗶🗶Markov Chain Model🗶2012[17]
🗶🗶🗶🗶🗶🗶P-Table🗶2014[18]
🗶🗶🗶🗶🗶🗶🗶2019[13]
🗶🗶🗶🗶🗶Complex Network Theory🗶2020[21]
🗶🗶🗶🗶🗶🗶2009[22]
🗶🗶🗶🗶🗶2017[14]
🗶🗶🗶🗶🗶2016[15]
🗶🗶🗶2019[16]
🗶🗶🗶🗶🗶2020[20]
🗶Proposed Method
Table 3. Statistical parameters of the historical SCI [51].
Time (Hour)Beta PDF Parameter (α)Beta PDF Parameter (β)
70.6049.2272
81.19854.8892
92.10713.6774
102.80662.6887
113.05631.8086
121.6111.0295
132.82311.2454
142.59891.4137
152.78872.2633
162.44273.4466
171.86865.3861
180.90216.7819
Table 4. CPMG’s cyber and power elements [13,16,55,56].
ElementRepair Time (h)Failure Rate (Failure/Year)
MGCC480.25
Network switch480.2
Optical fiber40.0175
Information terminal240.658
MGT1001.168
PV400.5
WT2790.769
ESS7.80.172
Table 5. Information transmission errors data [36,52,53,54].
ParametersValues
Probability of the payload error0.0001
Payload error deviation0.01
Probability of the routing error0.0001
Routing error deviation0.01
Average information transmission delay1 s
Maximum tolerable delay margin of information transmission6 s
Table 6. Reliability evaluation results of the proposed method under various scenarios and cyber network topologies.
Scenario No.Topology No.With Cyber ImpactsWithout Cyber Impacts
EENS (kWh/Year)LOLP (%)SAIDI (Hour)EENS (kWh/Year)LOLP (%)SAIDI (Hour)
Scenario 1
(WT-100)
16004.51.648189.713868.51.121555.726
24796.41.414273.571
34627.41.276168.616
43929.51.15157.656
Scenario 2
(PV-100)
173681.7468110.14871.71.198671.165
26152.21.530794.281
35631.71.352583.59
44933.81.227472.63
Scenario 3
(WT-50/PV-50)
16199.71.777195.5234125.11.247861.68
25425.51.585481.748
34917.71.414874.266
44175.51.282962.704
Table 7. Reliability improvement results of the proposed method under various scenarios and cyber network topologies.
Scenario No.Topology No.EENS Increment Due to Cyber Impacts (kWh/Year)EENS Decrement Compared to Cyber Network Topology 1 (%)LOLP Increment due to Cyber Impacts (%)Decrement Compared to Cyber Network Topology 1 (%)
Scenario 1
(WT-100)
12136.0-0.5266-
2927.956.55900.292744.4170
3758.964.47100.154670.6419
46197.14420.029594.3980
Scenario 2
(PV-100)
12496.3-0.5482-
21280.548.70410.332139.4199
376069.55490.153971.9263
462.197.51230.028894.7464
Scenario 3
(WT-50/PV-50)
12074.6-0.5293-
21300.437.31800.337636.2176
3792.661.79500.167068.4489
450.497.57060.035193.3686
Table 8. Reliability evaluation results under various scenarios and cyber network topologies without considering the MGCC faults based on available methods such as seen in [16].
Scenario No.Topology No.With Cyber Impacts
EENS (kWh/Year)LOLP (%)SAIDI (Hour)
Scenario 1
(WT-100)
15277.81.514578.007
24075.41.277361.581
33929.51.15157.656
43929.51.15157.656
Scenario 2
(PV-100)
166411.613298.393
25431.31.393882.291
34933.81.227472.63
44933.81.227472.63
Scenario 3
(WT-50/PV-50)
15481.71.647684.682
246451.443670.387
34175.51.282962.704
44175.51.282962.704
Table 9. Inaccuracies in reliability indices due to MGCC faults under various scenarios and cyber network topologies.
Scenario No.Topology No.Inaccuracies in Reliability Indices Due to Non-Consideration of MGCC Faults
EENS (kWh/Year)LOLP (%)SAIDI (Hour)
Scenario 1
(WT-100)
1726.711.7030.13
272111.990.14
3697.910.960.13
4000
Scenario 2
(PV-100)
172711.7070.13
2720.911.990.14
3697.910.960.13
4000
Scenario 3
(WT-50/PV-50)
171810.8410.13
2780.511.3610.14
3742.211.5620.13
4000
Publisher’s Note: MDPI stays neutral with regard to jurisdictional claims in published maps and institutional affiliations.