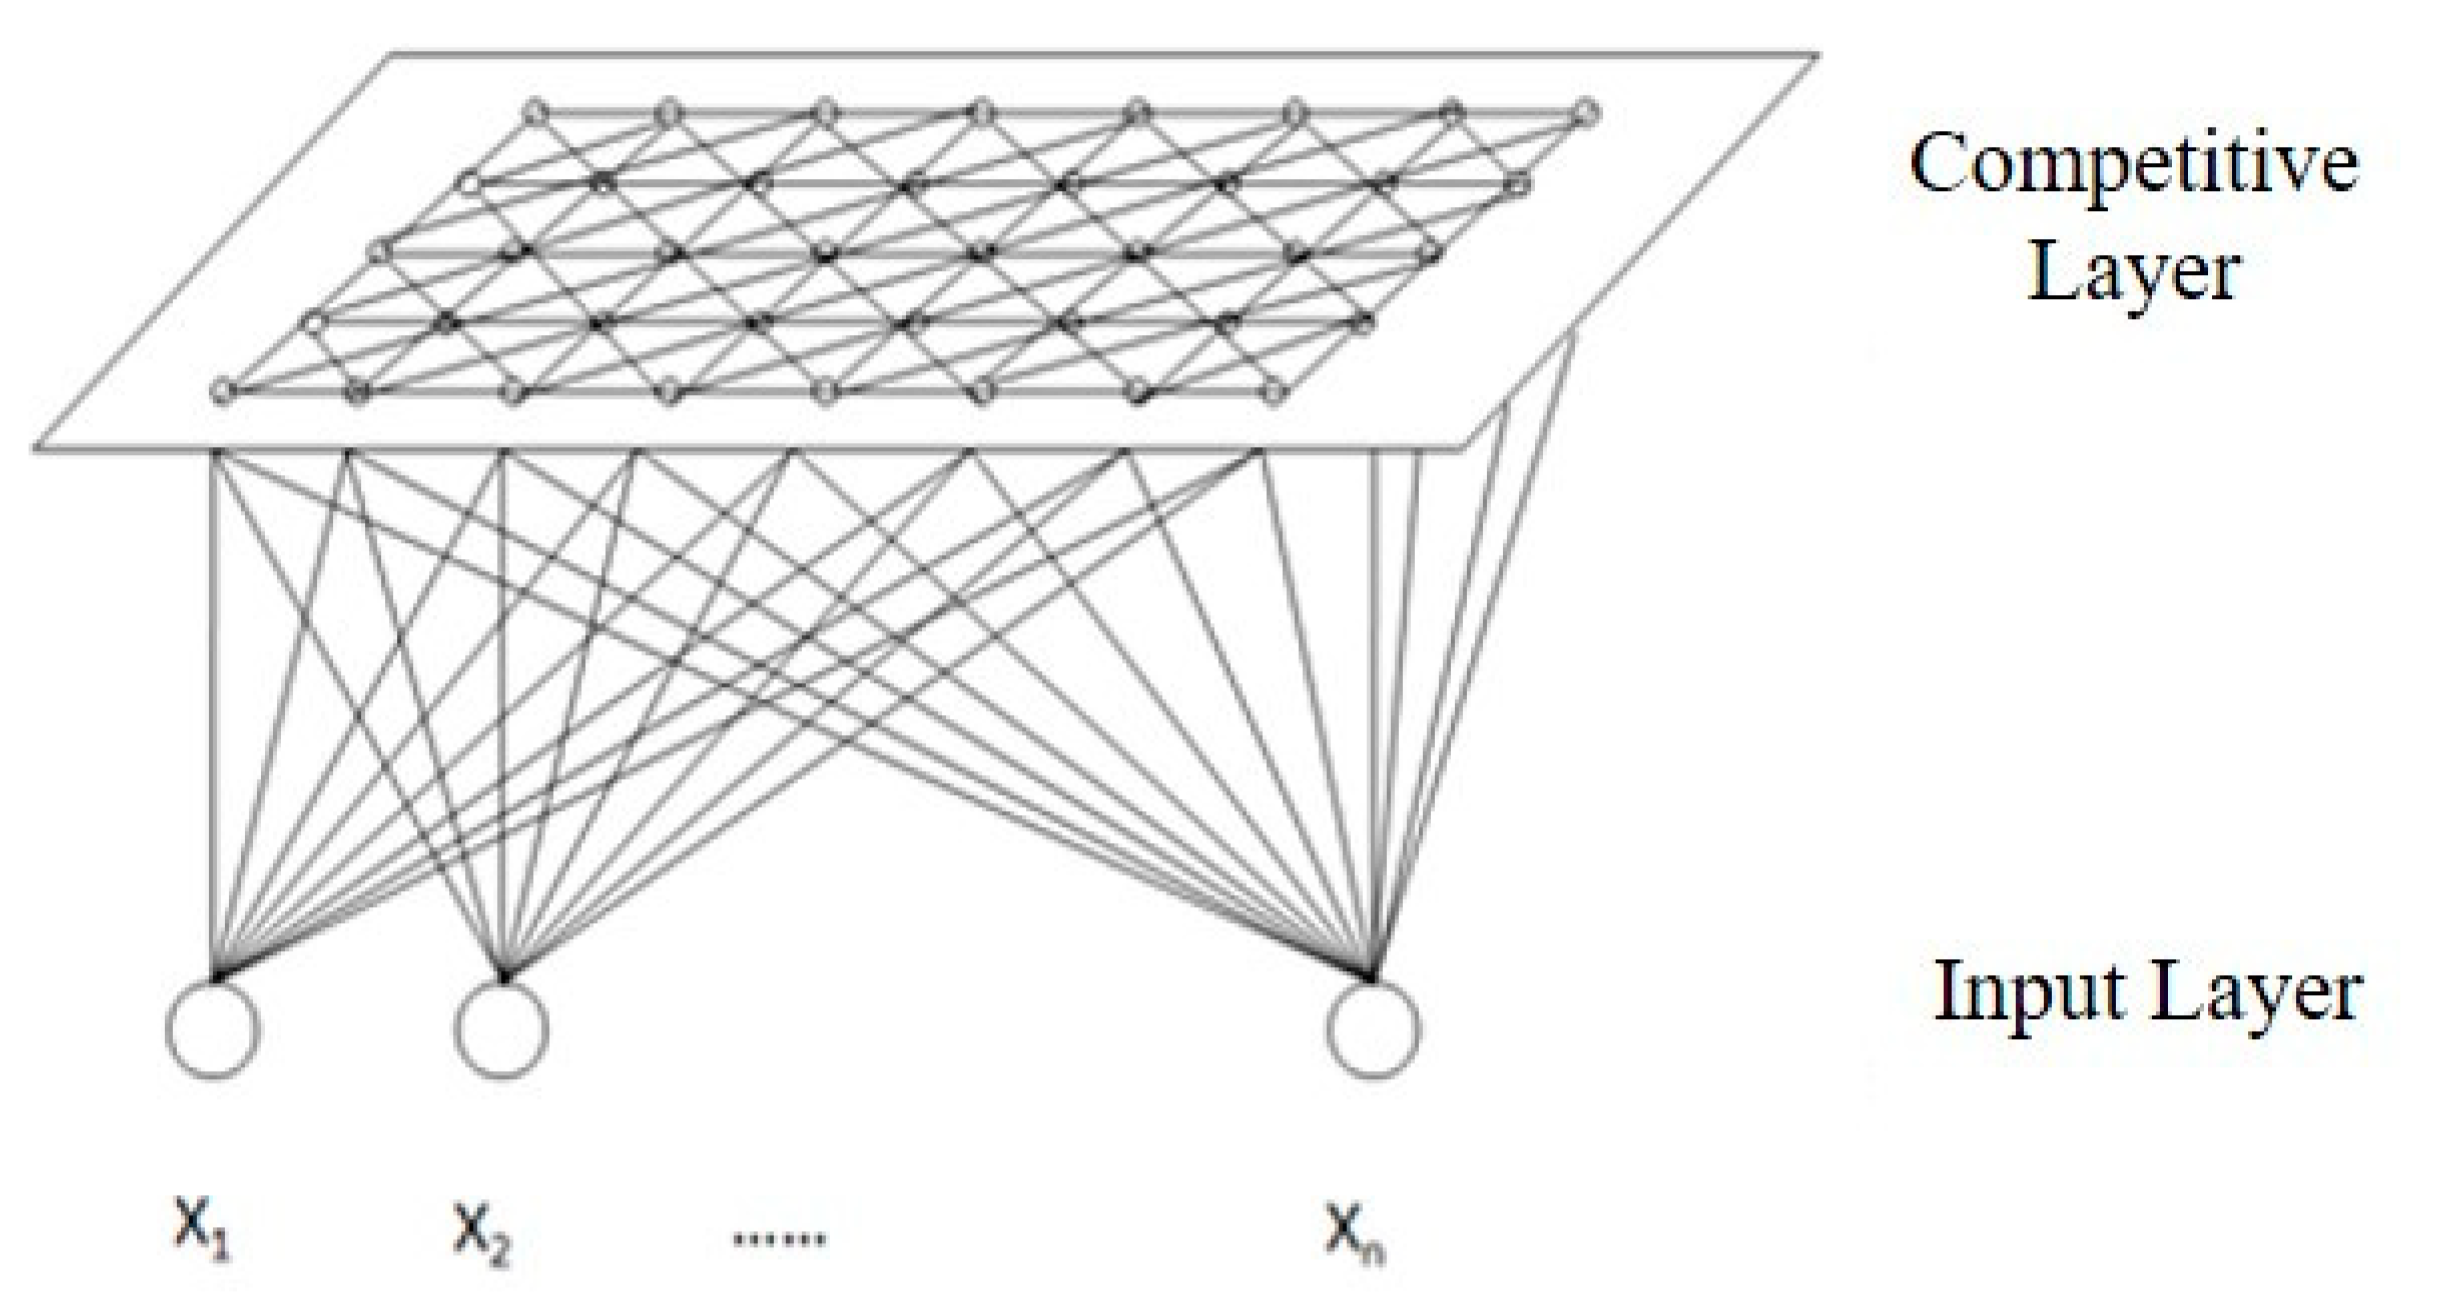
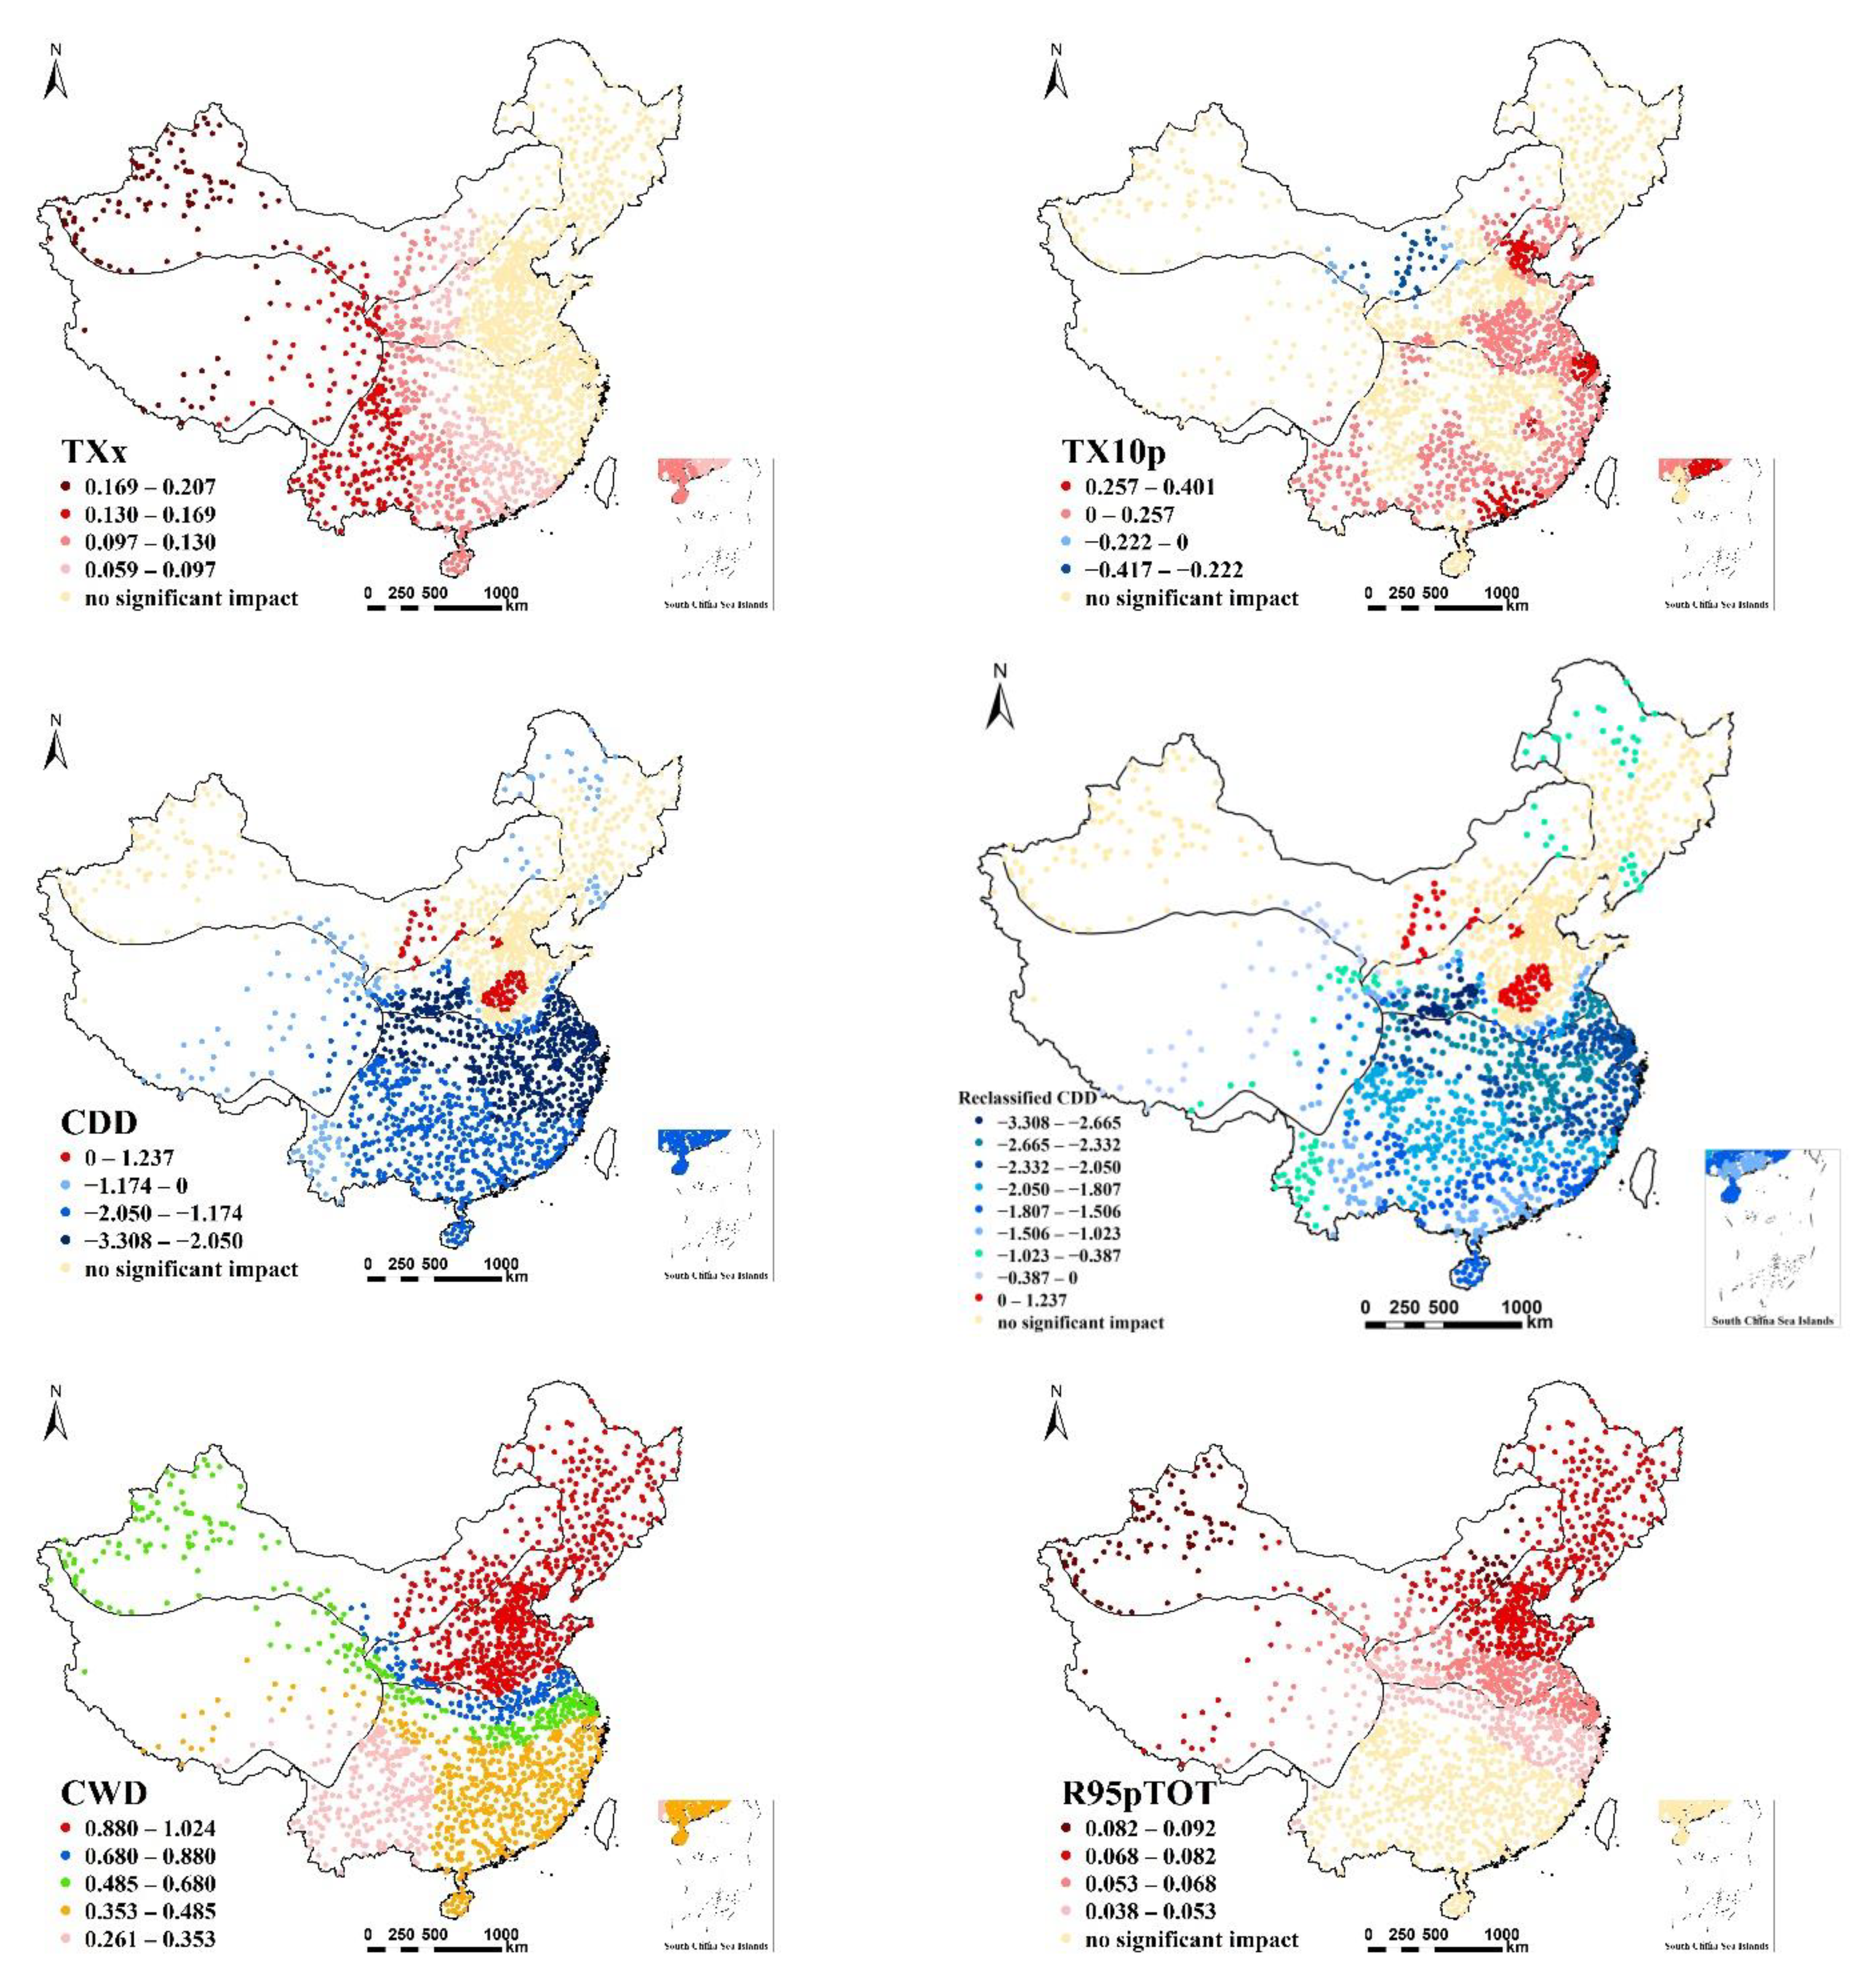
In this section, R95pTOT, which showed no apparent spatial difference in China, was removed, and the regression coefficients of the other four extreme climate indices and vegetation indices were used as clustering indices. The regression coefficients were inputted into the SOFM network for training, until the topology of the network remained basically unchanged. Given that this analysis seeks to identify the dominant elements in each category and the significance of influence, the number of categories was set as five.
3.2.1. Clustering Results and Test
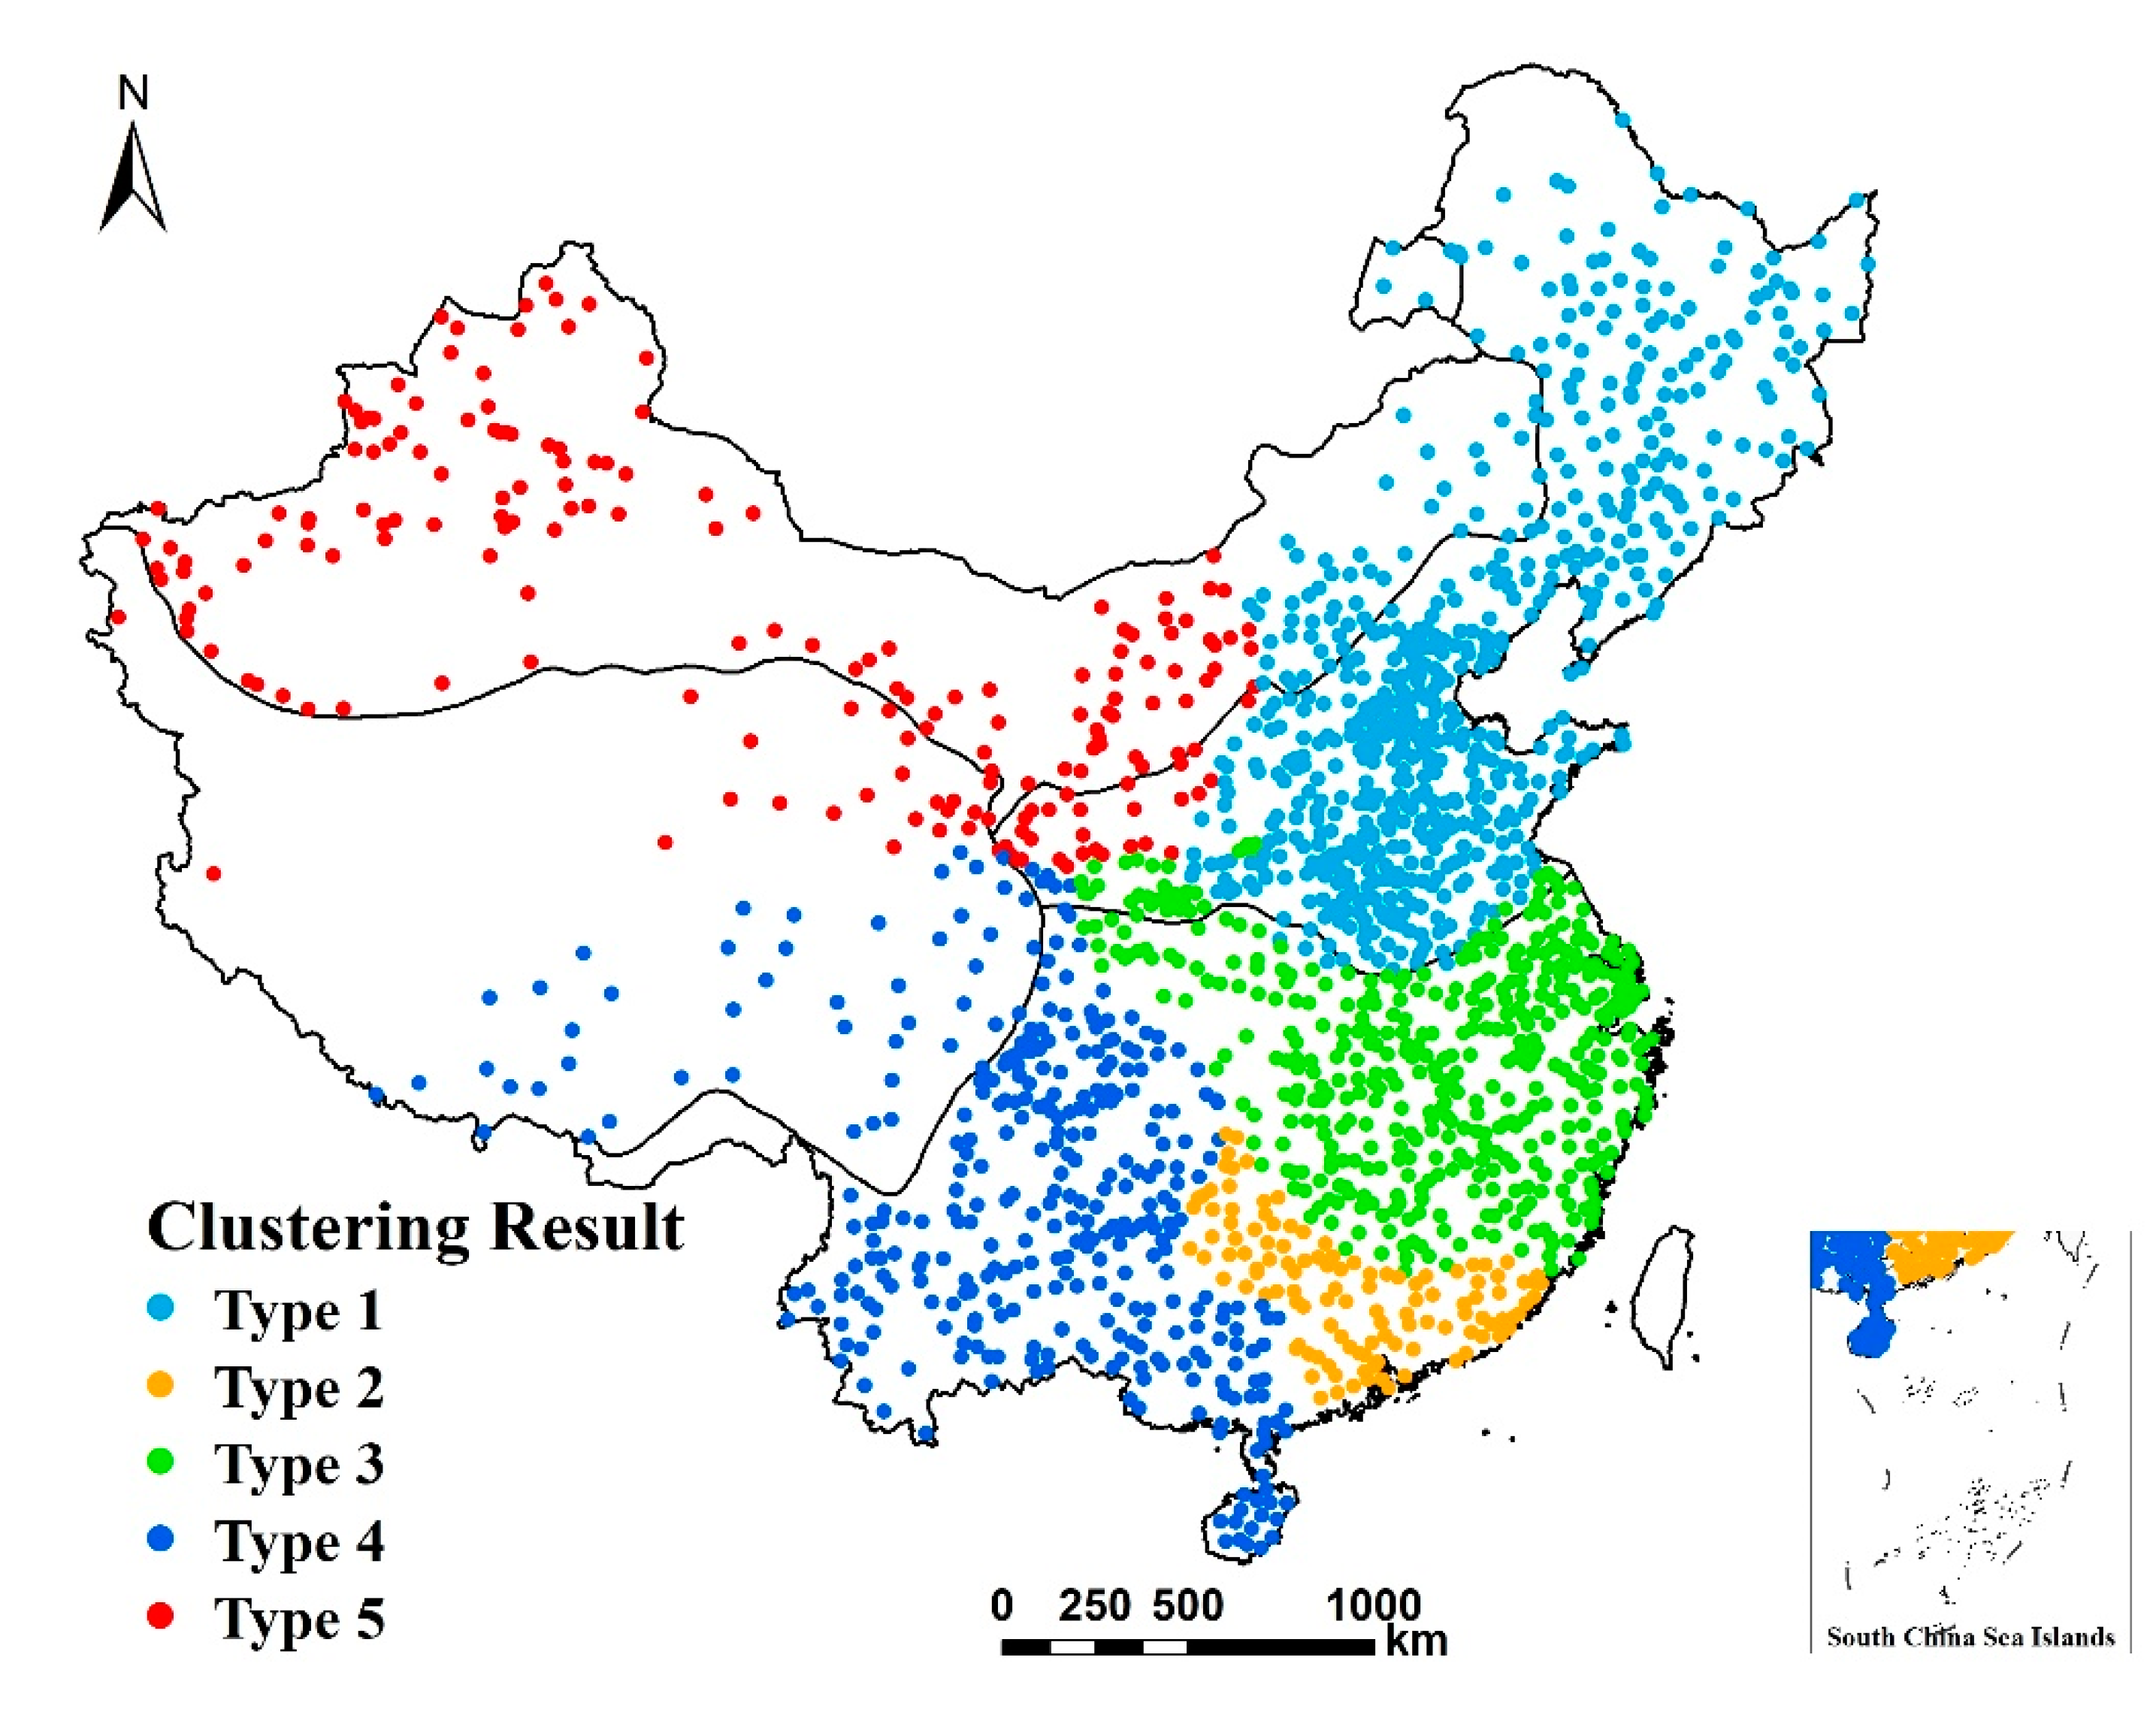
The spatial pattern of the clustering results affecting NDVI is shown in
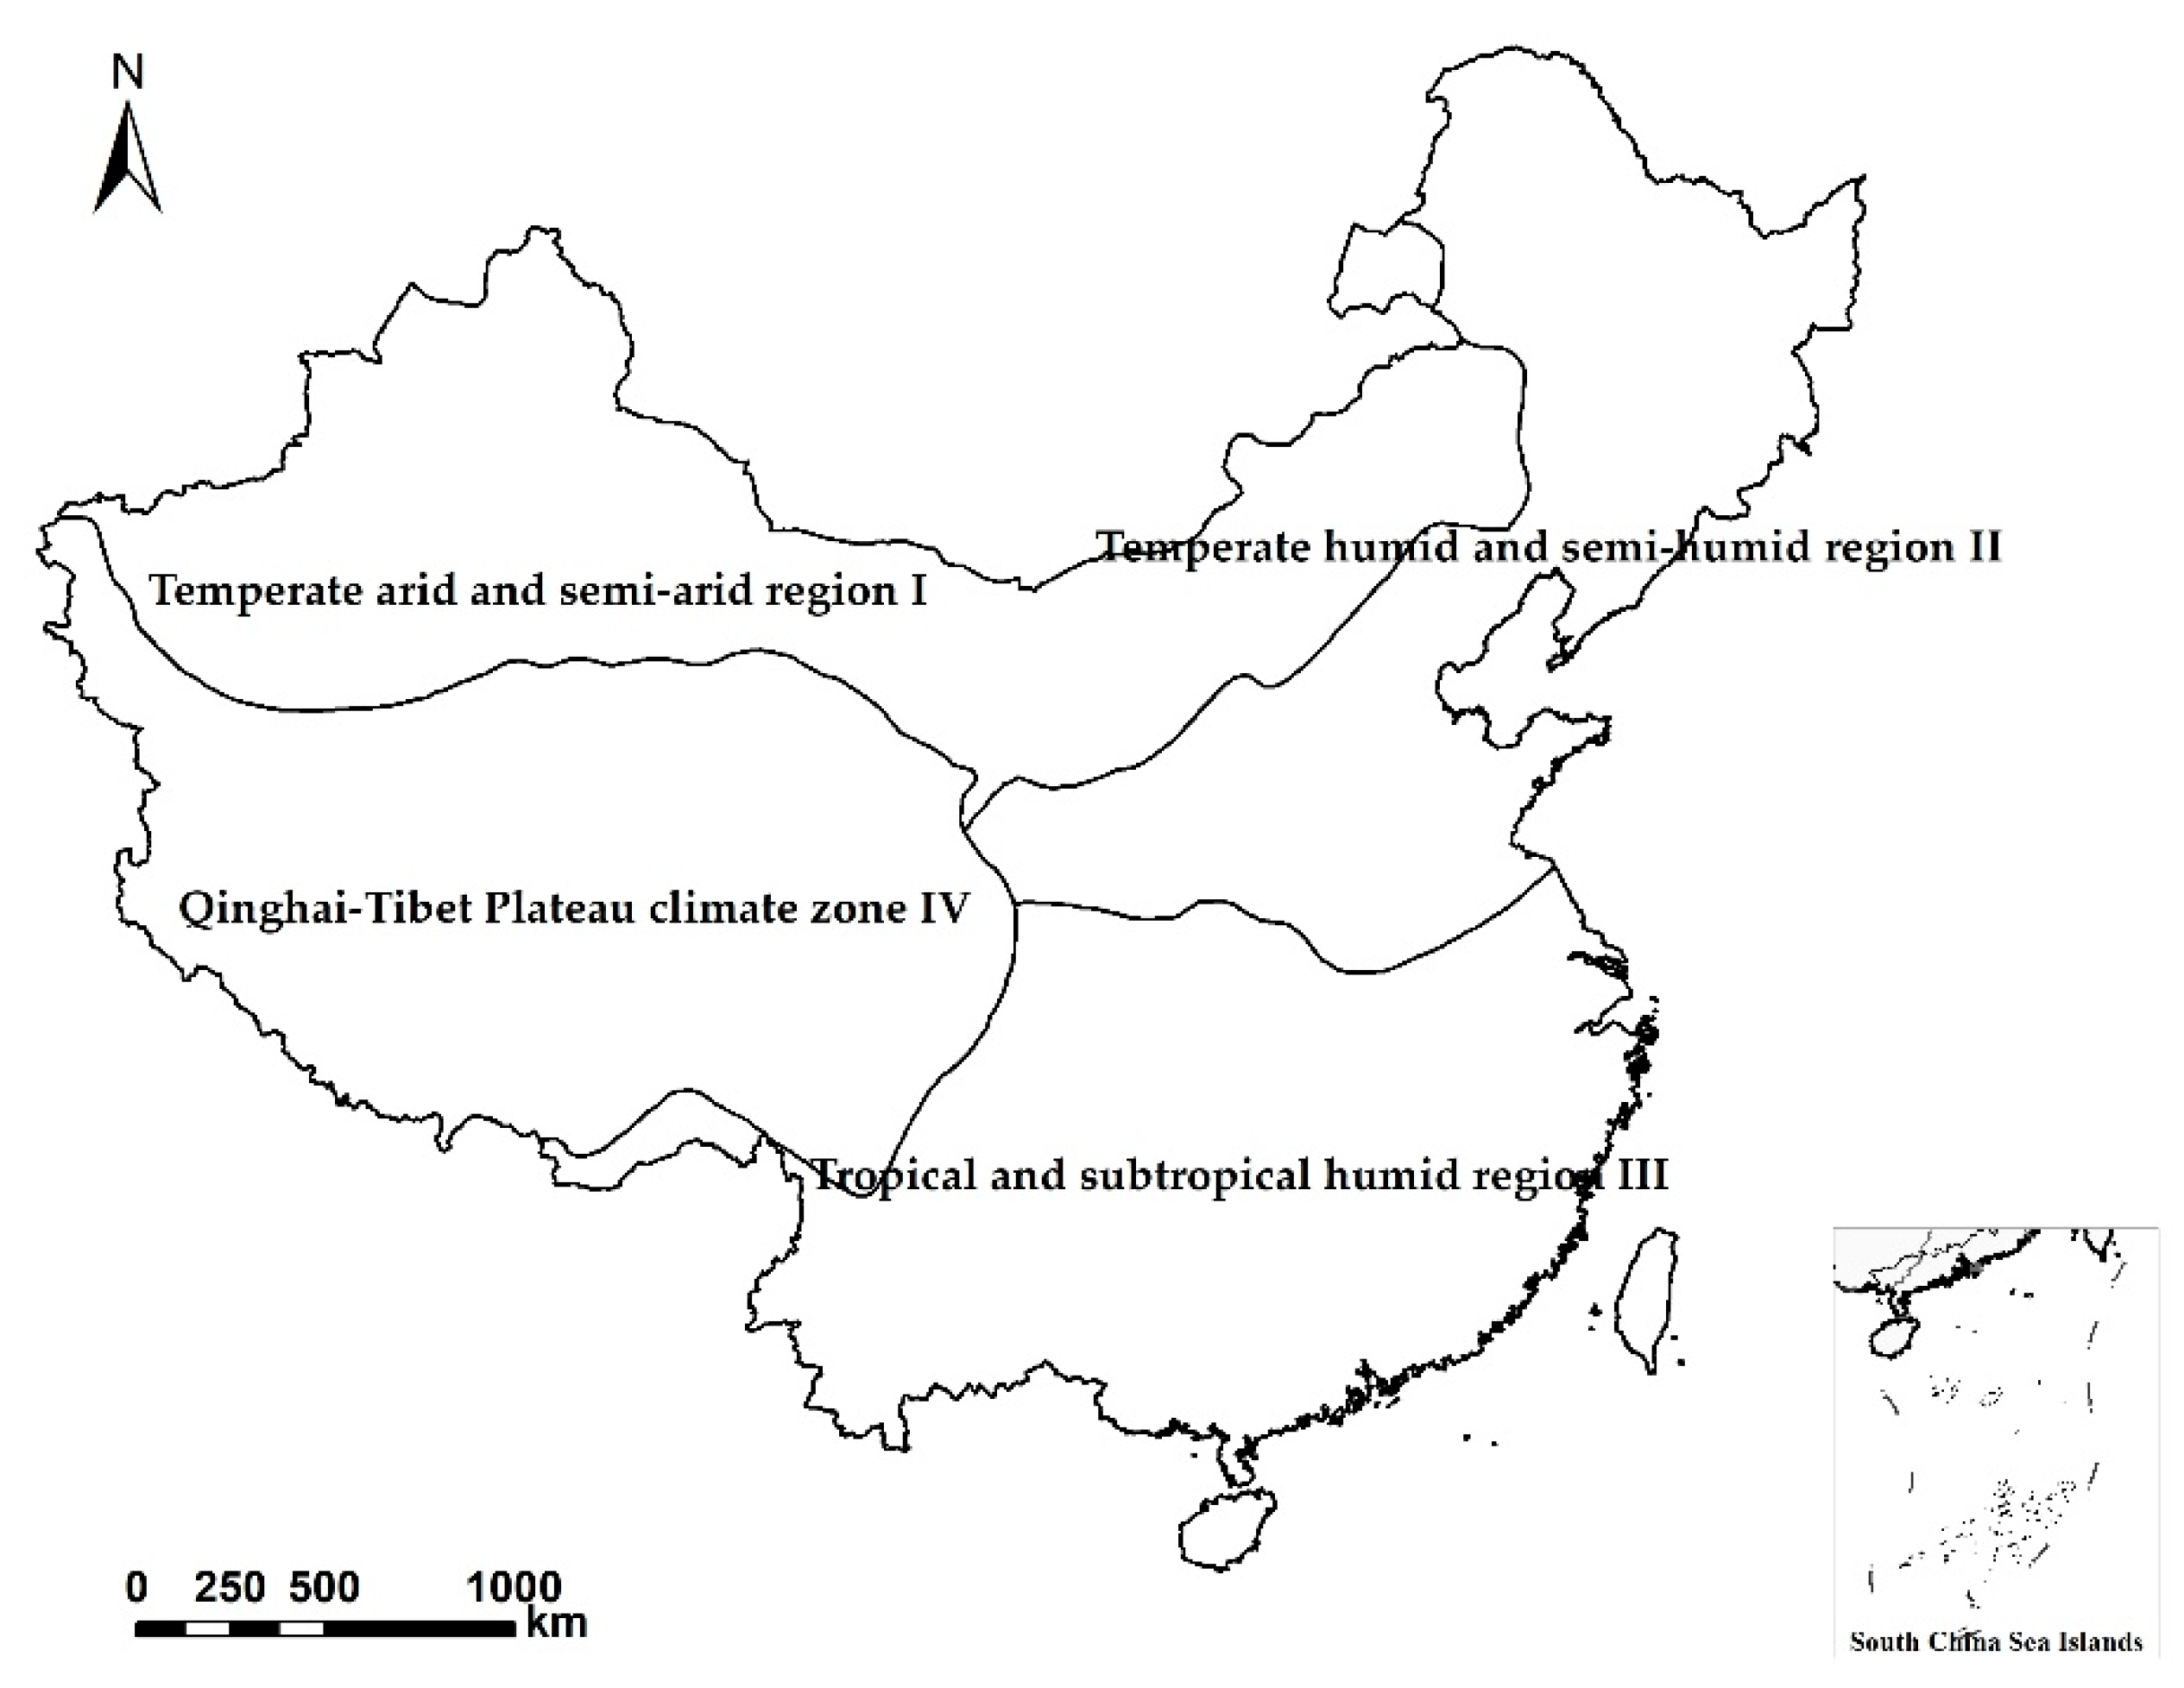
Figure 5. The spatial agglomeration characteristics of the five types are obvious. Type 1 is mainly distributed in the Northeast Plain and the North China Plain, in the temperate humid and semi-humid regions, and in the eastern parts of the temperate arid and semi-arid regions. Type 2 is distributed in the southern part of the tropical and subtropical humid areas of Guangdong Province, and on the boundaries of Guangdong and Fujian, Hunan and Guangxi, and Hunan and Guizhou. Type 3 is mainly concentrated in the north and east of the tropical and subtropical humid regions, such as the middle and lower reaches of the Yangtze River plain and the surrounding area. Type 4 is located in the Qinghai–Tibet Plateau and the transitional zone between the region and tropical and subtropical humid areas, including the southeastern part of the Qinghai–Tibet Plateau, the Sichuan Basin, the Yunnan–Guizhou Plateau, most of Guangxi, the Leizhou Peninsula, and Hainan Island. Type 5 is mainly located in the central and western areas of the temperate arid and semi-arid regions, the northeastern part of the Qinghai–Tibet Plateau, and most of the Loess Plateau.
In order to test the rationality of our classification, one-way ANOVA was performed in SPSS to test whether there were significant differences among all five types, as well as between sets of two types. Given space restraints, we have only listed the results for CDD as a table, and the rest of the indices will be described.
Following the overall analysis of variance (
Table 5), the significance test results of the impact of the four extreme climate indices on NDVI were all less than 0.01, suggesting extreme significance. There were extremely significant differences among the five types, indicating that the classification was generally scientific and reasonable. According to the results of the multiple variance analysis of the impact of CDD on NDVI (
Table 6), there were no significant differences in the effects of CDD between Type 1 and Type 5, or between Type 2 and Type 4, since they did not pass the significance test. However, all the other pairs showed significant variation in terms of the influence of CDD. The five types of impacts of CWD, TX10p and TX
x all passed the pairwise significance test, with significant differences.
3.2.2. Analysis of the Regional Dominant Factors of the Impact of Extreme Climate on NDVI
On the basis of the above classification test, the difference between the mean value of the regression coefficients of different extreme climate indices in each type and the national mean value was calculated to judge the magnitude of the impact. The results are shown in
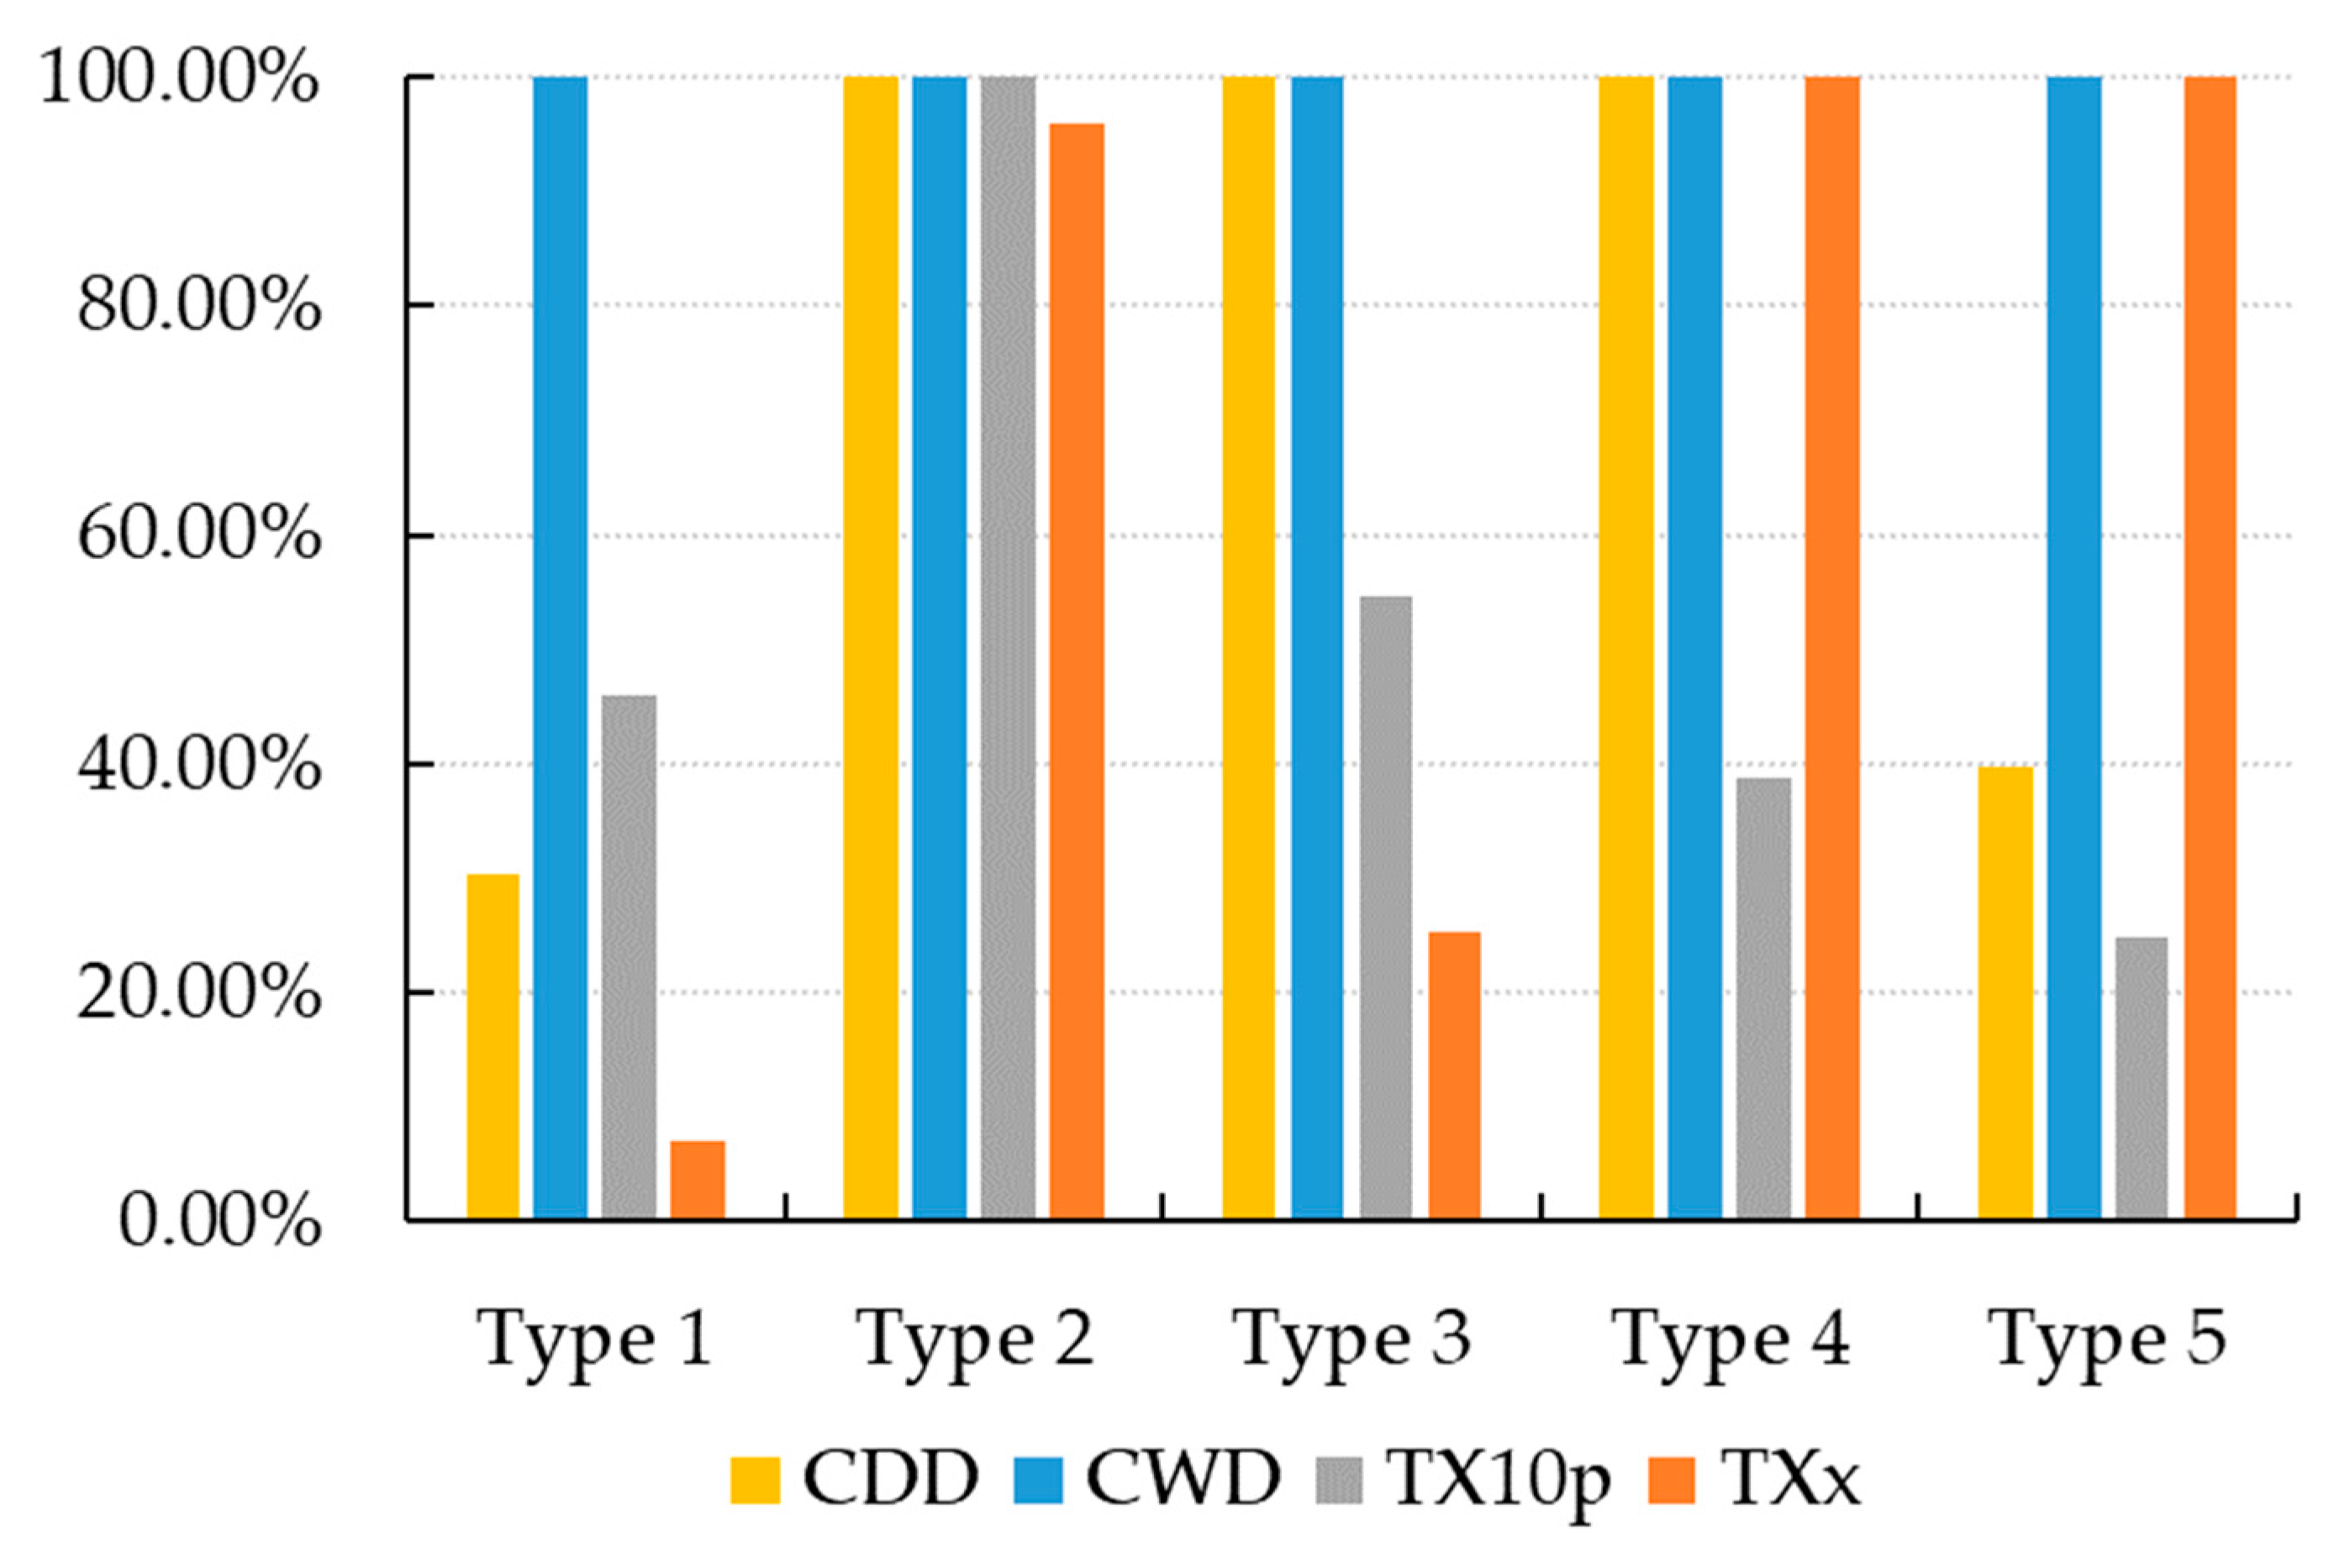
Figure 6. For the convenience of comparison, the difference in CDD was calculated after taking the absolute value of the regression coefficient into account. Through the size of the value of difference, we can judge the “intensity” of the impact of the extreme climate index on vegetation. Based on the results of the analysis of regression coefficients, the regression coefficients of some sites did not pass the significance test (their influence was not significant). Therefore, the significance test should be taken into consideration when identifying specific features of each type. We calculated the percentage of sites that passed the significance test for the different extreme climate indices in each type. The results are shown in
Figure 7. According to the proportion, the impact scope of each extreme climate index on vegetation in different types can be identified. At the same time, the proportion can be used to examine the results of impact intensity. The elements with a higher proportion of sites passing the significance test and greater influence intensity are the dominant ones.
In Type 1, as regards the influence of CWD, the proportion of sites passing the significance test is the highest, reaching 100%. The proportions of each of the other three extreme climate indices are below 50%. In this region, CWD has the largest influence scope on vegetation. In the assessment of difference, the influence intensities of CWD and TX10p are both higher than the national average, but the degree of deviation of TX10p is low. In general, the NDVI in this area was mainly affected by CWD, in terms of both geographical area and intensity, in the 18 years studied.
In Type 2, all sites passed the significance test for CDD, CWD and TX10p, but not TXx, for which this proportion was slightly lower. Besides CWD, the degree of influence of the other three indices were all higher than the national average, among which CDD had the largest influence. As shown by the horizontal comparison of the five types, TX10p in Type 2 is present at the highest level, and has the greatest influence among the five types. In general, the Type 2 region is mainly affected by CDD and TX10p.
In Type 3, the proportion of CDD and CWD sites passing the significance test was 100%, followed by TX10p. In terms of influence intensity, CDD and TX10p were above the national average, and the deviation of CDD was the most obvious and was the greatest among the five types. In short, the vegetation in this region was mainly affected by CDD in the 18 years studied.
In Type 4, all extreme climate indices except for TX10p at all sites passed the significance test (100%), and a large range of influence was shown in this region. The influence intensity of both CDD and TXx was higher than the national average. CDD showed the strongest intensity in this region, and the influence intensity of TXx here was second only to this feature’s intensity in Type 5, which is the region most affected by TXx. In conclusion, the vegetation in the Type 4 region was strongly affected by CDD and TXx.
Type 5 is mainly influenced by CWD and TXx in spatial scope, and the sites of both indices passed the significance test up to 100%. In this region, the CDD was below the national average, and showed a higher degree of deviation, close to that of Type 1, which also explains why there was no significant difference in CDD between Type 1 and Type 5 according to the multiple analyses of variance. The value of CWD was higher than the national average, and its influence intensity was second only to that of Type 1, which showed a strong influence. TXx showed the greatest change in intensity. Considering the proportion of sites passing the significance test, and the intensity of influence, we can assert that the vegetation in this area is mainly affected by the compound influence of CWD and TXx.
Based on the results of the comprehensive type analysis, those factors with a degree of influence above the national average are labeled “+”, and those whose influence degree deviates significantly are labeled “++”. Those below the national average are marked “−”, and those deviating significantly are marked “− −” (
Table 7). According to the characteristics of the different dominant factors, the five types can be described as follows: the humidity-promoting type; the cold-promoting and drought-inhibiting compound type; the drought-inhibiting type; the heat-promoting and drought-inhibiting compound type, and the heat-promoting and humidity-promoting compound type. Correspondingly, vegetation in different areas can be susceptible to the adverse effects of different extreme climate events in the future. In the Type 1 areas, the vegetation was mainly enhanced by extreme precipitation, which means that the vegetation in this area is more adapted to the humid environment. As such, this type will be more sensitive to drought in the future. Type 2, showing an increase in TX10p, showed higher NDVI and a better vegetation condition. However, this is inhibited by CDD. Therefore, in this region, we should pay more attention to preventing the risks of heat wave and drought. Type 3 was shown to not be significantly affected by other indices, and was mainly inhibited by drought (the factor with the highest intensity). In the future, dry conditions caused by the intensification of extreme drought in this region should be addressed. Type 4 showed similar properties to Type 2: it is an area affected simultaneously by extreme temperature and extreme precipitation. This area was shown to be subjected to obvious inhibitory effects by drought, which verifies the multiple analysis of variance for these two types in terms of CDD. Compared to Type 2, the vegetation in Type 4 regions was mainly enhanced by heat events, implying the higher risk of extreme cold events in the future. Type 5 is also a composite type, which is enhanced by high temperatures and is at high risk of damage as a result of cold waves in the future. Meanwhile, the extreme precipitation level also promotes the growth of vegetation in this region. If the extreme precipitation decreases, the vegetation is more likely to be inhibited, and so the risk of drought to vegetation here is high. In general, Type 2, Type 4 and Type 5 are all under the compound influence of extreme temperature and extreme precipitation, while Type 1 and Type 3 are influenced primarily by single factors.


 ,
, 


