Article

Integrated Operational Model of Green Closed-Loop Supply Chain

1
Department of Industrial Engineering and Management, National Taipei University of Technology, Taipei 10608, Taiwan
2
Mirle Automation Corporation, Hsinchu 30076, Taiwan
*
Author to whom correspondence should be addressed.
Sustainability 2021, 13(11), 6041; https://doi.org/10.3390/su13116041
Submission received: 28 February 2021 / Revised: 18 May 2021 / Accepted: 20 May 2021 / Published: 27 May 2021

Abstract

:
Due to increasing environmental awareness, companies have started embracing the green supply chain concept to reduce waste of resources. Based on this increased awareness, an integrated green closed-loop supply chain has been developed, which integrates the forward supply chain and reverse supply chain. The reverse supply chain follows the same path as the forward supply chain in the reverse direction to recycle used products. Due to the uncertain quality of used products, not all products can be selected for recycling and reproduction, as the reduced yield might decrease the overall net income in the supply chain. The study develops an evaluation model to consider government subsidy, used product recycling rate, and quality of the used products to explore their impacts on the entire system. The results show that when the reproducibility rate of used raw materials decreases, the net income would also decrease accordingly. Furthermore, when government subsidy increases, the net income of the supply chain also increases accordingly. Similarly, when the recycling rate of used products increases, the net income also increases. As government subsidy affects the net income more than the recycling rate of used products, this research concludes that government subsidy is a key factor in the green closed-loop supply chain.

1. Introduction and Background

The rapid development of manufacturing technology and the growth of the economy have increased environmental pollution and caused significant climate change. To address this issue, the United Nations Conference on Sustainable Development held in 2012 raised the topic of green economy. Green economy is one of the important tools to achieve sustainable development, maintain economic growth, increase social tolerance, improve human welfare, and create job opportunities, while protecting the ecological environment.
Green economy is a new form of economy that strives for sustainable development without sacrificing environmental quality. Pearce [1] compiled a report that presents the cost of environmental pollution for the Ministry of Environment in the United Kingdom and hoped the government could create a taxation system to reduce environmental pollution and protect the environment. The National Development Commission (2015) in Taiwan embraced green economy by setting out directions and strategies to protect the environment and achieve sustainable development.
In many countries, governments have established some laws and regulations to control and reduce companies’ carbon footprint. For example, European governments have implemented laws to ensure sustainable operation and development of their environment; Asian governments have also promoted related laws and regulations.
Supply chain, which involves sourcing, making and delivery of products to customers, creates environmental impacts that cannot be ignored. Therefore, governments have made policies and implemented regulations of environmental protection in the supply chain. Many companies responded by adopting green supply chain management practices that incorporate ecofriendly concepts into the supply chain to reduce environmental risks.
Since a green supply chain is the goal of current enterprise practice, Lin Zhifan (2010) integrated a forward supply chain and a reverse supply chain and built a fuzzy multi-objective-integrated operation research model to maximize the profit of the integrated supply chain. Tiwari et al. [2] developed a closed-loop supply chain model and added the concept of green supply chain to reduce waste of resources and maximize profits. Therefore, based on these studies, this research aims to establish a green supply chain system that recycles used products to reduce waste of resources and bring more profits to companies.
This study explores the impact of a closed-loop supply chain system on revenue and simulates the system using a mathematical model. Quality difference of used raw materials is added to the basic model to determine its effect on the net profit in the supply chain system. Next, sensitivity analysis is conducted to find the most influential decision-making parameters in the supply chain system.

1.1. Green Supply Chain Management

Supply chain management (SCM) is the management of the flow of goods from raw materials to the delivery of final products to consumers. Proper SCM is critical to gain a competitive advantage for enterprise organizations. The integration of business processes among supply chain members is a key factor for the ultimate success of an enterprise. SCM involves three elements: supply chain network structure, supply chain business process, and management components [3].
Narasimhan and Carter [4] mentioned that governments and enterprises are facing the pressure of global environmental protection, such as reducing environmental pollution, reducing waste generation and using green raw materials. In order to solve this problem, many enterprises adopted green supply chain management (GSCM), which combines SCM and environmental protection to achieve balanced development in environmental conservation and business operations. With the increase in environmental awareness in the last ten years, a growing number of experts and scholars believe that the wastes generated in manufacturing processes should be reduced, and wastes that can still be used should be recycled to achieve a green supply chain.
The three concepts of GSCM, namely, no waste and no pollution, no undesirable ingredients, and no side effects, run through the entire supply chain. Ashley [5] proposed that intelligent planning and design can effectively reduce environmental pollution, and this is the best way to protect the environment. Therefore, in a green supply chain, environmental protection features are considered in designing new products. The environmental design goals include disassembly, recyclability, maintainability, rework ability, and reusability.
GSCM is an important strategy for companies to improve performance [6], reduce environmental risks [7], and improve environmental conservation [8]. However, for an organization, it cannot only focus on environmental issues, its productivity and profit must also be taken into consideration. In addition, Pagell, Yang, Krumwiede and Sheu [6] pointed out that green supply chain aims at integrating eco-friendly concepts into traditional supply chain and developing reverse supply chain. Using a multi-objective green supply chain optimization model, Sheu et al. [9] reported that total net profit can be increased by 21.1% compared to the existing operating performance. Some companies believe that green supply chain is beneficial to them, for example, Chinese automakers implemented GSCM to obtain market profits and reduce environmental risks to improve overall economic and environmental performance [10].
There are some further studies about GSCM. For example, Lin Zhifan (2010) proposed a fuzzy multi-objective integrated operation research model and considered green supply chain factors to achieve the effect of environmental protection. In addition, government subsidies were also taken into consideration. The results showed that the subsidy policy has a positive relationship with the recycling of used products. When subsidies increase, the profits of the reverse supply chain also increase. Song and Gao [11] conducted a quantitative analysis of a green supply chain model under revenue sharing contract. Their research found that retailer-led contract can improve the greening level of products and enable manufacturers and retailers to obtain higher profits. Therefore, the establishment of green supply chain and cooperation between upstream and downstream become more meaningful.

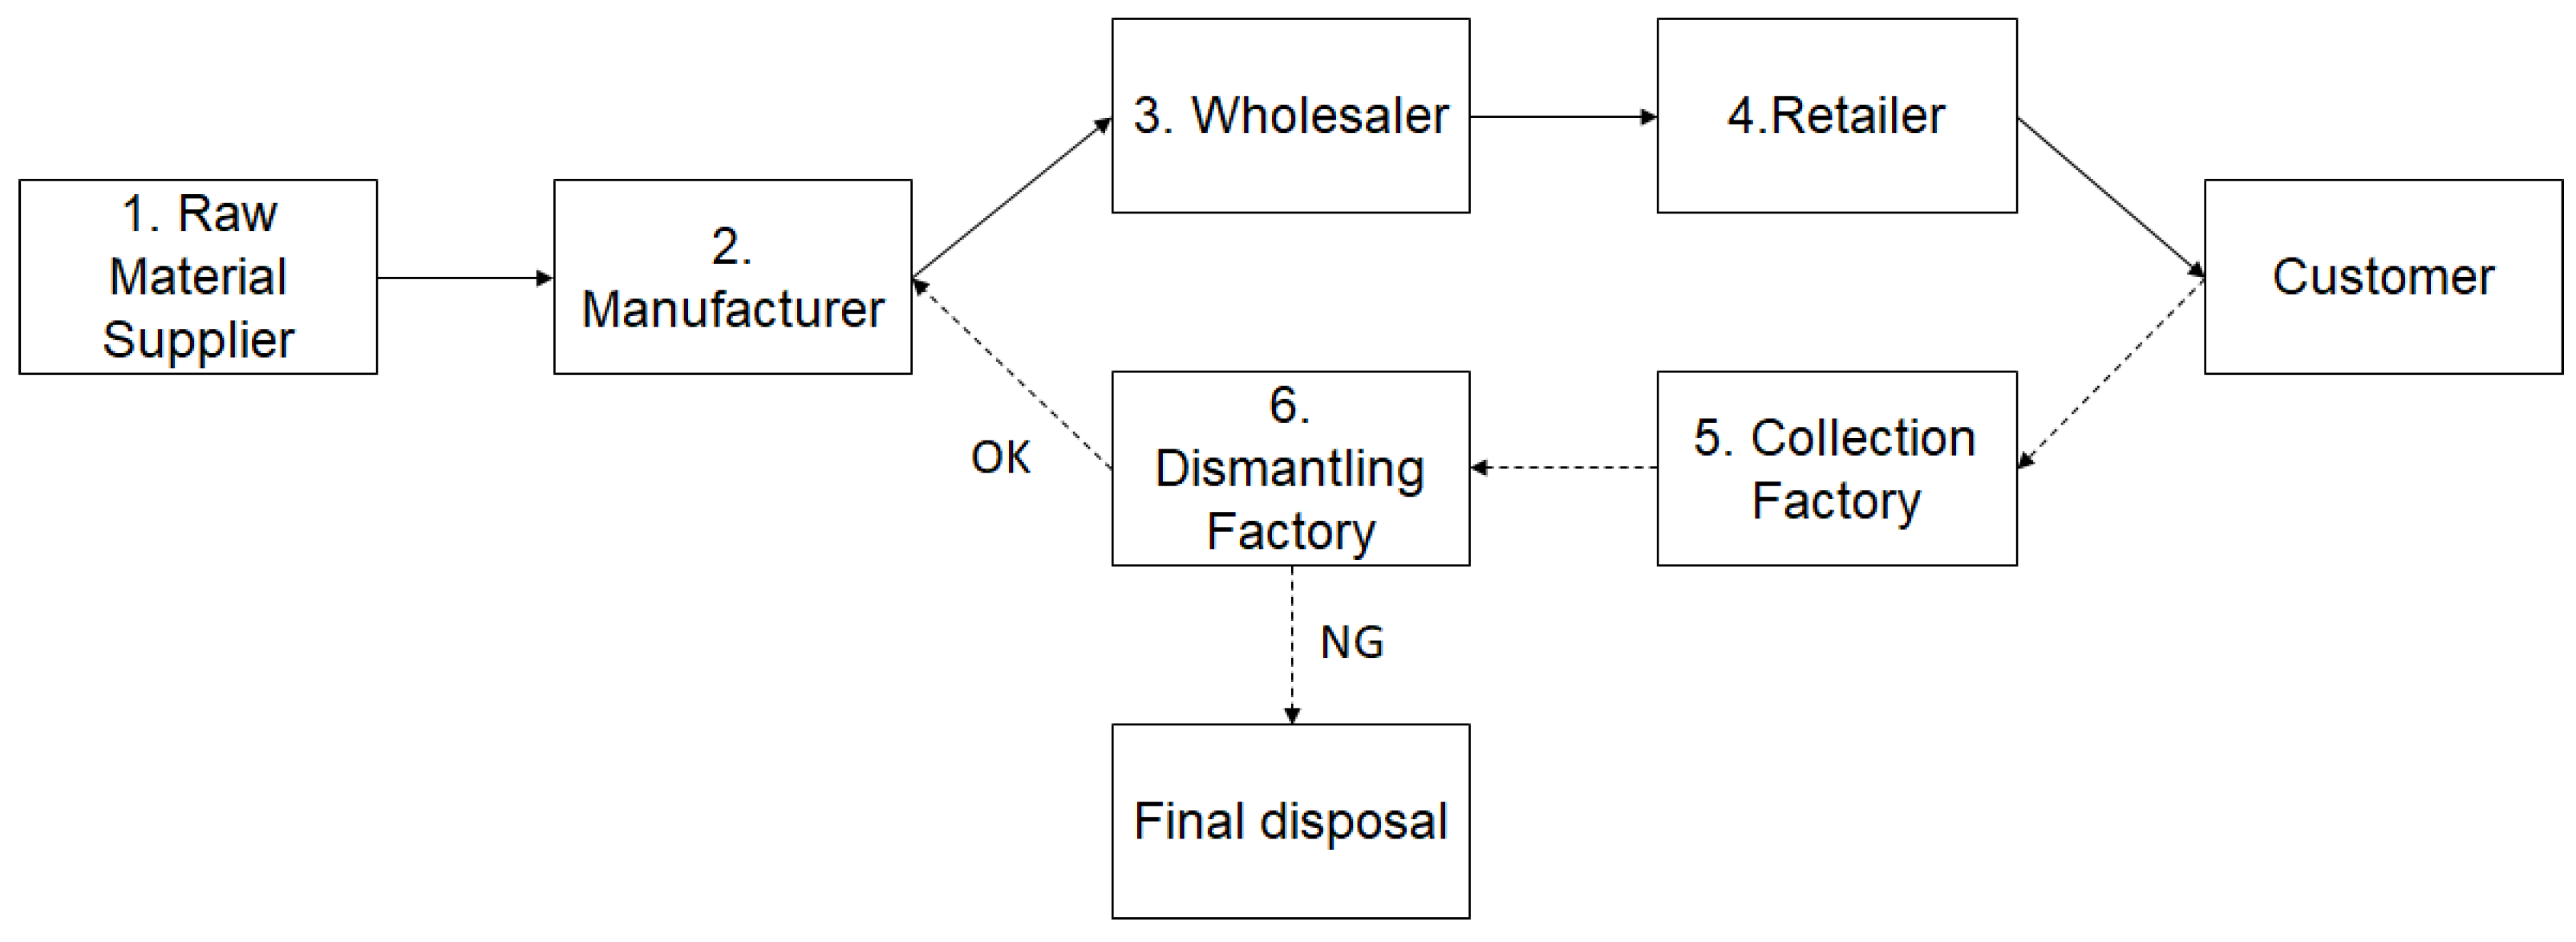
1.2. Closed-Loop Supply Chain

Closed-loop supply chain (CLSC) is a new logistics concept that was proposed in 2003 to tackle external environment deterioration, resource shortages, and legal restrictions. The purpose of CLSC is to control material flow to reduce the discharge of pollutants and waste and also to be able to manufacture at a lower cost. Compared to the traditional supply chain, CLSC has more operations such as recycling, testing, screening, remanufacturing, and redistribution. As materials are controlled in the loop, CLSC can reduce the damage and adverse effects on the environment in the supply chain activities. CLSC focuses on recycling products from customers and remanufacturing them.
In the process of remanufacturing within a CLSC, the manufacturer recycles customers’ used goods, disassembles, repairs or remanufactures them, and finally sells them as new products [12]. In addition, the purchase costs and remanufacturing costs are incurred in the reverse supply chain of acquiring used products. CLSC, it is believed, can help companies improve their operational capabilities and economic feasibility [13], maximize customer satisfaction and total supply chain profits [14,15], reduce total costs and the rate of carbon dioxide emissions in the entire network environment [16]. By designing a simple coordination mechanism, the retailer’s profits and recycling costs in the supply chain can be balanced in the system. Recycled products can make a certain profit in the reverse supply chain [17].
Tiwari, Chang, Tiwari and Kandhway [2] added the concept of green supply chain into CLSC to reduce waste of resources by recycling electronic components and achieve the purpose of maximizing profits and minimizing carbon footprint. Green closed-loop supply chain (GCLSC) is an extension of CLSC. In addition to the characteristics of CLSC, it also incorporates the concept of environmental protection into the supply chain, including green design and green manufacturing to recycle materials and used products, to reduce their environmental pollution impact.

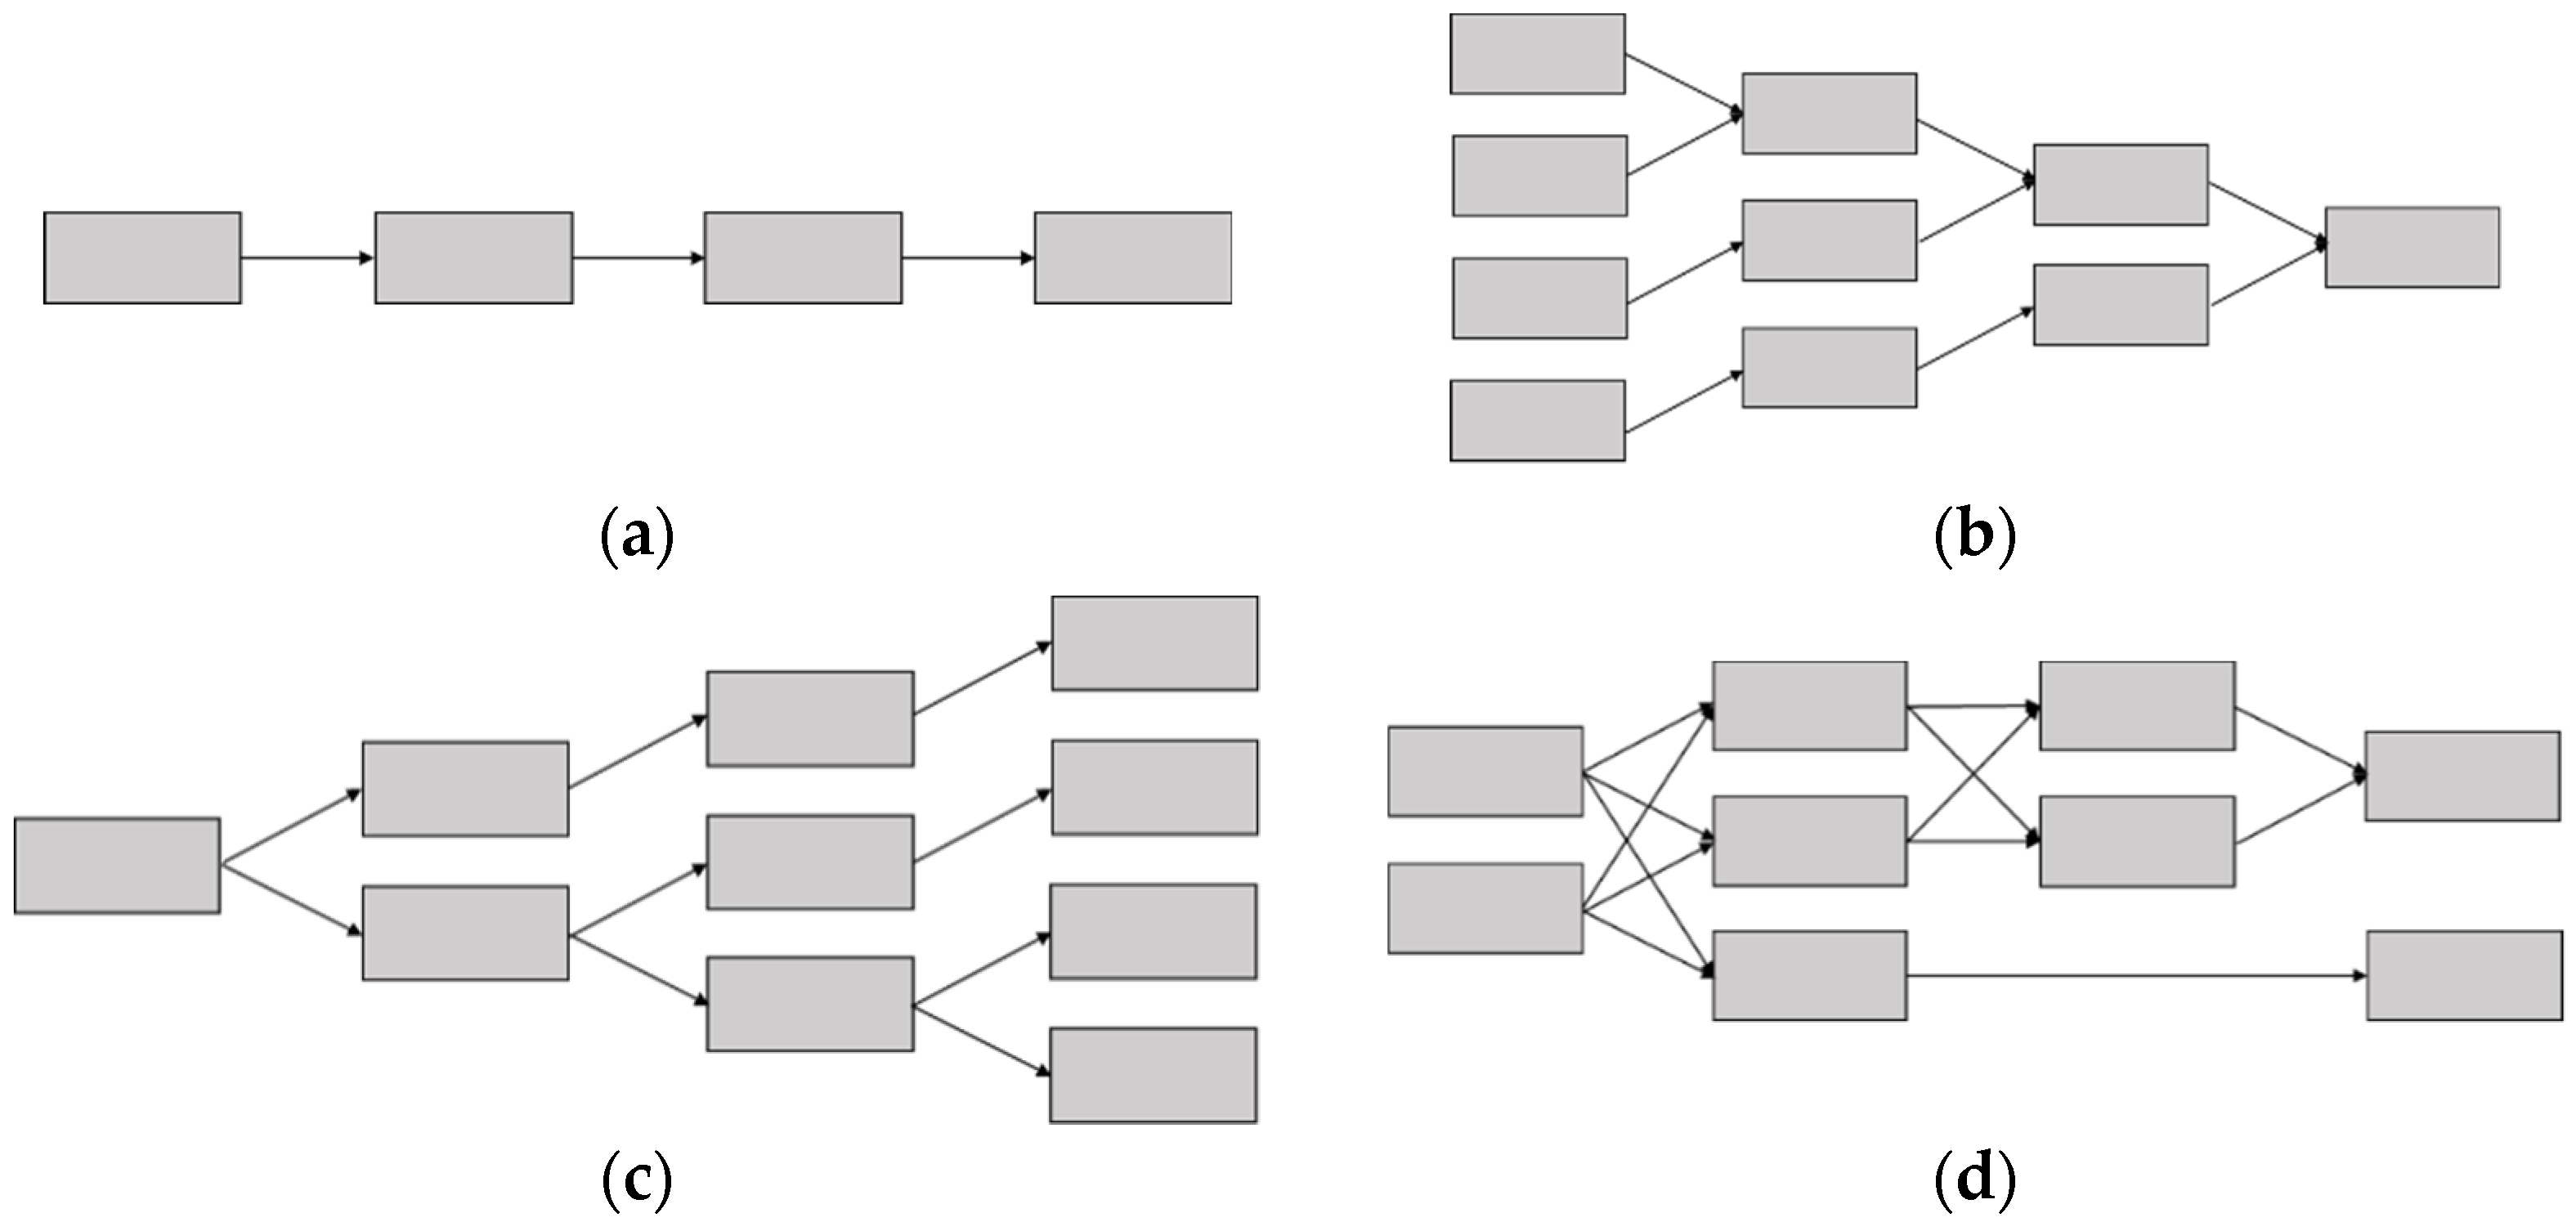
1.3. Multi-Level System

Manufacturers purchase raw materials from suppliers and process them, and after that, the finished products are sold to wholesalers, retailers or customers. The products reach customers through multiple stages, and this process forms a multi-level system. Each level may include suppliers, manufacturers, wholesalers, retailers, or other members of the supply chain. Howard [18] mentioned that the multi-level system can be divided into four types, namely, multi-level inventory serial system, multi-level distribution system, multi-level assembly system, and multi-level hybrid system. As shown below (in Figure 1):
As shown in Figure 1a–d, the multi-level model is the current mainstream, and it can consist of a different number of levels. There are two-level, three-level, and four-level models in the literature. This study designs a four-level model to include supplier, manufacturer, wholesaler and retailer.
Many scholars have used a multi-level system in their studies. For example, Cohen et al. [19] constructed a comprehensive model of a multi-level inventory system to optimize parameters and solve problems for a high-technology company. Chen [20] derived the best strategies for multi-level serial and assembly systems by which the materials move in fixed batches from one production stage to the next, as well as expanded the multi-level inventory theory. Federgruen [21] considered multiple products in a multi-level supply chain network design. The network design included multiple manufacturers, warehouses and distribution centers in unknown locations, and multiple customers in fixed locations. The purposes are to reduce the total network cost and operating cost and solve the problem of complexity. Chiu and Huang [22] proposed a multi-level just-in-time inventory model that enables a supply chain to deal with uncertain delivery times. According to [23], multi-level inventory management in a supply chain can reduce operating costs and quickly respond to customer needs in an increasingly competitive global market. Khalifehzadeh et al. [24] designed a four-level supply chain system that includes multiple suppliers, multiple manufacturers, multiple wholesalers, and multiple customers, with the goal of minimizing total operating costs.

2. Methodology

This research integrates forward and reverse supply chains to form a CLSC, as shown in Figure 2. The forward supply chain starts from suppliers who provide raw materials to manufacturers to make products and sell them to customers, while the reverse supply chain begins with the customers who send unwanted products to collection factories. A dismantling factory disassembles those used products and sells materials that can be recycled and reused to the manufacturer. Parts or materials that cannot be recycled are sent to a disposal site.
Each level in the supply chain is represented by numbers, namely, 1 for raw material supplier, 2 for manufacturer, 3 for wholesaler and dismantling factory, 4 for retailer and collection factory, 5 for customer, and 6 for final disposal.
This research uses LINGO to solve the problem and obtain the best solution according to the mathematical model constructed in Section 3.2. The solution process of this research plan is as follows: Step 1 defines and sets parameters and decision variables; Step 2 constructs a CLSC integration model; Step 3 uses Equations (1) to (11) to formulate a basic linear programming model to solve this integrated supply chain problem; Step 4 uses LINGO to solve the linear programming problem.
This study applies the data presented by Sheu, Chou and Hu [9] on the mathematical models formulated in Section 3.2. The study describes a case of a top three Taiwanese notebook manufacturer. The main sources of core components are new and recycled raw materials. The quality of products made with new and recycled components varies. Therefore, this research also adds the concept of quality difference of used raw materials to the basic model, naming it the adjusted model, in order to show and discuss the net income difference between the adjusted model and the basic model.
This study believes that the difference in the quality of new and recycled raw materials affects the manufacturer’s output, that is, recycled raw materials with poor quality cannot be made into products. Therefore, the overall net income declines with reduced output. In addition, this study also analyzes the sensitivity of different proportions of government subsidies (S) and used-product recycling rates (β) in the adjusted model to explore the impact of these two factors on net income and determine the most suitable parameter values and decision variables in the model.

2.1. Assumptions and Notations

The following assumptions are applied in this research to construct a mathematical model:
  • The end customer’s product demand is known and constant.
  • The model considers a single product only.
  • Out of stock is not allowed.
  • The facility and inventory capacities are known and constant.
  • The rework rate of used products, which is the proportion of used products that can be reworked in a dismantling factory (wholesaler), is known.
  • The used product recycling rate, which is the ratio of used products recycled by end customers, is known.
  • The production defect rate, which is the proportion of defective products in the manufacturer’s production process, is known.
  • The conversion rate of raw materials and products, which is the amount of raw materials that can be broken down for a unit of used product, is known.
  • The time frame is unlimited.
The notations of the parameters used in the basic model can be found in the nomenclature section.

2.2. Mathematical Models

2.2.1. Objective Function

This study integrates forward and reverse supply chains. The objective function (Equation (1)) of this model is to maximize net profit (NP), namely, aggregate revenues (AR)—aggregate costs (AC). AR includes manufacturing chain revenues (MR), reverse chain revenues (RR), and reverse chain subsidies (RS). This model contains a total of eight AC, namely, aggregate procurement cost (APC), aggregate manufacturing cost (AMC), aggregate inventory cost (AIC), aggregate transportation cost (ATC), aggregate collection cost (ACC), aggregate labor cost (ALC), aggregate final disposal cost (AFC), and aggregate transitional treatment cost (ATTC).
Max   NP = AR AC = ( MR + RR + RS ) ( APC + AMC + AIC + ATC + ACC + ALC + AFC + ATTC )

2.2.2. Revenue and Costs

This section lists the revenue and cost models separately. Equation (2) is the revenue model, and Equations (3)–(10) form the cost model. The detailed description is as follows:
  • AR is total revenue. It includes forward and reverse supply chain revenues, as well as government subsidy income, that is, the subsidy received from recycling used products. The subsidy targets are collection factories (retailers) and dismantling factories (wholesalers).
    AR = MR + RR + RS = t { [ i = 1 4 R i , i + 1 ( t ) × Q i , i + 1 ( t ) ] + [ i = 3 5 R i , i 1 ( t ) × Q i , i 1 ( t ) ] + [ s 4 s 3 S × Q i n t 43 ] + [ s 3 s 2 s × Q i n t 32 ] }
  • APC is total purchase cost. It includes the cost of raw materials, the purchase cost of raw materials, the purchase cost of used materials after disassembly, and the purchase cost of products.
    t { [ s 1 C r ( t ) × Q r ( t ) ] + [ s 1 s 2 C p 12 ( t ) × Q p 12 ( t ) + s 3 s 4 C p 32 ( t ) × Q p 32 ( t ) ] + [ i = 2 3 C p i , i + 1 ( t ) × Q p i , i + 1 ( t ) ] }
  • AMC is total manufacturing cost. It includes manufacturing cost and heavy industry costs.
    t { [ s 2 C m ( t ) × Q m ( t ) ] + [ s 2 C r e ( t ) × Q r e ( t ) ] }
  • AIC is total inventory cost. It includes raw material inventory cost, product inventory cost, and storage costs of unprocessed and processed used products.
    t { [ i = 1 2 s i C i r ( t ) × Q i r ( t ) ] + [ i = 2 4 s i C i n t ( t ) × Q i n t ( t ) ] + [ i = 3 , i 5 6 s i C i n t ( t ) × Q i n t ( t ) ] + [ i = 2 3 s i C i t ( t ) × i t ( t ) ] }
  • ATC is total transportation cost. It includes the transportation cost of forward and reverse supply chains, and the transportation cost from dismantling factories to the final disposal site.
    t { [ i = 1 4 C t i , i + 1 ( t ) × Q i , i + 1 ( t ) ] + [ s 4 s 3 C t 43 ( t ) × Q i n t 43 ( t ) ] + [ s 3 s 2 C t 32 ( t ) × Q i t 32 ( t ) ] + [ s 3 s 6 C t 36 ( t ) × Q i n t 36 ( t ) ] }
  • ACC is the total collection cost of obtaining used products from customers at collection factories.
    t { s 5 s 4 C c 54 ( t ) × Q i n t 54 ( t ) × β }
  • ALC sums up the labor cost at each level.
    t { i = 1 6 s i C l ( t ) × Q l ( t ) }
  • AFC is the total cost of the final disposal of used products.
    t { s 6 C f ( t ) × Q f ( t ) }
  • ATTC is total disposal cost of used products. It includes the processing cost of all used products in the reverse supply chain, except the final disposal.
    t { i = 2 4 s i C t r ( t ) × Q t r ( t ) }

2.2.3. Adjusted Model

In adjusted model, the “used raw material reproducibility rate” (k) is added to the manufacturing cost (AMC) of the basic model. k indicates the ratio of used raw materials purchased by the manufacturer from the dismantling factory that can be reproduced into products after the quality is evaluated. The adjusted model follows the basic model, except it replaces Equation (4) with Equation (11):
t { [ s 2 C m ( t ) × [ Q m ( t ) ( 1 k ) × Q i t 32 ( t ) ] ] + [ s 2 C r e ( t ) × Q r e ( t ) ] }
Variable k is added because the used products recycled by the end customers have different qualities. In the dismantling factory (wholesaler), the recycled used products are screened to determine whether they can be remanufactured. If it can be remanufactured, it is sent to the manufacturer; otherwise, it is sent to a landfill. In this study, variable k is added to AMC based on Wang Yinpin’s (2011) literature. This parameter is set to 0.9, which means that 90% of used raw materials can be remanufactured after dismantling. In some cases, not all product could have a high remanufacturing ratio. Therefore, this study would like to compare the results with different remanufacturing ratio.

3. Results

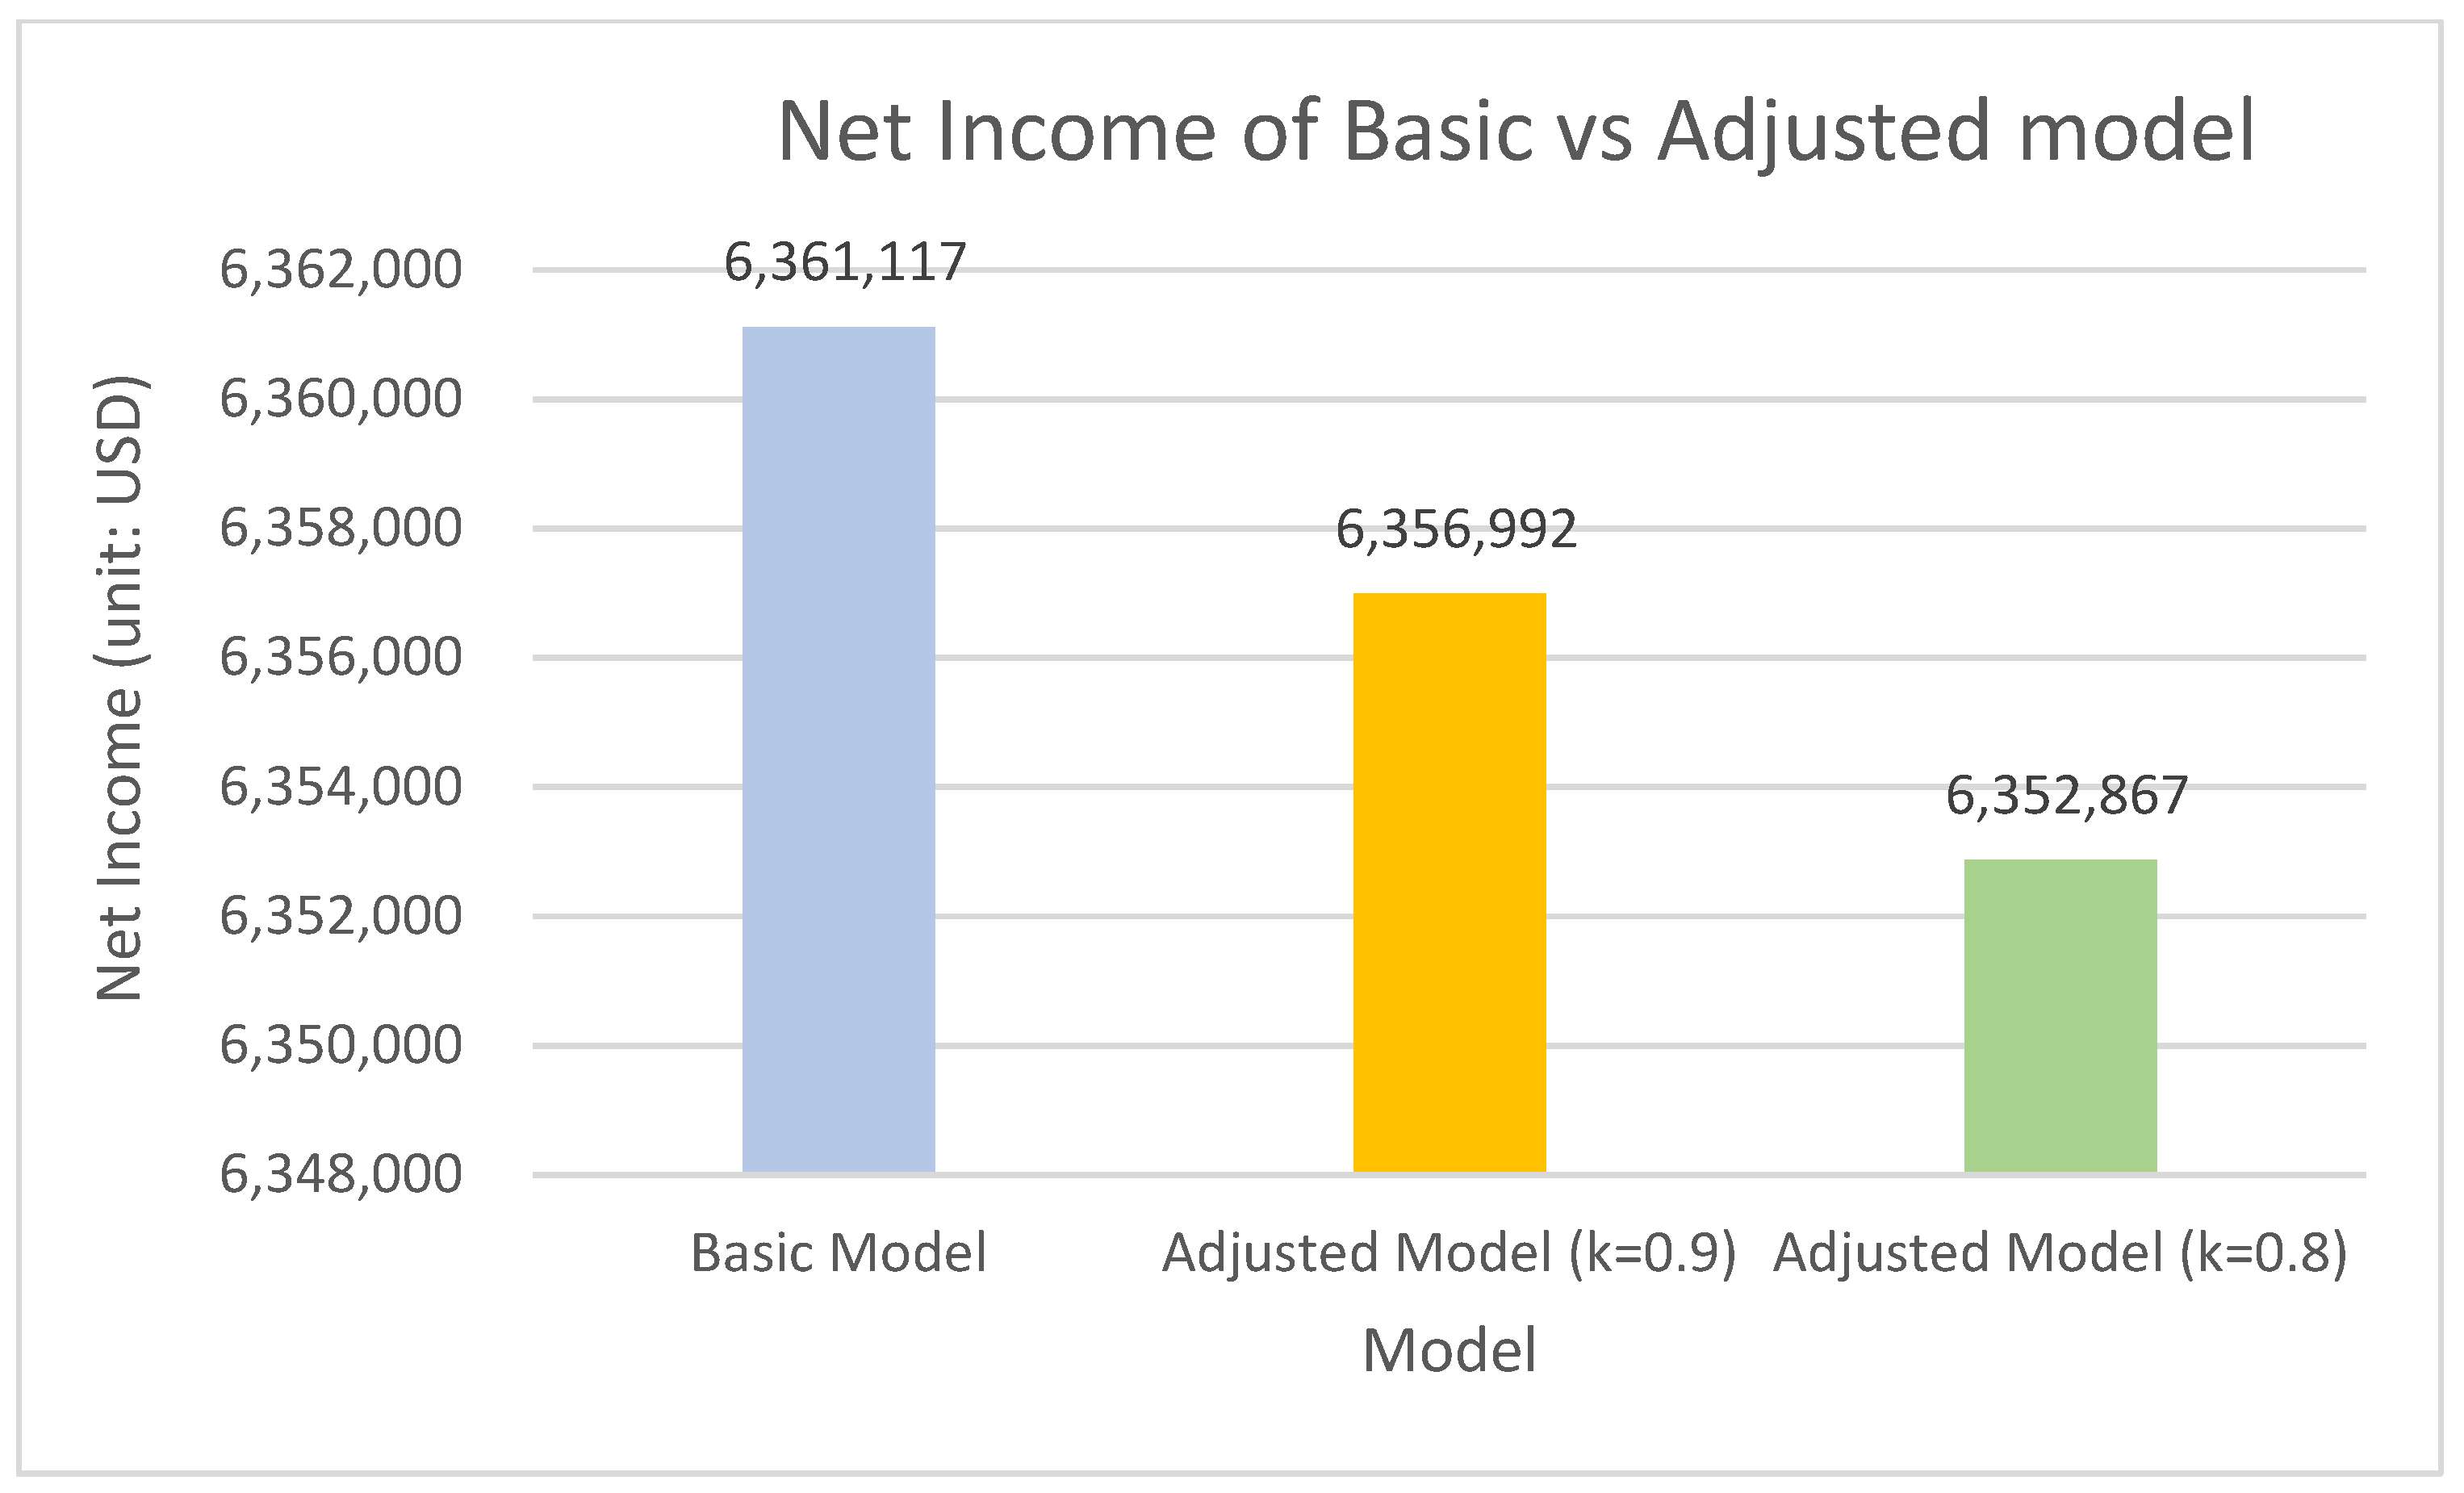
3.1. Net Income Comparison between the Two Models

After applying parameter values into the basic model and adjusted model constructed in this study, the maximum net incomes of the two models are calculated and presented as a chart in Figure 3.
According to the net income of the two models in Figure 3, the maximum net profit of the supply chain in the basic model is USD 6,361,117. The maximum net profit of the supply chain in adjusted model is USD 6,356,992 when the reproducibility rate of used raw materials is 0.9, and USD 6,352,867 when the reproducibility rate of used raw materials is 0.8. In the reverse supply chain, there are differences in the quality of recycled used products, that is, poor quality materials cannot be remanufactured, which affects the manufacturer’s output and decreases net income in the supply chain.

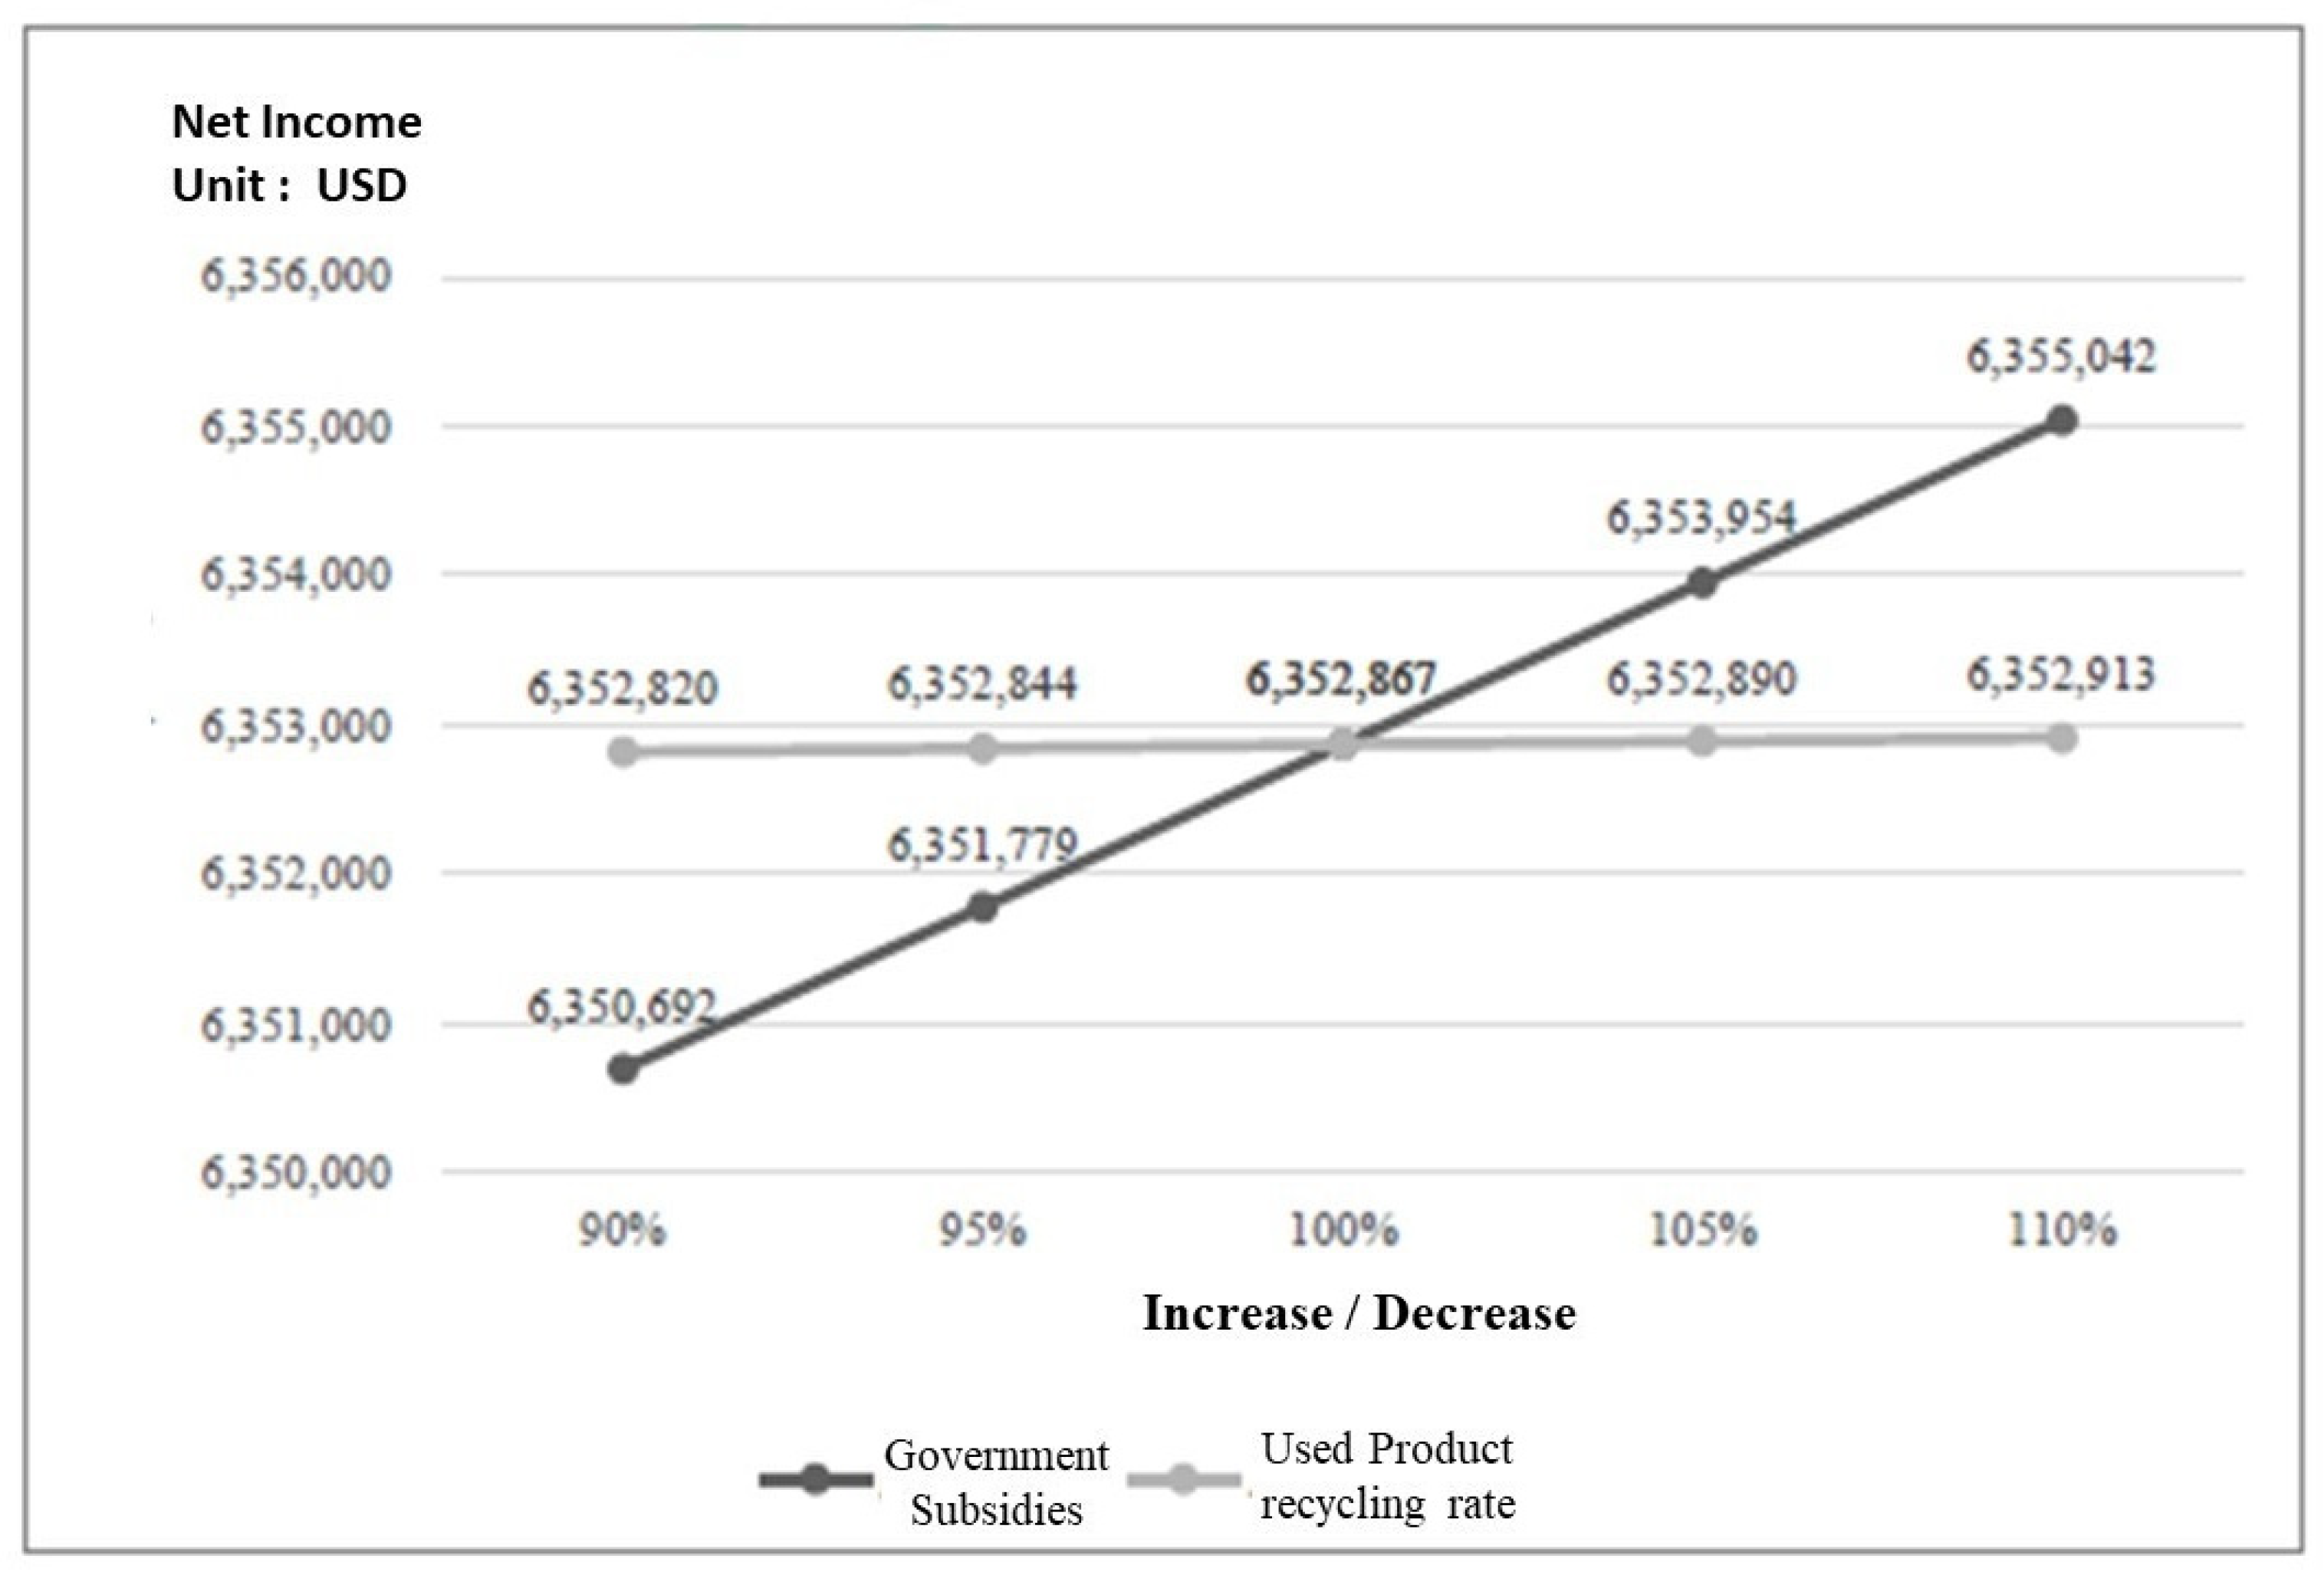
3.2. Government Subsidy

In the reverse supply chain, the government subsidy targets are collection factories (retailers) and dismantling factories (wholesalers). Figure 4 shows the sensitivity analysis of government subsidy. More government subsidy generates greater net income.
According to Sheu, Chou and Hu [9], the value of the government subsidy parameter is USD 8.7. At this value, the net income of basic model, adjusted model (k = 0.9), and adjusted model (k = 0.8) are USD 6,361,117, USD 6,356,992, and USD 6,352,867, respectively. This study adjusts the government subsidy parameter, as shown in Table 1. When the government subsidy is USD 7.83, the net income of basic model, adjusted model (k = 0.9), and adjusted model (k = 0.8) are USD 6,358,942, USD 6,354,817, and USD 6,350,692, respectively; when the government subsidy is USD 8.265, the net incomes of the basic model, adjusted model (k = 0.9), and adjusted model (k = 0.8) are USD 6,360,029, USD 6,355,904, and USD 6,362,204, respectively; when the government subsidy is USD 9.135, the net incomes of the basic model, adjusted model (k = 0.9), and adjusted model (k = 0.8) are USD 6,360,029, USD 6,358,079, and USD 6,353,954, respectively; when the government subsidy is USD 9.57, the net incomes of the basic model, adjusted model (k = 0.9), and adjusted model (k = 0.8) are USD 6,363,292, USD 6,359,167, and USD 6,355,042, respectively. When the government does not provide subsidies, the entire supply chain system can obtain a net income of USD 6,358,837 in the basic model, USD 6,354,712 in the adjusted model (k = 0.9), USD 6,350,587 in the adjusted model (k = 0.8). Therefore, with the increase in government subsidy, regardless of the model, the net income shows a positive slope (as shown in Figure 4).

3.3. Used Product Recycling Rate

The used product recycling rate refers to the ratio of used products collected from customers at collection factory (retailer). Figure 5 is the sensitivity analysis graph of the used product recycling rate. It shows that the net income of the basic model is greater than the adjusted model. When the recycling rate increases, the overall net income in the supply chain also gradually increases.
When the used product recycling rate is 0, it means that the used product is not recycled in the supply chain system, so the government does not provide recycling subsidy. At this time the net incomes of the basic model, adjusted model (k = 0.9), and adjusted model (k = 0.8) are USD 6,358,375, USD 6,354,250, and USD 6,350,125, respectively. When the recycling rate is 0.15, the net income of the basic model is USD 6,360,932, the adjusted model (k = 0.9) is USD 6,356,807, and the adjusted model (k = 0.8) is USD 6,352,682. When the recycling rate is 0.25 (the initial setting based on Sheu, Chou and Hu [9]), the net income of the basic model is USD 6,361,117, the adjusted model (k = 0.9) is USD 6,356,992, and the adjusted model (k = 0.8) is USD 6,352,867. Therefore, when the used product recycling rate increases, the overall net income of the supply chain increases accordingly. The relationship between the used product recycling rate and the net income is positive, as shown in Figure 5.

3.4. Government Subsidy and Used Product Recycling Rate

In the adjusted model, this study considers two situations, namely, k is set to 0.9 and 0.8. This section explores various situations under different government subsidies and different recycling rates, to determine which factor has the greatest impact on this supply chain system.
Table 2 shows the net income based on different government subsidies and used product recycling rates. The net income increases with the increase in the two parameters. Figure 6 and Figure 7 are produced based on the data in Table 2.
Figure 6 and Figure 7 show the impact of the two parameters on net income under different k conditions. Regardless of the value of k, net income increases with the increase of both government subsidy and the recycling rate of used products.
Table 2 shows that, holding all else equal, the net income in k = 0.8 is lower than in k = 0.9, so it means that k has a significant impact on net income. The result also shows that the net income is more sensitive to the government subsidy than the used product recycling rate. For example, when k is 0.9, the net income is USD 6,358,079 when the government subsidy increases by 5%, and the net income is USD 6,357,015 when the recycling rate increases by 5%. The net income is USD 6,359,167 when the government subsidy is increased to 10%, and USD 6,357,038 when the recycling rate is increased to 10%. Therefore, government subsidy has a more significant impact on the overall net income of the supply chain than the recycling rate. Similar observation is found when k is 0.8. Hence, this study believes that government subsidy is a key decision-making parameter in the model.

4. Discussion

This research constructs a green closed-loop supply chain system and adds the concept of quality difference of used raw materials to the basic model to explore the maximum net profit difference between the two models. Key decision factors in the model are found through parameter adjustment. The results can be discussed as follows:
  • The net income of the basic model is USD 6,361,117, and the net income of the adjusted model is USD 6,359,182 when k = 0.9. Therefore, considering the difference in the quality of used raw materials, the decrease in used raw materials that can be recycled and remanufactured causes a decline in the overall net income of the supply chain.
  • Considering that the reproducibility rate (k) of used raw materials may vary due to differences in the quality of recycled products, the parameter is adjusted to study its impact. This study finds that net income decreases with the reduction in k. The reason is when the availability of used raw material decreases, the number of finished products that can be produced also decreases and causes the net profit to decrease as well. The experimental results show that if k is 0.9, the maximum net profit is USD 6,356,992; if k is 0.8, the maximum net profit is USD 6,352,867.
  • Both government subsidy (S) and used product recycling rate (β) have a positive impact on the overall net income. The results show that as government subsidy increases, the net income in the supply chain system increases as well. When government actively promotes the concept of environmental protection, environmentally conscious green companies can receive more government subsidy. In addition, when the recycling rate of used products increases, it will also have an impact on net income. Increased willingness to recycle and reuse used products can effectively reduce the company’s production costs, thereby increasing net profit. Government subsidy is found to have a more significant impact on net income than used product recycling rates. Therefore, in the supply chain model constructed in this study, government subsidy can be regarded as a key decision-making parameter.

5. Conclusions

Due to the rising awareness of environmental protection in society nowadays, many product designs consider end-of-life recycling and reuse, in order to reduce the disposal of used products to the natural environment and achieve sustainable development and management. Based on this concept, this research constructs a green closed-loop supply chain system to recycle and reuse used products, reduce resource consumption, bring more profits to the company and, ultimately, achieve the goal of protecting the environment and ecological diversity.
This research provides some mathematical models: the basic model and the adjusted model to add the concept of the quality difference of used raw materials. The maximum net profit difference between the two models is investigated. The case studied in this research refers to the paper authored by Sheu, Chou and Hu [9], which describes the case of the top three Taiwanese notebook manufacturers. The results show that the decrease in used raw materials that can be recycled and remanufactured causes a decline in the overall net income of the supply chain. The net income decreases with a reduction in the used material reproducibility rate (k). On the other hand, increased government subsidy (S) and used product recycling rate (β) have a positive impact on the overall net income; in fact, the government subsidy has a more significant impact than the used product recycling rate.
Based on the results, this research believes that if companies can recycle used products through the supply chain system and re-manufacture them, they can make greater profits. As manufacturers can buy disassembled used components at a lower price, the cost can be effectively reduced in the remanufacturing process, and more net income can be created. In addition, due to the rising environmental awareness of customers, used products can be recycled, decomposed and used, which fully reflects the environmental protection concept of today’s society. Reusing the used raw materials produced from the decomposition of used products in product manufacturing can reduce waste in the environment. Pollution provides negative contributions to environmental protection. Therefore, the subsidy policy proposed by the government to promote the concept of environmental protection is indispensable. The policy encourages companies to not only make a profit from the operation process but also to think about how to integrate the concept of environmental protection to achieve sustainable green economic development.
The supply chain system model constructed in this research can be further improved. Inventory shortages can be added to the model to make it more in line with actual scenarios. Additionally, in this research, the transactions are all in cash, but in actual payment, there may be credits. Therefore, in future studies, the concept of deferred payment can be incorporated into the model to make the model more complete.

Author Contributions

Conceptualization, C.-Y.C. (Chen-Yang Cheng), C.-Y.C. (Chui-Yu Chiu) and T.-Y.W.; methodology, C.-Y.C. (Chui-Yu Chiu); software, T.-Y.W.; validation, C.-Y.C. (Chui-Yu Chiu) and T.-Y.W.; investigation, T.-Y.W.; resources, C.-Y.C. (Chui-Yu Chiu); data curation, T.-Y.W.; writing—original draft preparation, T.-Y.W.; writing—review and editing, C.-Y.C. (Chen-Yang Cheng); supervision, C.-Y.C. (Chui-Yu Chiu); project administration, C.-Y.C. (Chui-Yu Chiu). All authors have read and agreed to the published version of the manuscript.

Funding

This research received no external funding.

Institutional Review Board Statement

Not applicable.

Informed Consent Statement

Not applicable.

Conflicts of Interest

The authors declare no conflict of interest.

Abbreviations

Cost
CrUnit cost of raw materials
CpUnit purchase cost
CmUnit manufacturing cost
CreUnit rework cost of defective products
CirUnit storage cost of raw materials
CiUnit product inventory cost
CintUnit storage cost of unprocessed used products
CitUnit storage cost of processed used products
CtUnit transportation cost
CcUnit collection cost of used products collected from end customers
ClUnit labor cost
CtrUnit processing cost of used products
CfUnit cost of final disposal
Ci,jThe cost from level i to level j in the forward or reverse supply chain
Revenue
Ri,jUnit income from the i-th layer to the j-th layer in the forward or reverse supply chain
SUnit subsidy provided by the government
Quantity
QrQuantity of raw materials
QpPurchase quantity
QmManufacturing quantity
QreQuantity of products returned by wholesalers that can be reworked
QirInventory quantity of raw materials
QiProduct inventory quantity
QintThe inventory quantity of unprocessed used products
QitThe inventory quantity of processed used products
QlNumber of services
QtrProcessing quantity of used products
QfQuantity of disposed products
Qi,jThe number of logistics from the i-th layer to the j-th layer in the forward or reverse supply chain
Facility capacity
SiProduct inventory capacity
SirFacility capacity of raw material inventory
SitFacility capacity of processed used product inventory
SintFacility capacity of unprocessed used product inventory
Other parameters
DEnd customer demand
tTime
αRework rate of used products
βUsed product recycling rate
γConversion rate of raw materials and products
δProduction defect rate

References

  1. Pearce, D. Blueprint 2: Greening the World Economy; Routledge: London, UK, 2013. [Google Scholar]
  2. Tiwari, A.; Chang, P.-C.; Tiwari, M.; Kandhway, R. A Hybrid Territory Defined evolutionary algorithm approach for closed loop green supply chain network design. Comput. Ind. Eng. 2016, 99, 432–447. [Google Scholar] [CrossRef]
  3. Lambert, D.M.; Cooper, M.C. Issues in supply chain management. Ind. Mark. Manag. 2000, 29, 65–83. [Google Scholar] [CrossRef]
  4. Narasimhan, R.; Carter, J.R. Environmental Supply Chain Management; Center for Advanced Purchasing Studies: Tempe, AZ, USA, 1998. [Google Scholar]
  5. Ashley, S. Designing for the environment. Mech. Eng. CIME 1993, 115, 52–56. [Google Scholar]
  6. Pagell, M.; Yang, C.L.; Krumwiede, D.W.; Sheu, C. Does the competitive environment influence the efficacy of investments in environmental management? J. Supply Chain Manag. 2004, 40, 30–39. [Google Scholar] [CrossRef]
  7. Diabat, A.; Govindan, K. An analysis of the drivers affecting the implementation of green supply chain management. Resour. Conserv. Recycl. 2011, 55, 659–667. [Google Scholar] [CrossRef]
  8. Lin, R.-J. Using fuzzy DEMATEL to evaluate the green supply chain management practices. J. Clean. Prod. 2013, 40, 32–39. [Google Scholar] [CrossRef]
  9. Sheu, J.-B.; Chou, Y.-H.; Hu, C.-C. An integrated logistics operational model for green-supply chain management. Transp. Res. Part E Logist. Transp. Rev. 2005, 41, 287–313. [Google Scholar] [CrossRef]
  10. Pagell, M.; Krumwiede, D.; Sheu, C. Efficacy of environmental and supplier relationship investments—Moderating effects of external environment. Int. J. Prod. Res. 2007, 45, 2005–2028. [Google Scholar] [CrossRef]
  11. Song, H.; Gao, X. Green supply chain game model and analysis under revenue-sharing contract. J. Clean. Prod. 2018, 170, 183–192. [Google Scholar] [CrossRef]
  12. Bhattacharya, R.; Kaur, A.; Amit, R. Price optimization of multi-stage remanufacturing in a closed loop supply chain. J. Clean. Prod. 2018, 186, 943–962. [Google Scholar] [CrossRef]
  13. Akçalı, E.; Çetinkaya, S. Quantitative models for inventory and production planning in closed-loop supply chains. Int. J. Prod. Res. 2011, 49, 2373–2407. [Google Scholar] [CrossRef]
  14. Garg, K.; Kannan, D.; Diabat, A.; Jha, P. A multi-criteria optimization approach to manage environmental issues in closed loop supply chain network design. J. Clean. Prod. 2015, 100, 297–314. [Google Scholar] [CrossRef]
  15. Özkır, V.; Başlıgil, H. Multi-objective optimization of closed-loop supply chains in uncertain environment. J. Clean. Prod. 2013, 41, 114–125. [Google Scholar] [CrossRef]
  16. Talaei, M.; Moghaddam, B.F.; Pishvaee, M.S.; Bozorgi-Amiri, A.; Gholamnejad, S. A robust fuzzy optimization model for carbon-efficient closed-loop supply chain network design problem: A numerical illustration in electronics industry. J. Clean. Prod. 2016, 113, 662–673. [Google Scholar] [CrossRef]
  17. Guide, V.D.R., Jr.; Van Wassenhove, L.N. The Evolution of Closed-Loop Supply Chain Research. Oper. Res. 2009, 57, 10–18. [Google Scholar] [CrossRef]
  18. Howard, C. Real-Time Allocation Decisions in Multi-Echelon Inventory Control; Lund University: Lund, Sweden, 2013. [Google Scholar]
  19. Cohen, M.A.; Kleindorfer, P.R.; Lee, H.L. Optimal stocking policies for low usage items in multi-echelon inventory systems. Nav. Res. Logist. Q. 1986, 33, 17–38. [Google Scholar] [CrossRef]
  20. Chen, F. Optimal policies for multi-echelon inventory problems with batch ordering. Oper. Res. 2000, 48, 376–389. [Google Scholar] [CrossRef]
  21. Federgruen, A. Centralized planning models for multi-echelon inventory systems under uncertainty. Handb. Oper. Res. Manag. Sci. 1993, 4, 133–173. [Google Scholar]
  22. Chiu, H.N.; Huang, H.L. A multi-echelon integrated JIT inventory model using the time buffer and emergency borrowing policies to deal with random delivery lead times. Int. J. Prod. Res. 2003, 41, 2911–2931. [Google Scholar] [CrossRef]
  23. Gümüs, A.T.; Güneri, A.F. Multi-echelon inventory management in supply chains with uncertain demand and lead times: Literature review from an operational research perspective. Proc. Inst. Mech. Eng. Part B J. Eng. Manuf. 2007, 221, 1553–1570. [Google Scholar] [CrossRef]
  24. Khalifehzadeh, S.; Seifbarghy, M.; Naderi, B. A four-echelon supply chain network design with shortage: Mathematical modeling and solution methods. J. Manuf. Syst. 2015, 35, 164–175. [Google Scholar] [CrossRef]
Figure 1. Multi-level distribution system. (a) Multi-level serial system. (b) Multi-level assembly system. (c) Multi-level distribution system. (d) Multi-level hybrid system.
Sustainability 13 06041 g001
Figure 2. Basic model flowchart.
Sustainability 13 06041 g002
Figure 3. Net income comparison between two models.
Sustainability 13 06041 g003
Figure 4. Sensitivity analysis of government subsidy.
Sustainability 13 06041 g004
Figure 5. Sensitivity analysis graph of used product recycling rate.
Sustainability 13 06041 g005
Figure 6. The sensitivity analysis of government subsidy and used product recycling rate on net income (k = 0.9).
Sustainability 13 06041 g006
Figure 7. The sensitivity analysis of government subsidy and used product recycling rate on net income (k = 0.8).
Sustainability 13 06041 g007
Table 1. Parameter adjustment of government subsidy.
Government
Subsidy
−10%−5%Literature5%10%
7.838.2658.79.1359.57
Table 2. Net income of the supply chain system based on different levels of government subsidies and used product recycling rates.
Net Income
Unit: USD
Used Raw Material Reproducibility Rate (k) is 0.9Used Raw Material Reproducibility Rate (k) is 0.8
Increase/
Decrease
Parameter: Government SubsidiesParameter: Used Product Recycling RateParameter: Government SubsidiesParameter: Used Product Recycling Rate
−10%6,354,8176,356,9456,355,6926,352,820
−5%6,355,9046,356,9696,351,7796,352,844
0%6,356,9926,356,9926,352,8676,352,867
+5%6,358,0796,357,0156,353,9546,352,890
+10%6,359,1676,357,0386,355,0426,352,913
Publisher’s Note: MDPI stays neutral with regard to jurisdictional claims in published maps and institutional affiliations.

