Article

A Methodology for Assessing Groundwater Pollution Hazard by Nitrates from Agricultural Sources: Application to the Gallocanta Groundwater Basin (Spain)

by
José María Orellana-Macías
1,2,*,
María Jesús Perles Roselló
3 and
Jesús Causapé
1
1
Departamento de Investigación en Recursos Geológicos, Instituto Geológico y Minero de España, 50006 Zaragoza, Spain
2
Departamento de Ciencias de la Tierra, Universidad de Zaragoza, 50006 Zaragoza, Spain
3
Departamento de Geografía, Universidad de Málaga, 29010 Málaga, Spain
*
Author to whom correspondence should be addressed.
Sustainability 2021, 13(11), 6321; https://doi.org/10.3390/su13116321
Submission received: 19 April 2021 / Revised: 28 May 2021 / Accepted: 29 May 2021 / Published: 2 June 2021

Abstract

:
Groundwater pollution by nitrates from agricultural sources is a common environmental issue. In order to support risk analysis, hazard maps are used to classify land uses according to their potential of pollution. The aim of this study is to propose a new hazard index based on nitrogen input and its connection with nitrate concentration in groundwater. The effectiveness of the Nitrogen Input Hazard Index was tested in the Gallocanta Groundwater Basin (Spain), a highly polluted area, declared as a Nitrate Vulnerable Zone. Agricultural data at a plot scale were used to estimate the nitrogen fertilizer requirement of each crop, and the correlation between nitrogen input and nitrate concentration in groundwater was explored. The resulting hazard map allows us to delimit the most hazardous areas, which can be used to implement more accurate nitrate pollution control programs. The index was proven to successfully estimate nitrogen input influence over groundwater nitrate concentration, and to be able to create hazard maps. The criterion used to create categories was empirically based on nitrate concentration thresholds established by the EU Nitrate Directive. The Nitrogen Input Hazard Index may be a useful tool to support risk analyses of agricultural activities in vulnerable areas, where nitrate pollution could endanger human water supply.

1. Introduction

From an environmental perspective, surface and groundwater pollution caused by anthropogenic activities is one of the most common issues across the world [1,2,3]. In the past fifty years, the expansion of human activities, such as urbanization, industry and agriculture, has increased the pressure over water resources, and the consequences may endanger water quality both for human and natural uses [4,5].
The intensification of agriculture has been supported by the use of nitrogen fertilizers [6], which are relatively cheap and allow a significant crop increase. However, contamination from agricultural sources is mainly caused by the use of fertilizers and manure. Organic and mineral nitrogen are commonly used for fertilization, but the application of nitrogen fertilizers above the plants’ needs usually means that the nitrogen and salt surpluses leach into groundwater bodies [7,8]. Nitrogen usually reaches groundwater bodies in varying forms, such as organic nitrogen, ammonium or nitrate, (NO3) with several sources of recharge, such as nonpoint recharge from rainfall or irrigation, lineal recharge from streams or rivers, and areal recharge from lagoons and lakes [9].
Whereas lineal and punctual sources are relatively easy to control and mitigate, diffuse pollution is difficult to prevent and estimate. Agricultural lands are considered as the main source of diffuse pollution [10] and it has a wide range of environmental impacts related to changes in water quality, which directly influences biodiversity, and animal and plant communities [11]. Since nitrogen is a nutrient that results in a significant rise in plants’ productivity, excessive nitrogen in aquatic environment enhances an intensive algal growth, limiting the oxygen in water for other organisms [12]. Additionally, high nitrate concentration in drinking water has been related to several pathological conditions in humans [13].
With the aim to control high nitrogen concentrations in surface and groundwater, several countries and supranational institutions have proposed programs and measures of protection and mitigation [14,15]. In the European Union, the Water Framework Directive [16] is the backbone of water protection directives, which include the Nitrate Directive [17] and the Groundwater Directive [18].
Following the Nitrate Directive, the member states have to control and reduce the water pollution by nitrates from agricultural sources. The correct implementation of the EU directives is based on the promotion of sustainable agricultural practices and on the protection of vulnerable areas, known as Nitrate Vulnerable Zones (NVZ). In these areas, Codes of Good Agricultural Practice are implemented to decrease and control nitrogen leaching [19]. However, the NVZ declaration has shortcomings and drawbacks and does not necessarily improve groundwater quality [20,21].
For an accurate implementation of measures related to the mitigation of water pollution, several tasks are required, such as the quantification of the anthropogenic pressures, the estimation of nutrient leaching and the identification of the potential sources of pollution [22]. In relation to these tasks, hazards and risk assessments can be considered as useful tools to quantify hazard and risk levels. Risk has been commonly defined as the result of the combination of a hazard and the vulnerability of the elements exposed [23,24,25,26], whereas hazard is a phenomenon, process, or activity that may be harmful and damaging to the society and the environment [27]. Therefore, risk assessments are holistic analyses which include hazard, vulnerability and exposure factors, while hazard assessments are restricted to the analysis and classification of the potential hazards within an area. Following this approach, several groundwater hazard indexes have been developed (e.g., the Danger Contamination Index (DCI) [28]; the Pollutant Origin Surcharge Hydraulically (POSH) [29]; and the Hazard Index (HI) [30]. These hazard indexes are designed to be applied in a variable set of areas, so they take into account a wide range of land uses and activities that could be potential sources of groundwater pollution.
Given the wide variety of pollution sources considered by traditional indexes and the relevance of pollutants from agricultural sources, especially nitrates, some authors developed specific methodologies for assessing groundwater nitrate pollution [31,32,33]. Shaffer and Delgado [34] provide a three-tiered nitrate leaching index assessment tool. They also used a qualitative approach to separate leaching potential levels, and they used the vulnerability to contamination to target the level of protection of aquifers at risk. In 2005, Birkle et al. [35] proposed the Nitrogen Leaching Hazard Index (NLHI), with the aim of providing information for farmers to reduce potential nitrogen contamination of groundwater in California. This index identified the areas of highest intrinsic vulnerability by classifying the soils, crops and irrigation systems. It was later corrected and updated by O’Geen et al., [36], who created a new data-driven Nitrate Hazard Index (NHI).
However, both traditional and specific indexes have some weaknesses that could be addressed. The specific agricultural indexes usually include vulnerability criteria in their hazard analysis, so according to the basic risk equation, where risk is defined as the combination of hazard, vulnerability and exposure, they should be considered as risk indexes instead of hazard indexes. On the other hand, the traditional hazard indexes tend to undervalue the potential pollution of agricultural sources, especially the nonpoint ones which provide a constant flux of pollution [37], and are recognized as the most common source of nitrogen pollution. Additionally, they do not follow a clear criterion when rating the potential sources nor do they relate the pollutant supply and the impact of the amount of pollutant to groundwater quality, that is, the real groundwater body level of affection. The result is a dimensionless parameter that is difficult to relate to the reality, which raises questions on the calibration of the methods.
Thus, this research aims to propose a methodology and a groundwater nitrate pollution hazard index that accurately depict the impact of nitrate leaching on groundwater. The specific objectives were: (1) to propose a hazard assessment method for diffuse pollution sources based on quantitative criteria, by relating the amount of nitrogen supplied and the groundwater quality; (2) to delimit hazard intervals not only based on measurable parameters; and (3) to test the index in a selected area, the Gallocanta Groundwater Body, which is currently affected by nitrate pollution from agricultural sources.

2. Materials and Methods

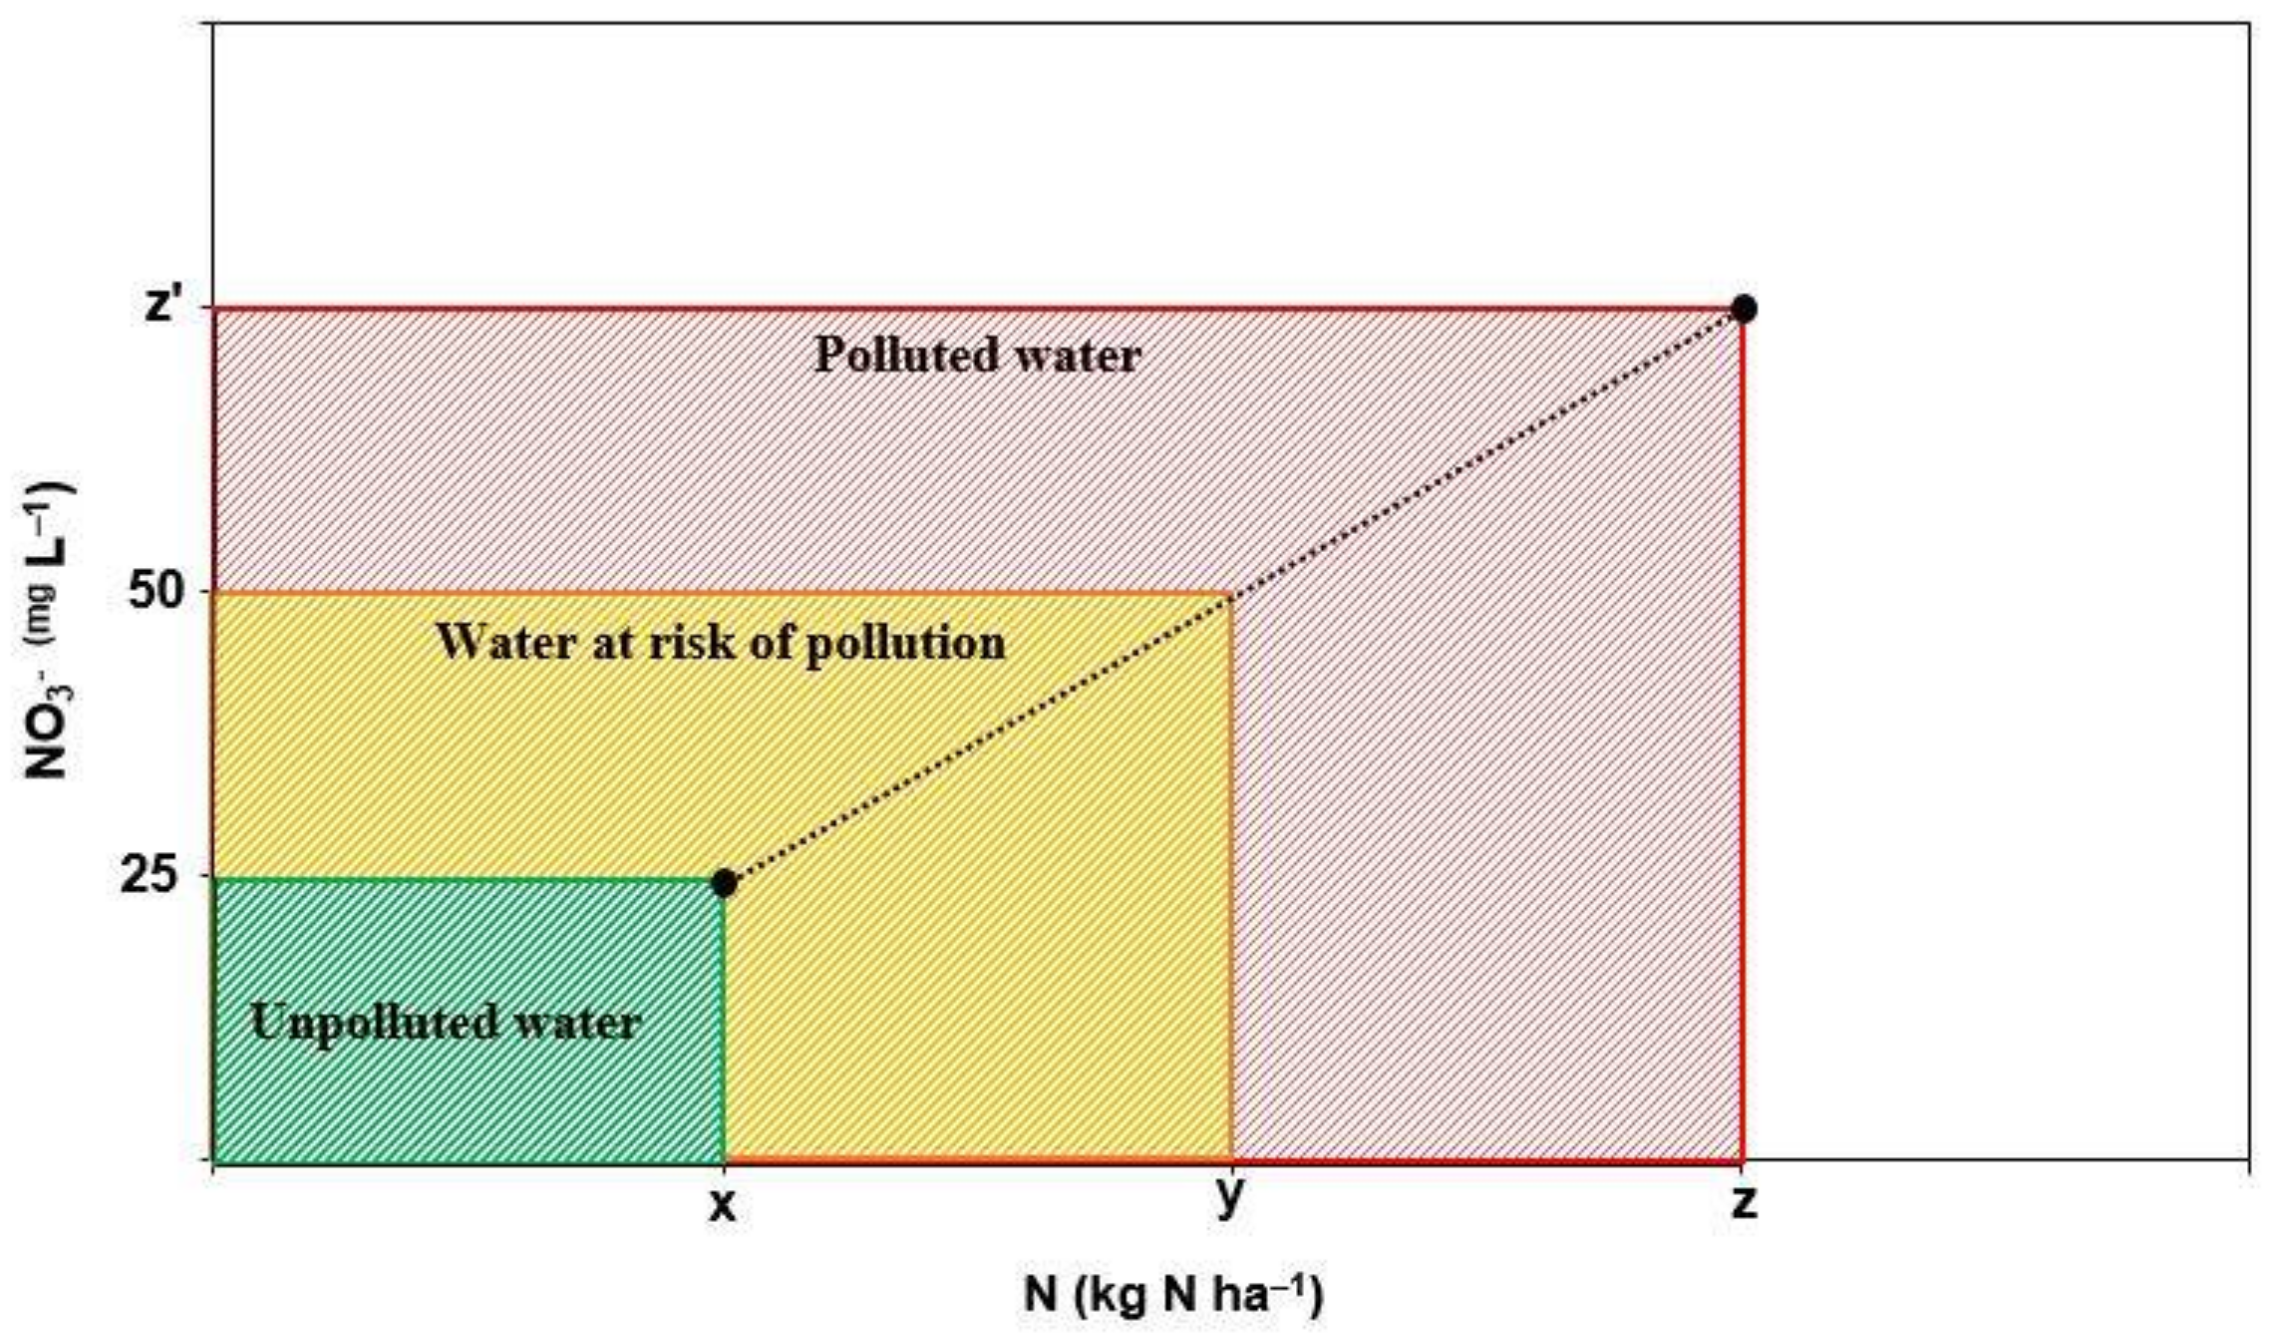
2.1. Nitrogen Input Hazard Index

The ultimate objective of the index is to create a groundwater pollution hazard map. The index provides a hazard pollution estimation based on the crop nitrogen fertilizer requirements, as well as developing a classification of hazard levels based on the influence that nitrogen input on the surface may have over groundwater pollution. It is a three-step process designed following measurable and duplicable criteria.
Step 1. Hazards inventory and classification
The first step is to classify all the potential sources of nitrogen pollution related to crops, which can be considered the main source of diffuse pollution. Based on a land use map, the first tiered level distinguishes between crops. In order to assign hazard levels, croplands have to be accurately delimited according to the crop type, including water management information, and other remarkable characteristics that can influence the potential of pollution.
Step 2. Calculation of crops nitrogen fertilizer requirements
In order to know the potential amount of nitrogen that could be leached and reach groundwater, the nitrogen fertilizer required by each crop has to be calculated. The nitrogen fertilizer requirements are based on the nitrogen uptake of each crop, the estimated yield, and the water management system. These parameters depend on the location of the plot and the water management system, which directly influence the expected yield. The nitrogen fertilizer requirements of the crops have been calculated by the following:
NR = N Uptake × Output
where NR is the nitrogen fertilizer requirement in kg N ha–1; N Uptake (N 1/1000) is the nitrogen uptake by the plant; and Output is the expected yield in t ha–1. As aforementioned, the expected yield is dependent of the location and the water management system, so the specialist has to ascribe the value of those parameters according to the characteristics of the study area. Regional and national authorities in some countries publish guides and reports adapted to the characteristics of some areas, which may help when calculating nitrogen uptake and expected yield. This information can also be complemented with fieldwork and personal interviews with local owners and farmers, which can give better information about fertilizers and water management at a local scale.
Step 3. Interval delimitation and rating of pollution sources
The rating of the sources of pollution is based on the potential amount of nitrogen that could be released from each source (NR) and the consequent NO3 concentration in the aquifer. With the objective of relating the hazard value with a measurable variable, the relationship between the NR and the NO3 concentration in the aquifer could be considered as a trustful criterion. This relationship has been explored in previous hazard and risk methodologies [33,38].
The delimitation of the threshold between hazard intervals and the respective hazard degree of those intervals have been based on the connection between the NR and the NO3 concentration. The initial hypothesis states that where intrinsic vulnerability is similar, higher nitrogen input on the surface is proportional to higher NO3 concentration in groundwater. Intrinsic vulnerability is based on the inherent natural characteristics (i.e., geology, climatic conditions, type of soil, etc.) and, from this correlation, it is feasible to identify the NR that may potentially produce low, moderate or high NO3 concentrations in the aquifer, and thus, low, moderate and high hazard levels can be determined.
To test the strength of the aforementioned correlation, a multivariate clustering data analysis has been carried out, including NR, NO3 concentration and intrinsic vulnerability of the aquifer in 2019, by using Statgraphics XVI (Table 1). The square Euclidean distance and Ward’s method can be used to test the similarity and to obtain hierarchical associations, respectively [39]. This method analyzes the potential amount of nitrates suitable to be leached and reach groundwater, considering intrinsic and specific vulnerability of the area (Table 2).
Based on the parameters explained in Step 2, the annual amount of nitrogen supplied within the basin is estimated for a long series, and the annual mean nitrogen supplied is calculated. A robust series of groundwater NO3 concentrations measured during the same period is needed in order to obtain the mean NO3 concentration in the study area. The correlation between the annual nitrogen supply and the mean NO3 concentration is explored. The amount of nitrogen required to reach a certain nitrate concentration in the aquifer can be estimated based on the mean NO3 concentration observed, and thus, the nitrogen fertilizer requirements at a farm scale to reach that NO3 concentration can be inferred. The Nitrate Directive establishes the level of affection of a water body depending on the NO3 concentration [17]. The concentrations established to consider a water body, respectively, as affected or polluted, are 25 mg L–1 and 50 mg L–1. Those concentrations are used to estimate the total nitrogen input needed to reach them, and, therefore the NR that would case a certain pollution level (Figure 1).
Crops are classified on a three-interval scale depending on their nitrogen fertilizer requirement:
>
Low, when NR calculated is lower than the NR estimated to reach 25 mg L–1.
>
Medium, when NR calculated is lower than the NR estimated to reach 50 mg L–1.
>
High, when NR calculated is higher than the NR estimated to reach 50 mg L–1.
This classification may be modified, although it is recommended to use less than five intervals to ease understanding of the resulting hazard map.

2.2. Application of the NIHI to the Gallocanta Groundwater

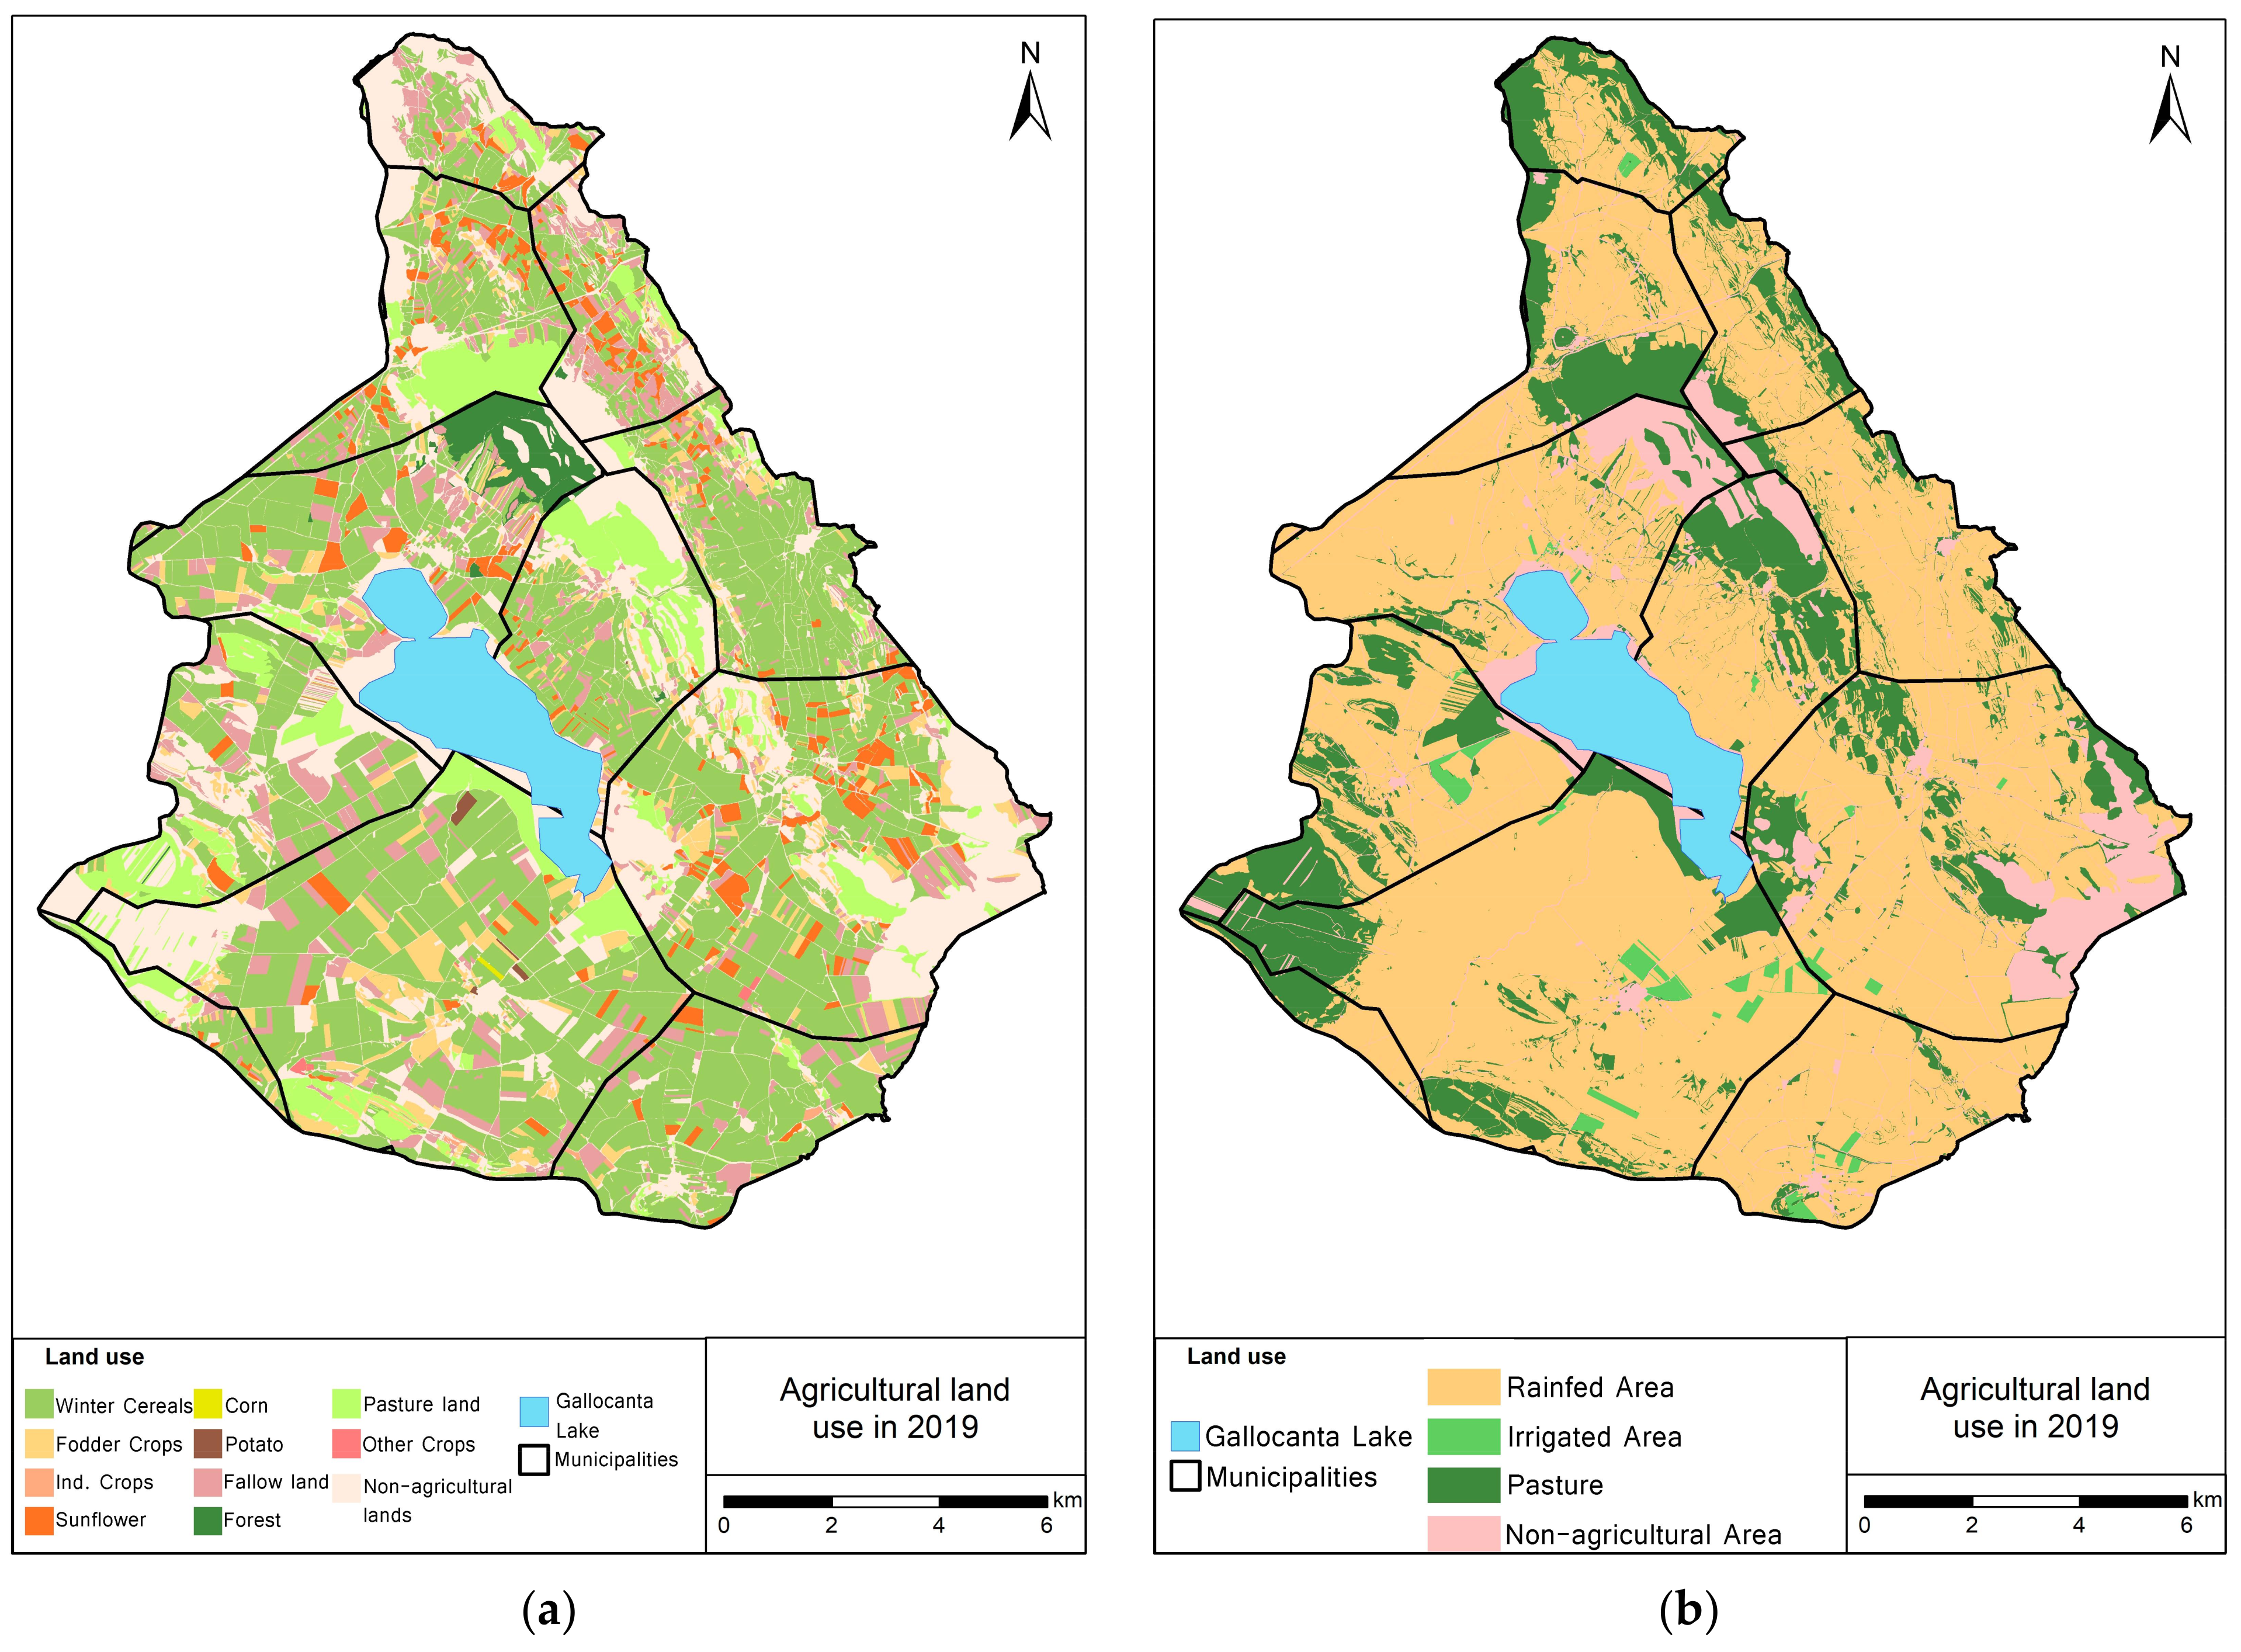
2.2.1. Study Area Description

The Gallocanta Groundwater Body (GGB), in northeast Spain, is a 223 km2 multilayer aquifer associated with the groundwater catchment of the Gallocanta Basin (540 km2). It is an endorheic basin and it includes the Gallocanta Lake, an ephemeral water body naturally developed in the lowest part of the basin (Figure 2).
The GGB is a multilayer aquifer system (Figure 3) [40]. It is mainly composed of a shallow detritic quaternary aquifer that occupies the lowest parts of the study area. The quaternary aquifer is hydraulically connected with the lake and with the carbonated Cretaceous and Jurassic aquifers at the western parts of the basin, where these carbonated rocks outcrop. On the other hand, along its northern and eastern borders, the main lithological unit is formed by low permeability Paleozoic rocks forming the Sierra de Santa Cruz. At the foot of the mountains, Triassic materials, mainly impermeable Keuper facies, lie beneath the quaternary rocks. Keuper covers large areas of the basin and it enhances the presence of the lake and prevents groundwater flowing down [41]. The hydrogeological regime (i.e., flow directions, characteristics of the vadose zone, water table depth, etc.) was explored in previous research [21].
The study area has been subjected to intense agricultural pressure for decades. According to CORINE Land Cover, agricultural land extension has remained constant, around 180 km2 since 1990. Extensive rainfed agriculture is the predominant agricultural activity, and wheat, barley, sunflower and fodder crops are the main products. Meanwhile, irrigation is limited and controlled by water authorities, and small irrigated plots are located at the southern and southwestern part of the study area.
Figure 4a,b shows that 80% of the study area is declared as arable land. Most of the crops grown are rainfed crops (78%), whereas irrigated plots only represent 2%. The rest is devoted to natural pastures (20%). Winter cereals, mainly wheat and barley, are the most extensive crops, followed by sunflower and fodder crops (alfalfa and sainfoin).
Given the high nitrate concentration observed in the area, and following the Nitrate Directive, the area was declared as a NVZ in 1997. In spite of the implementation of several action programs, which include limitation of irrigation and restriction to fertilization, nitrate concentration is above 50 mg L–1 in most of the samples sites.

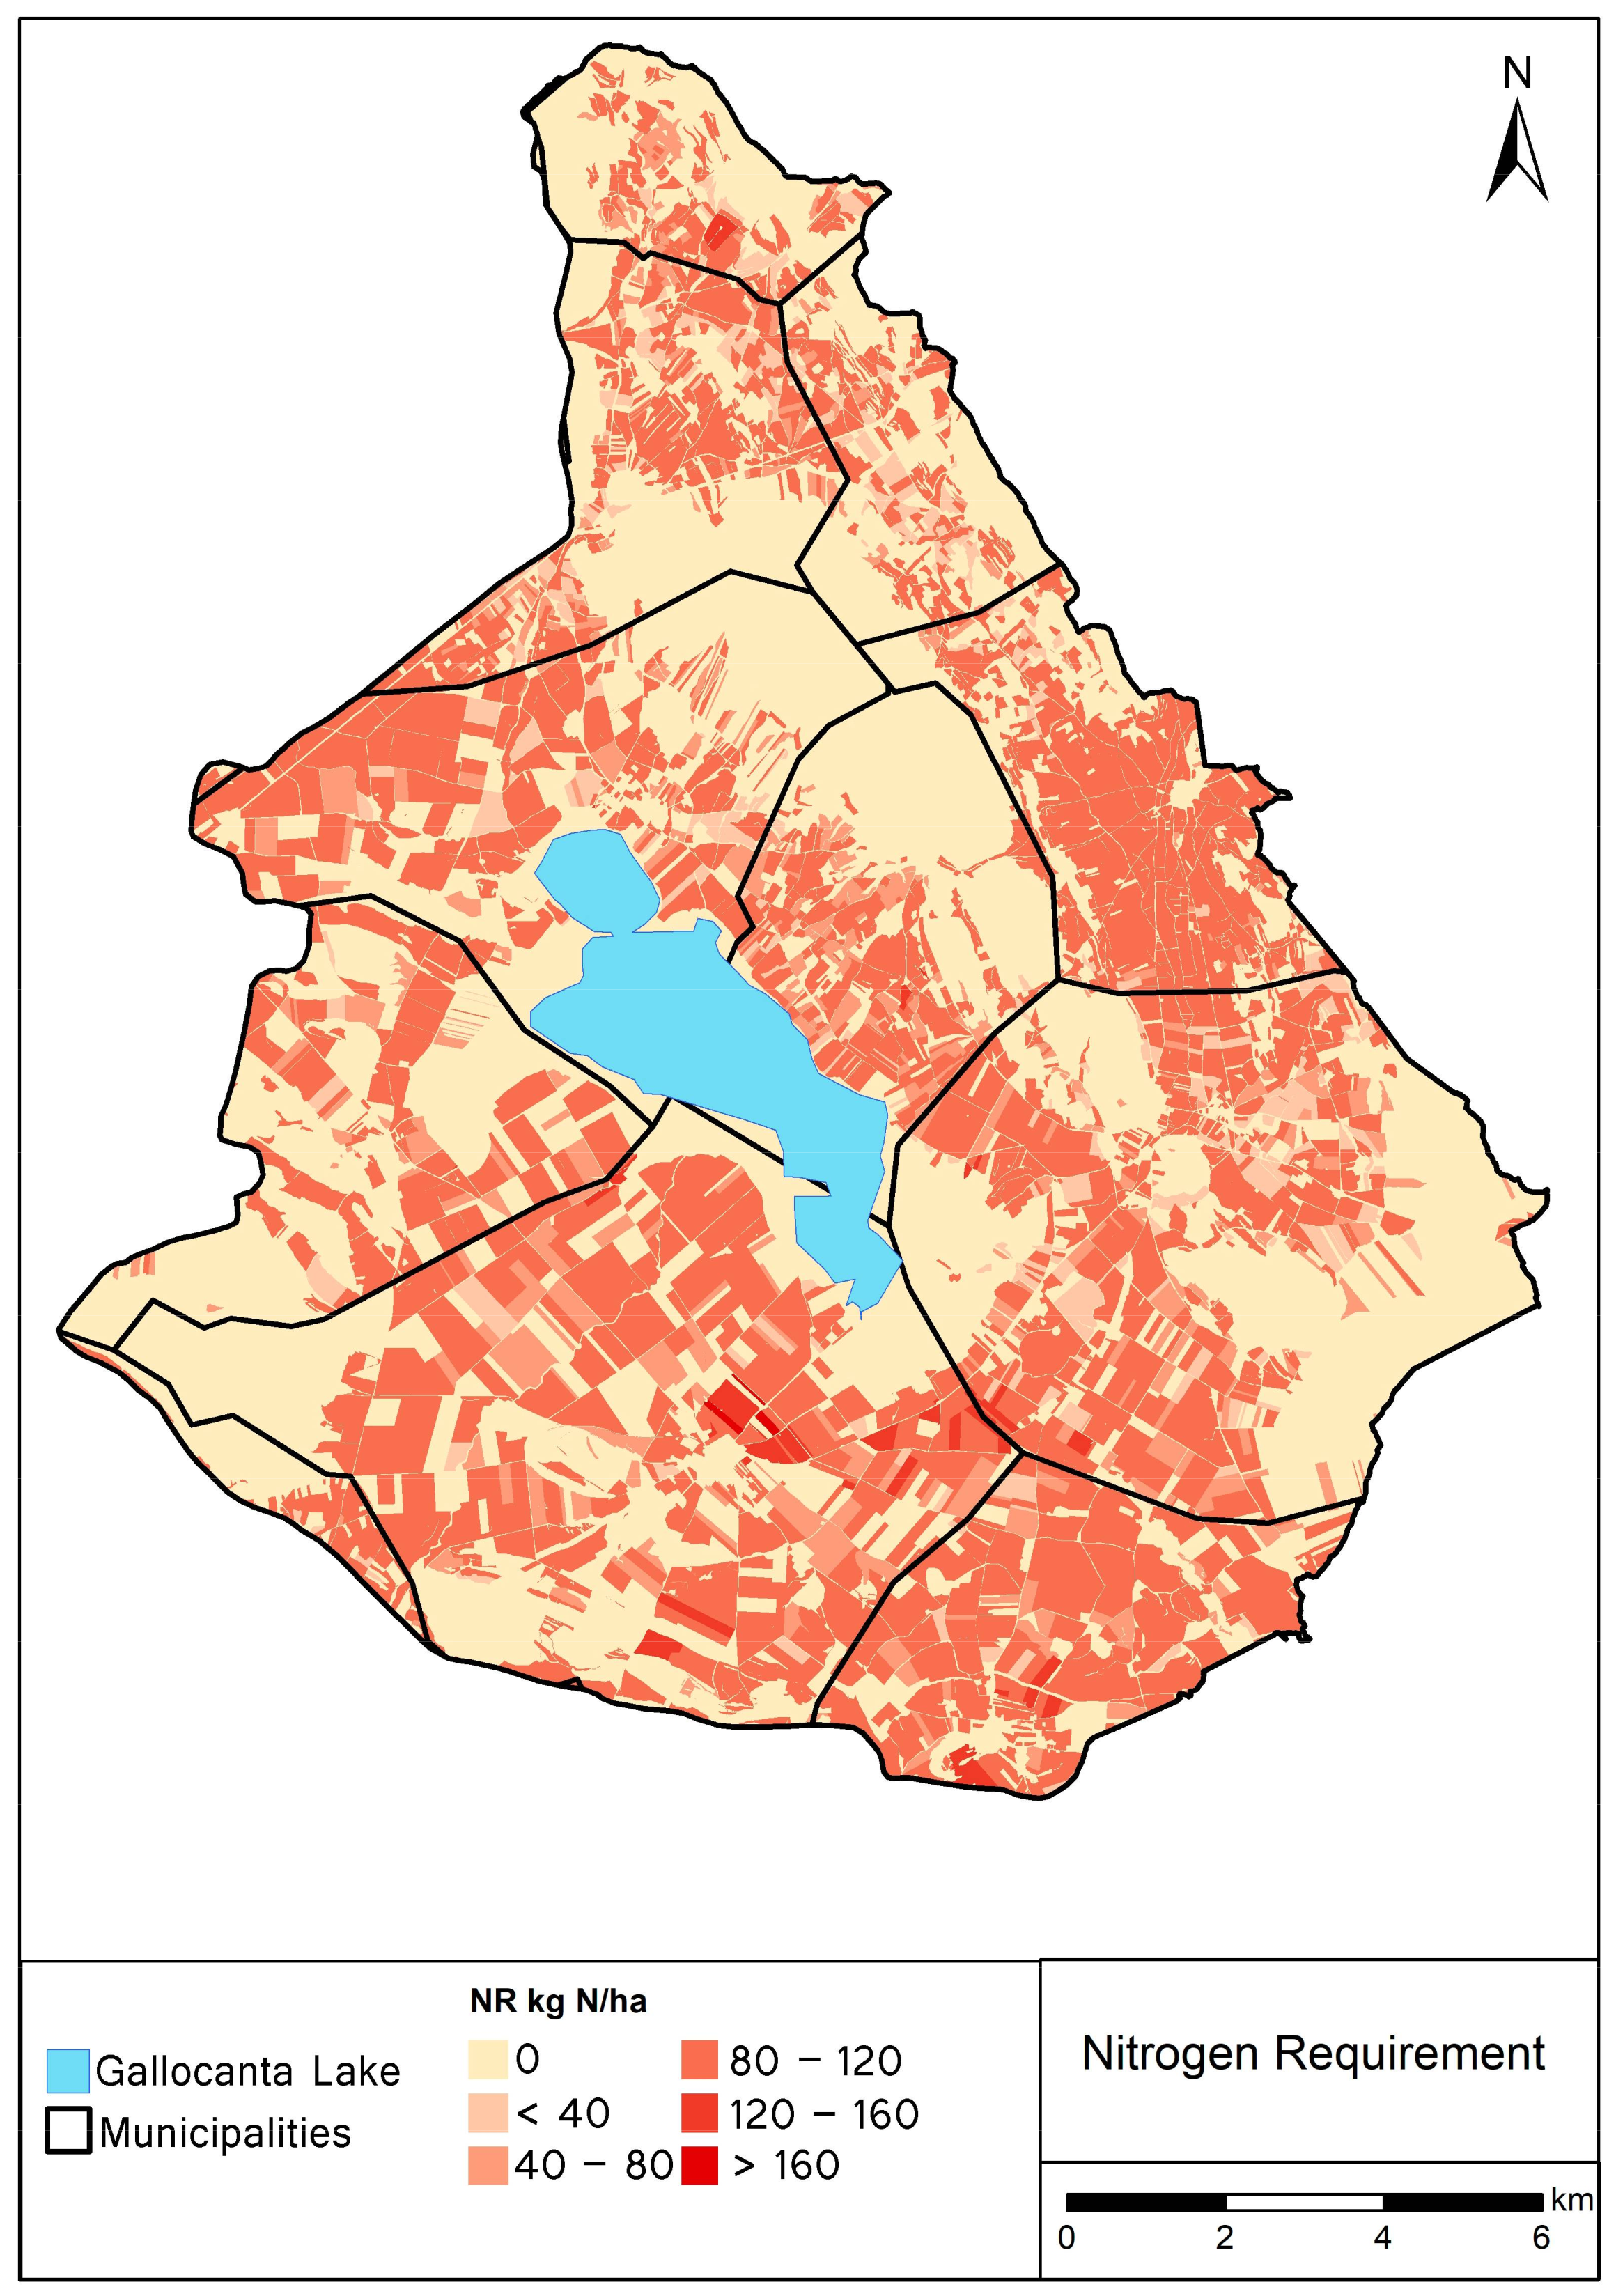
2.2.2. NIHI Application

In this research, crop and NO3 data from two temporal series have been used. The NIHI and the resulting hazard maps were calculated for 2019. The evolution of NO3 concentration in the GGB and its relationship with nitrogen supply through crops was tested by using a longer time series (1992–2019), in order to guarantee the data’s statistical robustness. Fourteen types of crops were considered and 288 NO3 concentration samples from 42 sites were included in the analysis.
Step 1. Hazards inventory and classification
Information about land use at a farm scale, including type of crop and type of water management, was obtained from the Government of Aragón. Those data included all the information declared by farmers under the European Common Agricultural Policy (CAP). Table 1 lists the crops declared in the study area according to the type of water management in 2019.
Step 2. Calculation of crops’ nitrogen fertilizer requirements
Once the crop map was obtained, the NR was calculated. The parameters required to calculate NR were estimated following the Nitrogen Balance 2016 Report published by the Spanish Ministry of Agriculture, Fisheries and Food [42]. Since expected yield is dependent on the characteristics of the study area, personal interviews with farmers were carried out in order to specifically adjust the parameters to the Gallocanta Basin (Table 3).
Step 3. Intervals delimitation and rating of pollution sources
The parameters that influence intrinsic vulnerability of the aquifer can involve small changes in the correlation, so in order to improve the assessment of the connection between NR and NO3 concentration, the same vulnerability was considered. This enabled us to calculate the correlation under the same intrinsic vulnerability conditions. Intrinsic vulnerability was obtained from maps published by the Ebro Hydrographic Confederation (CHE from its Spanish acronym) on its website. Those maps were developed following the DRASTIC reduced method [43].
NO3 concentration data were obtained from the CHE database, freely available on the CHE website [44], and 13 samples sites were considered. The result of the multivariate clustering analysis showed that when intrinsic vulnerability was either high or low, high NR led to high NO3 concentration. Therefore, hazard (NR) influences NO3 concentration more than vulnerability, which supports the idea of considering vulnerability as a constant in the analysis.
Regarding the hazard interval delimitation, the annual NR (kg N ha–1), the annual amount of nitrogen supplied (kg N) and the NO3 annual mean concentration were calculated for the 1992–2019 period, based on the crops listed within the study area. The correlation between both parameters was tested. To do this, based on previous works [40] and on spatial analyses currently in progress, a two-year time lag in NO3 concentration was considered. A time lag is required for a response in NO3 dynamics after nitrogen fertilization. This correlation was statistically significant (Pearson ρ = 0.46, p = 0.03), which allowed us to determine a correlation between the nitrogen supply and the NO3 concentration. From this correlation, the total amount of nitrogen needed per unit (kg N ha–1) to reach a certain NO3 concentration can be estimated.
With the aim of establishing a measurable criterion to the intervals, the legal limits of 25 mg L–1 and 50 mg L–1 were used as benchmarks between intervals. Thus, if we apply these benchmarks to the estimation of the NR and the hazard level, it can be observed that any NR higher than 22 kg N ha–1 would have potential for groundwater pollution. Three intervals were created depending on the NR and the NO3 concentrations: low hazard level, moderate hazard level and high hazard level (Table 4).

3. Results

Based on the crop map (Figure 4a), the NR map (Figure 5) and the hazard map were obtained (Figure 6). The highest nitrogen fertilizer requirements were found in the southwestern part of the lake, in the surroundings of Bello and Torralba de los Sisones. The nitrogen fertilizer requirements are especially high in irrigated areas, where expected yields are higher. NR in most of the study area was between 80 and 120 kg N/ha (8310 ha), whereas the extent of crops whose NR was higher than 120 kg N/ha was 195 ha. NR was null in natural areas and forests, natural pastures, grazing areas, and in legumes, which are able to obtain nitrogen without additional fertilizer supply.
Regarding the hazard NIHI map (Figure 6), most of the crops in the area are considered in the high hazard level (44% of the study area), whereas legumes, fodder crops and fallow lands are included within the low hazard level (23% of the study area). Finally, sunflower (3.8% of the study area) is included within the moderate hazard level.
The high hazard level is observed across the whole GGB. Except for the highest or steepest zones of the Sierra de Santa Cruz, which is parallel to the lake, high hazard areas can be observed in the rest of the study area. Even on the western shore of the lake, where the slope is steeper and water quickly flows to the lake, crops are classified in the high hazard level. Crops in the high hazard level were also observed at the east and north sides of the Sierra de Santa Cruz, as well as on the flat areas to the north, west and south sectors of the Gallocanta Lake, where large plots are devoted to winter cereals, corn and potato.
In relation to the low hazard level, pastures, and fallow lands are mostly located in the southwestern zones, the surroundings of the Gallocanta Lake and the Sierra de Santa Cruz. Due to steep gradients and poor soil quality in the sierra, natural areas are combined with pastures, whereas crops are found on the foothills. The flood plains in the south and southwestern surroundings of the Gallocanta Lake are also devoted to pastures, whereas fallow lands are commonly observed across the study area.

4. Discussion

4.1. Efectiveness of the NIHI

The NIHI has an interval delimitation basis, exclusively based on the nitrogen fertilizer requirements of the crops. The use of the nitrogen fertilizer requirements allows its application in a wide range of areas, since the method is flexible and adaptable to the agro-hydrological parameters of each place. Thus, a crop can have different NR and be classified in a hazard level depending on the study area.
When developing a hazard index or a risk methodology based on a quantitative approach, and one easy to map and reproduce, it is recommended to use a measurable parameter which may help to establish the thresholds between hazard intervals. This process should be preferential compared to indexes that establish levels of hazard based on arbitrary criteria. In the case of nitrate pollution, nitrate concentration has proved to be appropriate in different scenarios [32,45]. In this research, this parameter was used to create thresholds between hazard categories. Even though concentration can be used to calibrate the index, nitrate concentration is not a valid indicator of good versus bad agricultural management [46] (i.e., good agricultural management may also produce a high nitrate concentration in groundwater). The relationship between nitrogen supply and nitrate concentration may be weak due to several parameters related to intrinsic vulnerability. These reasons should be deeply analyzed when a risk assessment is being carried out. However, in a hazard assessment, those parameters related to vulnerability should not be considered. In any case, it must be highlighted that the aim of the index is to offer a better approach for interval delimitation, based on a measurable parameter instead of using arbitrary criteria.
The use of nitrate concentration to establish thresholds between intervals is also supported by the fact that it is the parameter used by water authorities to implement protection measures in groundwater bodies.
The ultimate objective of a hazard index is to develop a hazard map that could be useful for developing management and control measures to mitigate the negative effects of groundwater pollution and to improve the effectiveness of the environmental measures. To do so, when categorizing hazard intervals, the categories should be used to distinguish measurable levels of pollution of water bodies. The weakness of some indexes that consider vulnerability factors, or that rank hazards on a non-measurable basis, is that the intervals lack a realistic validity [35]. In the NIHI, the intervals estimate, in an approximate but measurable way, the potential effect of a certain crop on the groundwater quality. That is, a high hazard level means that the amount of nitrogen required in a plot would lead to the legal nitrate concentration threshold of 50 mg L–1 being exceeded.
Regarding the hazard maps, they usually establish thresholds on an arbitrary basis (e.g., regular intervals based on the data range), but they do not relate the real hazard influence over pollution of the aquifer. For this reason, other indexes classify most of the study area in the low or moderate hazard level [21], even though pollution is very high. Those maps could be considered as unsuccessful hazard maps.
As stated by De Girolamo et al. [22], the most suitable spatial unit for estimating diffuse pollution is the basin scale. However, by working on a plot scale within the basin, the level of detail of the hazard map increases. The plot scale may be considered as the management unit to control pollution, since it eases the delimitation of areas of significant hazard due to high nitrogen fertilizer requirements. The delimitation of those areas may be useful for establishing specific measures related to fertilization rates and dates. Those measures could be included in the action programs implemented in the Nitrate Vulnerable Zones. These programs have to be followed on a mandatory basis, but their effectiveness has been frequently questioned [47,48]. The lack of effectiveness of those programs can be related to the wrong conception of the most vulnerable zones. The term is used to define polluted zones without considering their intrinsic or specific vulnerability, and they are delimited using administrative units (e.g., municipalities), which have nothing to do with natural water boundaries.

4.2. Patterns in the Gallocanta Groundwater Body

Previous research in the area [37] already stated that traditional indexes have remarkable shortcomings when applied to rural areas such as the Gallocanta Basin, whereas the proposed methodology has shown better results. The fact that most parts of the study area are classified in the high hazard level is directly related to the situation stated in [21]. The authors described that most of the aquifers are highly polluted across the GGB, although the highest concentrations are found at the south and southwestern part of the lake, especially in the quaternary and the Cretaceous aquifers.
As can be seen in Figure 5, this area is devoted to crops with higher nitrogen fertilizer requirements, mostly due to irrigation. The comparison between the NIHI map and the nitrate concentration measured in sampling points shows a clear connection between them (Figure 6). However, even in sampling points where nitrate concentration is low (lower than 25 mg L–1), the surrounding areas are considered as highly hazardous. This is due two main reasons.
Firstly, when those sampling points are located in foothills, nitrate can be leached downwards, to flat areas, but it has no time to reach groundwater vertically. Additionally, those points are in relatively high and hilly areas, where agriculture activity is limited to small plots. Secondly, the study area is the lowest part of a larger basin, affected by regional groundwater flows. In the study area, groundwater flows from carbonated aquifers (Cretaceous and Jurassic) to the quaternary upper aquifer, which occupies the bottom of the basin [40], and the area formerly inundated by the Gallocanta paleo-lake [49]. Therefore, when nitrate is leached, it follows the regional flow and it is accumulated in certain areas.
Unfortunately, sampling equipment has not been installed in areas classified in the highest hazard level such as Castejón de Tornos (eastern part of the study area) and Torralba de los Sisones (southern part of the study area). Most of the arable land in those municipalities is devoted to crops with high NR; even in Torralba de los Sisones irrigated crops have been recently developed. From a hydrogeological approach, the connection of both areas with the lowest part of the basin (where the Gallocanta Lake is located) is dependent of the regional groundwater flows. Groundwater from the eastern part flows westwards through quaternary materials, whereas the southern area may be influenced by regional flows related to carbonated materials. The direction of groundwater flows in this area depends on the piezometric level, so water can flow northwards when the water table is low, and southwards if the water table is high enough [50].
The fact that the GGB is an endorheic basin strongly enhances both temporal persistence and nitrate accumulation in the aquifers. Similar effects have been detected in other saline endorheic basins by Valiente et al. [51]. This influences the low thresholds established to consider a crop in the moderate and high hazard levels. The relatively low water renewal rate is key in endorheic environments and pollution usually persists for decades. The role of denitrification processes when estimating groundwater’s intrinsic vulnerability has been already described by authors such as Aschonitis et al. [52] and Busico et al. [53]. In the Gallocanta Basin, Menéndez-Serra et al. [54] analyzed microbial functional composition, and they found predominance of potential nitrification, nitrate oxidation and nitrogen assimilation, whereas nitrate reduction and nitrate ammonification was lower. Unfortunately, there are no available data about denitrification processes and nitrogenous gas losses in the area.
The study area can be considered a good example of pollution dynamics in this type of environment, since pollution by nitrates from agriculture sources has been observed since the first measurements in the late 1970s [55]. Therefore, the delimitation of the most hazardous sites of the area could be a useful tool to solve the issue by paying more attention to the most hazardous areas.

5. Conclusions

Currently, risk analyses are usually carried out once an area has been polluted, and it requires mitigation and control measures. However, these types of environmental analyses are useful either when the area is polluted or if it is at risk. Hazard mapping must be based on measurable and comparable parameters, and the use of hazard maps when establishing mitigation and control measures in groundwater is highly recommended, especially in the current climate change scenario, when water scarcity may be recurrent.
The NIHI is a powerful hazard index that can be used to estimate the environmental consequences (NO3 concentration in groundwater) of agricultural activities, based on its characteristics and nitrogen fertilizer requirements (NR). The index provides advantages for hazard analysis and mapping: compared to previous methods, which may be confusing, it allows independent assessment of hazard factors and the hazard intervals are based on the relation between nitrogen input and the level of groundwater pollution. In addition, the method is adaptable so it can be easily applied to a wide range of scenarios.
Our results in the GGB showed that most of the study area presents a high hazard level. The hazard classification displayed in the hazard map is in line with the high NO3 concentration observed in the GGB since the late 1970s. The NIHI map provides a more realistic hazard map compared to previous hazard indexes, which underestimate hazard levels and classified most of the study area in the low and moderate hazard levels.
The hazard map obtained by the NIHI application may be used for future risk assessments and, eventually, as a tool to apply specific control measures in certain areas that are potentially at risk of increased nitrate pollution. In the GGB, the control programs implemented during the past decades have proven failures due to the lack of appropriate criteria when delimiting the Nitrate Vulnerable Zones, and recurrent stoppages in water supply due to high NO3 concentration have affected some of the villages in the area. Therefore, any tool that may improve the implementation of more accurate spatial measures, together with a better understanding of the hydrogeological dynamics, would lead to a recovery of groundwater quality in a more effective and rapid way.

Author Contributions

Conceptualization, J.M.O.-M. and M.J.P.R.; methodology, J.M.O.-M., M.J.P.R. and J.C.; formal analysis, J.M.O.-M. and J.C.; data curation, J.C.; writing—original draft preparation, J.M.O.-M.; writing—review and editing, M.J.P.R. and J.C.; visualization, J.M.O.-M. and J.C.; supervision, M.J.P.R. and J.C.; project administration, J.C.; funding acquisition, J.C. All authors have read and agreed to the published version of the manuscript.

Funding

This research was funded by the Government of Aragon, grant number C137/2016, by the Spanish Ministry of Economy and Competitiveness—FEDER funds [EU] via the Research Project Agro-SOS, grant number PID2019-108057RB-I00, and by the Regional Government of Andalucía, grant number GGI3002IDIS.

Institutional Review Board Statement

Not applicable.

Informed Consent Statement

Not applicable.

Data Availability Statement

Data related to types of crops have been provided by the Government of Aragon, previous official request at (https://www.aragon.es/-/estadisticas-agrarias, accessed on 30 September 2020). Data about land use were obtained from the Official Spanish Cadastre (http://www.sedecatastro.gob.es/, accessed on 6 October 2020). Finally, data related to groundwater quality were freely available from the Hydrographic Ebro Confederation database (http://www.datossubterraneas.chebro.es:81/WCAS/, accessed on 20 October 2020).

Acknowledgments

The authors wish to thank Samuel Esteban and Jose Manuel Bienzobas (Government of Aragón) for their cooperation and help in providing official data.

Conflicts of Interest

The authors declare no conflict of interest. The funders had no role in the design of the study; in the collection, analyses, or interpretation of data; in the writing of the manuscript, or in the decision to publish the results.

References

  1. Capri, E.; Civita, M.; Corniello, A.; Cusimano, G.; De Maio, M.; Ducci, D.; Fait, G.; Fiorucci, A.; Hauser, S.; Pisciotta, A.; et al. Assessment of nitrate contamination risk: The Italian experience. J. Geochem. Explor. 2009, 102, 71–86. [Google Scholar] [CrossRef] [Green Version]
  2. Sutton, M.A.; Howard, C.M.; Erisman, J.W.; Billen, G.; Bleeker, A.; Grennfelt, P.; Van Grinsven, H.; Grizzetti, B. The European Nitrogen Assessment: Sources, Effects and Policy Perspectives; Cambridge University Press: New York, NY, USA, 2011. [Google Scholar]
  3. Zhang, H.; Yang, R.; Wang, Y.; Ye, R. The evaluation and prediction of agriculture-related nitrate contamination in groundwater in Chengdu Plain, southwestern China. Hydrogeol. J. 2019, 27, 785–799. [Google Scholar] [CrossRef]
  4. Su, X.; Wang, H.; Zhang, Y. Health Risk Assessment of Nitrate Contamination in Groundwater: A Case Study of an Agricultural Area in Northeast China. Water Resour. Manag. 2013, 27, 3025–3034. [Google Scholar] [CrossRef]
  5. Ahmed, M.; Rauf, M.; Mukhtar, Z.; Saeed, N.A. Excessive use of nitrogenous fertilizers: An unawareness causing serious threats to environment and human health. Environ. Sci. Pollut. Res. 2017, 24, 26983–26987. [Google Scholar] [CrossRef]
  6. Larsen, M.A.D.; Soegaard, H.; Hinsby, K. Temporal trends in N & P concentrations and loads in relation to anthropogenic effects and discharge in Odense River 1964–2002. Hydrol. Res. 2008, 39, 41–54. [Google Scholar] [CrossRef]
  7. Billen, G.; Garnier, J.; Lassaletta, L. The nitrogen cascade from agricultural soils to the sea: Modelling nitrogen transfers at regional watershed and global scales. Philos. Trans. R. Soc. B Biol. Sci. 2013, 368. [Google Scholar] [CrossRef]
  8. Merchán, D.; Auqué, L.F.; Acero, P.; Gimeno, M.J.; Causapé, J. Environment Geochemical processes controlling water salinization in an irrigated basin in Spain : Identification of natural and anthropogenic in fluence. Sci. Total Environ. 2015, 502, 330–343. [Google Scholar] [CrossRef]
  9. Viers, J.H.; Liptzin, D.; Rosenstock, T.S.; Jensen, V.B.; Hollander, A.D.; McNally, A.; King, A.M.; Kourakos, G.; Lopez, E.M.; De La Mora, N.; et al. Nitrogen Sources and Loading to Groundwater. Technical Report 2. In Addressing Nitrate in California’s Drinking Water with a Focus on Tulare Lake Basin and Salinas Valley Groundwater. Report for the State Water Resources Control Board Report to the Legislature; Center for Watershed Sciences, Ed.; University of California: Davis, CA, USA, 2012; pp. 53–131. [Google Scholar]
  10. Novotny, V. Diffuse pollution from agriculture—A worldwide outlook. Water Sci. Technol. 1999, 39, 1–13. [Google Scholar] [CrossRef]
  11. Merrington, G.; Winder, L.; Parkinson, R.; Redman, M. Agricultural Pollution: Problems and Practical Solutions; Spon Press: London, UK; New York, NY, USA, 2002. [Google Scholar]
  12. Dorgham, M. Effects of Eutrophication. In Eutrophication Causes, Consequences and Control; Ansari, A.A., Gill, S.S., Eds.; Springer: Dordrecht, The Netherlands, 2013; Volume 2, pp. 29–44. [Google Scholar]
  13. Ward, M.H. Too much of a good thing? Nitrate from nitrogen fertilizers and cancer. Rev. Environ. Health 2009, 24, 357–363. [Google Scholar] [CrossRef] [PubMed]
  14. Canada Water Act. Canada Justice Law Website. Available online: https://laws-lois.justice.gc.ca/eng/acts/c-11/index.html (accessed on 13 November 2020).
  15. USGS. United States Geological Survey. Available online: https://www.usgs.gov/mission-areas/water-resources/science/national-water-quality-assessment-nawqa-1991-2012?qt-science_center_objects=0#qt-science_center_objects (accessed on 13 November 2020).
  16. Europan Economic Council. Council Directive 2000/60/EC; European Commission: Brussels, Belgium, 2000. [Google Scholar]
  17. European Economic Community (EEC). Council Directive 91/676/EEC; European Economic Community: Brussels, Belgium, 1991. [Google Scholar]
  18. European Union. Council Directive 2006/118/EC; European Commission: Brussels, Belgium, 2006. [Google Scholar]
  19. Malagó, A.; Bouraoui, F.; Pastori, M.; Gelati, E. Modelling nitrate reduction strategies from diffuse sources in the Po River Basin. Water 2019, 11, 1030. [Google Scholar] [CrossRef] [Green Version]
  20. Arauzo, M.; Martínez-Bastida, J.J. Environmental factors affecting diffuse nitrate pollution in the major aquifers of central Spain: Groundwater vulnerability vs. groundwater pollution. Environ. Earth Sci. 2015, 73, 8271–8286. [Google Scholar] [CrossRef] [Green Version]
  21. Orellana-Macías, J.M.; Merchán, D.; Causapé, J. Evolution and assessment of a nitrate vulnerable zone over 20 years: Gallocanta groundwater body (Spain). Hydrogeol. J. 2020, 28, 2207–2221. [Google Scholar] [CrossRef]
  22. De Girolamo, A.M.; Spanò, M.; D’Ambrosio, E.; Ricci, G.F.; Gentile, F. Developing a nitrogen load apportionment tool: Theory and application. Agric. Water Manag. 2019, 226, 105806. [Google Scholar] [CrossRef]
  23. UNDRO. Natural Disasters and Vulnerability Analysis. Report of Experts Group Meeting of 9–12 July 1979; UNDRO: Geneva, Switzerland, 1980. [Google Scholar]
  24. UN/ISDR (United Nations/International Strategy for Disaster Reduction). Living with Risk: A Global Review of Disaster Reduction Initiatives; United Nations: Geneva, Switzerland, 2004.
  25. UN/ISDR (United Nations/International Strategy for Disaster Reduction). Global Assessment Report on Disaster Risk Reduction; United Nations: Geneva, Switzerland, 2009.
  26. Birkmann, J. Risk. In Encyclopedia of Natural Hazards. Encyclopedia of Earth Sciences Series; Bobrowsky, P.T., Ed.; Springer: Dordrecht, The Netherlands, 2013. [Google Scholar] [CrossRef]
  27. Nadim, F. Hazard. In Encyclopedia of Natural Hazards. Encyclopedia of Earth Sciences Series; Bobrowsky, P.T., Ed.; Springer: Dordrecht, The Netherlands, 2013. [Google Scholar] [CrossRef]
  28. Civita, M.V.; De Maio, M. Assessing Groundwater contamination risk using ArcInfo via GRID function. In Proceedings of the ESRI Conference, San Diego, CA, USA, 8–11 July 1997. [Google Scholar]
  29. Foster, S.; Hirata, R.; Gomes, D.; D’Elia, M.; Paris, M. Groundwater Quality Protection; World Bank: Washington, DC, USA, 2002. [Google Scholar]
  30. De Ketelaere, D.; Hötzl, H.; Neukum, C.; Civita, M.; Sappa, G. Hazard Analysis and Mapping. In Vulnerability and Risk Mapping for the Protection of Carbonate (Karst) Aquifers (COST Action 620); Zwahlen, F., Ed.; Directorate-General XII Science, Research and Development, European Commission: Brussels, Belgium, 2004; pp. 86–105. [Google Scholar]
  31. Padovani, L.; Trevisan, M. I nitrati di origine agricola nelle acque sotterranee. Quad di Tech di Prote Ambien 75. Pitagora Editrice 2002, 15, 103. [Google Scholar]
  32. Passarella, G.; Vurro, M.; D’Agostino, V.; Giuliano, G.; Barcelona, M.J. A probabilistic methodology to assess the risk of groundwater quality degradation. Environ. Monit. Assess. 2002, 79, 57–74. [Google Scholar] [CrossRef]
  33. Diodato, N.; Esposito, L.; Bellocchi, G.; Vernacchia, L.; Fiorillo, F.; Guadagno, F.M. Assessment of the Spatial Uncertainty of Nitrates in the Aquifers of the Campania Plain (Italy). Am. J. Clim. Chang. 2013, 2, 128–137. [Google Scholar] [CrossRef] [Green Version]
  34. Shaffer, M.J.; Delgado, J.A. Essentials of a national nitrate leaching index assessment tool. J. Soil Water Conserv. 2002, 57, 327–335. [Google Scholar]
  35. Birkle, D.; French, C.; Letey, J.; Wu, L.; Wood, Y. Nitrate leaching hazard index developed for irrigated agriculture. J. Soil Water Conserv. 2005, 60, 1–5. [Google Scholar]
  36. O’Geen, A.T.; Hopmans, J.; Harter, T. California Department of Food and Agriculture. Available online: https://www.cdfa.ca.gov/is/docs/14-0452-OGeen.pdf (accessed on 15 September 2020).
  37. Orellana-Macías, J.M.; Perles Roselló, M.J. A comparative analysis of methods for mapping groundwater pollution hazard: Application to the Gallocanta Hydrogeologic Unit. Boletín Asoc. Geógrafos Españoles 2020. (In Spanish) [Google Scholar] [CrossRef]
  38. Corniello, A.; Ducci, D.; Ruggieri, G. Areal identification of groundwater nitrate contamination sources in periurban areas. J. Soils Sediments 2007, 7, 159–166. [Google Scholar] [CrossRef]
  39. Hair, J.; Anderson, R.; Tatham, R.; Black, W. Análisis Multivariante; Prentice Hall Iberia: Madrid, Spain, 1999. [Google Scholar]
  40. San Román, J. Establecimiento de las Normas de Explotación de la Unidad Hidrogeológica “Gallocanta” y Delimitación de los Perímetros de Protección de la Laguna; Confederación Hidrográfica del Ebro: Zaragoza, Spain, 2003. [Google Scholar]
  41. Gracia, F.J.; Gutiérrez, F.; Gutiérrez, M. Evolución geomorfológica del polje de Gallocanta (Cordillera Ibérica). Rev. Soc. Geol. España 1999, 12, 351–368. [Google Scholar]
  42. MAPA. Balance del Nitrógeno en la Agricultura Española: Año 2016; Ministerio de Agricultura, Pesca y Alimentación: Madrid, Spain, 2018.
  43. Jiménez-Madrid, A.; Martínez, C.; Luque, J.A.; Rubio-Campos, J.C.; Carrasco, F. Estrategias de protección del agua subterránea destinada al consumo humano en la cuenca del Guadalquivir. Bol. Geol. Min. 2013, 124, 3–19. [Google Scholar]
  44. CHE (Confederación Hidrográfica del Ebro). Available online: https://www.chebro.es/ (accessed on 20 October 2020).
  45. Ducci, D. An easy-To-use method for assessing nitrate contamination susceptibility in groundwater. Geofluids 2018. [Google Scholar] [CrossRef]
  46. UCANR. University of California Agriculture and Natural Resources. Available online: http://ciwr.ucanr.edu/files/168490.pdf (accessed on 15 September 2020).
  47. Arauzo, M.; Valladolid, M. Drainage and N-leaching in alluvial soils under agricultural land uses: Implications for the implementation of the EU Nitrates Directive. Agric. Ecosyst. Environ. 2013, 179, 94–107. [Google Scholar] [CrossRef] [Green Version]
  48. Macgregor, C.J.; Warren, C.R. Evaluating the Impacts of Nitrate Vulnerable Zones on the Environment and Farmers’ Practices: A Scottish Case Study. Scott. Geogr. J. 2015, 132, 1–20. [Google Scholar] [CrossRef] [Green Version]
  49. Luzón, A.; Pérez, A.; Mayayo, M.J.; Soria, A.R.; Sánchez Goñi, M.F.; Roc, A.C. Holocene environmental changes in the Gallocanta lacustrine basin, Iberian Range, NE Spain. Holocene 2007, 17, 649–663. [Google Scholar] [CrossRef]
  50. ITGE (Instituto Tecnológico y Geológico de España). Plan Nacional de Investigación de Aguas Subterrráneas de la Cuenca del Ebro; Ministerio de Industria y Energía: Zaragoza, Spain, 1982.
  51. Valiente, N.; Carrey, R.; Otero, N.; Soler, A.; Sanz, D.; Muñoz-Martín, A.; Jirsa, F.; Wanek, W.; Gómez-Alday, J.J. A multi-isotopic approach to investigate the influence of land use on nitrate removal in a highly saline lake-aquifer system. Sci. Total Environ. 2018, 631–632, 649–659. [Google Scholar] [CrossRef] [PubMed]
  52. Aschonitis, V.G.; Mastrocicco, M.; Colombani, N.; Salemi, E.; Castaldelli, G. Assessment of the intrinsic vulnerability of agricultural land to water and nitrogen losses: Case studies in Italy and Greece. IAHS-AISH Proc. Rep. 2014, 364, 14–19. [Google Scholar] [CrossRef] [Green Version]
  53. Busico, G.; Kazakis, N.; Colombani, N.; Khosravi, K.; Voudouris, K.; Mastrocicco, M. The importance of incorporating denitrification in the assessment of groundwater vulnerability. Appl. Sci. 2020, 10, 2328. [Google Scholar] [CrossRef] [Green Version]
  54. Menéndez-Serra, M.; Triadó-Margarit, X.; Castañeda, C.; Herrero, J.; Casamayor, E.O. Microbial composition, potential functional roles and genetic novelty in gypsum-rich and hypersaline soils of Monegros and Gallocanta (Spain). Sci. Total Environ. 2019, 650, 343–353. [Google Scholar] [CrossRef] [PubMed]
  55. IGME. Proyecto para la Actualización de Datos de la Cuenca alta del Jiloca. Estudio Sobre las Explotaciones, Problemática del Uso del Acuífero y Ordenación del Mismo. Ministerio de Industria y Energía, Secretaría de la Energía y Recursos Minerals: Zaragoza, Spain, 1986. [Google Scholar]
Figure 1. Correspondence between NO3 concentration in groundwater and nitrogen input in surface.
Sustainability 13 06321 g001
Figure 2. Location of the Gallocanta Groundwater Basin (GGB).
Sustainability 13 06321 g002
Figure 3. Geological cross-section of the GGB, adapted from San Román, 2003.
Sustainability 13 06321 g003
Figure 4. (a) Agricultural land use in 2019; (b) agricultural water management in 2019.
Sustainability 13 06321 g004
Figure 5. Nitrogen fertilization requirement (NR) map.
Sustainability 13 06321 g005
Figure 6. Nitrogen Input Hazard Index (NIHI) and NO3 map.
Sustainability 13 06321 g006
Table 1. Data for the multivariate clustering analysis.
IDNO3 [mg L–1]NRVulnerability
11279075
2651673
3528537
426079
5539866
66066
71149837
81109837
9154079
10579866
111137866
121129766
137612779
Table 2. Cluster multivariate analysis.
ClusternNO3 [mg L–1]VulnerabilityNR
18826686
2362730
321123798
Table 3. Nitrogen fertilization requirements of the crops listed in the Gallocanta Groundwater Basin.
GroupCropNR (kg N ha–1)RainfedIrrigatedHa
CerealsWheat97XX1664
Barley98XX6809
Oat74X 46
Rye69XX967
Triticale79X 418
Corn263 X5
LegumesVetch- *X 6
Bitter Vetch- *X 11
TubersPotato192 X21
Industrial cropsSunflower38XX861
Fodder cropsAlfalfa- *X 924
Sainfoin- *X 303
VegetablesCucumber44 X0.5
Tomato117 X0.5
Onion91 X1
Carrot136 X0.2
Other vegetables147 X1
Fruit treesAlmond58X 10
* Nitrogen fixation in legumes. Nitrogen fertilization was not considered.
Table 4. Hazard levels according to NO3 concentration and NR thresholds.
NO3 Concentration (mg L1)NR (kg N ha1)Hazard Level
<25<22Low
25–5022–45Moderate
>50>45High
Publisher’s Note: MDPI stays neutral with regard to jurisdictional claims in published maps and institutional affiliations.

