Article

Comparison of Coupling Coils for Static Inductive Power-Transfer Systems Taking into Account Sources of Uncertainty

1
Université Paris-Saclay, CentraleSupélec, CNRS, Laboratoire de Génie Electrique et Electronique de Paris, 91192 Gif-sur-Yvette, France
2
Sorbonne Université, CNRS, Laboratoire de Génie Electrique et Electronique de Paris, 75252 Paris, France
*
Author to whom correspondence should be addressed.
Sustainability 2021, 13(11), 6324; https://doi.org/10.3390/su13116324
Submission received: 28 April 2021 / Revised: 27 May 2021 / Accepted: 28 May 2021 / Published: 2 June 2021

Abstract

:
The present work aims at comparing different coupling coils by taking into account sources of uncertainty for static inductive power-transfer (SIPT) systems. Due to the maximum transmission efficiency for the SIPT system related to the mutual inductance between coils, the key point here is to make use of a sparse polynomial chaos expansion (PCE) method to analyze the mutual inductance between the transmitter and the receiver. A fast postprocess-sensitivity analysis allowed the identification of which source of uncertainty was the most influential factor to the mutual inductance for different coupling coils. Furthermore, in view of the relationship between the maximum transmission efficiency and the ratio of the length of wires of a coil and the mutual inductance, circular coupling coils should be recommended for SIPT systems.

1. Introduction

Transportation is facing various challenges due to environmental concerns, including the depletion of fossil fuels, global warming, and local pollutin. In this scenario, electrical vehicles (EVs) can widely help to solve these problems. However, the well-known disadvantages of EVs are the capacity of the battery, the impact of different penetration levels of plug-in EVs, and so on [1]. So, inductive power transfer (IPT) promises convenient, autonomous, and highly efficient charging of EVs [2].
To achieve affordable and efficient coupling coils for IPT systems, many papers [3,4,5,6] present different structures of coils and corresponding distinctive features, such as robustness to misalignment, reduction of the magnetic field pollution, or efficiency. Several books [7,8] present general guidelines for the design of the coils. In [9,10], a simulation study was carried out to explore the variation in the coupling coefficient for different coil configurations, but without considering the influence of the ferrite under different air gaps and coil misalignments. In [11], a comparison of different coupler topologies based on several evaluation criteria was performed. The performances of coupling systems were evaluated and compared for various air gaps and lateral misalignments, but the work did not reveal which factor had the greater influence on the efficiency. In [12], parametric performance evaluations of circular, rectangular, and double-sided winding resonant coils were taken into account separately using finite element modeling (FEM) and comprising air gap variation and longitudinal and lateral misalignment. In [13], circular coils were designed and investigated for planar and angular misalignment through the FEM model. Reference [14] proposed the use of an analytical behavioral model, able to relate mutual inductance to a wide range of misalignment conditions for IPT coil system (axial, lateral, and rotational). However, in such previous publications, the number of possible misalignments conditions was limited, and no accurate comparison among different coupling coils was given.
In a real scenario, various sets of different misalignments and rotations of the receiver (more than three) may occur during parking [15]. So, 3D full-wave computations are needed to assess the performance of an IPT system. Nevertheless, the use of complex simulation tools leads to heavy computations in the case of wide parametric analysis. In order to decrease the cost of the numerical simulation, a variety of metamodeling techniques have been developed, such as Kriging, polynomial chaos expansions, support vector regression, and so on [3,16,17,18]. The study in [16] considered Kriging and polynomial chaos expansions to discuss the magnetic field in the dynamic IPT and the influence of the ferrite on efficiency in a static IPT. The study in [18] introduced least-square support vector machine (LS-SVM) regressions to consider a wireless power transfer system for extremely low power mounted on a printed circuit board. However, the uncertainty quantification came from the industrial fabrication system. In [3], the authors described how the uncertainties in the components and material parameters of the SAE J2954 system affected the efficiency of the system from the probability density function without the misalignments of the receiver.
In this paper, we present a comparison of different coupling coils with ferrite plates for a static inductive power transfer system with a better choice. It is based on a computation approach combining the 3D-FEM numerical tool COMSOL [19] and a metamodeling method—polynomial chaos expansion (PCE). This PCE method allows the performing of uncertainty quantification in a very accurate way and with a significantly reduced computational cost with respect to conventional simulation techniques. The interest of this solution is to determine how the performance of SIPT can be affected by the sources of uncertainty (such as misalignment along the X/Y/Z axes and the rotation angle on the receiver). The investigation was performed for different coupling coils, including ferrite plates (circle, square, and bipolar (BP)).
The paper is organized as follows. Section 2 introduces the SIPT system with different coupling coils with ferrite plates and covers the maximum transmission efficiency of the SIPT system related to the coupling coil’s mutual inductance. Section 3 presents sources of uncertainty during parking for the coupling coils and reviews a sparse polynomial chaos expansion (PCE) based on samples obtained from a 3D electromagnetic analysis to provide an efficient metamodel of the mutual inductance at a low cost. Section 4 shows which factor most influenced the mutual inductance of the SIPT system for different coupling coils according to a sensitivity analysis using the sparse PCE metamodel. Section 5 underlines the relationship between the maximum transmission efficiency and the ratio of the length of wires and the mutual inductance to define the optimal configuration among these coupling coils. Finally, Section 6 provides conclusions and future prospects.

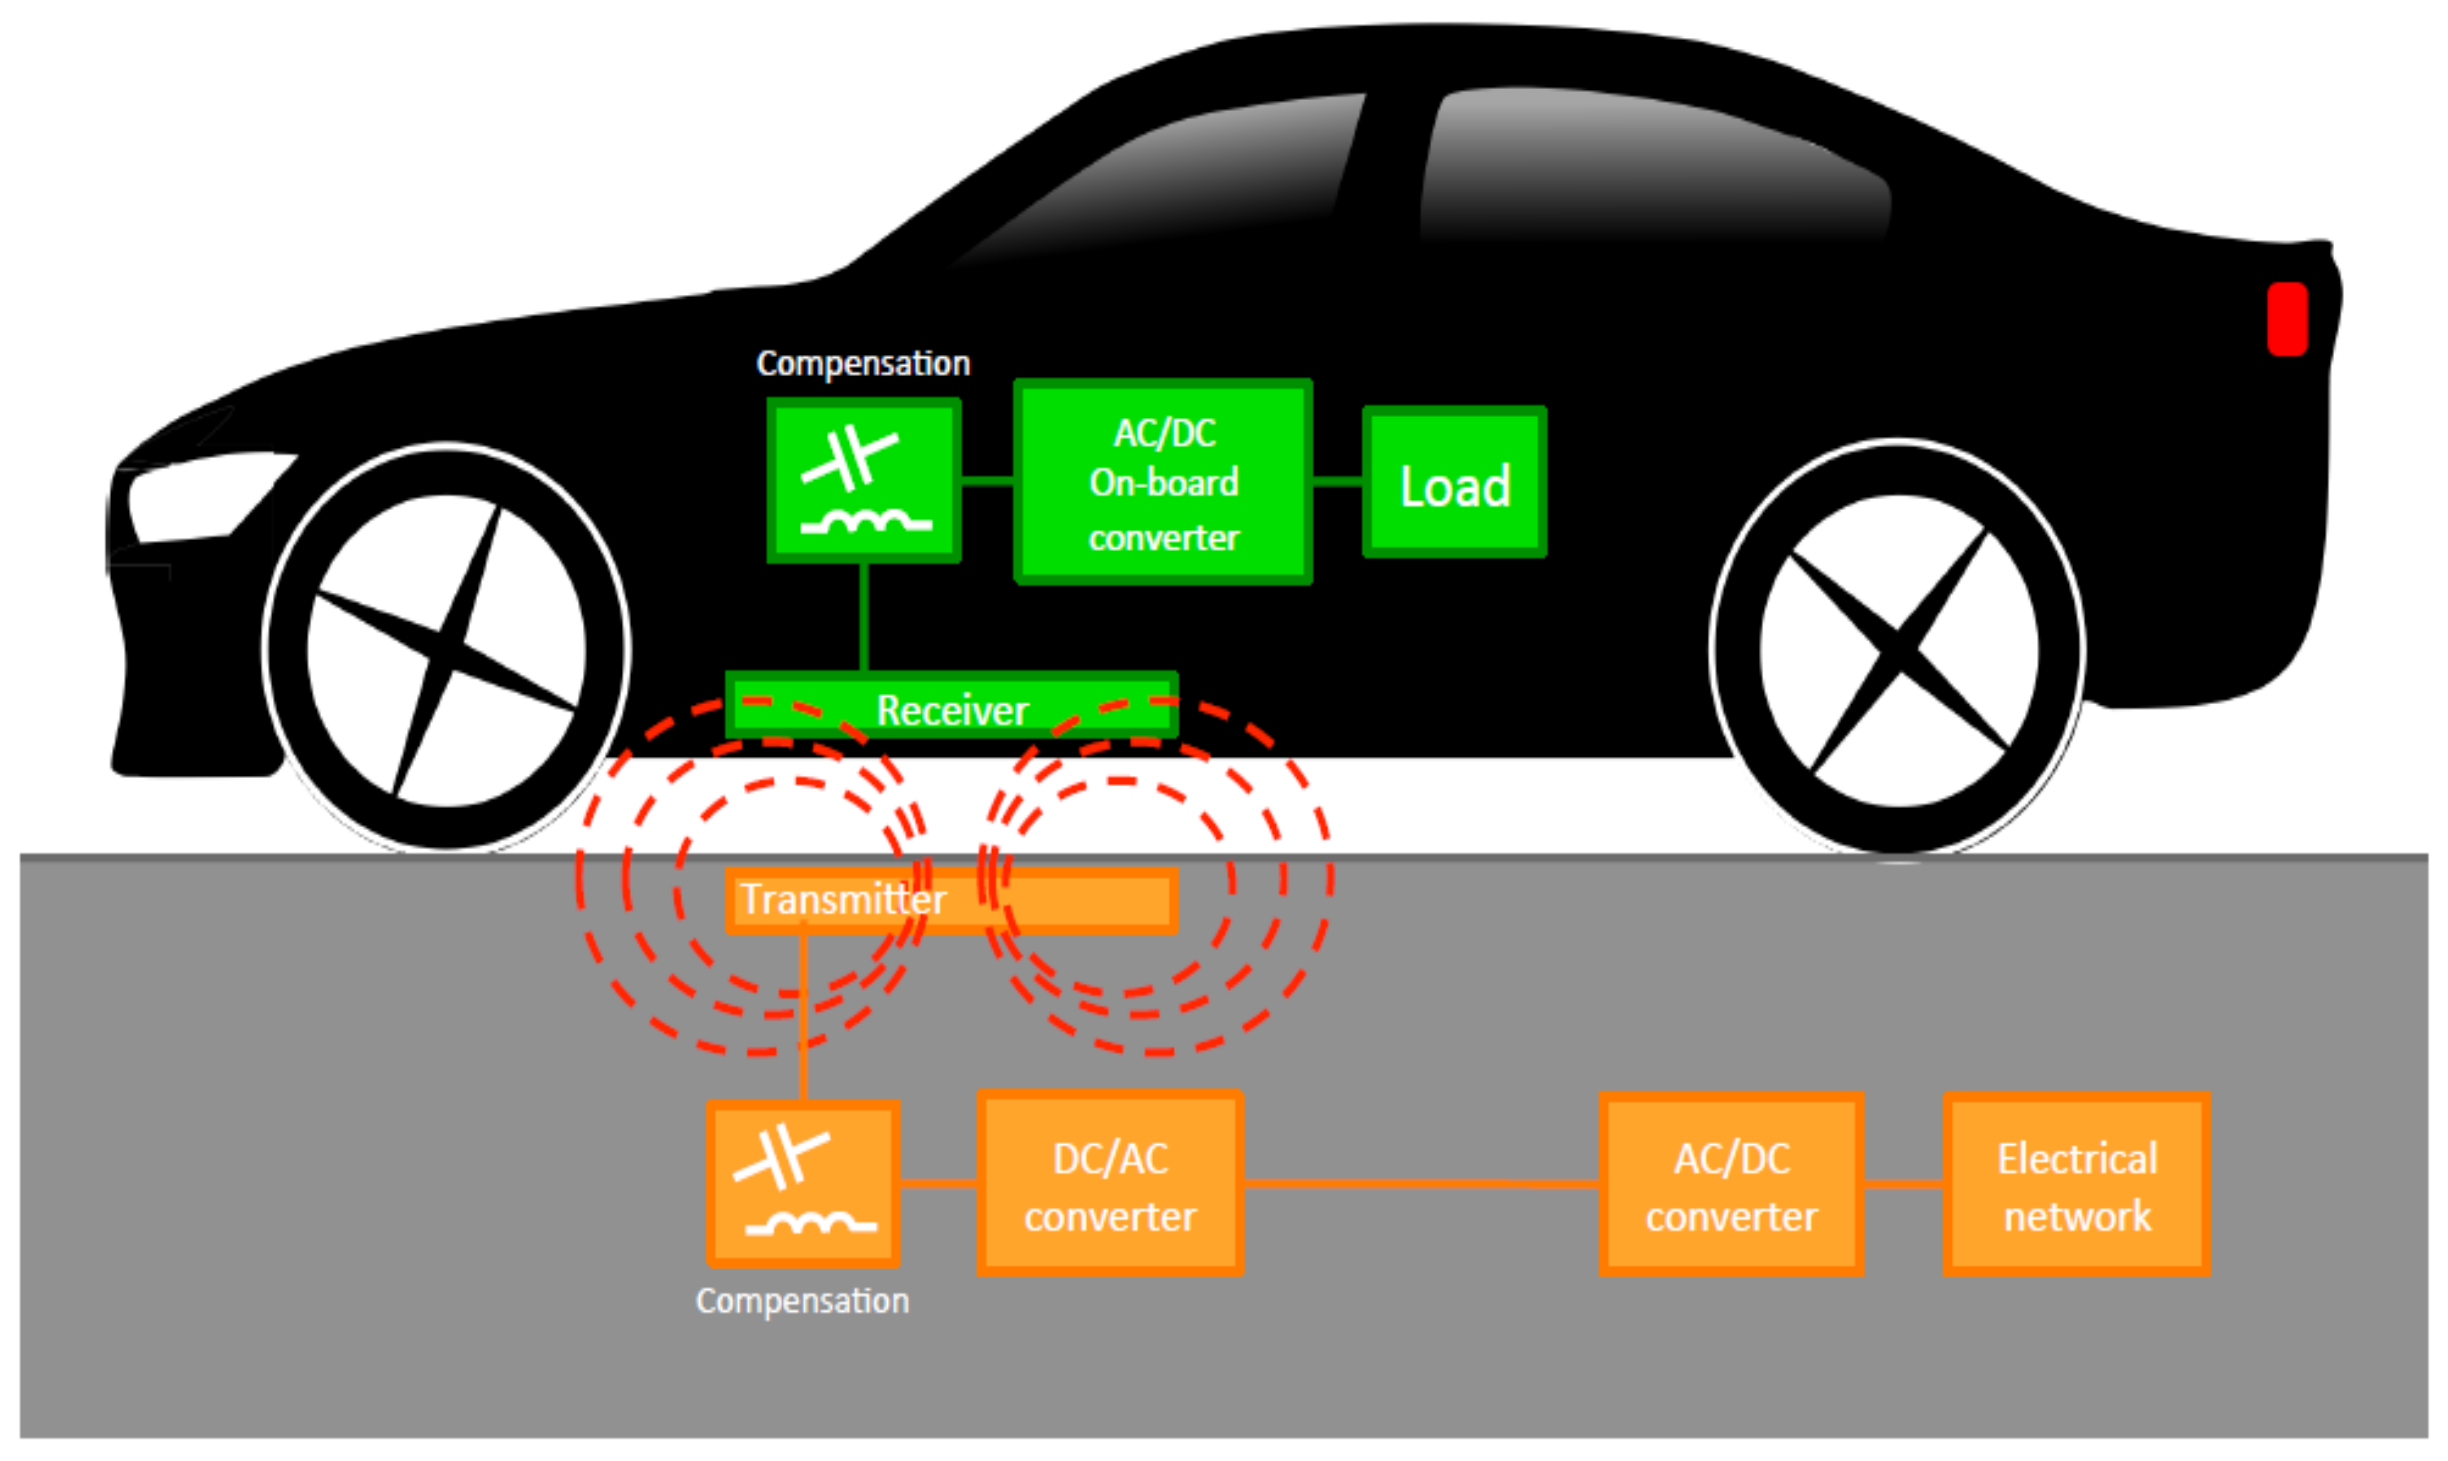
2. Static Inductive Power Transfer Systems

The block diagram of a static inductive power-transfer system is shown in Figure 1. The electrical network provides a DC-link voltage for the SIPT system through the AC/DC converter with power factor correction. The SIPT system consists of an inverter stage at the transmitter side, resonant compensation networks for the transmitter and the receiver, and the rectifier at the receiver side. The magnetic field produced by the transmitter induces an alternating field in the receiver. The AC power is then rectified in order to charge the battery. Compensation networks were added to the transmitter and the receiver to create the resonant case and reduce additional losses [2,4,13,15,20,21]. These converters are commonly used to reduce the switching frequency ripple of the charging current and to control the current or the voltage to the battery [2,4,13,15,21,22].
The specifications of an SIPT system include the air gap between the transmitter and the receiver, maximum size, and a specific shape of the coils. However, these specifications often result from the geometrical constraints of the application and cannot be changed in the design process [21,22]. For SIPT systems in this paper, the designing shape, size, and placement of the components (coils, ferrite) were identical for the transmitter and the receiver (see Figure 1).

2.1. Coil Geometry in SIPT System

A realization of real-scale coils consumes a lot of time and is costly, especially considering the price of the materials used (wire and ferrite). To save time and cost, the coils here were not built in real sizes, but miniaturized at a scale of 1:10. The circular coils, square coils, and bipolar coils in small-scale shapes are shown in Figure 2. These structures are well-known and widely studied to increase the transmission efficiency of inductive power transfer systems [15,20]. The current I 1 for square coupling coils and circular coupling coils was the same as the current I 1 in BP coupling coils. Here, Figure 2a,d,g were defined in [23] and built in the GeePs laboratory. The coils were made of Litz wires with 6 turns distributed in 2 layers. The width of the cross-section of the coil was 2.4 mm. The thickness of the ferrite was 2 mm, and its relative permeability was 2500 [23].

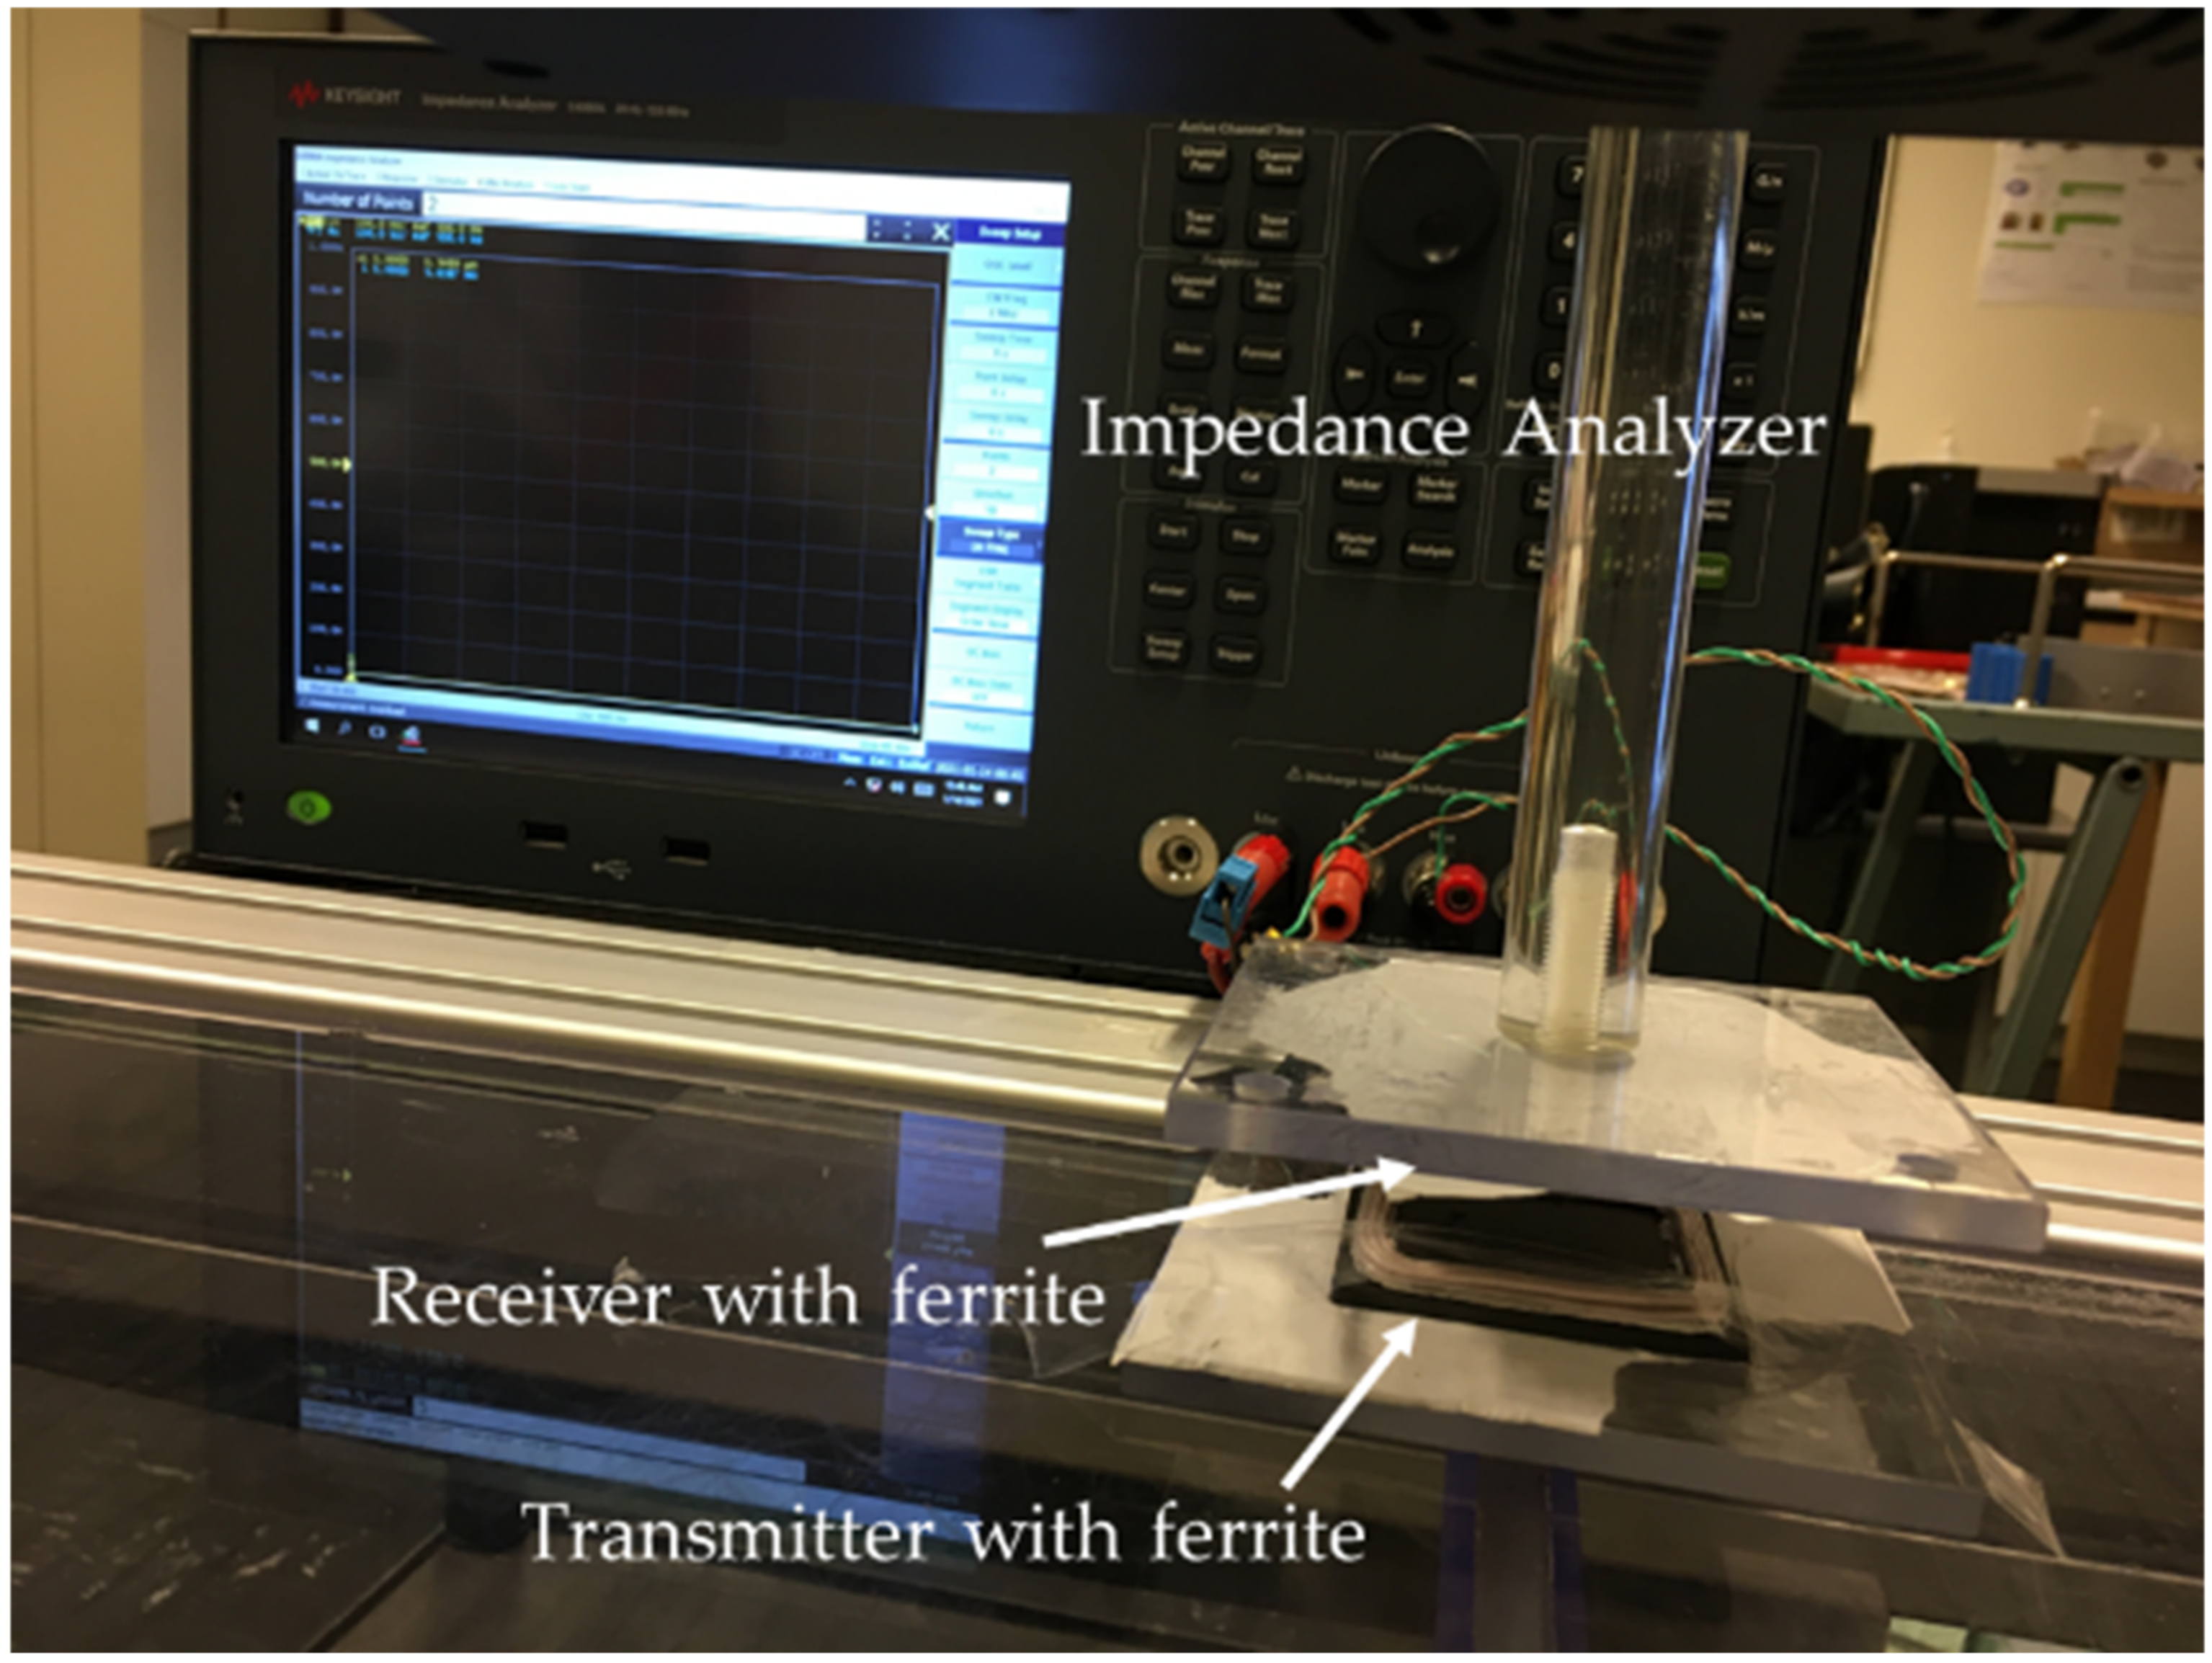
2.2. Methodology to Calculate the Maximum Transmission Efficiency

Generally, due to the large air gap of the SIPT system, the magnetic coupling of SIPT coils is low when compared with a traditional transformer [15]. In order to achieve a high transmission efficiency despite the high leakage inductance, a resonant compensation of the coupling coils is needed. In order to reduce the power requirements for the power electronic converter, a resonant capacitor C 1   or   C 2 is connected to the transmitter L 1 or the receiver L 2 , either in parallel or in series. So, there are four principle topologies of the resonant circuit in the SIPT system: series–series (SS), series–parallel (SP), parallel–series (PS), and parallel–parallel (PP) [13,15,20,21]. Here, the SS compensation was taken into account to analyze the power transmission efficiency of the IPT system, as shown in Figure 3 (R1 and R2 in Figure 3 represent the resistances of the transmitter and the receiver, respectively). According to [13,20,21], the condition of resonance in the SS compensation remains stable at the same frequency, independently of the variations of the mutual inductance and the load. Here, the resonance frequency f 0 was defined to be 85 kHz [20,22,23].
Using the definition given in [24], the coupling coefficient k is defined by the ratio of the mutual inductance M and the geometric mean of the two self-inductances L 1 and   L 2 :
k = M L 1 L 2
The transmitter and the receiver coil quality factors are defined as in [24]:
Q i = w L i R i
where i = 1 , 2 stands for the transmitter and the receiver, respectively; L i   a n d   R i are the self-inductance and resistance of each coil (as shown in Figure 3), respectively; and w = 2 π f represents the angular transmission frequency.
Moreover, the system quality factor Q is defined as the geometric mean of two coil quality factors Q 1 a n d   Q 2 [25]:
Q = Q 1 Q 2 = w L 1 L 2 R 1 R 2
So, the equation to calculate the maximum transmission efficiency η m a x in this part can be simplified as below when the product of the coupling coefficient k and the inductor quality factor Q is much higher than 1 [21,25], and the angular resonance frequency w 0 = 2 π f 0 is equal to the angular transmission frequency w:
η m a x = k Q 2 ( 1 + 1 + k Q 2 ) 2 1 2 k Q = 1 2 R 1 R 2 w 0 M = 1 R 1 π f 0 M
Equation (4) highlights the impact of mutual inductance M on the SIPT maximum transmission efficiency when the resonance frequency f 0 is defined, and the transmitter and the receiver are equivalent.

3. Mutual Inductance Metamodeling for SIPT Systems

The purpose of this section is to build up a sparse PCE metamodel of the mutual inductance M in order to reduce the computational cost of heavy parametric analysis and study the behavior of different coupling coils. Furthermore, it is particularly interesting to assess the rank of the sources of uncertainty according to their influence on the variability of the mutual inductance.

3.1. Sources of Uncertainty in the SIPT System

To investigate the transmission efficiency of the SIPT system, it is mandatory to take into account the sources of uncertainty, such as variations in the misalignment due to parking alignment, and variations in air gap due to loading and unloading the vehicle. Figure 4 shows the rotation angle along the Z axis α , the misalignment along the X axis Δ x , the misalignment along the Y axis Δ y , and the air gap between the two coils Δ z related to the circular coupling coils. These situations also took place in the square coupling coils and the BP coupling coils.
The impact of these influencing factors on the value of the mutual inductance M was evaluated. The mutual inductance M was numerically computed as M = V 2 j 2 π f I 1 , defined as the ratio between the open-circuit voltage of the receiver and the current of the transmitter [21], which was evaluated using the COMSOL AC/DC module [19] for convenience. Figure 5 displays the measurement of the mutual inductance of the coupling coils when the air gap between the transmitter and the receiver was 15 mm and in the case of alignment (this position was assumed as the nominal position) using an impedance analyzer. In order to confirm the reliability of the coupling coils’ 3D model, Table 1 shows the comparison between the simulated values of mutual inductances and the experimental values in the nominal position. The relative errors between the simulation and the measurement for different coupling coils can be explained by numerical approximation in COMSOL or by some deviation in the measurement. In our work, we found that PCE metamodels built with such measured values of M gave very similar predictions to PCEs built with simulation results. This is the reason why in the paper, only PCEs built with 3D numerical results were used.
Before performing the uncertainty analysis, it was necessary to assume a probability distribution for the sources of uncertainty. In this work, a Gaussian distribution was chosen for these influencing factors, which conformed to the probability that may occur in reality. The values of the influencing factors are displayed in Table 2. The ranges of the air gap and the rotation angle along the Z axis were found in [23]. The range for the misalignment along the X/Y axes was considered reasonable due to the size of the parking space and the size of the EV chassis [23].

3.2. General Description of Sparse Polynomial Chaos Expansion

The uncertainty quantification leads to associate a random variable to each considered parameter. Consider a random vector X of N independent random variables X 1 , , X N with the joint probability density function (PDF) f X x characterizing the input uncertainties of the physical system. The random response of the system from a finite variance computational model is defined by Y = M(X), where M is a numerical model representing the relationship between the random variables and the response. So, the equation of the polynomial chaos expansions (PCE) [26,27] is shown as follows:
M X M P C E X = α A c α Ψ α X
where Ψ α X are multivariate polynomials basis functions with coefficient c α ; α is a multi-index that identifies the components of the multivariate polynomials Ψ α X [27]; A is the set of selected multi-indices of multivariate polynomials, in which there is the hyperbolic truncation scheme to favor the main effects and low-interaction polynomials [27]. It consists of retaining all multi-indices λ of q-norm ( 0 < q 1 ) less than or equal to the degree l as follows [27,28]:
A N , l , q = { λ N N : λ q = i = 1 N λ i q 1 q   l }
Further, least angle regression (LAR) also enables a decrease in the number of coefficients with high-dimensional problems to be estimated in PCE. It allows selecting the polynomial bases that have the most effect on the response in the truncation set A N , l , q . For more details, readers may refer to [27,28,29].
Here, the leave-one-out (LOO) error is used to evaluate the accuracy of the PCE metamodel. The equation below consists of building N separate metamodels M P C E \ i , with each one created using a reduced model evaluation X \ x i = x j , j = 1 , , N , j i and comparing its prediction on the excluded point x i with the real value M x i . The LOO error can be written as [18,27]:
ϵ L O O = i = 1 N M x i M P C E \ i x i 2 i = 1 N ( M x i 1 N i = 1 N M x i ) 2
A PCE metamodel allows deriving postprocessing of the model response at a negligible computational cost. The first two statistical moments of the output M X are the mean value and variance given as follows [26,27]:
E M X = c 0
V M X = λ A { 0 c λ 2  
Moreover, the first-order PCE-based Sobol indices S i of the model response M X for the input random variable X i can be estimated by [26,27]:
S i = V a r X i ( E X ~ i ( M X | X i ) ) V M X = λ ϵ A i c λ 2 V M X
where A i = { λ ϵ A : λ i > 0 , λ j = 0   j i } and the notation X ~ i indicates the set of all variables except X i . The total PCE-based Sobol indices S T , i can also be formulated as follows [26,27]:
S T , i = E X ~ i ( V a r X i ( ( M X | X ~ i ) ) ) V M X = λ ϵ A T , i c λ 2 V M X
where A T , i = λ ϵ A : λ i 0 .
The Sobol indices here are used to perform an efficient sensitivity analysis. The first-order PCE-based Sobol index of the i t h variable is closer to 1, meaning that the i t h variable has more impact on the model response M(X). The total Sobol index S T , i is the sum of all the Sobol’ indices involving the i t h variable.

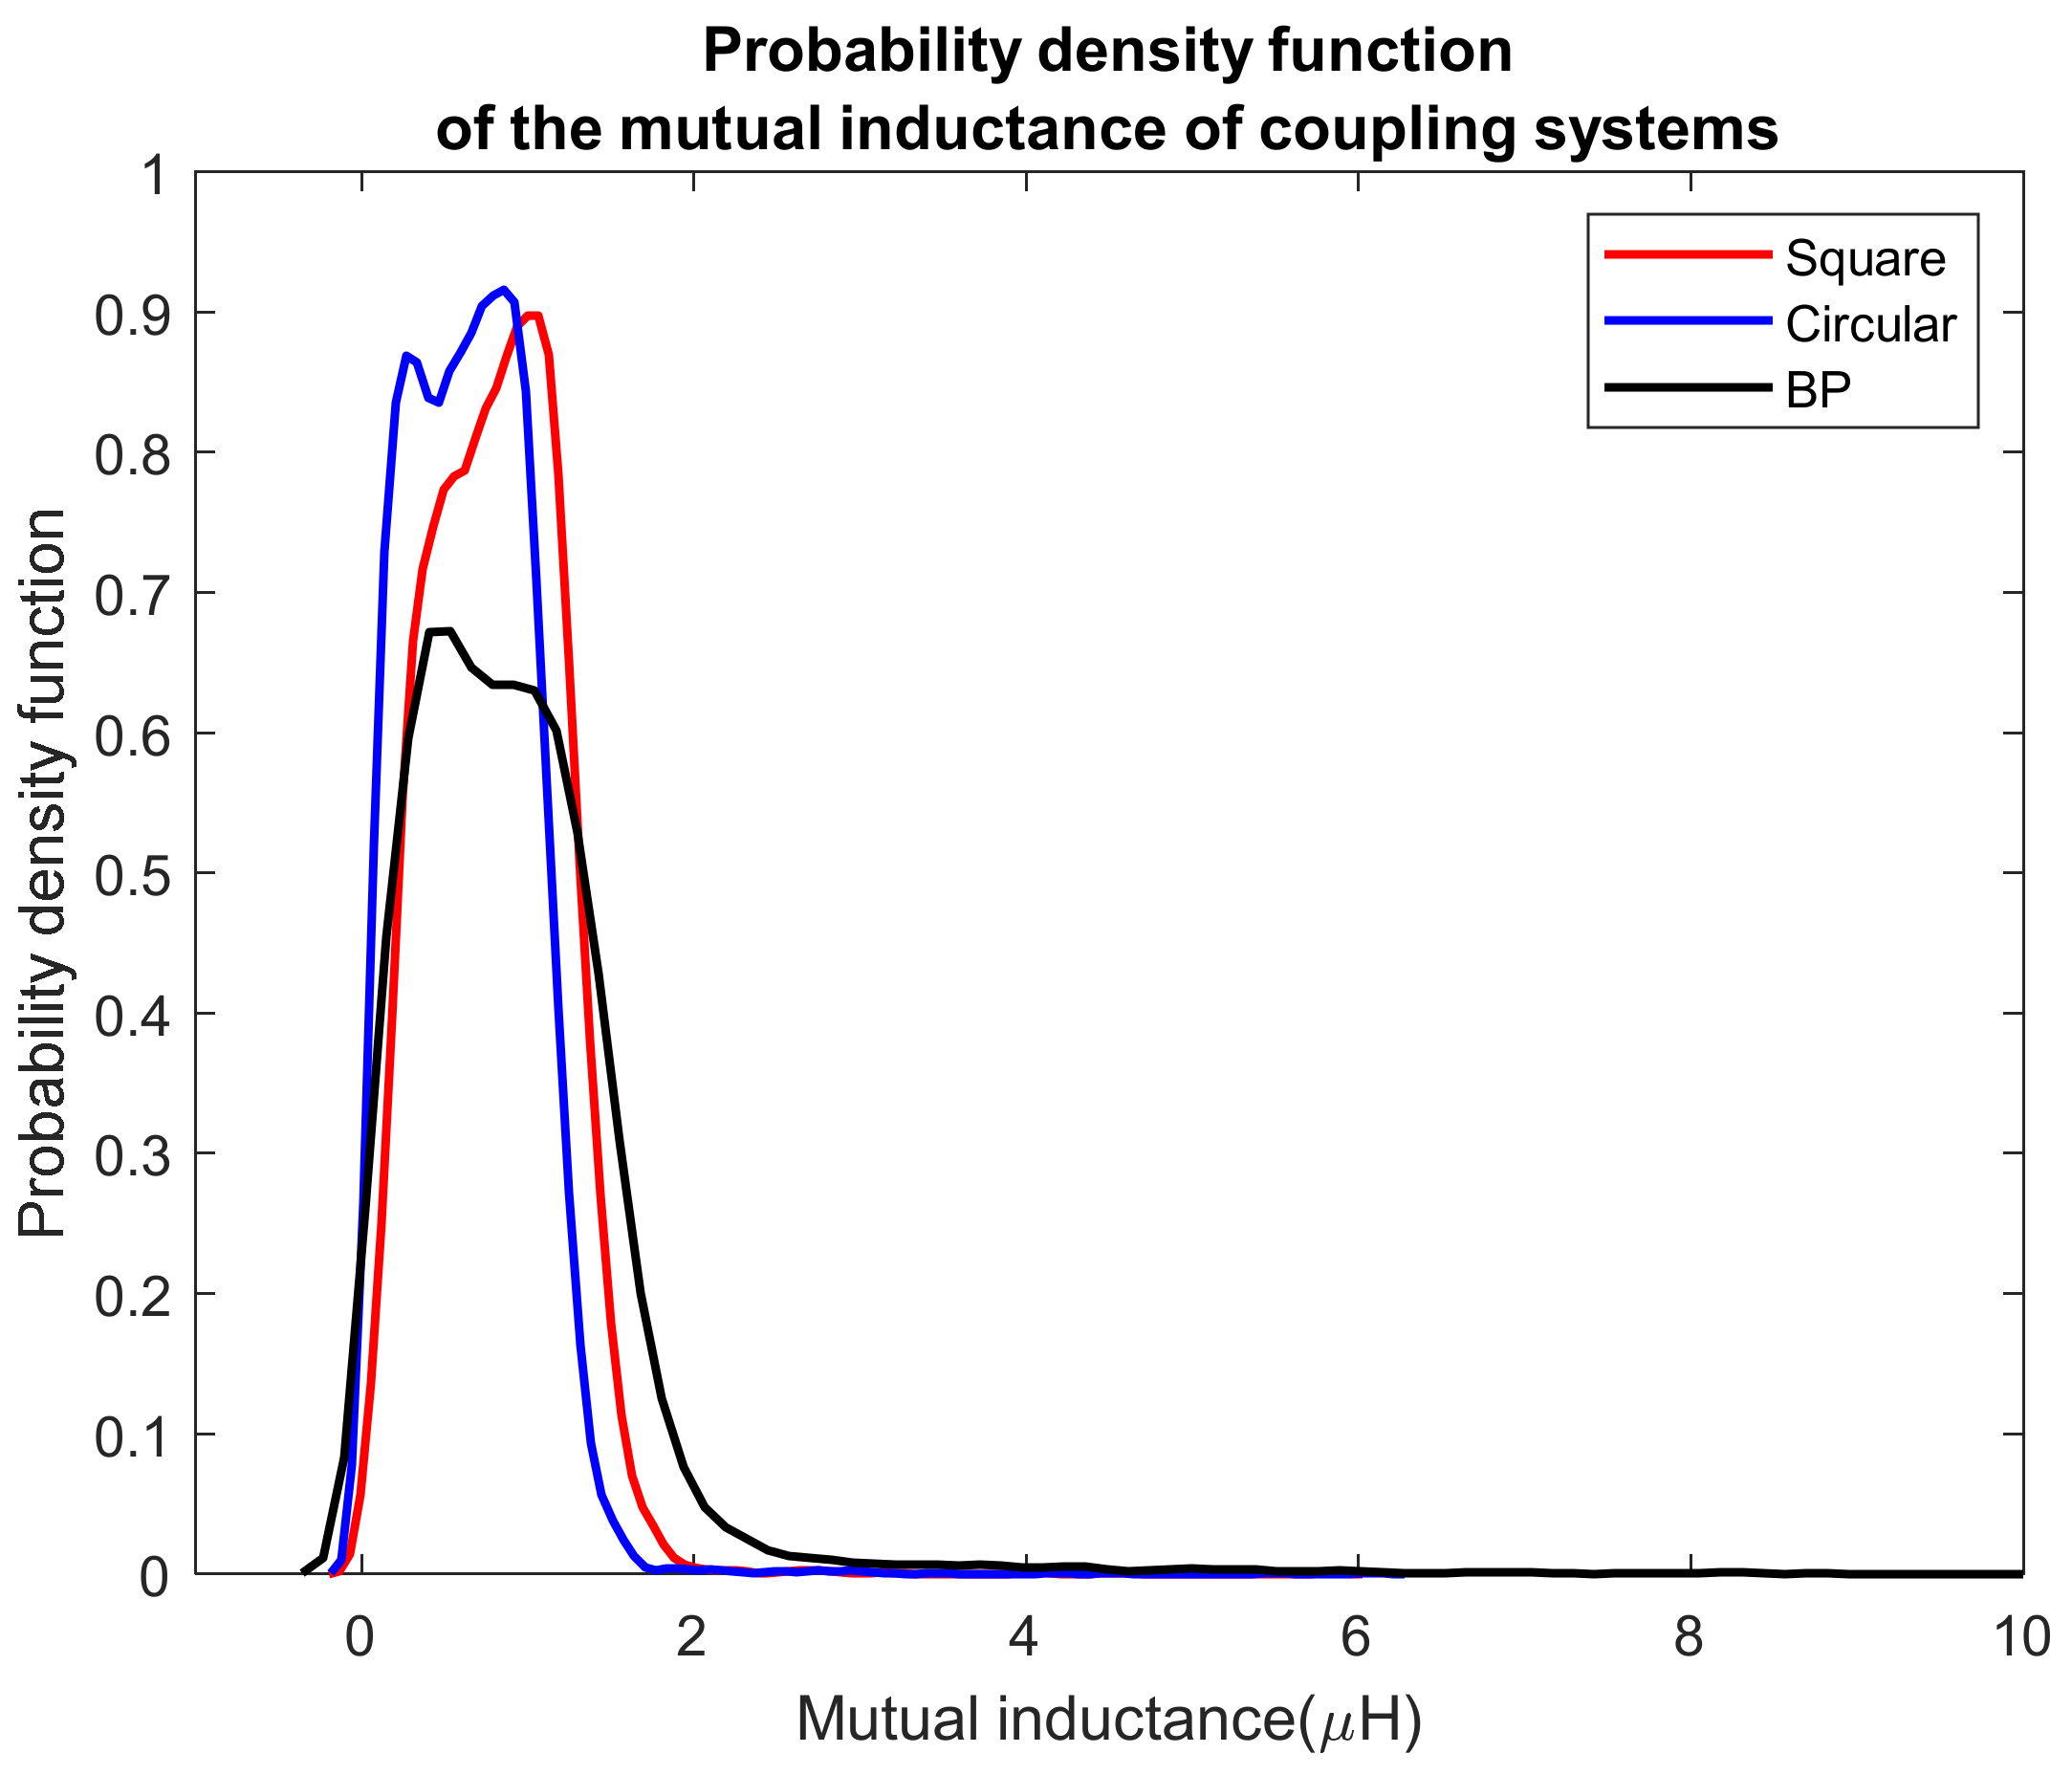
3.3. Numerical Analysis

The results given in this section were obtained using a XEON E5-1620 8-core processor working at 3.70 GHz. The 3D model of the coupling coils was obtained using COMSOL 5.5, and the PCE metamodel was calculated in MATLAB 2017 with the UQLAB framework developed by Stefano Marelli and Bruno Sudret at ETH Zurich (Uncertainty quantification toolbox) [30].
This section examines the effect of influencing factors defined above on the mutual inductance M for different coupling coils. The model response was approximated by building up a sparse PCE with the degree l = 7 , which was the best polynomial degree given the specific samples, and the q-norm was set to q = 0.75 in order to considerably reduce the size of the polynomial basis. Due to the tradeoff between the accuracy of the PCE metamodel and the computation time [17], N = 55 samples based on Latin hypercube sampling [31] were taken into account for circular, square, and BP coupling coils.
In order to observe the quality of the sparse PCE metamodel built up, the LOO errors on different coupling coils are presented in Table 3. It can be observed that the number of samples in COMOSL to build an accurate sparse PCE metamodel also depended on the shape of the coils. The relationship between the mutual inductance and the influencing factors of BP coils was more complex than that of the circular coils and the square coils, so when improving the accuracy of the PCE metamodel of the BP coils, more samples from COMSOL need to be considered. The time to calculate one mutual inductance in COMSOL was 1 min, but the time to calculate the mutual inductance in the PCE metamodel was around 1 s.
The results obtained by the sparse PCE metamodel for different coupling coils provided interesting information on the behavior of the mutual inductance M. Regarding the comparison of the three coupling coils, the probability density function of the mutual inductance M given by sparse PCE metamodel based on 10,000 Monte Carlo realizations is presented in Figure 6. It shows that the sparse PCE metamodel was able to represent the mutual inductance M for different coupling coils. The circular and square coupling coils had a greater probability than the BP coupling coils for the mutual inductance between 0 μ H and 2 μ H . Although the BP coupling coils had a larger range of mutual inductance than the circular and square coupling coils, the probability of these values to be higher than 2 μ H was less than 0.1, which was not the best configuration for the SIPT system studied in this paper.

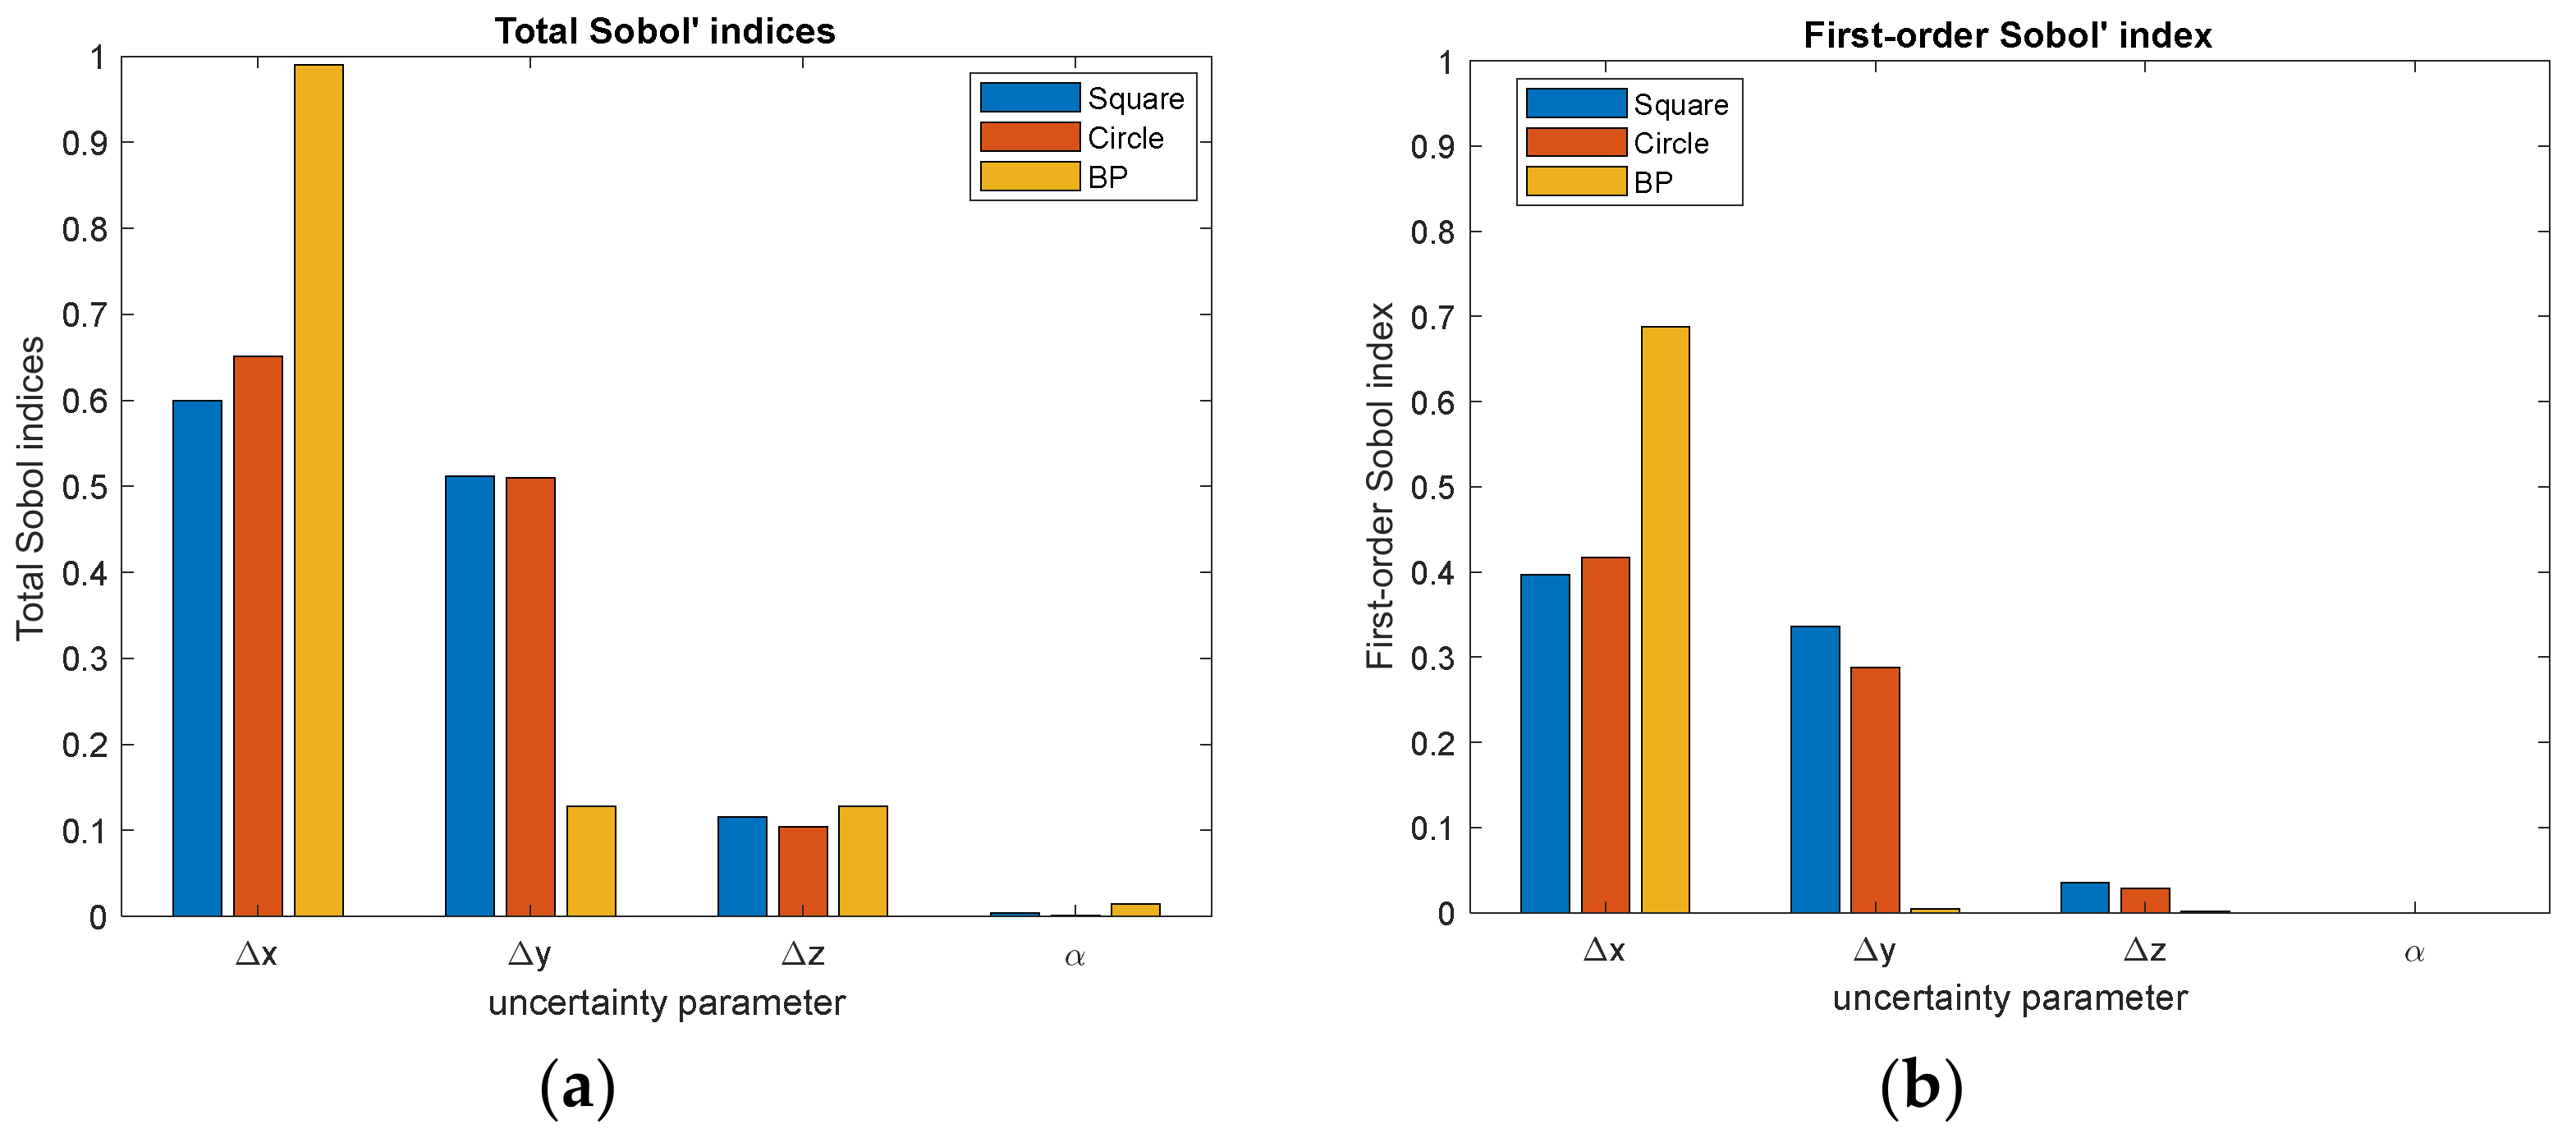
4. Sensitivity Analysis

Beyond the quantification of the variability of the mutual inductance M, the sparse PCE metamodel provided a sensitivity analysis at a low computational cost. Figure 7 presents the bars showing the values of the total Sobol indices and the first-order Sobol index, calculated using Equations (10) and (11), of the mutual inductance for the three different coupling coils.
It can be seen that the variations of the mutual inductance M were mainly related to the misalignment along the X axis, as shown in Figure 7 for the BP coils, because of the shifting of the part that strengthens the magnetic field and a larger area reduction where the magnetic flux passes through, compared to along the Y axis. However, for the square and circular coils, the misalignment along the X or Y axis demonstrated nearly the same impact on the mutual inductance M due to the symmetry of shape. The rotation along the Z axis had almost no effect on the mutual inductance M, independently of the shape of the coils compared to other influencing factors (for the given deviation range of the influencing factors).
In order to further study the impact of the misalignment along the X/Y axes for different coupling coils, different ranges of the misalignment were also discovered with an air gap = 15 mm and a rotation angle of 0°. According to the trend between the coupling coefficient and the misalignment in [20], the standard deviations (SDs) of these were considered to be 2 mm, 5 mm, and 10 mm, as shown in Table 4.
In Figure 8, it is shown that the influence of the misalignment along the X/Y axes was independent of the standard deviations for different coupling coils as long as it varied in the same way for both parameters. For the BP coupling coils, the misalignment along the X axis was still the most important parameter for the mutual inductance, which indicated that it may be considered for the analysis of dynamic inductive power transfer systems.

5. Comparison and Discussion

According to the analysis above, to the method of choosing the coils for the SIPT system seems to be clear. Using Equation (4), it can also be written as:
η m a x     1 R 1 π f 0 M = 1 ρ π f 0 S l M
where l is the length of the conducting wires for different coupling coils; S is the cross-sectional area of the conducting wires, equal to 0.95   mm 2 ; ρ is the resistivity of the wires made of copper, equal to 1.7 × 10 8   Ω · m ; and f 0 is equal to 85 kHz.
Here, it appeared that the ratio l M could be chosen as a criterion to verify for a given type of wire, the coil of which leads to the maximum transmission efficiency. According to Equation (12), the maximum transmission efficiency increases with smaller l M .
Table 5 shows the nominal mutual inductance M, the nominal ratio l M , and the maximum transmission efficiency η max for the different coupling coils (the nominal position defined in Section 3.1). It can be observed that circular coupling coils led to the least length of the wires and the maximum transmission efficiency compared to other shapes of coils. When the sources of uncertainty were taken into account in the coupling coils, Table 6 gives the mean value, the standard deviation of the mutual inductance based on PCE metamodel (built in Section 3), the mean value of ratio, and the mean value of maximum transmission efficiency. According to Section 4, the misalignment along the X/Y axes has the most effect on the mutual inductance, and this will make the mean value of the mutual inductance much smaller than the nominal one. Regarding the mean value of maximum transmission efficiency shown in Table 6, the circular coupling coils appeared to reach better performances, which were very close to that of square coupling coils, even if a significant difference occurred in the value of the mutual inductance for the different coils. This showed the importance of investigating the transmission efficiency, rather than only mutual inductances, when comparing different coupling systems.

6. Conclusions

This work highlighted the comparisons of different coupling coils with ferrite plates while taking into account the sources of uncertainty for the static inductive power system. The maximum transmission efficiency was only related to the mutual inductance when the resonance frequency and the coils were defined. A sparse polynomial chaos expansion (PCE) method was used to generate a metamodel for analyzing the mutual inductance between the transmitter and the receiver as a function of the sources of uncertainty, including the misalignment relevant to a realistic situation during parking. Then, according to the sensitivity analysis from the sparse PCE metamodel, the misalignment along the X axis appeared to be the most influential factor in the mutual inductance for the BP coupling coils. In addition, the misalignment along the X/Y axes has nearly the same effect in the circular coupling coils and the square coupling coils, independently of the standard deviation of the misalignment along the X/Y axes. Meanwhile, the ratio l M helped to design the shape of the coils for the maximum transmission efficiency while considering the sources of uncertainty defined in this paper. Based on this work, circular coupling coils should be recommended for the SIPT system. Future work will be dedicated to a magnetic field analysis of the safety issues and a coil optimization for the optimal transfer efficiency.

Author Contributions

Y.P. performed the modeling, analysis, and measurements, and wrote the original draft and the final version of the paper. Y.L.B., M.B., and L.P. contributed to the modeling, and the review and editing of the paper. Y.L.B. contributed to the analysis of the simulation results. All authors have read and agreed to the published version of the manuscript.

Funding

This research received no external funding.

Institutional Review Board Statement

Not applicable.

Informed Consent Statement

Not applicable.

Data Availability Statement

The data presented in this study are available on request from the corresponding author.

Conflicts of Interest

The authors declare no conflict of interest.

References

  1. Clairand, J.-M.; Guerra-Terán, P.; Serrano-Guerrero, X.; González-Rodríguez, M.; Escrivá-Escrivá, G. Electric Vehicles for Public Transportation in Power Systems: A Review of Methodologies. Energies 2019, 12, 3114. [Google Scholar] [CrossRef] [Green Version]
  2. Zhang, B.; Carlson, R.B.; Smart, J.G.; Dufek, E.J.; Liaw, B. Challenges of future high power wireless power transfer for light-duty electric vehicles—Technology and risk management. eTransportation 2019, 2, 100012. [Google Scholar] [CrossRef]
  3. Cirimele, V.; Torchio, R.; Villa, J.L.; Freschi, F.; Alotto, P.; Codecasa, L.; Rienzo, L.D. Uncertainty Quantification for SAE J2954 Compliant Static Wireless Charge Components. IEEE Access 2020, 8, 171489–171501. [Google Scholar] [CrossRef]
  4. Liu, C.; Jiang, C.; Qiu, C. Overview of coil designs for wireless charging of electric vehicle. In Proceedings of the 2017 IEEE PELS Workshop on Emerging Technologies: Wireless Power Transfer (WoW), Chongqing, China, 20–22 May 2017; pp. 1–6. [Google Scholar]
  5. Villa, J.L.; Sallán, J.; Llombart, A.; Sanz, J.F. Design of a high frequency Inductively Coupled Power Transfer system for electric vehicle battery charge. Appl. Energy 2009, 86, 355–363. [Google Scholar] [CrossRef]
  6. Azad, A.N.; Echols, A.; Kulyukin, V.A.; Zane, R.; Pantic, Z. Analysis, Optimization, and Demonstration of a Vehicular Detection System Intended for Dynamic Wireless Charging Applications. IEEE Trans. Transp. Electrif. 2019, 5, 147–161. [Google Scholar] [CrossRef]
  7. Wireless Power Transfer for Electric Vehicles and Mobile Devices|Wiley. Available online: https://www.wiley.com/en-au/Wireless+Power+Transfer+for+Electric+Vehicles+and+Mobile+Devices-p-9781119329053 (accessed on 15 May 2021).
  8. Cabrera, A.T.; González, J.M.G.; Sánchez, J.A.A. Wireless Power Transfer for Electric Vehicles: Foundations and Design Approach; Power Systems; Springer: Berlin/Heidelberg, Germany, 2020; ISBN 9783030267056. [Google Scholar]
  9. Yang, Y.; Cui, J.; Cui, X. Design and Analysis of Magnetic Coils for Optimizing the Coupling Coefficient in an Electric Vehicle Wireless Power Transfer System. Energies 2020, 13, 4143. [Google Scholar] [CrossRef]
  10. Knaisch, K.; Gratzfeld, P. Comparison of magnetic couplers for inductive electric vehicle charging using accurate numerical simulation and statistical methods. In Proceedings of the 2015 5th International Electric Drives Production Conference (EDPC), Nuremberg, Germany, 15–16 September 2015. [Google Scholar]
  11. Prasanth, V.; Bandyopadhyay, S.; Bauer, P.; Ferreira, J.A. Analysis and comparison of multi-coil inductive power transfer systems. In Proceedings of the 2016 IEEE International Power Electronics and Motion Control Conference (PEMC), Varna, Bulgaria, 25–28 September 2016; pp. 993–999. [Google Scholar]
  12. Olukotun, B.; Partridge, J.S.; Bucknall, R.W.G. Optimal Finite Element Modelling and 3-D Parametric Analysis of Strong Coupled Resonant Coils for Bidirectional Wireless Power Transfer. In Proceedings of the 2018 53rd International Universities Power Engineering Conference (UPEC), Glasgow, UK, 4–7 September 2018; pp. 1–6. [Google Scholar]
  13. Nayak, P.S.R.; Kishan, D. Design and analysis of SS resonant IPT system with computed mutual inductance through FEM model. In Proceedings of the 2018 International Conference on Power, Instrumentation, Control and Computing (PICC), Thrissur, Kerala, 18–20 January 2018; pp. 1–5. [Google Scholar]
  14. Capua, G.D.; Femia, N.; Stoyka, K.; Mambro, G.D.; Maffucci, A.; Ventre, S.; Villone, F. Mutual Inductance Behavioral Modeling for Wireless Power Transfer System Coils. IEEE Trans. Ind. Electron. 2021, 68, 2196–2206. [Google Scholar] [CrossRef]
  15. Panchal, C.; Stegen, S.; Lu, J. Review of static and dynamic wireless electric vehicle charging system. Eng. Sci. Technol. Int. J. 2018, 21, 922–937. [Google Scholar] [CrossRef]
  16. Knaisch, K.; Gratzfeld, P. Gaussian process surrogate model for the design of circular, planar coils used in inductive power transfer for electric vehicles. IET Power Electron. 2016, 9, 2786–2794. [Google Scholar] [CrossRef]
  17. Pei, Y.; Pichon, L.; Bensetti, M.; Le Bihan, Y. Uncertainty quantification in the design of wireless power transfer systems. Open Phys. 2020, 18, 391–396. [Google Scholar] [CrossRef]
  18. Trinchero, R.; Larbi, M.; Torun, H.M.; Canavero, F.G.; Swaminathan, M. Machine Learning and Uncertainty Quantification for Surrogate Models of Integrated Devices with a Large Number of Parameters. IEEE Access 2019, 7, 4056–4066. [Google Scholar] [CrossRef]
  19. COMSOL Multiphysics, Stockholm, Sweden. Introduction to COMSOL Multiphysics. Available online: https://www.comsol.com/documentation/IntroductionToCOMSOLMultiphysics.pdf (accessed on 1 October 2019).
  20. Cirimele, V. Design and Integration of a Dynamic IPT System for Automotive Applications. Ph.D. Thesis, Université Paris Saclay, Gif-sur-Yvette, France, Politecnico di Torino, Torino, Italy, 2017. [Google Scholar]
  21. Batra, T. Design of Static Wireless Charging System for Electric Vehicles with Focus on Magnetic Coupling and Emissions. Ph.D. Thesis, Department of Energy Technology, Aalborg University, Aalborg, Denmark, 2015. [Google Scholar]
  22. J2954: Wireless Power Transfer for Light-Duty Plug-in/Electric Vehicles and Alignment Methodology—SAE International. Available online: https://www.sae.org/standards/content/j2954_202010/ (accessed on 26 March 2021).
  23. Kadem, K. Modeling and Optimization of a Magnetic Coupler for Electric Vehicles Dynamic Induction Charging. Ph.D. Thesis, Université Paris Saclay, Gif-sur-Yvette, France, 2020. [Google Scholar]
  24. Bosshard, R.; Mühlethaler, J.; Kolar, J.W.; Stevanović, I. Optimized magnetic design for inductive power transfer coils. In Proceedings of the 2013 Twenty-Eighth Annual IEEE Applied Power Electronics Conference and Exposition (APEC), Long Beach, CA, USA, 17–21 March 2013; pp. 1812–1819. [Google Scholar]
  25. Robert, W.E.; Dragan, M. Fundamentals of Power Electronics, 2nd ed.; Springer: New York, NY, USA, 2001. [Google Scholar]
  26. Larbi, M.; Stievano, I.S.; Canavero, F.G.; Besnier, P. Variability Impact of Many Design Parameters: The Case of a Realistic Electronic Link. IEEE Trans. Electromagn. Compat. 2018, 60, 34–41. [Google Scholar] [CrossRef]
  27. Marelli, S.; Sudret, B. UQLab User Manual—Polynomial Chaos Expansions; Report UQLab-V1.3-104; Chair of Risk, Safety and Uncertainty Quantification, ETH Zurich: Zurich, Switzerland, 2019. [Google Scholar]
  28. Blatman, G.; Sudret, B. Adaptive sparse polynomial chaos expansion based on least angle regression. J. Comput. Phys. 2011, 230, 2345–2367. [Google Scholar] [CrossRef]
  29. Least Angle Regression. Available online: https://arxiv.org/abs/math/0406456 (accessed on 25 March 2021).
  30. Marelli, S.; Sudret, B. UQLab: A Framework for Uncertainty Quantification in Matlab. In Vulnerability, Uncertainty, and Risk. Quantification, Mitigation, and Management, Proceedingsof the 2nd International Conference on Vulnerability, Risk Analysis and Management (ICVRAM 2014) & 6th International Symposium on Uncertainty, Modeling, and Analysis (ISUMA 2014), Liverpool, UK, July 13–16 2014; ETH Zurich: Zurich, Switzerland, 2014; pp. 2554–2563. [Google Scholar] [CrossRef] [Green Version]
  31. Lataniotis, C.; Marelli, S.; Sudret, B. UQLab User Manual—The INPUT Module; Report UQLab-V0.9-102; Chair of Risk, Safety and Uncertainty Quantification, ETH Zurich: Zurich, Switzerland, 2019. [Google Scholar]
Figure 1. A static inductive power transfer system for electric vehicles [21].
Sustainability 13 06324 g001
Figure 2. Different coupling coils. (a,d,g) Prototypes made in the laboratory [20]: square, circle, and BP; (b,e,h) dimensions of different coils: square, circle, and BP; (c,f,i) descriptions of the coupling coils [23].
Sustainability 13 06324 g002aSustainability 13 06324 g002b
Figure 3. Equivalent electrical circuit in the series–series topology [13,15,20].
Sustainability 13 06324 g003
Figure 4. Influencing factors in the coupling coils (with an example using circular coils): (a) top view; (b) side view.
Sustainability 13 06324 g004
Figure 5. Experimental validation of the value of the mutual inductance of the coupling coils calculated with COMSOL.
Sustainability 13 06324 g005
Figure 6. Probability density function (PDF) of mutual inductance M for the different coupling coils.
Sustainability 13 06324 g006
Figure 7. Sobol indices of mutual inductance M for the different coupling coils: (a) total Sobol indices for the different coupling coils; (b) first-order Sobol index for the different coupling coils.
Sustainability 13 06324 g007
Figure 8. Sobol indices of mutual inductance M for the different coupling coils with different standard deviations: (a) total Sobol indices for the different coupling coils; (b) first-order Sobol index for the different coupling coils.
Sustainability 13 06324 g008
Table 1. Mutual inductance of the SIPT coupling coils.
Coil ShapeM(µH)
FEM Simulation
M(µH)
Experimental Values
Relative Error
of Simulation (%)
Square1.361.322.69%
Circle1.171.133.46%
BP1.541.399.63%
Table 2. Properties of the influencing factors.
ParametersSymbolDistributionMean ValueStandard Deviation
Misalignment along the X axis [mm] Δ x Gaussian015
Misalignment along the Y axis [mm] Δ y Gaussian015
Air gap between two coils [mm] Δ z Gaussian152
Rotation angle along the Z axis [deg] α Gaussian03
Table 3. Properties of the PCE metamodel for different coils.
Coil ShapeSamples to Build the PCE MetamodelLOO Error (%)
Circle550.42%
Square550.29%
BP553.53%
Table 4. Different standard deviation of misalignment for different coils.
ParametersSymbol DistributionMean ValueStandard Deviation
Misalignment along the X axis [mm] Δ x Gaussian02/5/10
Misalignment along the Y axis [mm] Δ y Gaussian02/5/10
Table 5. Properties of the SIPT coupling coils in the nominal position.
Coil ShapeLength l
[cm]
M [µH] Ratio l M
[cm/µH]
Maximum Transmission Efficiency
η m a x %
Square93.11.3668.595.4%
Circle73.11.1762.595.8%
BP139.91.5490.893.9%
Table 6. Statistical properties of the PCE metamodel for SIPT coupling coils.
PCE MetamodelCoil ShapeMean Value of M
E[M] [µH]
Standard Deviation of M
σ M [µH]
Mean Value
of Ratio
E [ l M ] [cm/µH]
Mean Value
of Maximum Transmission Efficiency
E η m a x %
M P C E X Square0.8110.40411592.3%
Circle0.6450.38911392.4%
BP0.9260.78715189.9%
Publisher’s Note: MDPI stays neutral with regard to jurisdictional claims in published maps and institutional affiliations.

