Abstract
The functional and spatial integration of a wireless power transfer system (WPTS) into electric vehicles is a challenging task, due to complex multiphysical interactions and strict constraints such as installation space limitations or shielding requirements. This paper presents an electromagnetic–thermal investigation of a novel design approach for an ultrathin onboard receiver unit for a WPTS, comprising the spatial and functional integration of the receiver coil, ferromagnetic sheet and metal mesh wire into a vehicular underbody cover. To supplement the complex design process, two-way coupled electromagnetic–thermal simulation models were developed. This included the systematic and consecutive modelling, as well as experimental validation of the temperature- and frequency-dependent material properties at the component, module and system level. The proposed integral design combined with external power electronics resulted in a module height of only . The module achieved a power of up to 7.2 kW at a transmission frequency of with a maximum efficiency of 92% over a transmission distance of to . The proposed simulations showed very good consistency with the experimental validation on all levels. Thus, the performed studies provide a significant contribution to coupled electromagnetic and thermal design wireless power transfer systems.
1. Introduction
Wireless power transfer systems (WPTSs) are considered as a promising technology to increase the acceptance of electric vehicles (EVs) [1,2]. Compared to conductive charging, WPTSs offer vehicle charging without user intervention. This means that no cable handling and plugging are required. Thus, WPTSs provide a low-maintenance charging technology for EVs with high comfort and safety.
The working principle of WPTSs for electric vehicles is based on the electromagnetic interaction of an offboard ground pad module (GPM) and an onboard car pad module (CPM). The GPM typically comprises four main elements: a rectifier circuit, an inverter, a matching network and a transmitter coil. The CPM consists of a receiver coil, a matching network, a rectifier and, if necessary, a DC/DC converter. The architecture of an exemplary WPTS is illustrated in Figure 1.
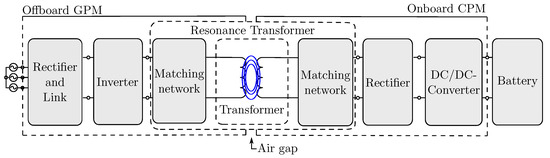
Figure 1.
Overview of the necessary components of an exemplary wireless power transfer system.
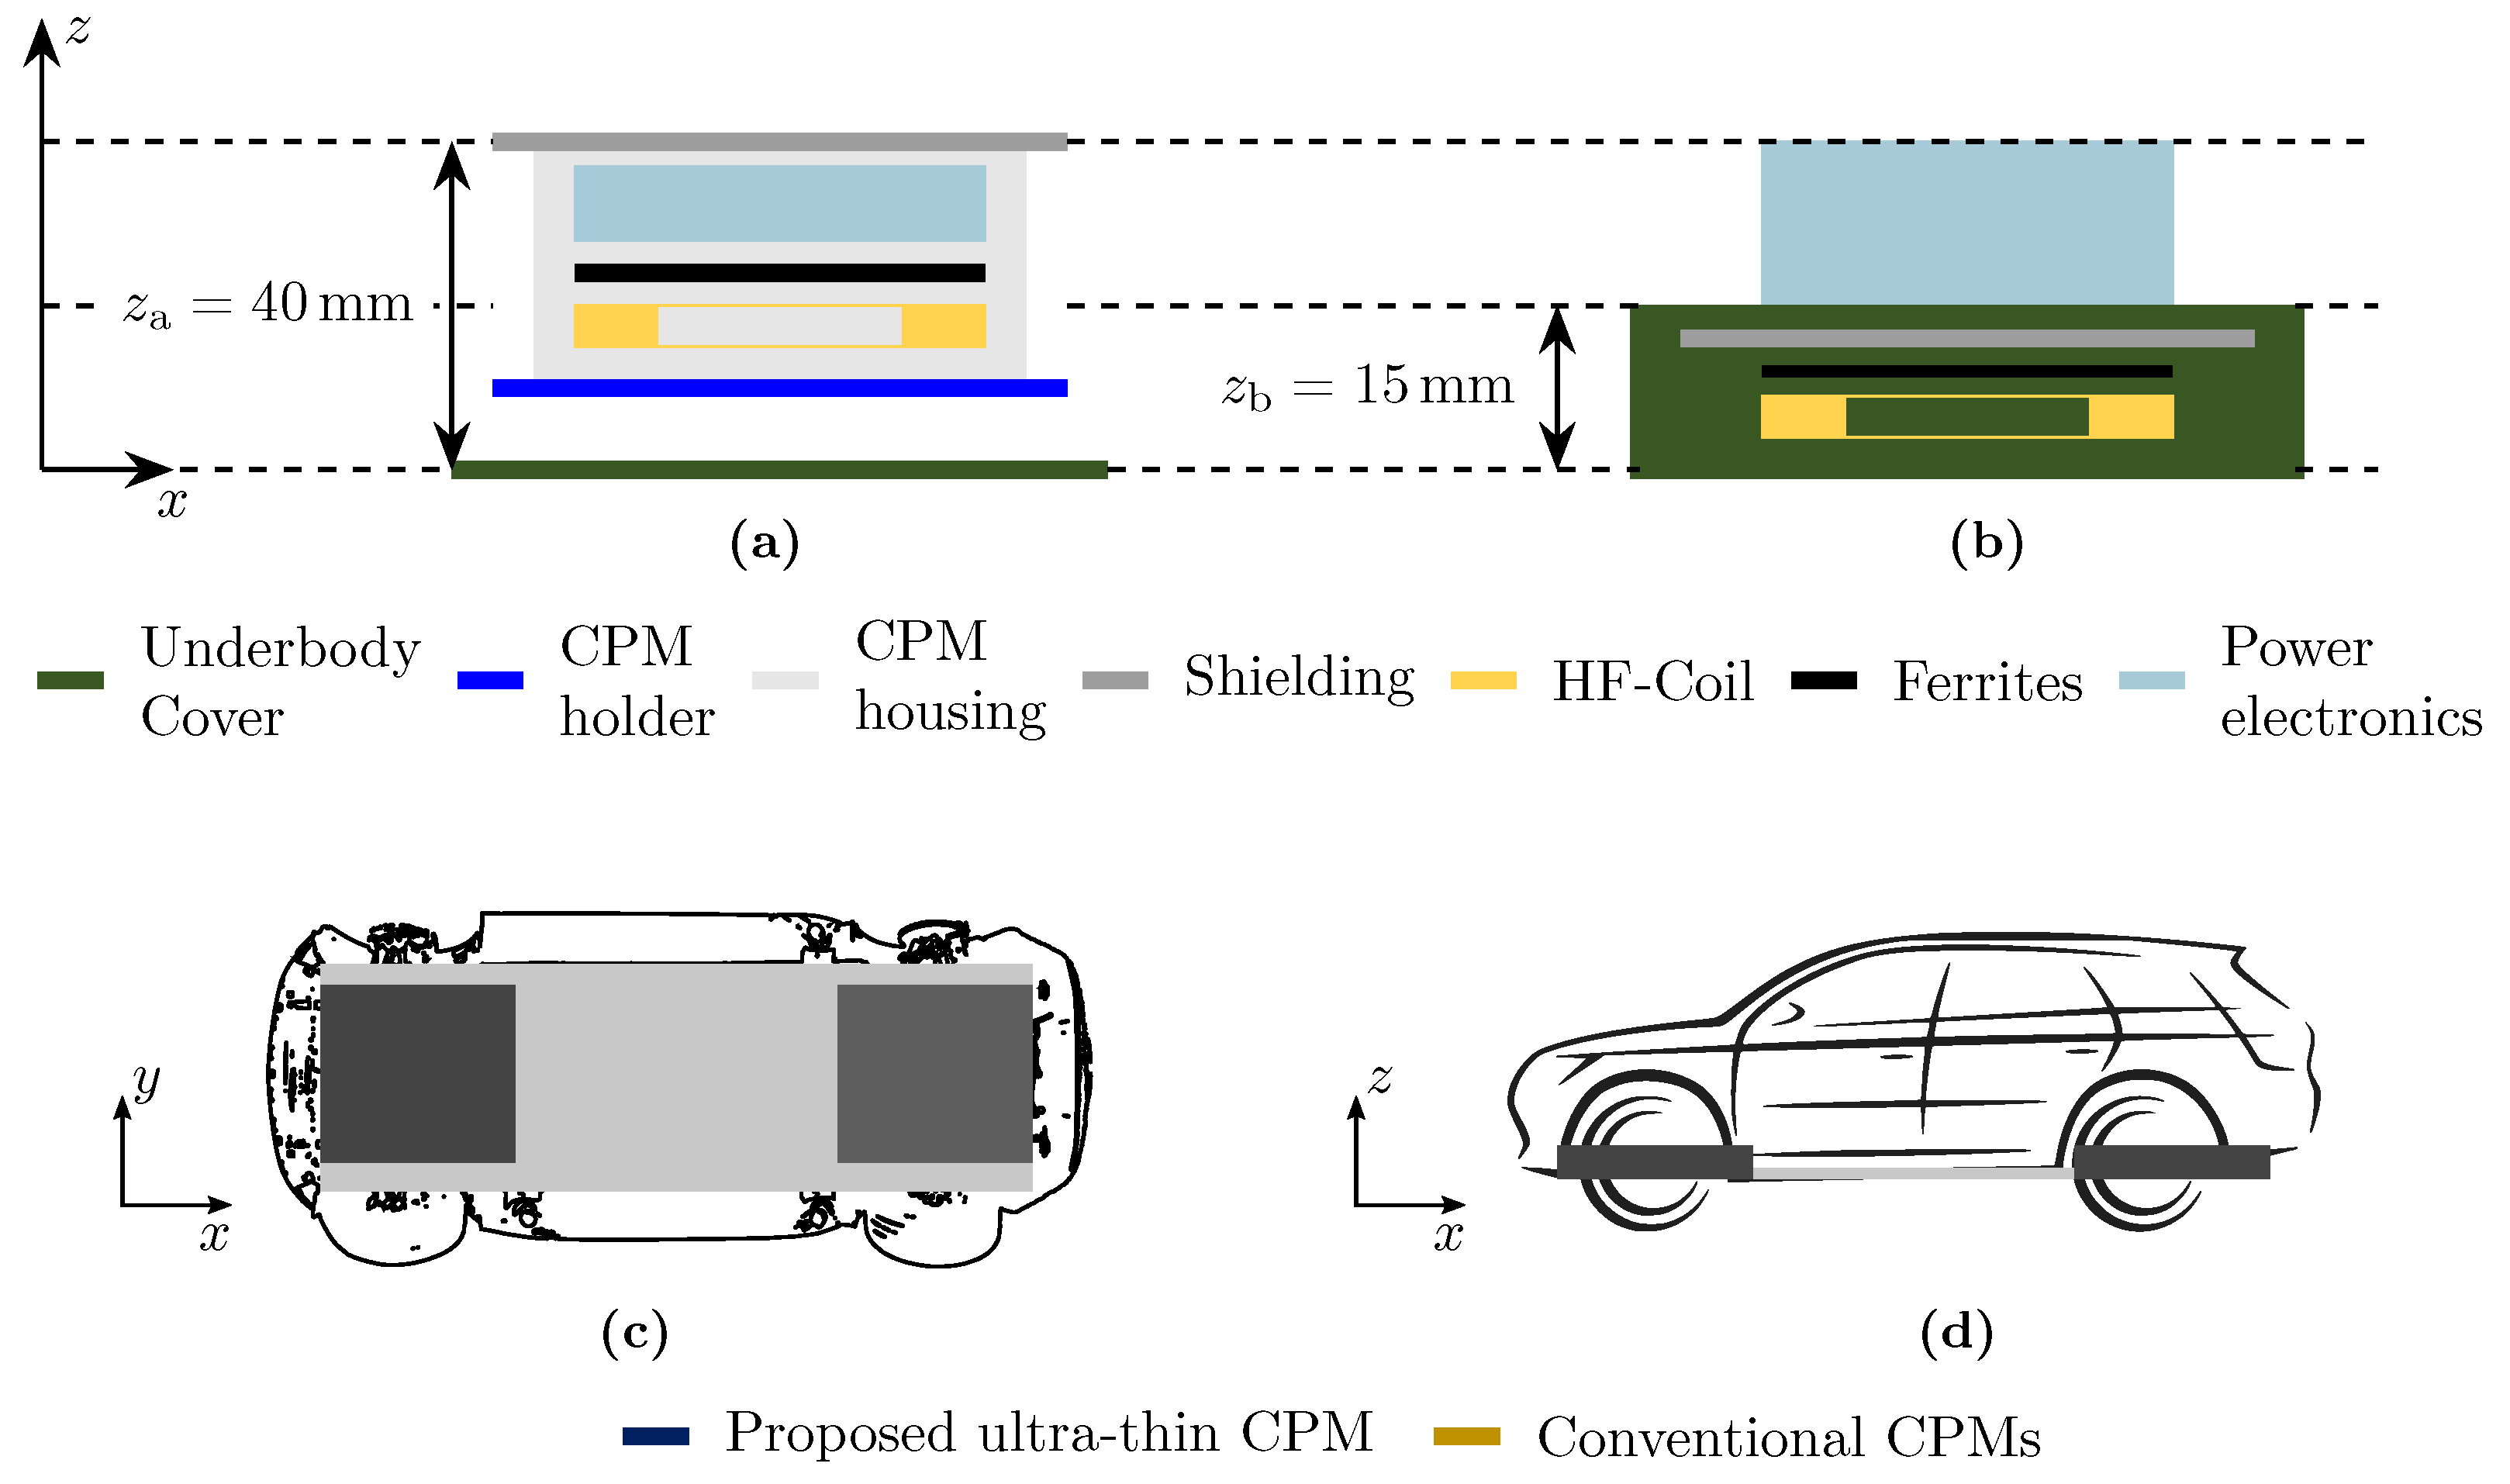
This paper focuses on the onboard CPMs, which are usually mounted on the underside of EVs [3]. This conceptional position results in high mechanical requirements due to underfloor impact scenarios [3]. Therefore, conventional CPMs are robust and stiff constructions [3,4,5]. In detail, an underbody cover (UBC) typically encases the functional unit comprising a safety case, a CPM housing and a shielding to prevent interactions of the electromagnetic field with the surrounding components (see Figure 2). However, this differential construction results in a relatively low volumetric and gravimetric power density combined with a high vertical dimension (z-dimension). This limits the possible installation position, which is often located in the front of the vehicle underbody due to the limited installation space. To enhance the interoperability of WPTSs and the possible installation space of CPMs, novel designs are required, which decrease the vertical dimensions of CPMs and increase the volumetric and gravimetric power density.
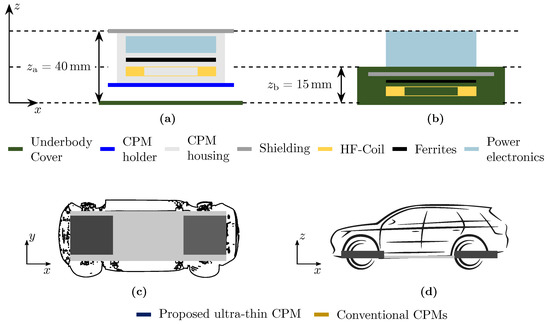
Figure 2.
CPM designs—qualitative comparison of the z-dimension of: (a) the conventional design of CPMs with a transmission power of 3.6 kW given in [3], (b) the proposed ultrathin CPM with a transmission power of 7.2 kW and the possible installation space of CPM designs in the (c) xy-plane and (d) xz-plane.
This paper presents the novel design of an ultrathin CPM providing a reduction of the z-dimension by 62% compared to the referenced conventional CPM presented in [3]. Figure 2 qualitatively compares the referenced CPM in the conventional design and the proposed ultrathin design. The novel design was based on the spatial and functional integration of the receiver coil, ferrites and shielding in the underbody cover. Unlike conventional designs, this module was designed as a flexible structure, which required the application of novel materials. For this purpose, ferromagnetic sheets as alternatives to the conventional rigid and brittle ferrites were selected. These sheets and metal wire meshes, used as the shielding, were integrated into a plastic composite for the first time. Furthermore, the power electronics were excluded from the CPM housing, which was advantageous in terms of reducing the z-dimension. Additionally, the power electronics can be freely positioned in EVs. However, this results in special efforts in terms of contacting, shielding, and assembly, which were described comprehensively in [6].
The thermal management of CPMs featuring a high volumetric power density is a major challenge [7,8,9]. The local proximity of the coil, ferrites and shielding, being the main generators of the power losses of CPMs, is very challenging [7,10,11]. In order to support the development and optimization process and reduce elaborate experimental testing, accurate electromagnetic–thermal simulation models from the component to system level are required. As a consequence, several studies have focused on the simulation and experimental investigation of the electromagnetic and thermal behaviour of WPTSs. The simulation approaches can be categorized into order-reduced and coupled electromagnetic–thermal models. The order-reduced models of WPTSs reduce the complexity by analytically calculating the power losses of each component and running the simulation only in the thermal domain. Accordingly, various studies have presented approaches for the analytical quantification of the power losses of the coil [12,13,14,15], ferrites [12,14,15] and shielding [14,16]. The calculated power loss densities serve as heat sources for simulating the temperature fields. Based on this approach, good forecasting qualities of the electromagnetic–thermal behaviour can be achieved [10,14,15]. However, the modelling of the temperature- and frequency-dependent material properties has proven to be insufficient. In particular, the losses of the metal shields due to eddy current induction typically have to be taken from a previous magnetic simulation [14,15] or experimental measurement [10]. In addition, the prediction of the thermal distribution under the influence of external magnetic fields is only possible to a limited extent using order-reduced models [10,14]. To overcome these deficits, several authors have proposed coupled electromagnetic–thermal models, which bidirectionally link the simulation of the electromagnetic and thermal fields. Kim et al. [17] presented a two-way electromagnetic–thermal simulation analysis of a DD-Layout, which provided a very good forecasting quality compared to the experimental validation. However, the modelling of power losses and the thermal distribution of the individual components was not given. Niu et al. [18] provided a bidirectional coupled electromagnetic–thermal simulation of a GPM considering misalignment, but an experimental validation was not conducted. Alsayegh et al. [12] compared order-reduced modelling with coupled-field simulation. The results showed a good agreement of coupled-field simulation and the experiment, whereas the deviation between the order-reduced model and respective experimental studies was very large. A component-wise investigation of the thermal losses was not given. In summary, the simulation models found in the literature are either not sufficiently accurate regarding the transient or steady-state behaviour, cannot accurately predict total losses at the component level from the current densities or magnetic field densities or have not been experimentally validated at all.
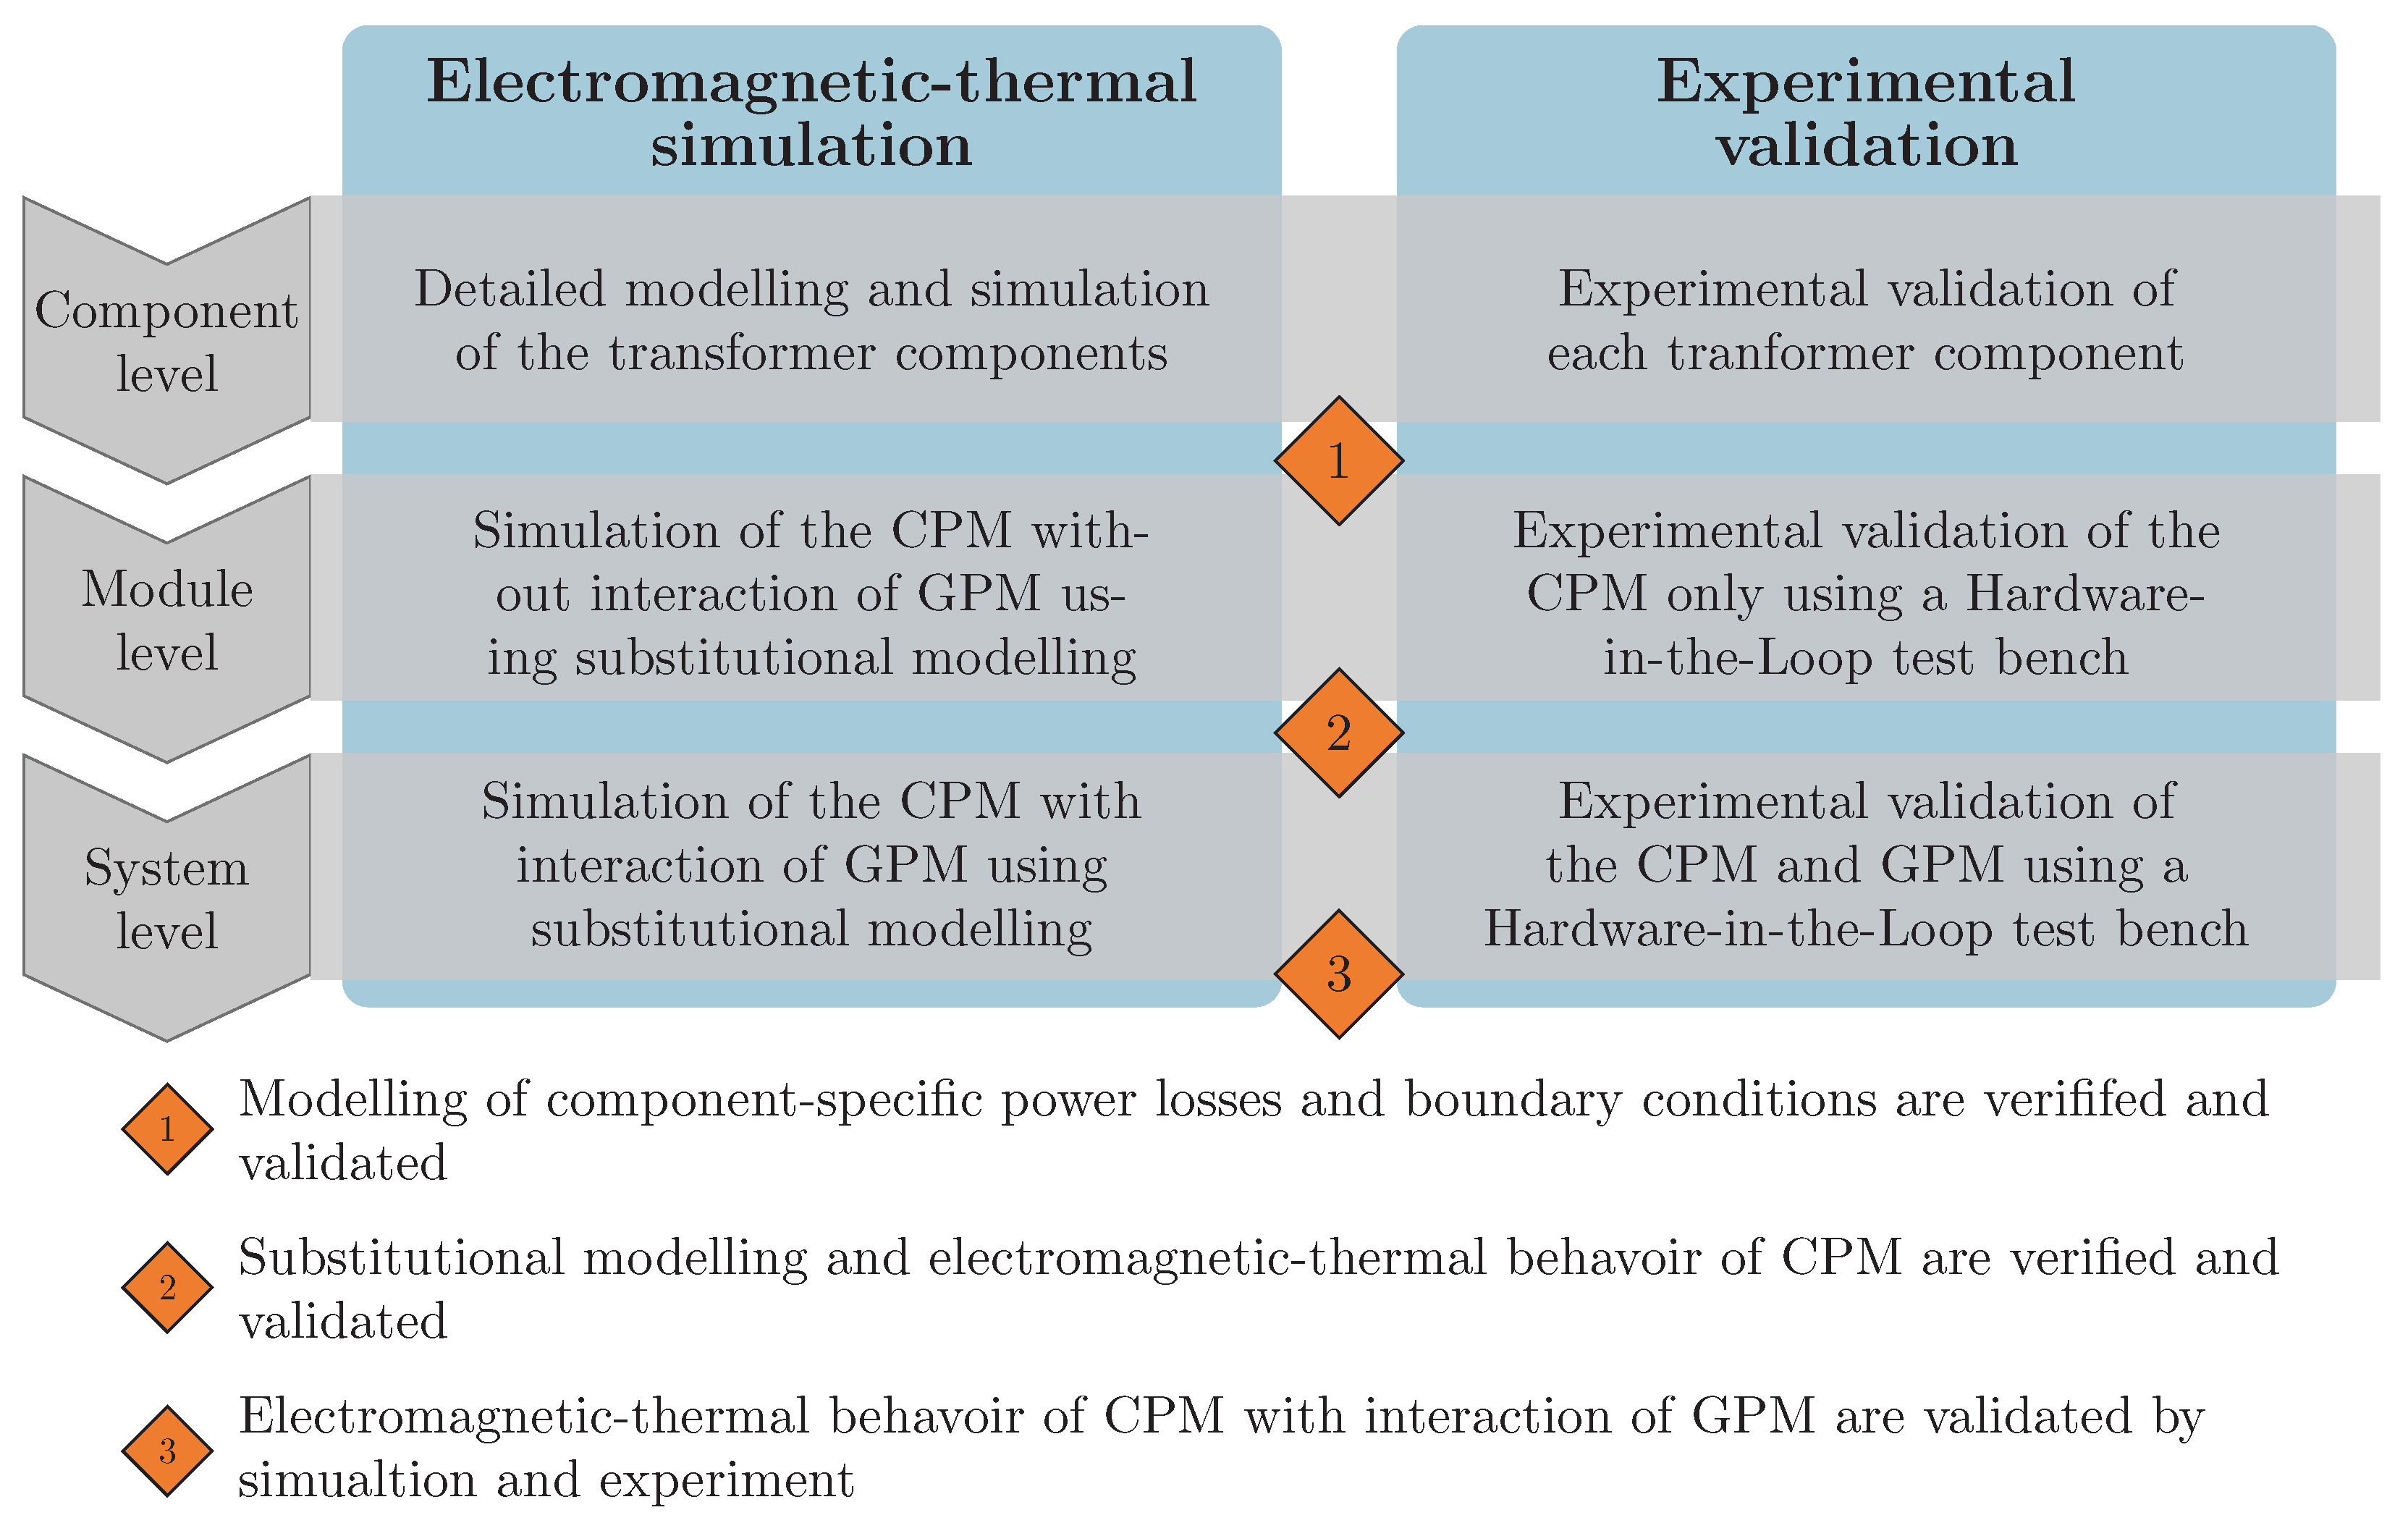
This paper determines the electromagnetic–thermal behaviour and efficiency of the proposed CPM design. The presented work approaches the investigation in a bottom-up manner, from the component to the system level, through simulations and experiments. Figure 3 illustrates the methodological approach of this paper.
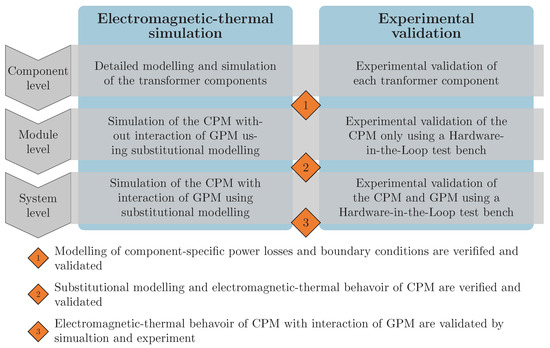
Figure 3.
Methodological approach.
At each level, specific electromagnetic–thermal simulation models were set up and experimentally validated. At the component level, the transformer components, the coil, ferromagnetic sheet and shielding, were examined individually to verify the electromagnetic and thermal behaviour of each component including the component-specific modelling of the power losses, as well as the boundary conditions. On this basis, the component-specific substitutional models developed at the component level were combined at the module level. To verify the modelling without the influence of external fields, only the CPM was examined, neglecting the interaction with the GPM. Finally, the electromagnetic performance of the entire magnetic circuit was investigated, taking into account the CPM and GPM.
The paper is structured according to the methodological approach illustrated in Figure 3. Section 2 and Section 3 provide the basis for the investigation. In this context, the proposed WPTS is detailed in Section 2, and the proposed ultrathin CPM design including its electromagnetic and thermal specification is described in Section 3. On this basis, Section 4 details the proposed electromagnetic–thermal simulation models at the component, module and system level. Section 5 describes the experimental setups for the validation of the respective simulations. In Section 6, the simulation results are validated with experimental measurements at the component, module and system level. On this basis, the forecasting quality of the proposed modelling is discussed with respect to the electromagnetic–thermal behaviour. Finally, Section 7 provides conclusions and future prospects.
2. Proposed Wireless Power Transfer System
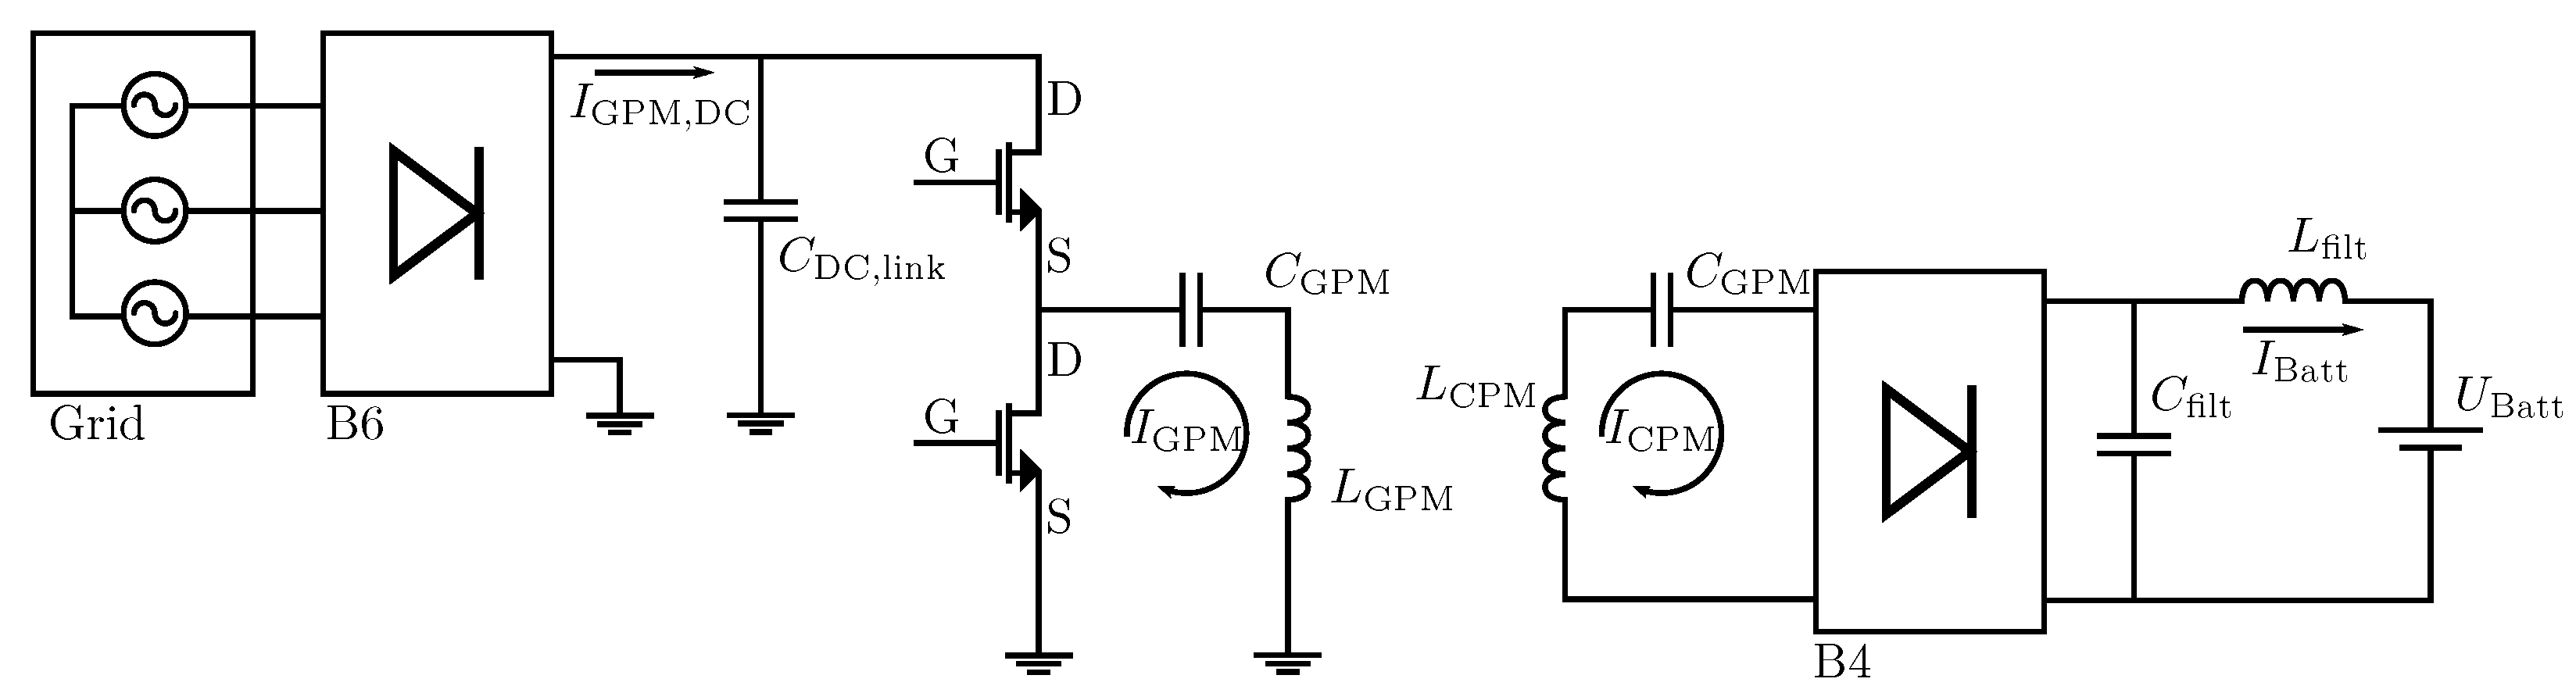
The setup of the utilized WPTS is shown in Figure 4. The GPM used a reduced and simplified implementation of the power electronics without power factor correction (PFC) as the test system was operating on an isolated grid. The AC/DC stage was a silicon B6-rectifier, which transforms the 3-phase input voltage into DC feeding a DC link capacitor . As the power inverter, a SiC-MOSFET half-bridge module was utilized, which switches up to 100A RMS with up to a 100 kHz frequency. The serial–serial-compensated resonance transformer consisted of the inductors of GPM and CPM , as well as the offboard and onboard compensation capacities and of the matching networks. As the onboard rectifier, a SiC-B4 bridge was used, which converts the AC from the resonance transformer into DC feeding a DC link capacity . An actively controlled or passive DC/DC conversion was not implemented per the design as the output voltage of the CPM resonant tank was above the battery voltage. The power control strategy was considered to be a mix between frequency-control and interleave mode operation. However, in the experimental setup, the power was controlled manually via the output voltage of the isolated power supply.
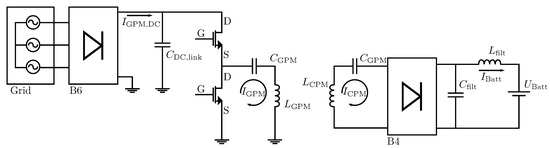
Figure 4.
Setup of the utilized wireless power transfer system.
Table 1 summarizes the main system specifications and design constraints of the exemplary WPTS. According to SAE J2954 [19], the onboard coil area was restricted to an area of 300 mm × 300 mm. Interoperability was required within lateral misalignments of and and air gaps between 100 mm and 210 mm. The DC link voltage of the CPM was fixed to a high-voltage (HV) battery voltage. The DC link voltage of the GPM was adjustable between 0 V and 540 V.

Table 1.
System specification and design constraints of the exemplary WPTS.
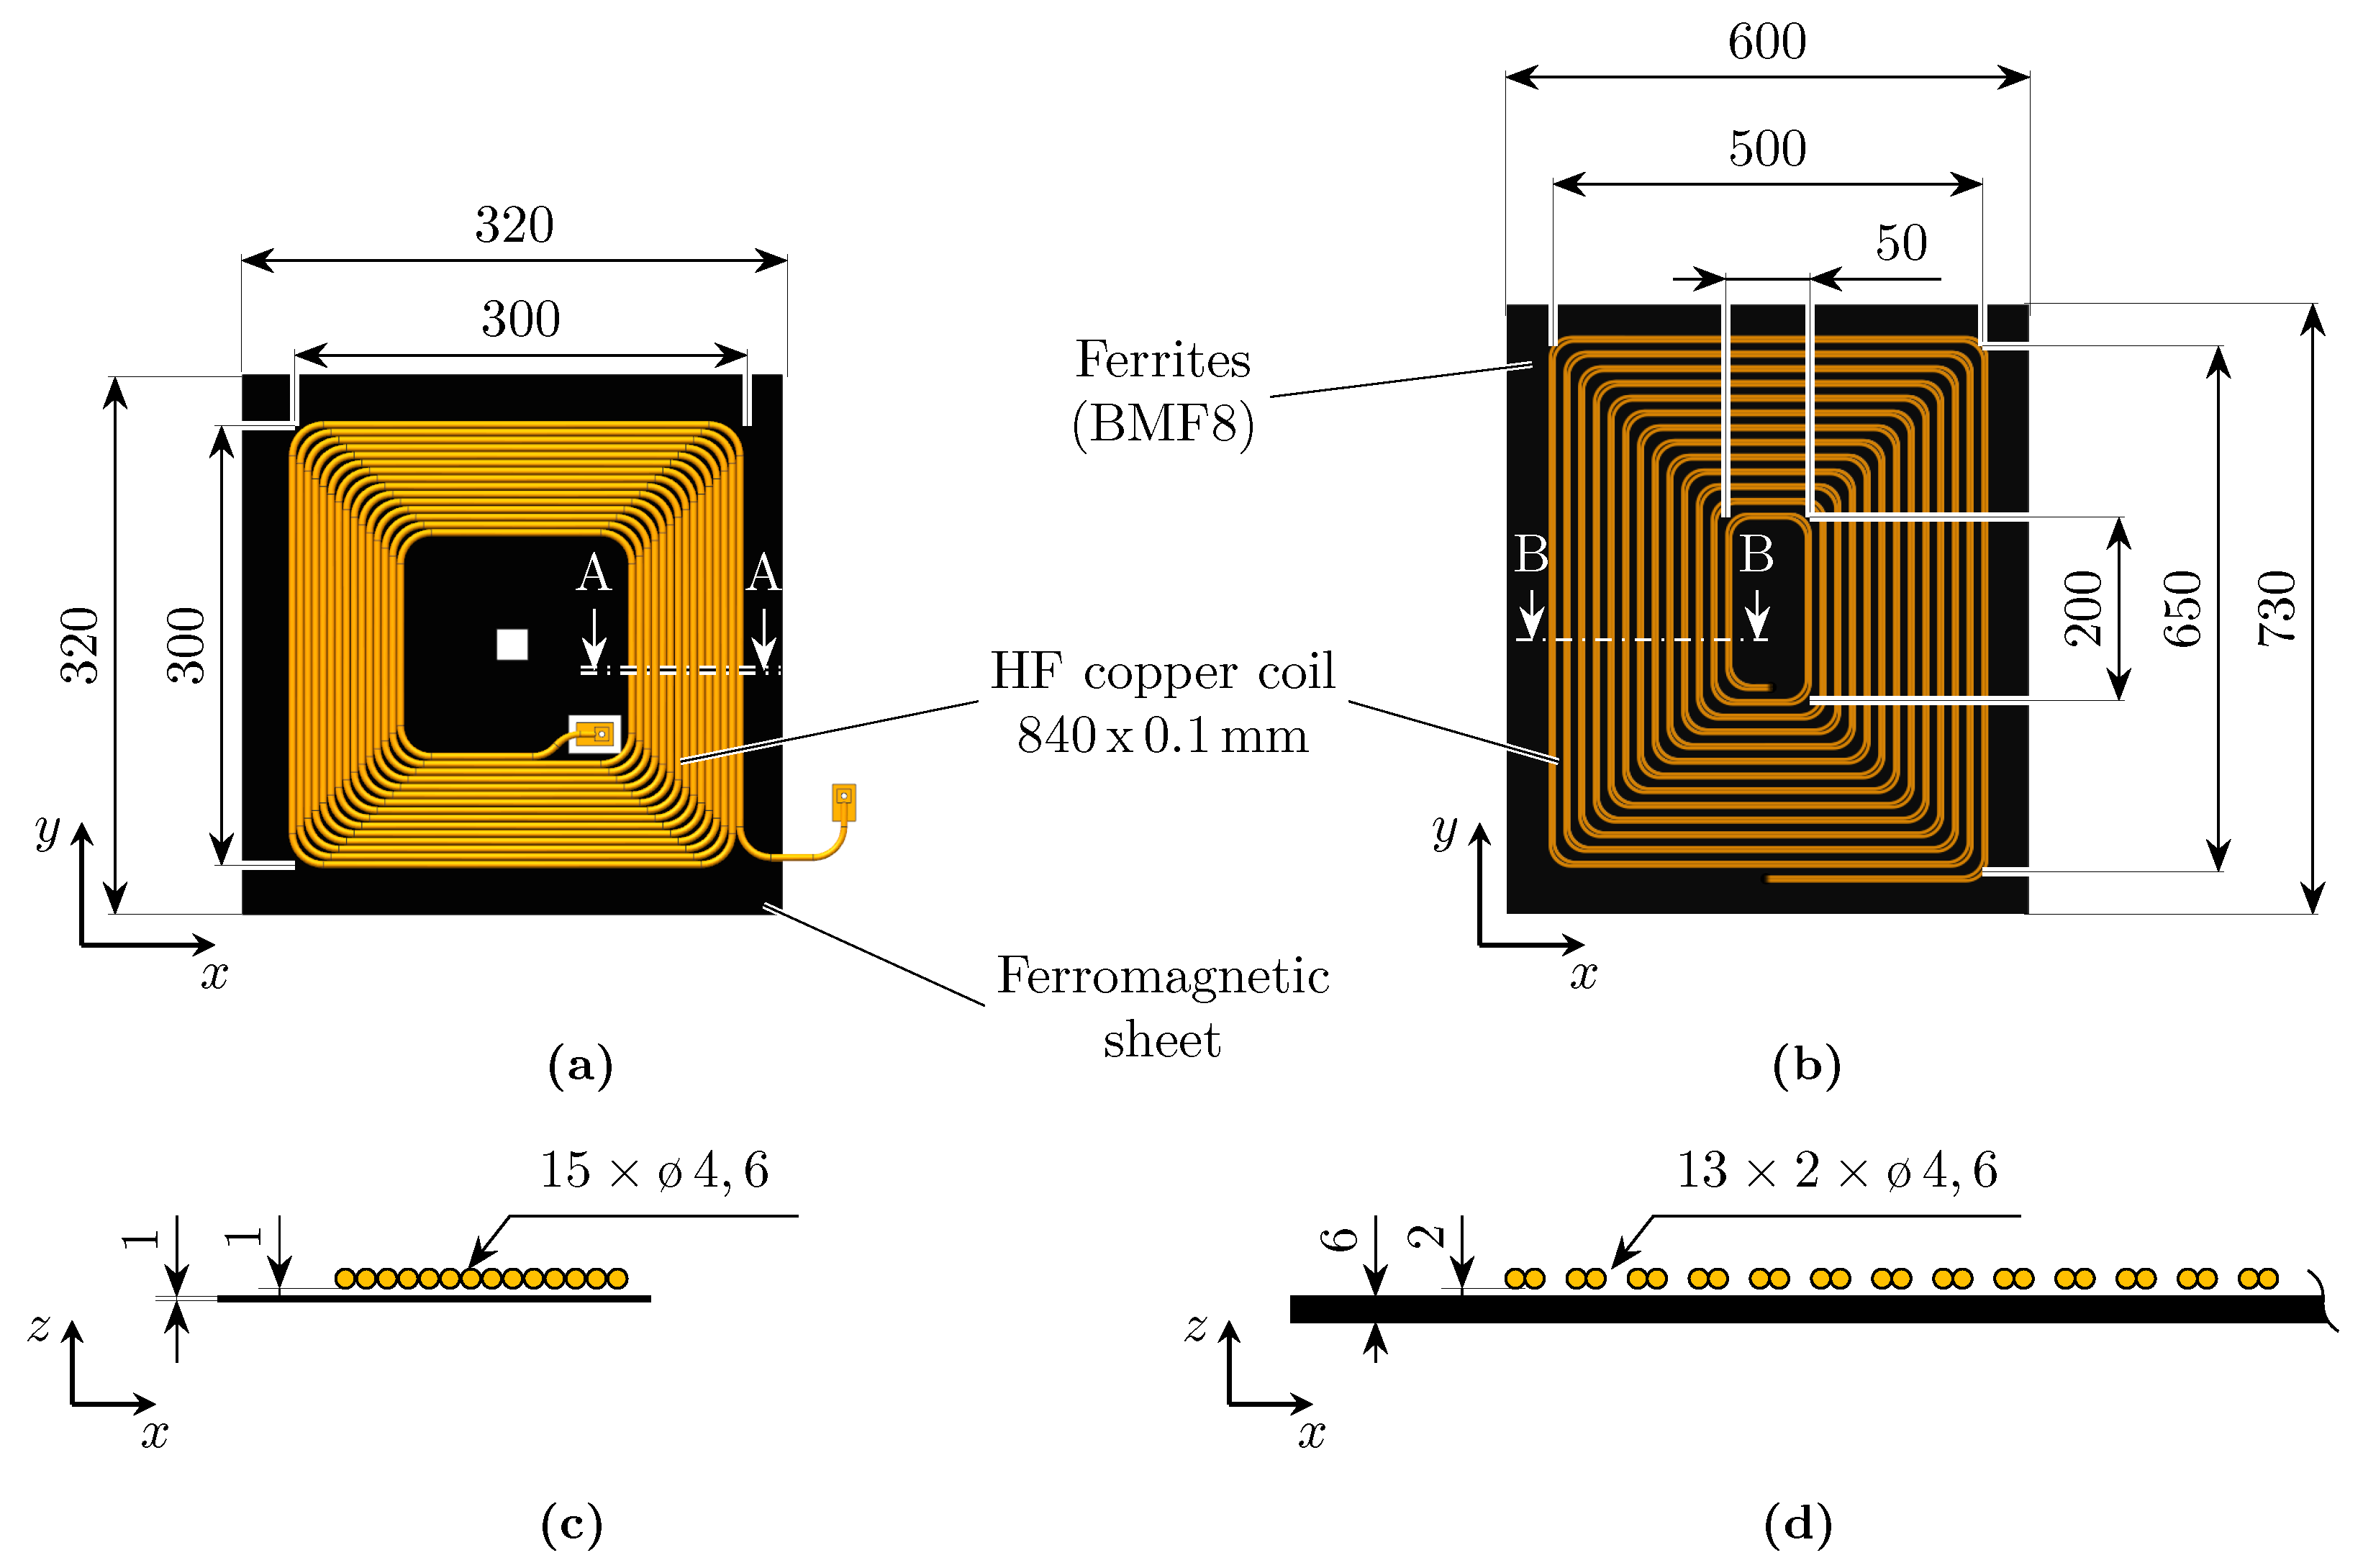
Based on the system specifications and the design constraints, the geometric and material specifications of the transformer components of the CPM and GPM were defined. Figure 5 shows the setup of the exemplary WPTS. The transformer parameters are summarized in Table 2.
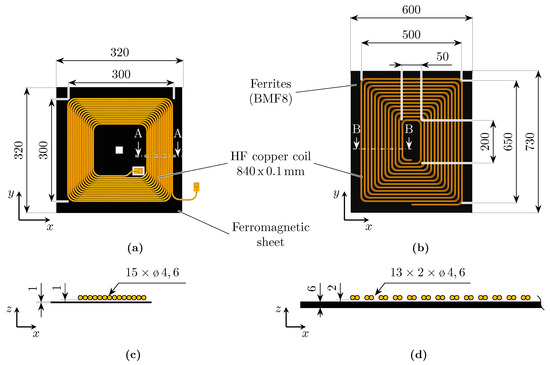
Figure 5.
Dimensions of the transformer components (unit: mm): (a) CPM, (b) GPM, (c) Section A-A and (d) Section B-B.
Table 2.
Transformer parameters of the proposed WPTS.
To maximize the given installation space while minimizing the z-dimension, the coil had a rectangular shape with 15 single-layer windings using a round stranded copper wire with . As an alternative to the commonly used ceramic ferrite plates, a flexible 320 mm × 320 mm ferromagnetic sheet was used, providing a flexible and highly permeable foil. It was assembled from multiple, alternately stacked layers of ferromagnetic film, as well as nonmagnetic, adhesive and protective coatings made from polyethylene terephthalate (PET), as given in [20]. Overall, 30 layers were stacked to avoid saturation and high hysteresis losses, resulting in a total sheet thickness of 0.9 mm.
The lateral dimensions of the transmitting coil were 650 mm × 500 mm with a total number of 13 windings. The coil was underlaid with a layer of conventional BFM8 ferrite plates [21], which offer low loss characteristics in the required frequency range. The same mm stranded wire was used on the primary side, although each winding was laid in double to ensure current carrying capacity (see Figure 5d).
3. Proposed Ultrathin CPM
This section describes the design and manufacturing process of the proposed ultrathin CPM and its electromagnetic and thermal specifications, as these parameter are key for the simulation of the electromagnetic–thermal behaviour.
3.1. Design and Manufacturing
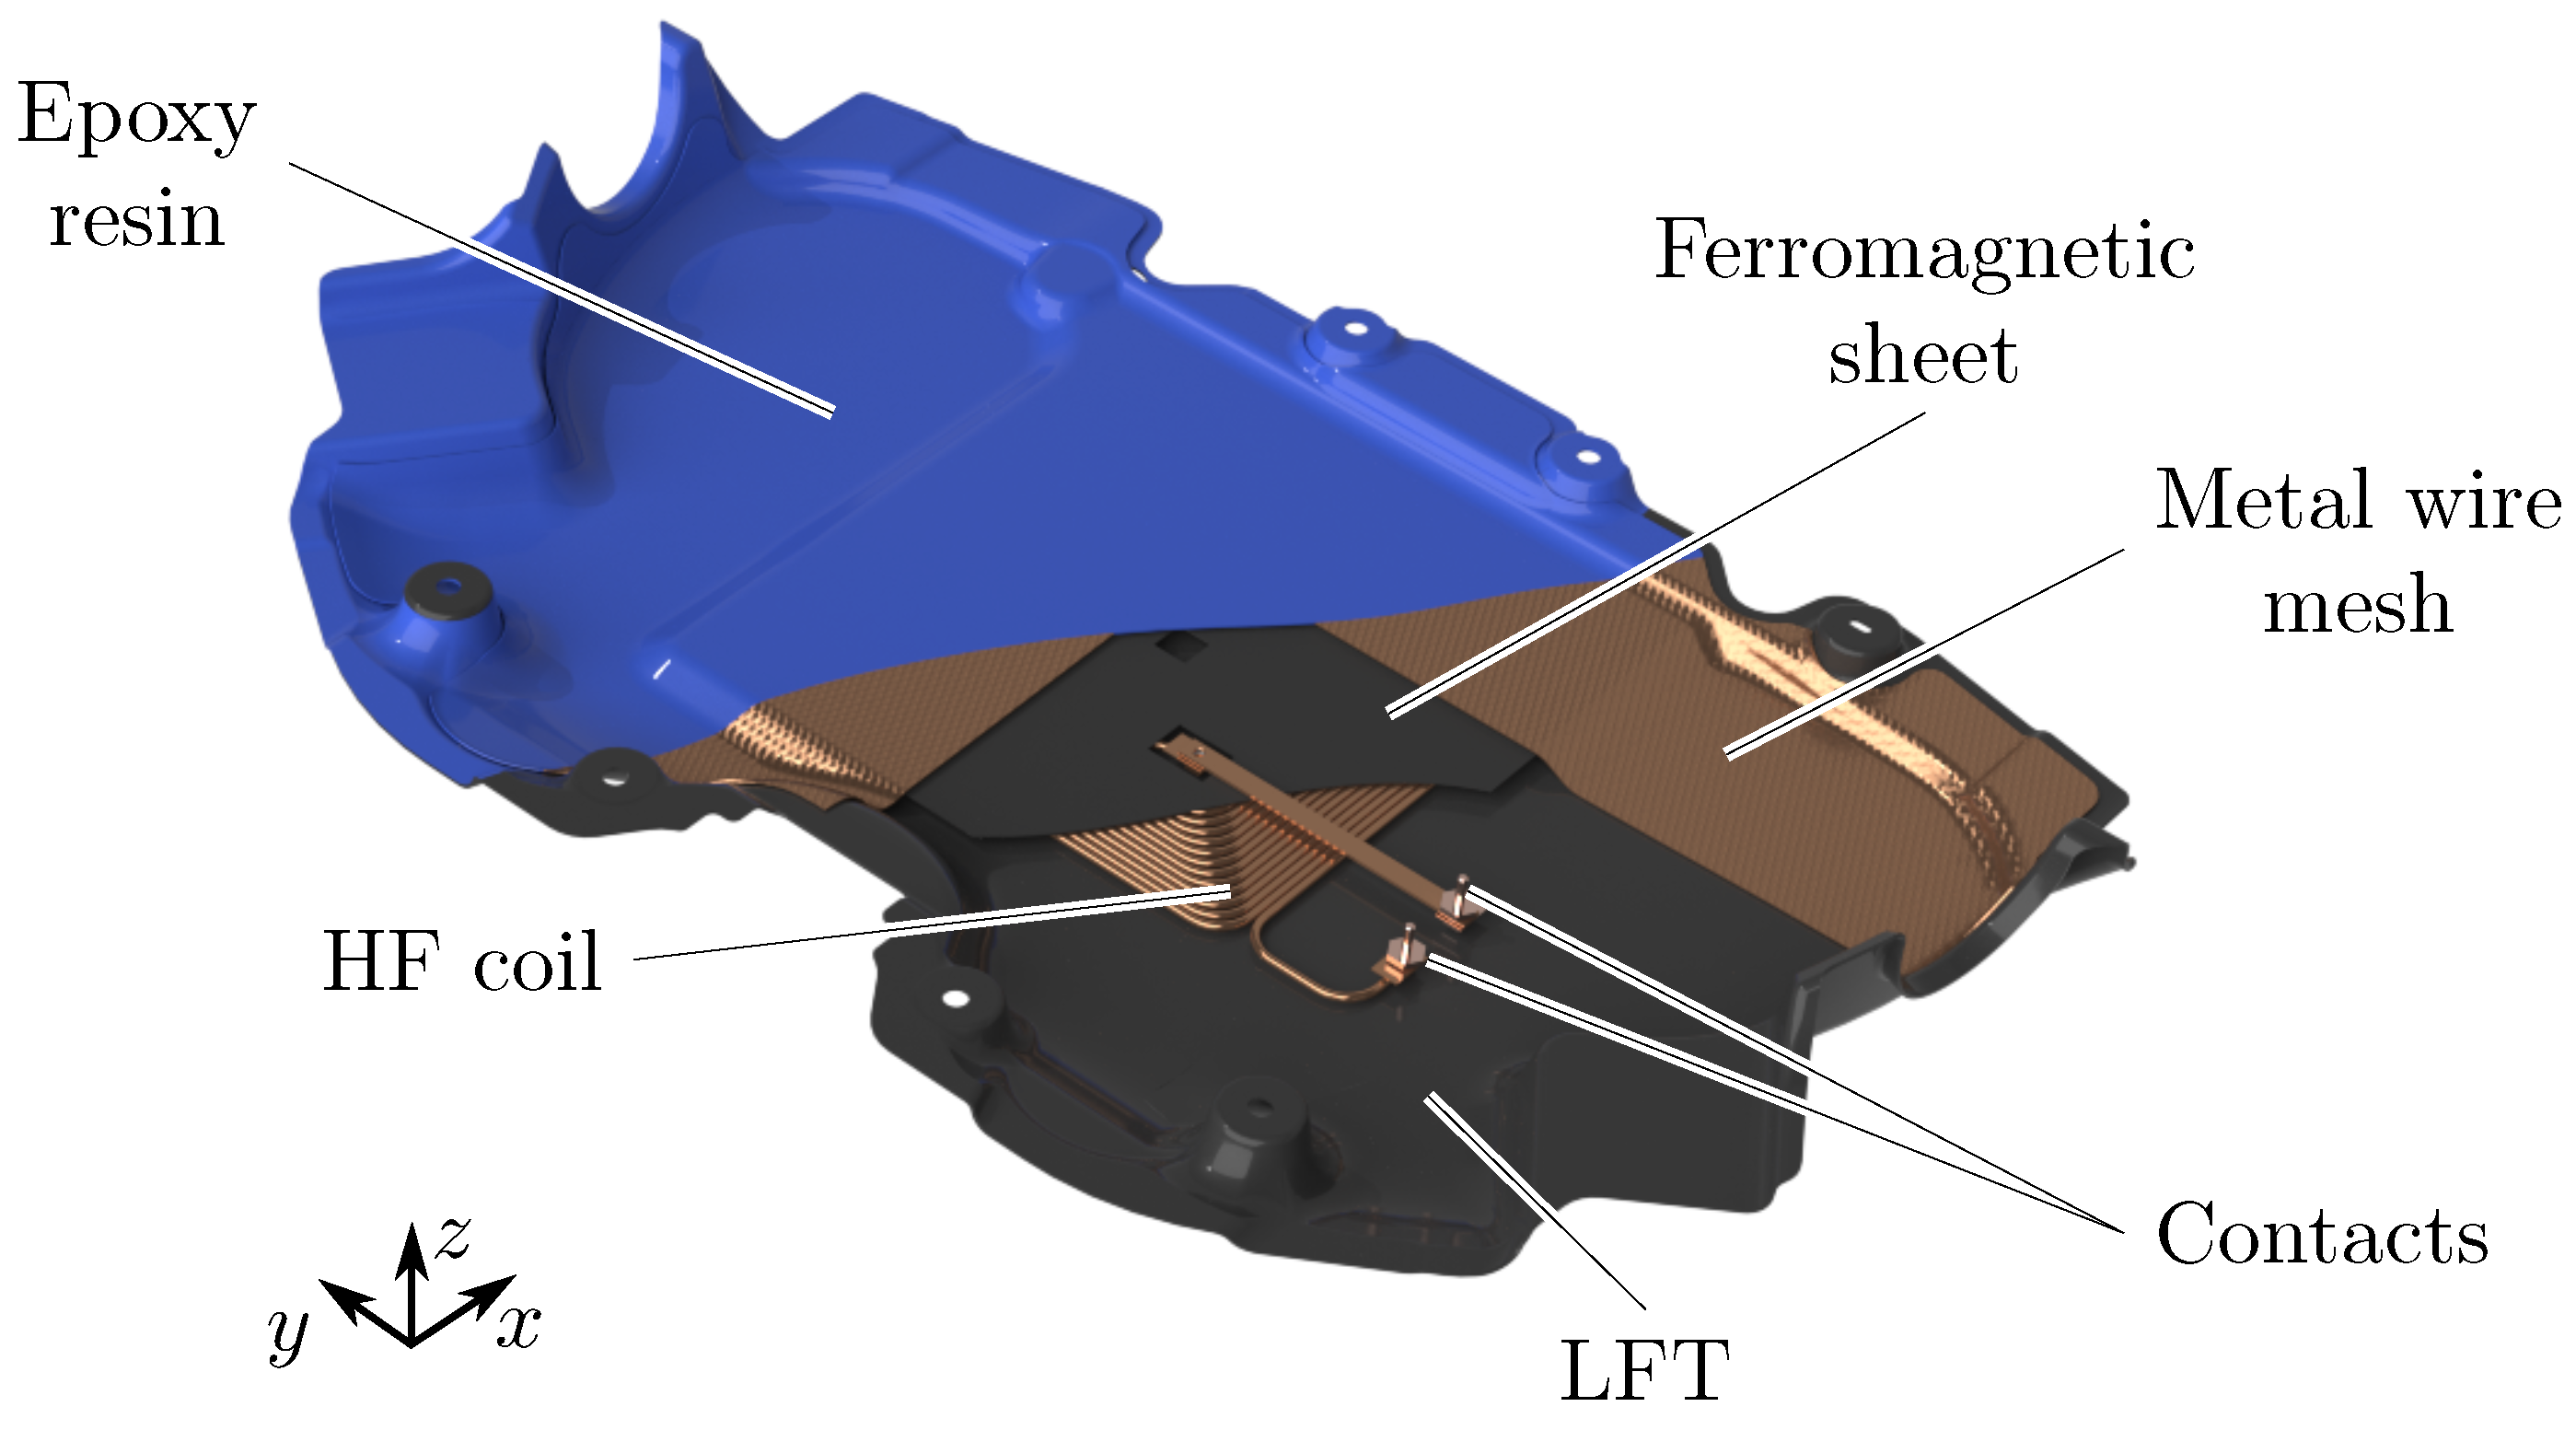
In order to protect the active components of CPMs, mechanical designs are required to take the underfloor impact scenarios given in [3] into account. In contrast to conventional CPM designs with a high robustness and stiffness, this paper presents a novel ultrathin CPM design, which allows moderate deflections caused by mechanical bending loads. In this respect, the spatial and functional integration of the transformer components into the plastic composite of the underbody cover combined with the externalization of the power electronics enabled a significant reduction of the z-dimension [6]. The proposed design is schematically illustrated in Figure 6.

Figure 6.
Schematic illustration of the proposed ultrathin CPM design—cutaway view.
The functionally integrated design of the proposed CPM was realized by utilizing the epoxy resin Araldite® CW2243-2L [22], providing a high thermal conductivity, which guarantees a sufficient structural connection and thermal coupling between the lossy integrated components. To ensure mechanical deflection, sufficient elongation of the integrated components was required, while ensuring the structural integrity of the plastic composite. Accordingly, the use of conventional aluminium shielding sheets acting as a separating layer and conventional ferrites with brittle fracture behaviour are not effective. Therefore, flexible ferromagnetic sheets substituted the conventional ferrites, and a metallic wire mesh was used as the shielding in the proposed CPM design. The demonstrator was scaled to the lateral dimensions of 900 mm × 600 mm with a z-dimension of 15 mm and a weight of 9.1 kg.
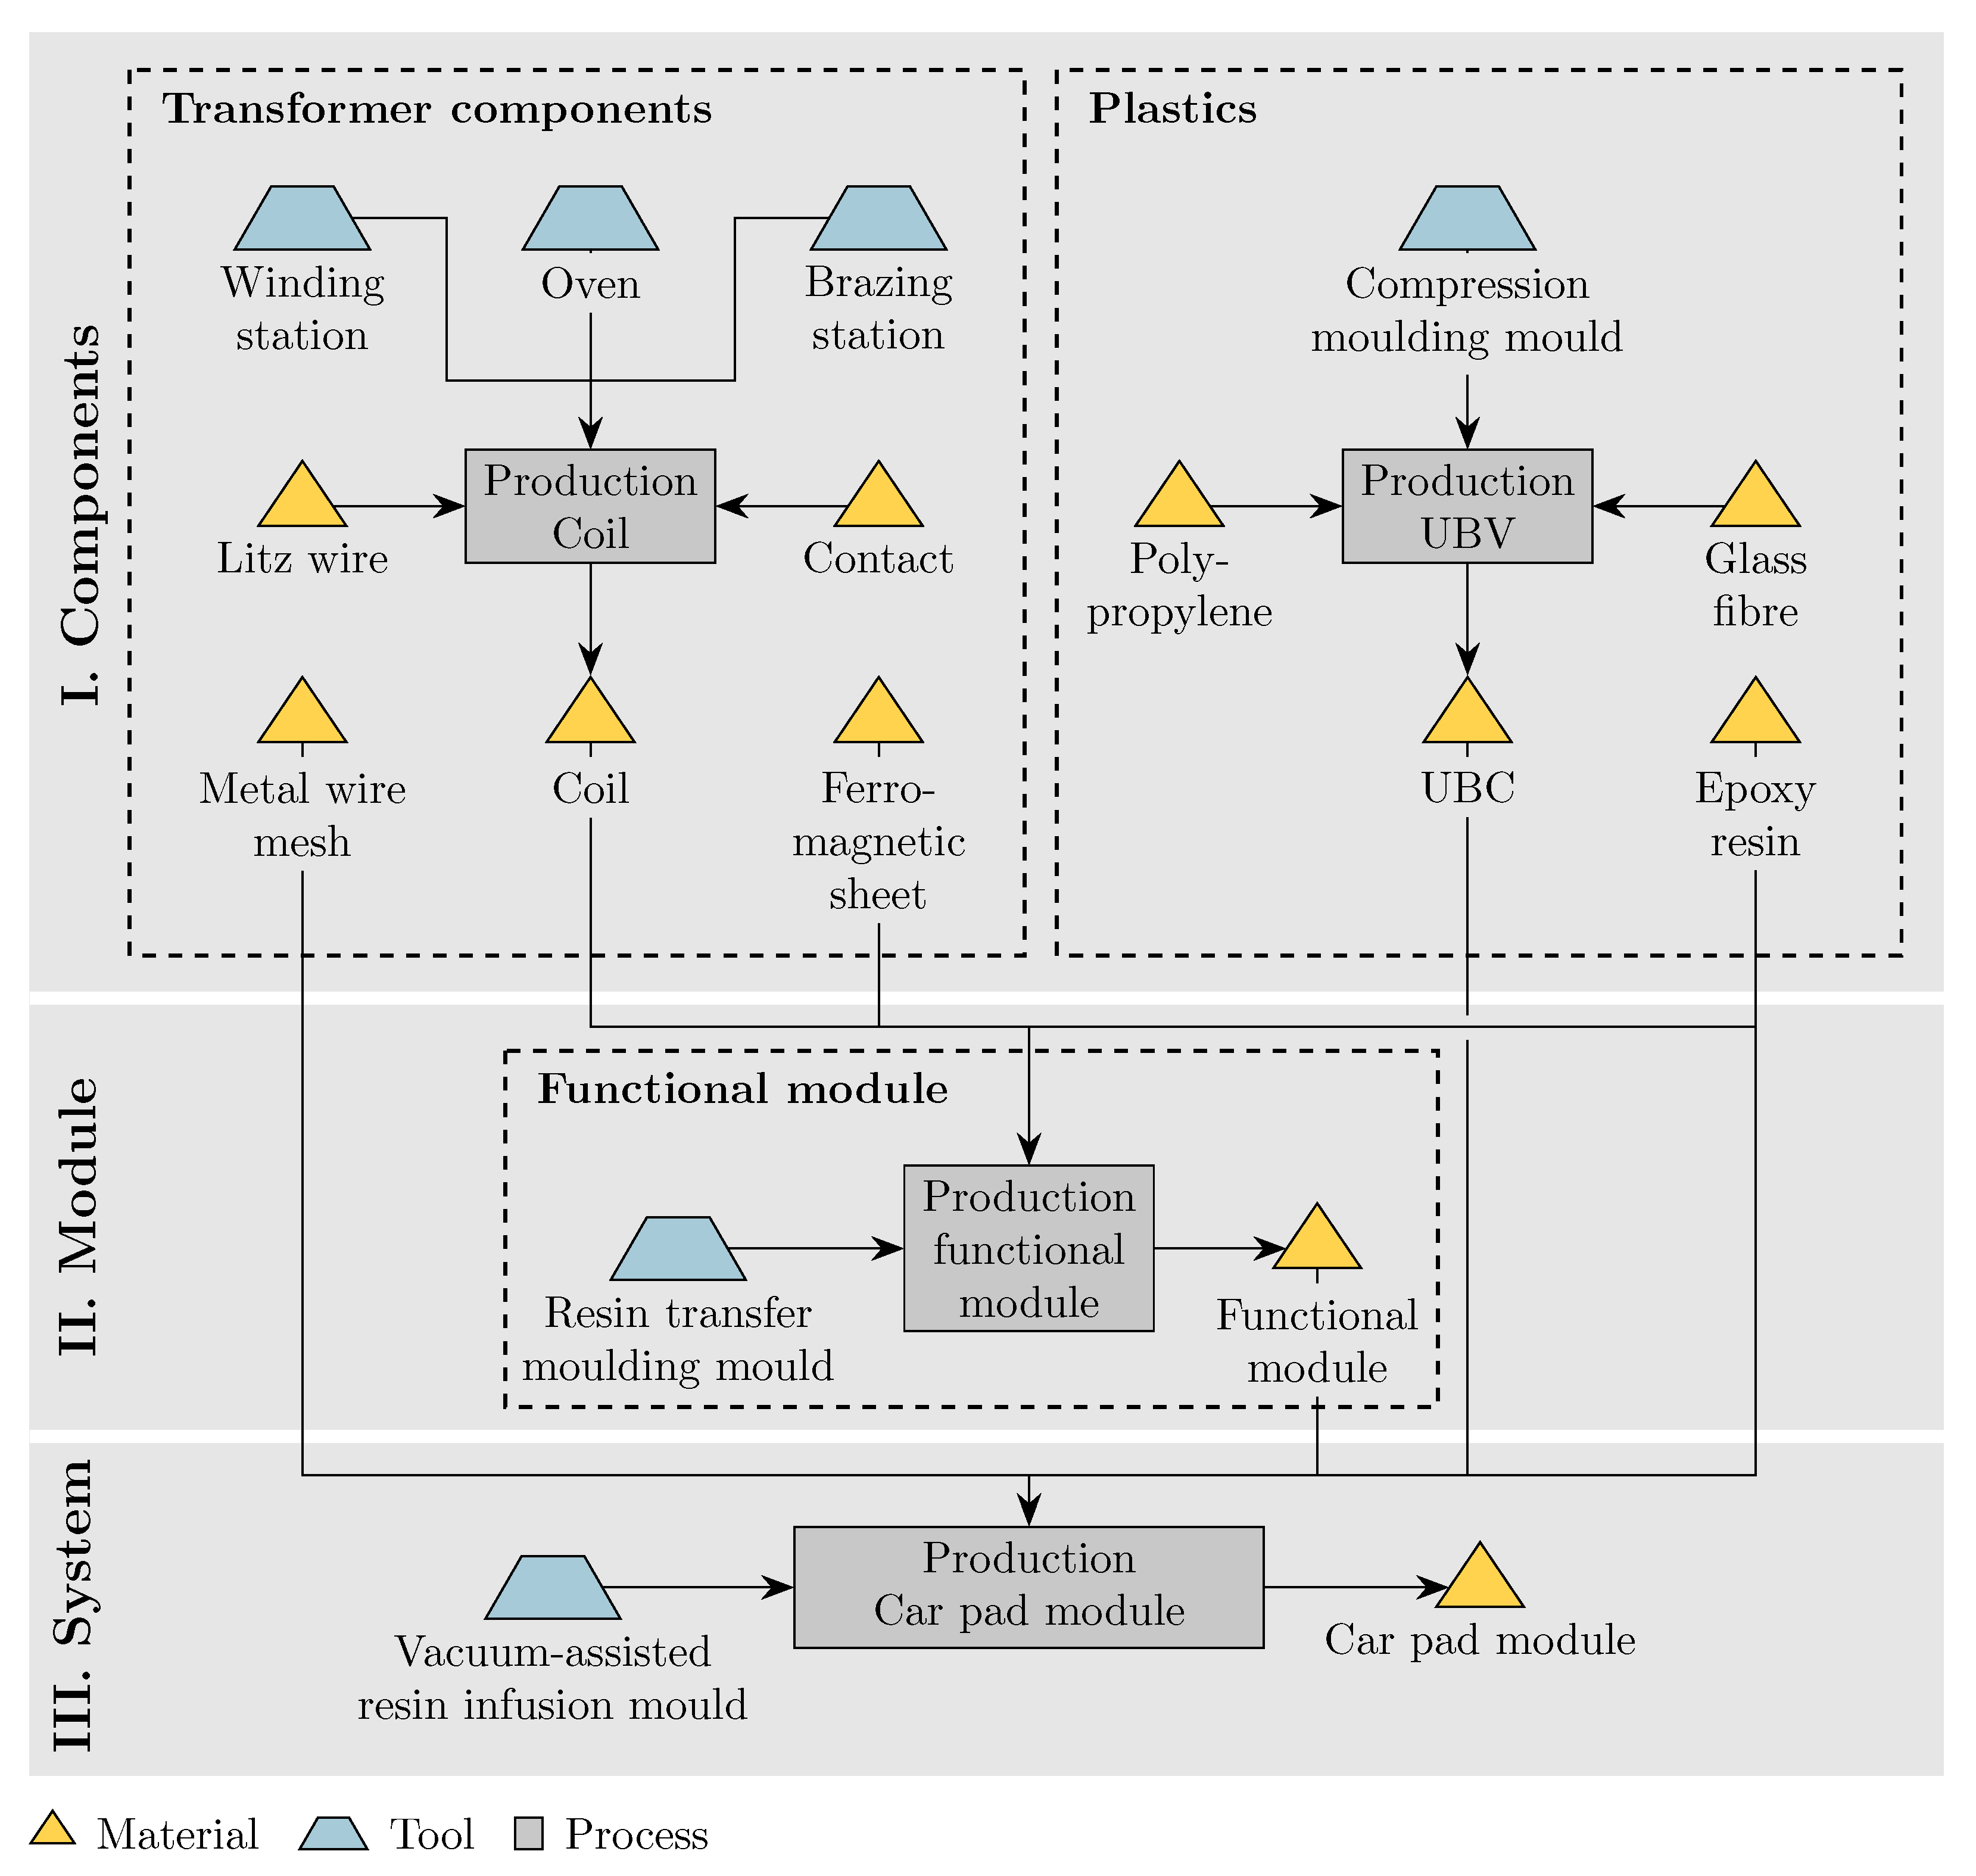
Utilizing the available tools, the manufacturing process of the proposed demonstrator was divided into 3 stages: (I) components, (II) module and (III) system. In the first stage, the components to be integrated, as well as the underbody cover as a long fibre-reinforced thermoplastic (LFT) product were produced. In the second stage, the coil, ferromagnetic sheet and epoxy resin were combined into a plastic-integrated functional unit using resin transfer moulding (RTM). Finally, in the third stage, the functional unit, the metal mesh and the underbody cover were combined with the epoxy resin using vacuum-assisted resin infusion (VARI). This procedure can be reduced to a 2-step process if an RTM tool of adequate size is available for the production of the CPM. Figure 7 illustrates the prototypical manufacturing process.
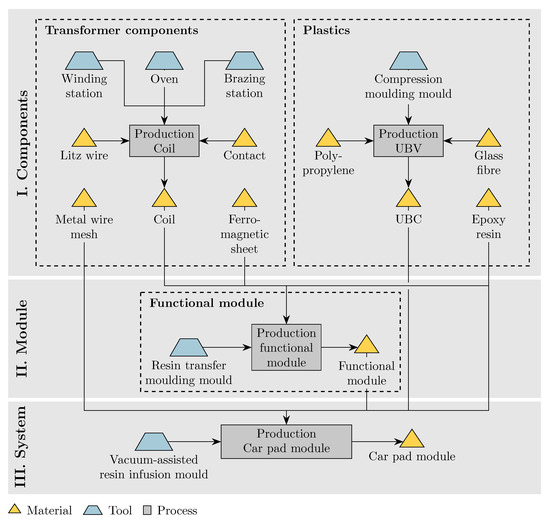
Figure 7.
Prototypical 3-step manufacturing process of the car pad module.
3.2. Electromagnetic and Thermal Specifications
In order to investigate the coupled electromagnetic–thermal behaviour of the proposed CPM design, the electromagnetic and thermal material properties of the CPM components were required. Table 3 summarizes the relevant properties of the CPM components for the investigation of the thermal management of the proposed design. As the capacitive effects were neglectable, the permittivity was considered to be 1 in all cases. To enable modelling the ferromagnetic sheet and the copper mesh as solid regions, being a common simplification, the macroscopic material properties of these composite regions were derived from the properties of the individual materials by using the mixing rule from [23], if either isotropic behaviour can be expected or, in the case of conductivities, the materials act in parallel (e.g., in-plane characteristics for stacked materials). For materials acting in series (e.g., out-of-plane characteristics), we used the mixing rule:
where represents the corresponding material property, respectively, is the corresponding material property of the composite material and is the volume fraction of the corresponding component. Deviations from this rule due to anisotropy are explained in Section 4.1.
Table 3.
Material properties of the CPM components.
4. Electromagnetic–Thermal Simulation
The simulation evaluation of the thermal management of the WPTS requires an electrically and thermally coupled analysis [8,16]. Although a two-way coupled electromagnetic-thermal simulation is computational more expensive, as both solvers converge iteratively to a common solution, it enables accurately predicting the transient temperature distribution of CPMs [12,17]. Therefore, each simulation result given in this paper was achieved from two-way electromagnetic–thermal simulations using the FEM simulation software Comsol Multiphysics. This section describes the modelling of the power losses of each transformer component, as well as the derivation of the substitutional simulation models at the component, module and system level.
4.1. Component Level
4.1.1. Litz Wire
The frequency- and temperature-dependent loss density of the litz wire is calculated from the sum of the individual losses due to the skin effect and the proximity effect .
The skin effect losses and the proximity effect losses of the litz wire are defined as the sum of the losses of the litz wire strands. Due to the computational complexity, not every single strand was modelled. Instead, the loss density of a single strand was applied to the whole litz wire and weighted with the volumetric fill factor . Accordingly, the skin effect loss density can be calculated as:
where is the linear approximation of the temperature-dependent conductivity of copper, is a frequency- and temperature-dependent factor modelling the skin effect [13] and is the amplitude of the current density within a single strand. Note that was considered constant across the cross-section of the conductor, as we assumed a perfect litz wire. The fill factor and the current density are calculated via:
where is number of strands per litz wire, is the cross-sectional area of a single strand and is the cross-sectional area of the litz wire.
The proximity effect losses of the litz wire are calculated in similar way. However, the losses are proportional to the square of the external magnetic field strength amplitude , which results from the solution of the magnetic simulation.
where is a temperature- and frequency-dependent factor modelling the proximity effect [13]. The specific material properties for the thermal simulation of the litz wire are the density , heat capacity and thermal conductivity , calculated according to the rule of mixtures in Equation (1).
4.1.2. Ferromagnetic Sheet
The magnetisation curve of the ferromagnetic film material was nonlinear. Therefore, the average energy method [26] was used in order to calculate an adequate magnetic field density for the magnetic loss calculations. For a harmonic magnetic field excitation , the time-averaged magnetic field density amplitude is calculated as:
where is the period of the time harmonic excitation and is the nonlinear -curve. The loss density of the ferromagnetic sheet is calculated from the given core loss curves from the material datasheet. Analogous to the litz wire model, both the power density and the magnetic field density need to be scaled by a volumetric fill factor , as the ferromagnetic sheet is a composite material. That is, the magnetic field density has to be scaled up, as the field is mostly concentrated in the highly permeable ferromagnetic layers and the power density has to be scaled down, as the losses are only located in the ferromagnetic layers:
as is nonlinear, does not cancel out.
Observations from experiments have shown a nonisotropic in-plane loss behaviour. The origin of this deviating behaviour is unknown to the authors and has not been described in the material datasheet. Thus, the nonisotropic loss behaviour was captured with an adjustment factor , which was derived from the component-level experiments. The adjustment factor was applied to the in-plane magnetic field components and in opposite ways.
4.1.3. Shielding
The electromagnetic shielding was a mesh, which was woven from small copper strands embedded in the epoxy resin Aradur® HY2966 [22]. On a macroscopic level, a full-geometry simulation would require a huge computational effort. Thus, an equivalent substitute material model for the electromagnetic and thermal simulation was derived from a full-geometry model. Thermal and electric conductivity both describe a heat flow or current flow based on the gradient of the temperature T or the electric potential .
Accordingly, thermal conductivity can be calculated with the same coefficient with respect to the copper properties:
In order to derive , a section of the copper mesh was modelled in detail together with a block of identical dimensions, but with varying conductivity coefficients, as shown in Figure 8. Although the mesh was integrated in resin, its thermal or electric conductivity can be neglected, since and . An external heat flux was applied on one edge, while on the opposite edge, the temperature was fixed. This enforced a temperature gradient according to the effective thermal conductance. The in-plane conductivity coefficient of the equivalent block model was then tuned, such that the temperature difference of the block matched the temperature difference of the mesh. In the out-of-plane direction (z), the conductivity coefficient is calculated as:
where denotes the covered area of the copper mesh and denotes the area of the mesh that is optically covered by copper (i.e., without air gaps). However, as the mesh was thin with respect to the height of the CPM, the error of this approximation was expected to be low.
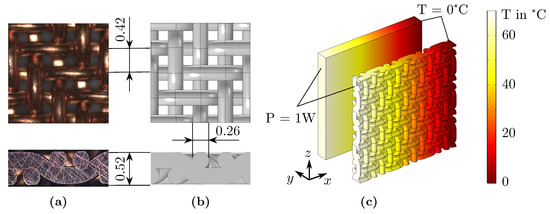
Figure 8.
Top and side view of a copper mesh unit cell from (a) microscopy and (b) geometric model and the (c) detailed thermal simulation model of the copper mesh.
4.2. Module Level
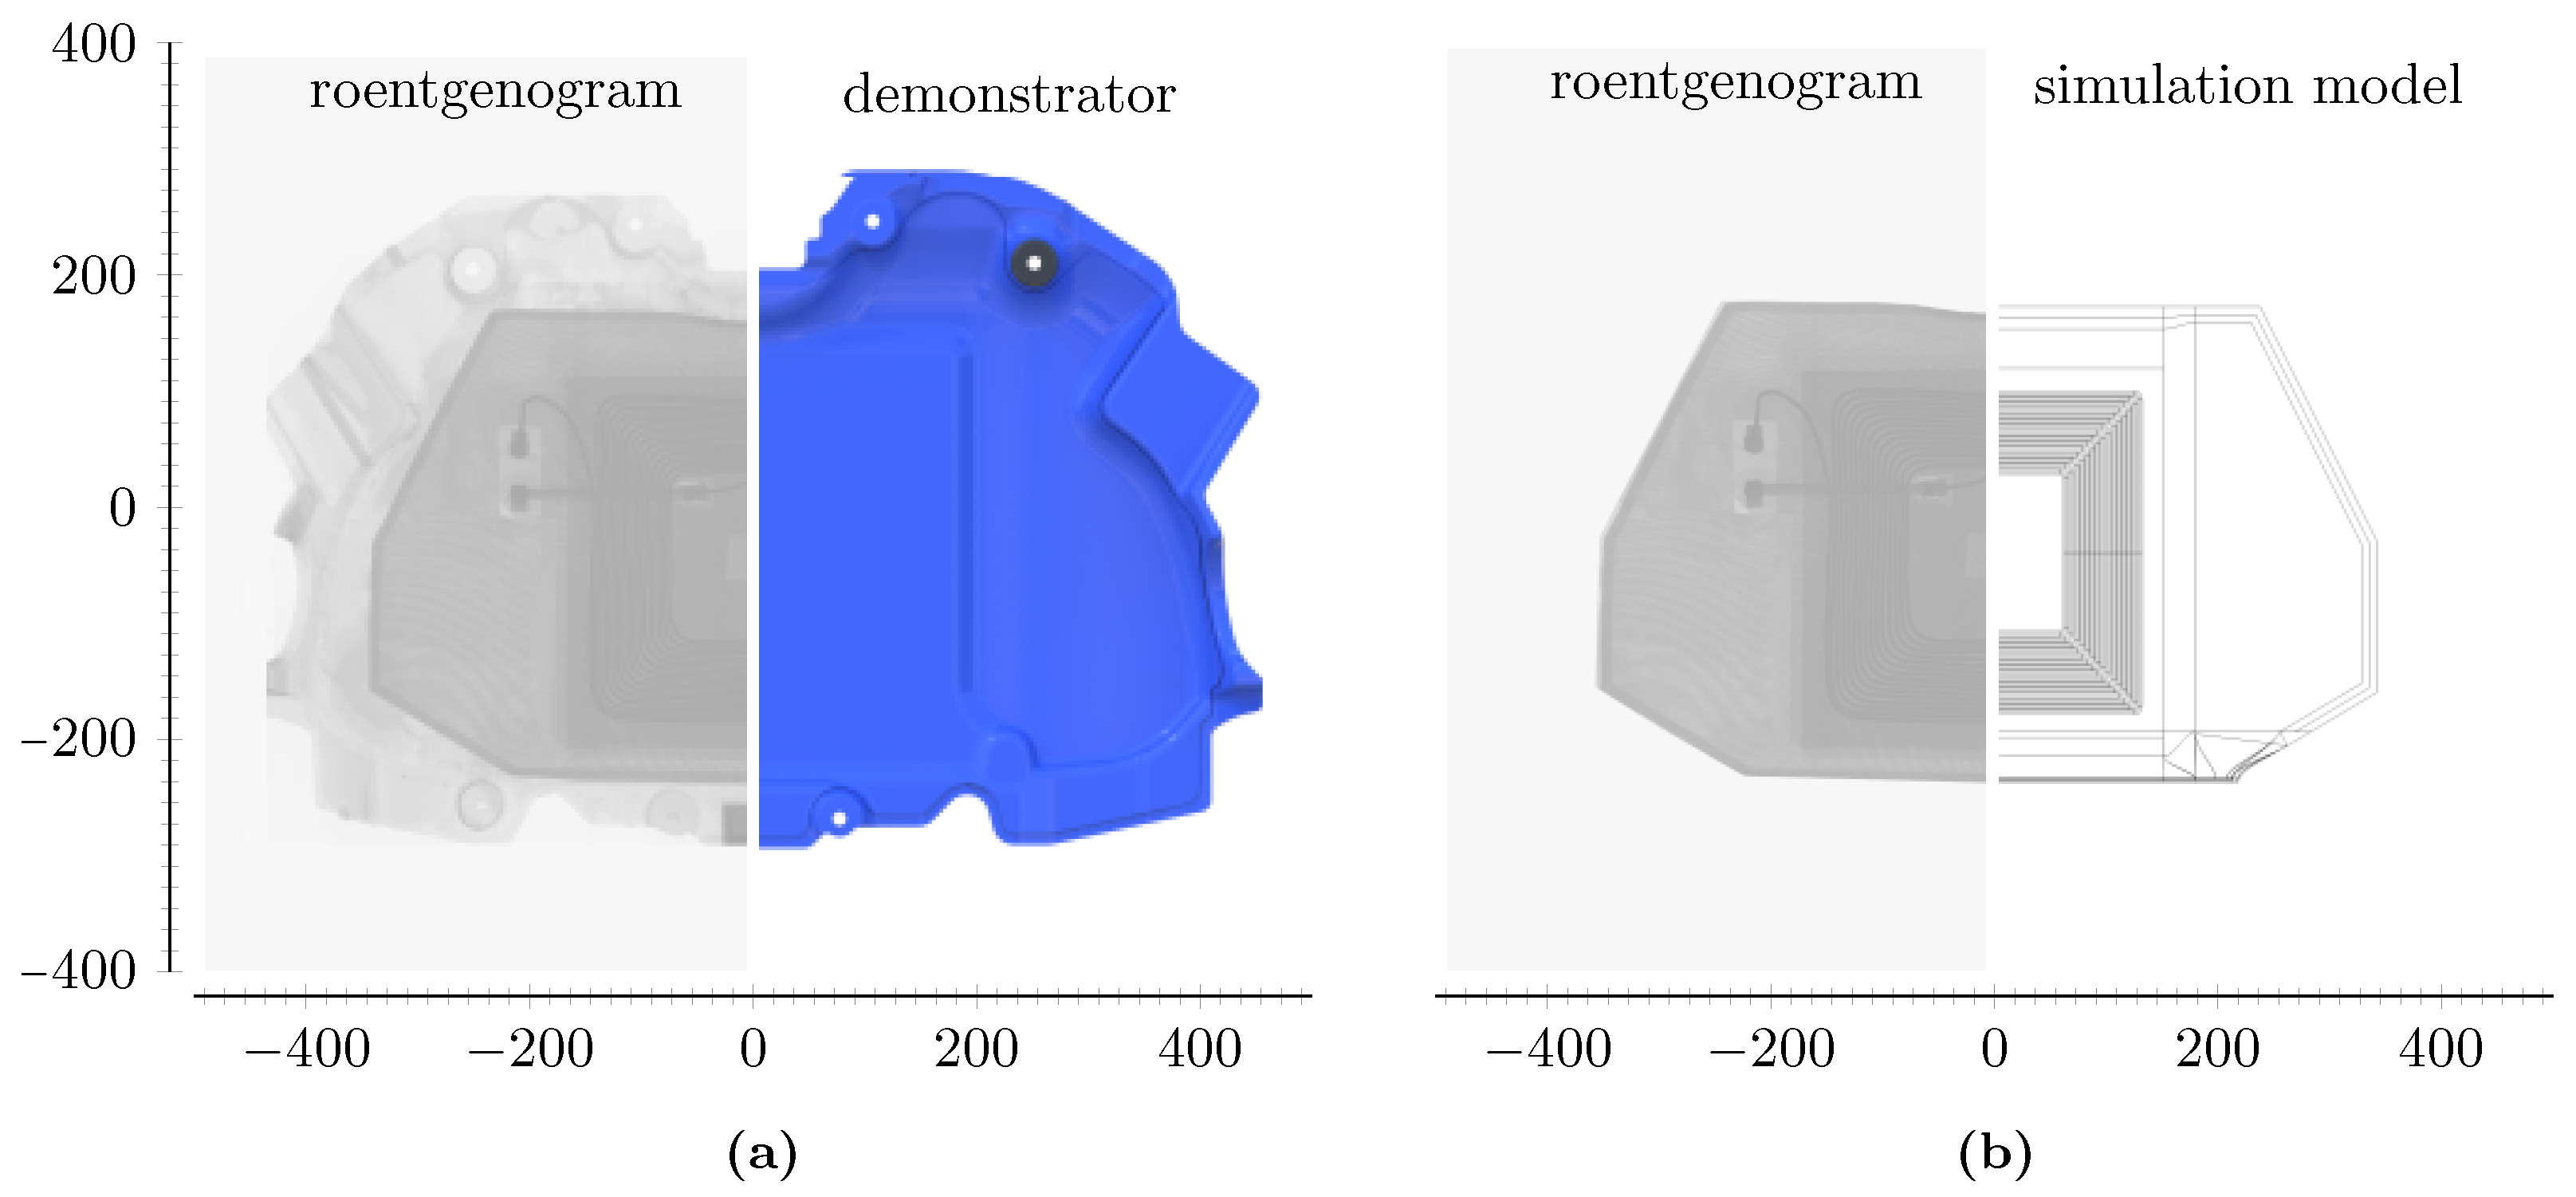
Using the material parameters given in Table 3 and the models derived and validated at the component level, a two-way transient electromagnetic–thermal simulation of the CPM was performed. Due to the integral design of the proposed CPM, the dimensions of the integrated components were derived from a roentgenogram, as shown in Figure 9. In order to reduce the model complexity, the simulation model took advantage of the axial symmetry by only simulating a half model, in which only important geometric features from the physical model, such as the curved shielding, were applied.
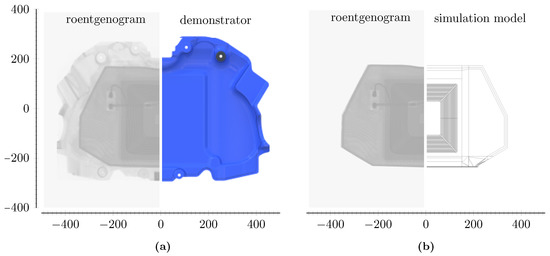
Figure 9.
Dimensions of (a) the demonstrator and roentgenogram and (b) the roentgenogram and simulation model (in mm).
At the module level, the coil was excited with a current of A RMS and a frequency of kHz. The heat transfer coefficient was assumed to be on the top side and on the bottom side. Heat transfer by radiation was neglected according to [12,16]. The loss densities were calculated according to the material models and were applied to their specific volumetric domains.
4.3. System Level
In order to model the effects of an external magnetic field, as it is required in WPTSs through the transmitting coil of the GPM, a second coil on a layer of BFM8 [21] ferrite was added to the model according to the parameters in Table 2. To reduce the complexity, the GPM coil was modelled as a block with an equivalent coil model. The enforced coil current was A RMS and phase shifted by with respect to the CPM current, as this is the usual operating point. The air gap between the CPM and GPM was .
5. Experimental Validation
In order to validate the simulation results, experimental evidence was required. Accordingly, the virtual experiments were re-enacted physically at the component, module and system level. All tests were executed on a hardware-in-the-loop (HIL) test bench, which was completely made out of plastics and wood to avoid measurement errors due to the influence of magnetic or conductive surrounding materials. The corresponding experimental setups are described in the following subsections.
5.1. Component Level
To validate the component-specific power loss modelling, the electromagnetic–thermal behaviour of each transformer component—coil, ferromagnet sheet and metal wire mesh—was analysed separately. For this purpose, first the coil embedded in the resin was analysed alone, that is the coil was excited with a harmonic current (A RMS, kHz), while the heating process was captured with the thermographic camera VarioCAMHD head 600 [27]. In alignment with the simulation, the bottom side of the coil was isolated thermally with foam to enforce natural convection on the top side only. Moreover, this coil was utilized as a magnetic field excitation in the metal wire mesh test (A RMS, kHz) and the ferromagnetic sheet test (A RMS, kHz). Again, foam was used as an insulator to thermally decouple the components from the excitation coil. Power measurements were taken for every component test to further check for plausibility. These measurements were each based on the DC input power of the power electronics. The influence of static losses such as the power electronics or supply lines could be factored out due to the comparable operating frequencies and the known coil resistance. The experimental and measurement setups are shown in Figure 10 and Figure 11. Due to the different thermal mass and the loss mechanisms, the measuring times varied greatly from 5 min for the metal wire mesh to 90 min for the coil until the steady-state temperature was reached. To increase the measurement accuracy of the infrared camera, tape was applied to the edges and the centre of the metal wire mesh to set the local material emissivity.
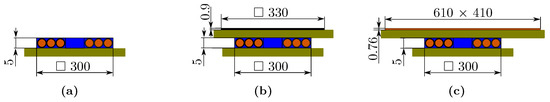
Figure 10.
Experimental setups of the thermal investigation at the component level for the (a) coil, (b) ferromagnetic sheet and (c) metal wire mesh.
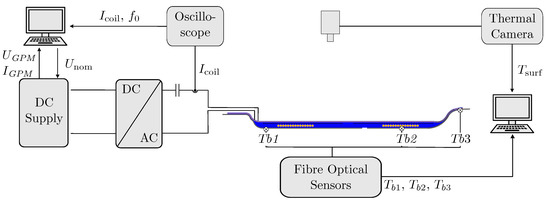
Figure 11.
Experimental setup of the thermal investigation and position of the fibre-optic thermal sensors.
5.2. Module Level
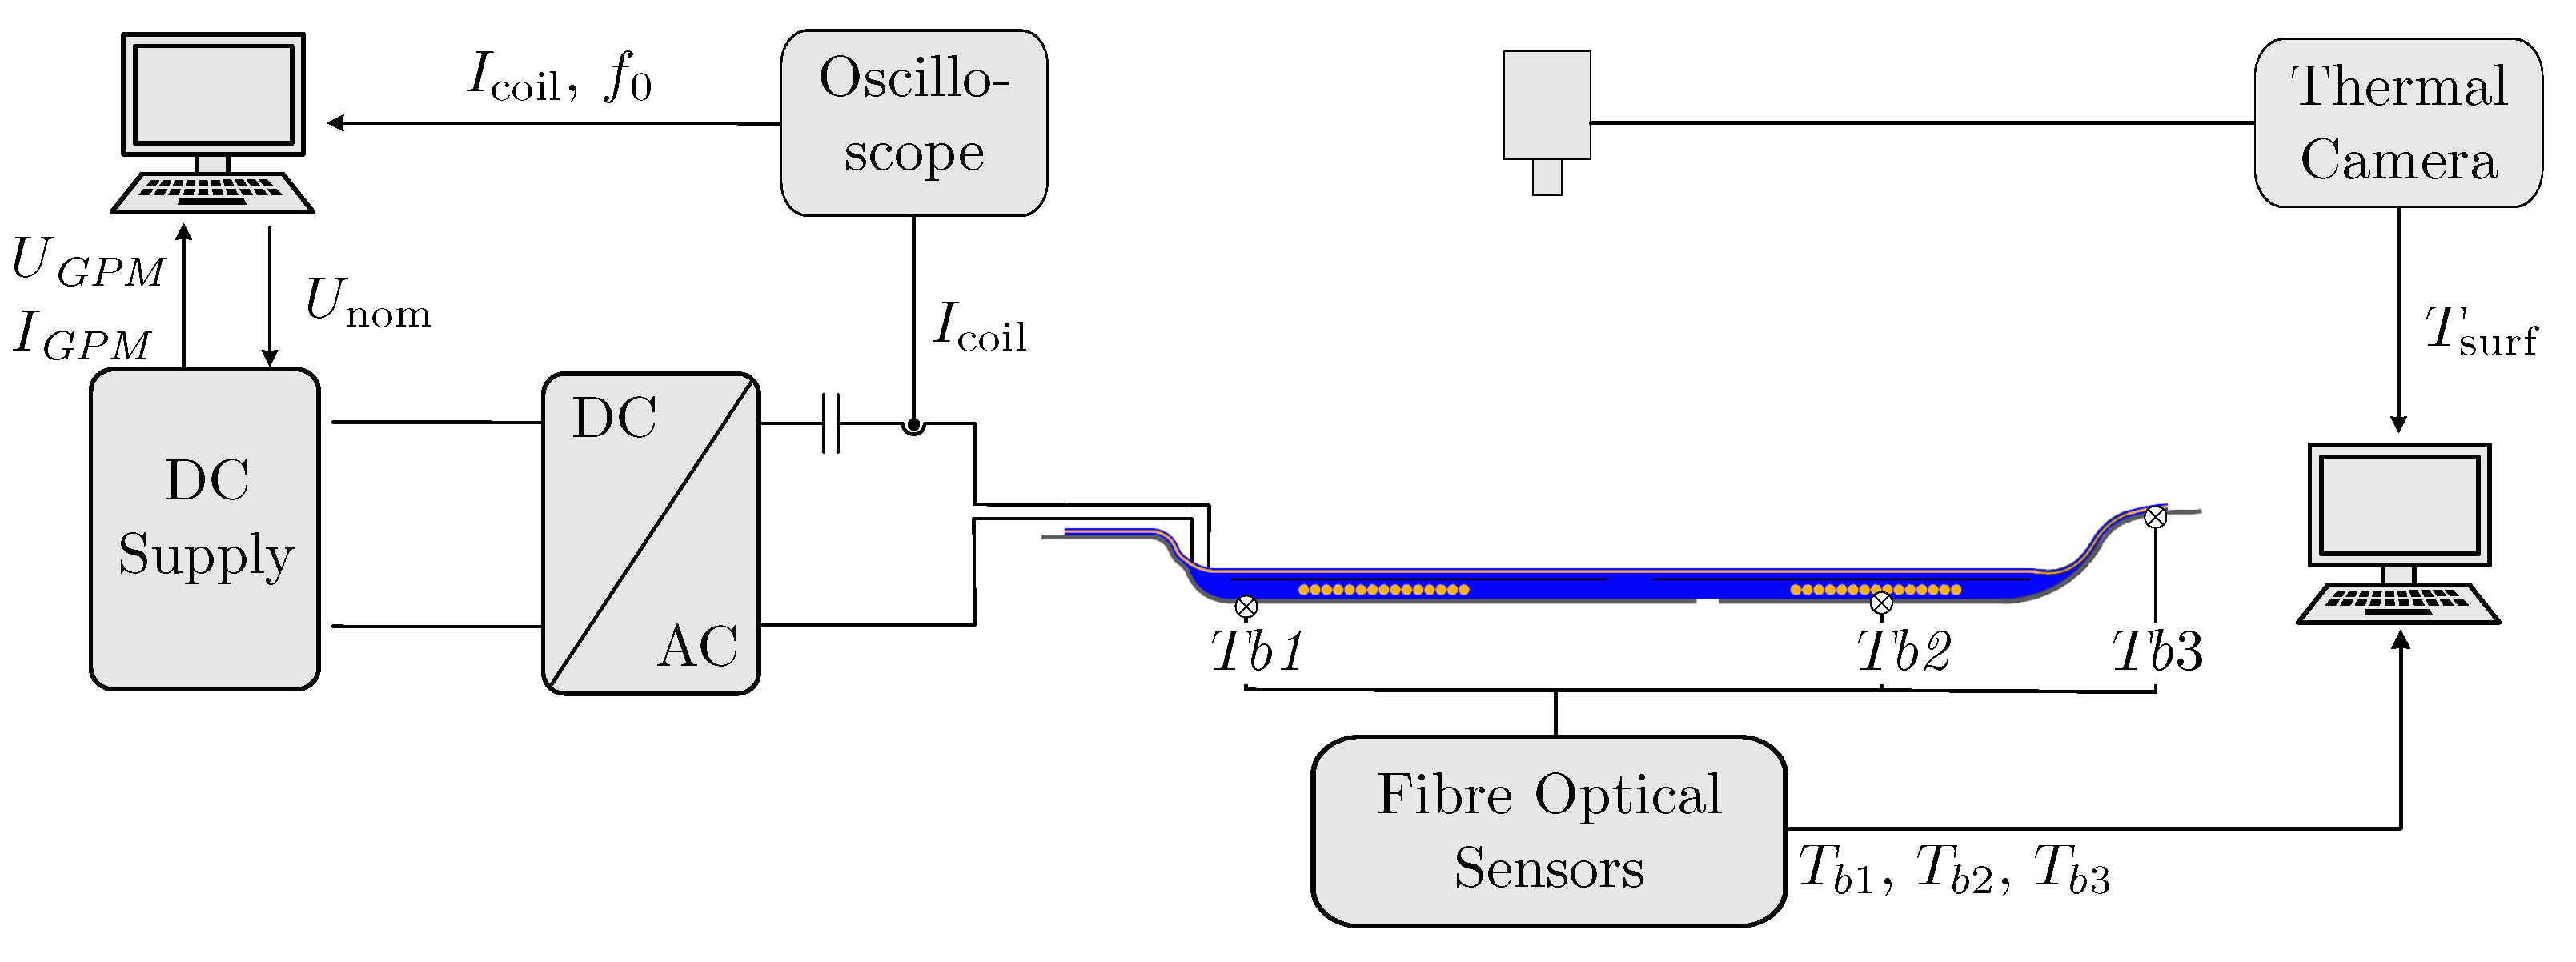
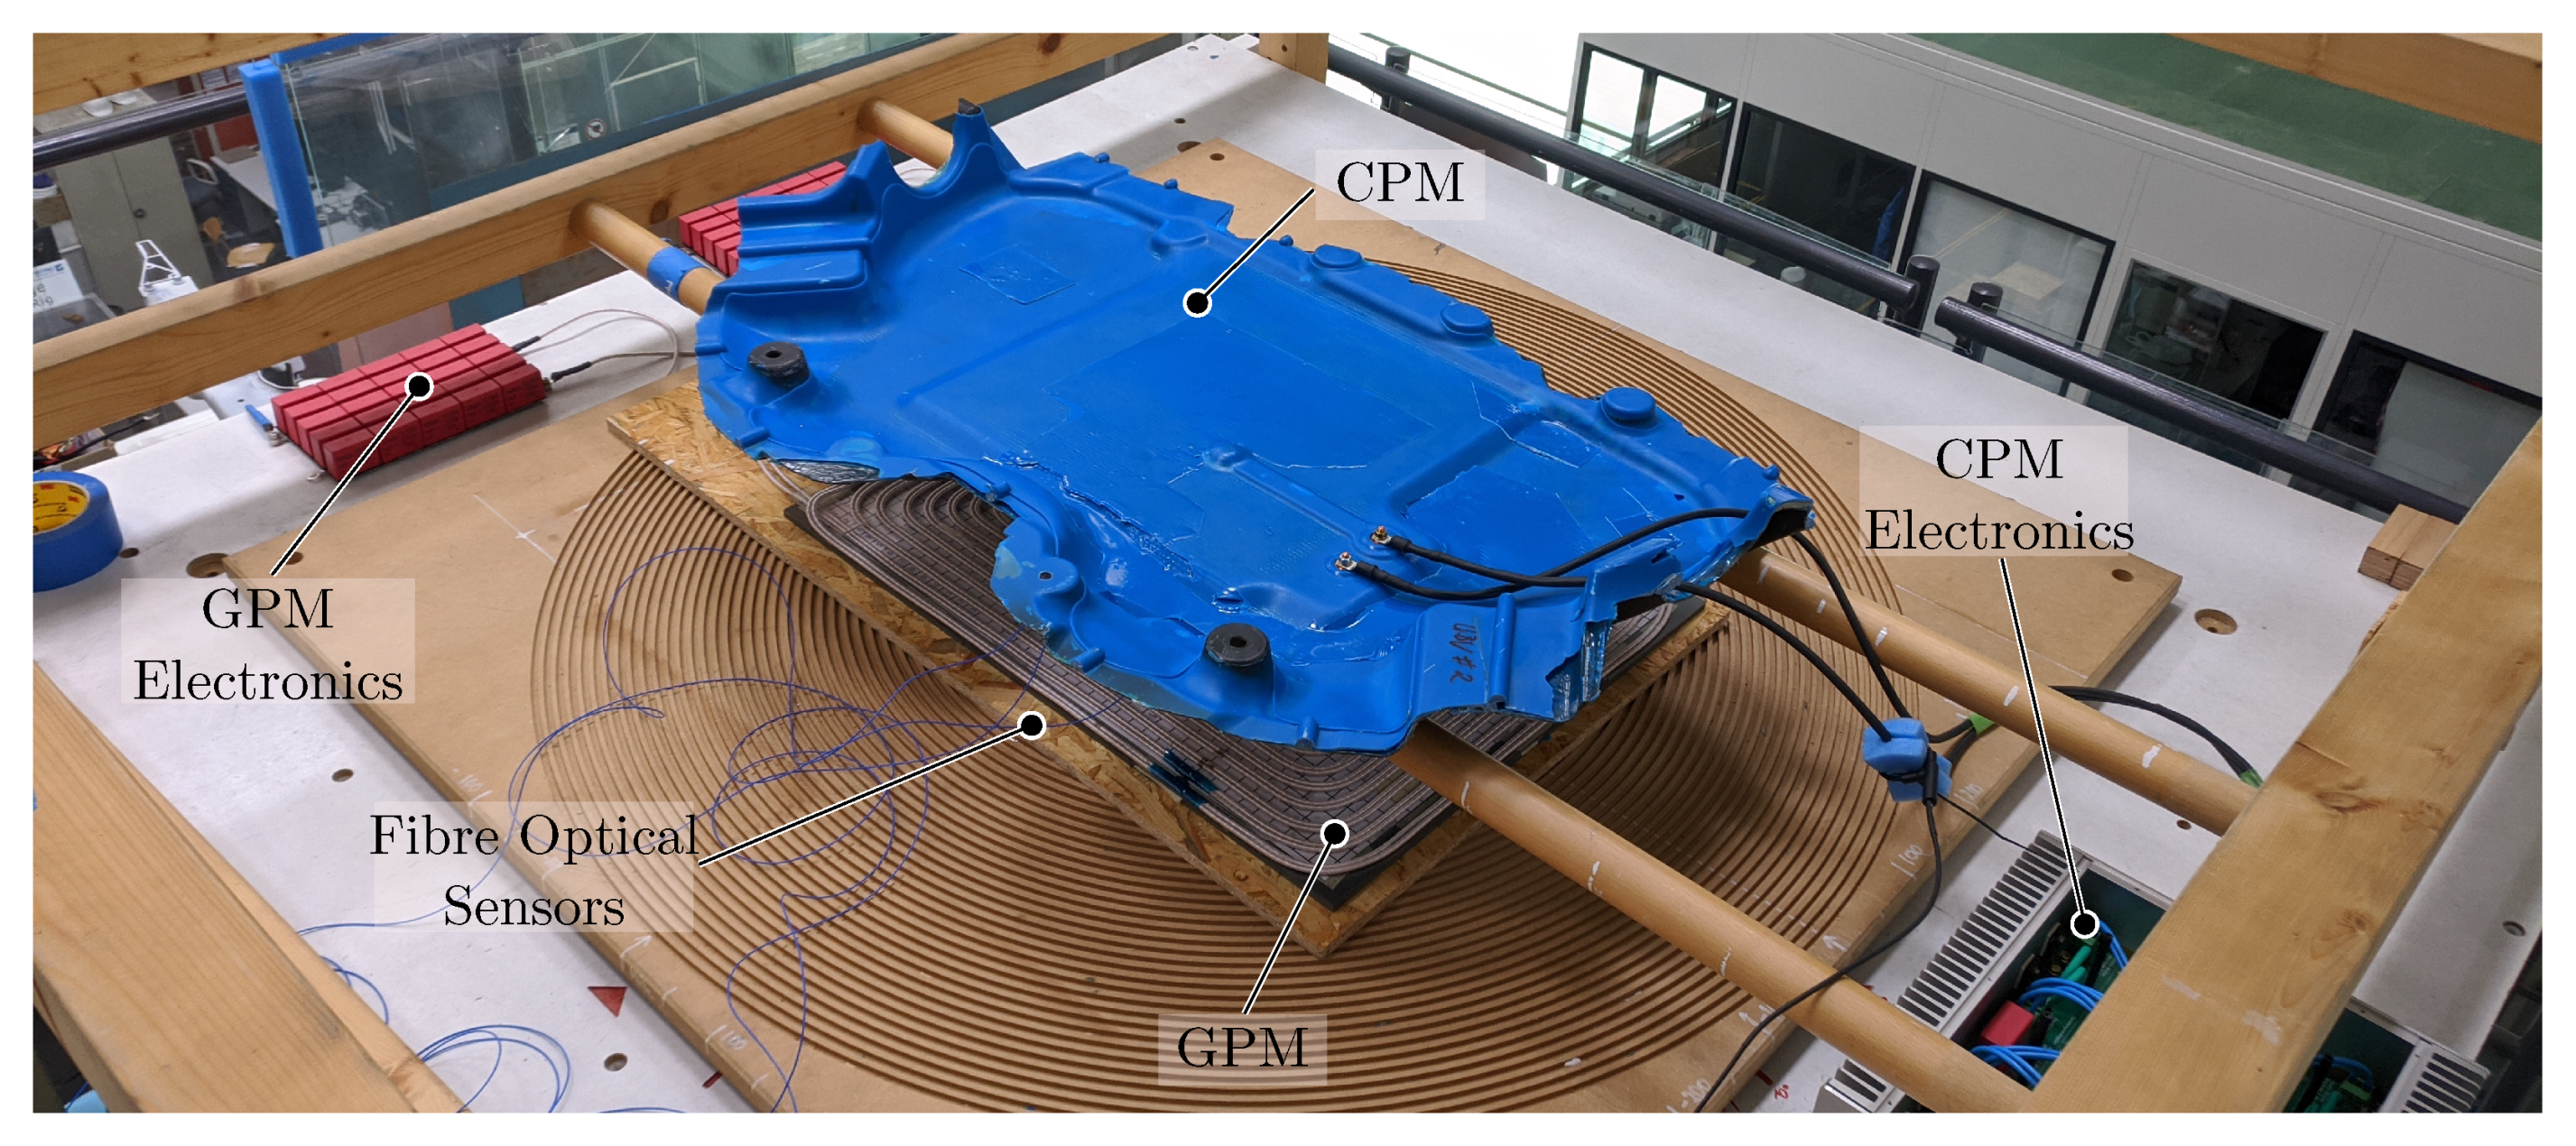
As shown in [10], module testing provides an appropriate substitution test to evaluate the thermal management of various lightweight designs for CPMs. Accordingly, the module testing determined the transient temperature distribution on the top and bottom of the proposed CPM design, taking into account only the CPM. Figure 11 illustrates the experimental setup of the module testing.
The CPM was excited with a harmonic current , which was measured and monitored by a Rogowski coil of type PEM CWTMini HF06B [28]. Fibre-optic thermal sensors [29] were used for the thermal measurement on the bottom side, since their functionality is not affected by magnetic fields. To measure the temperatures as a result of the component-specific power losses, the sensors were positioned at the centre winding of the coil, at the edge of the ferromagnetic sheet and at the edge of the metal wire mesh. Additionally, the thermographic camera measured the surface temperature on the top side of the CPM. Although the system was designed to operate under forced air cooling, in this module-level test, natural convection was used, in order to reduce the complexity of both the experimental setup and the simulation model.
5.3. System Level
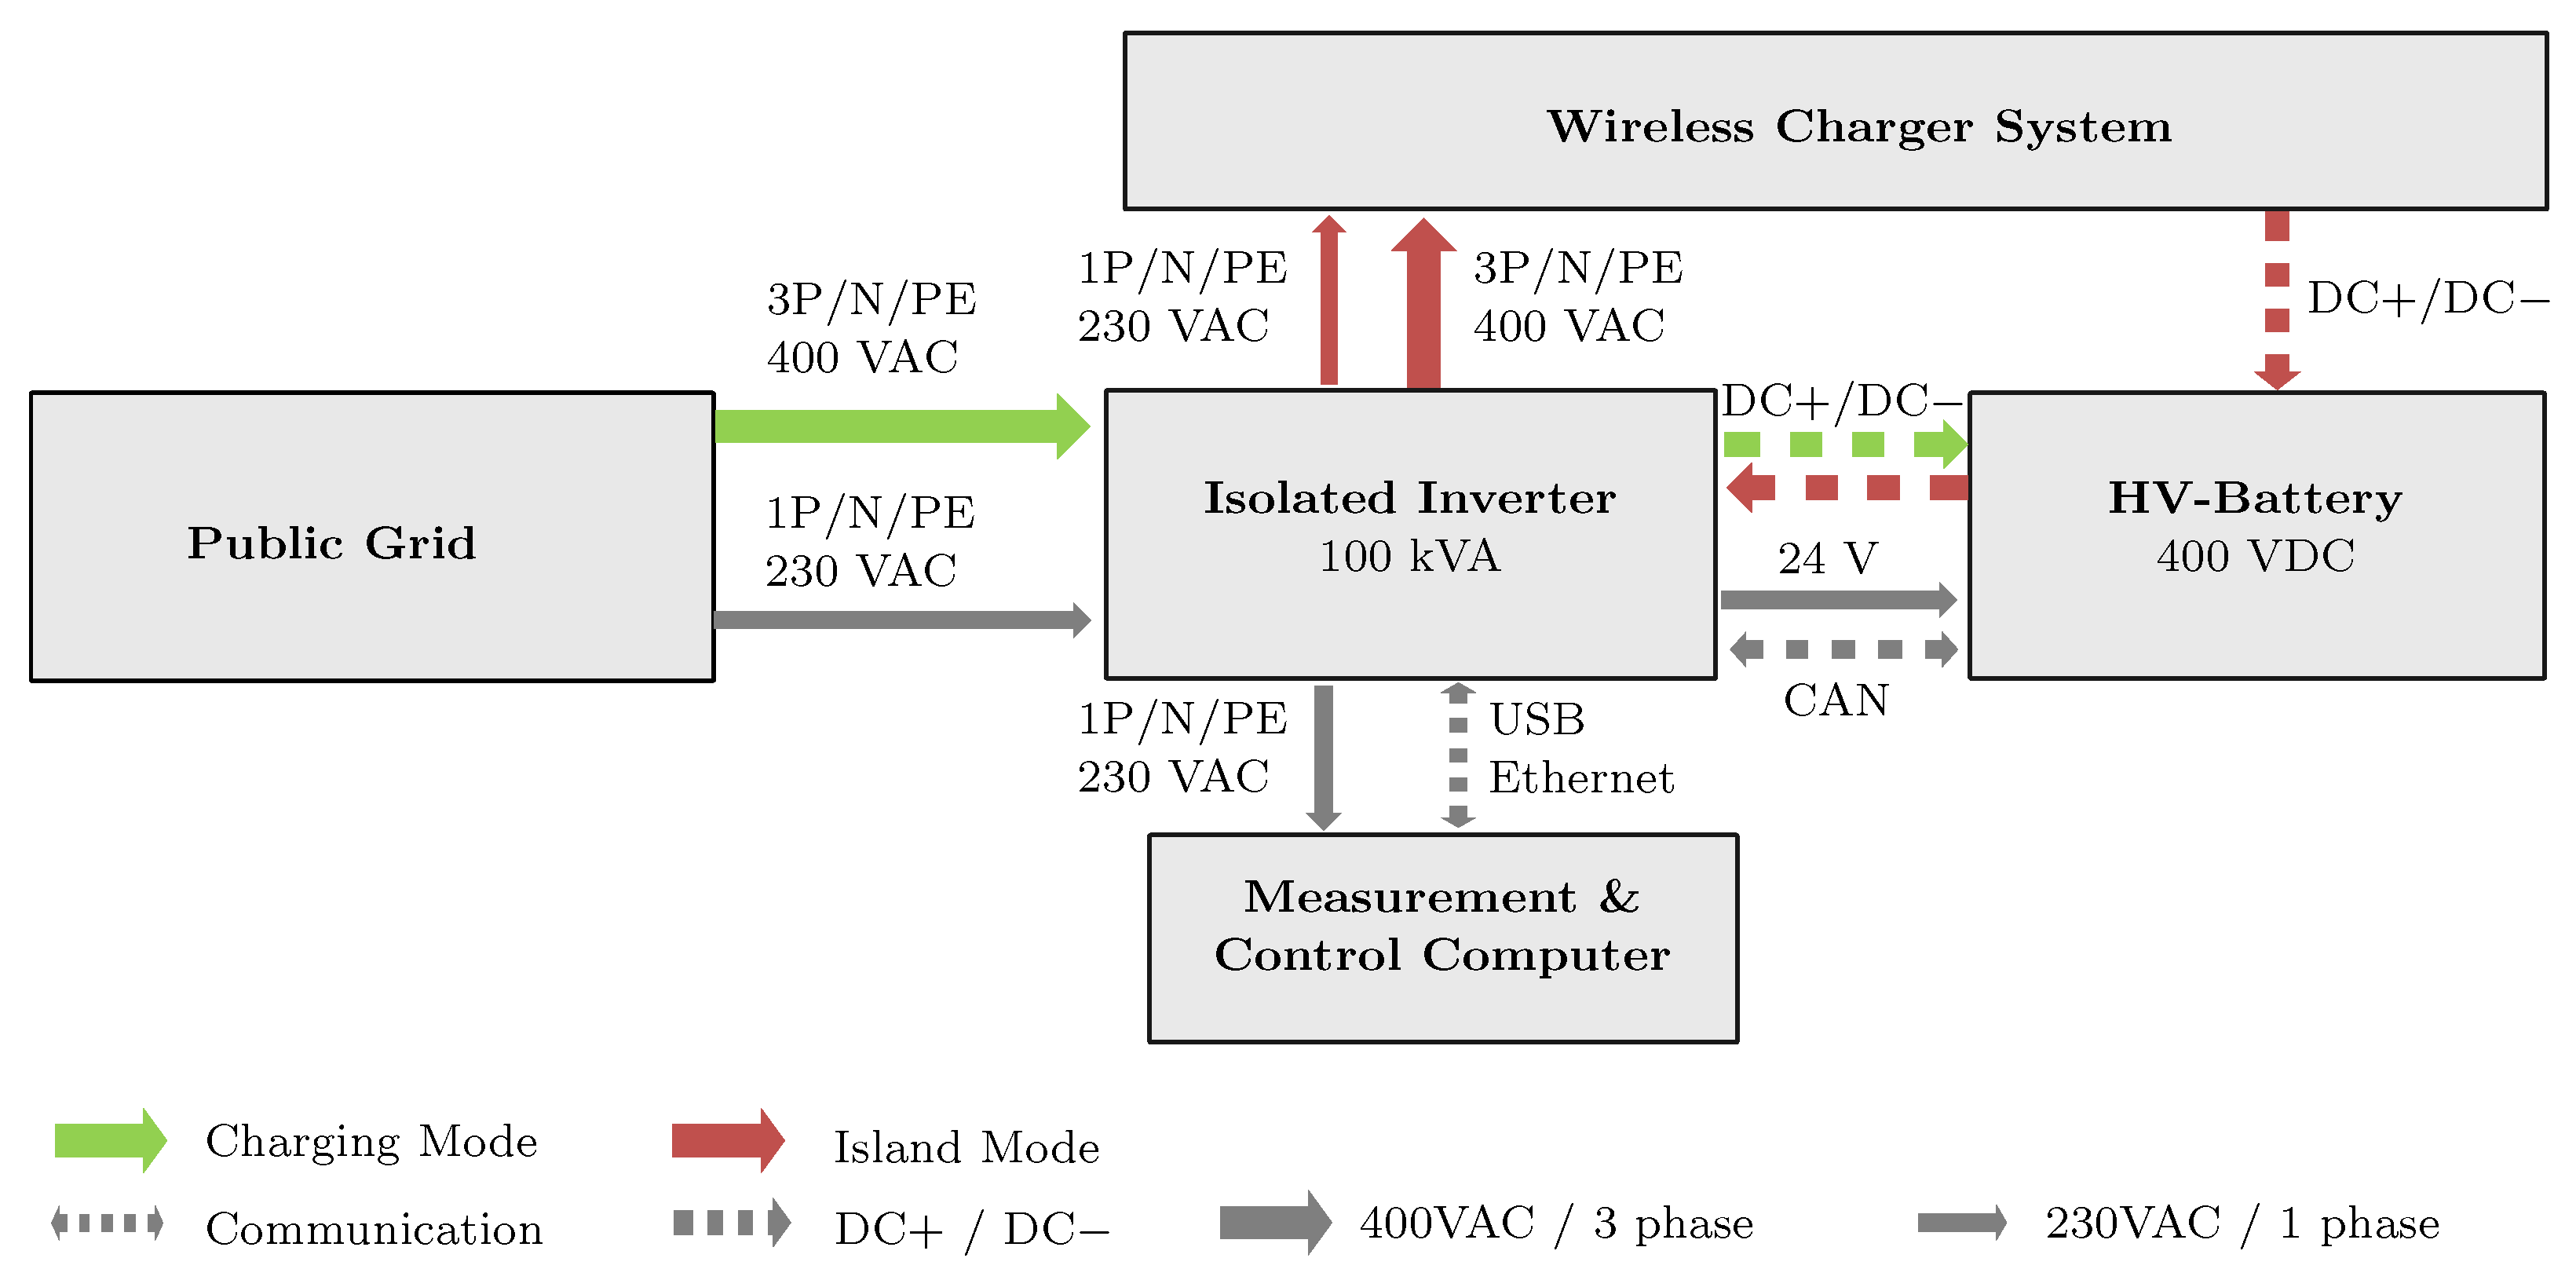
To validate the system simulation model and the module-level testing, the system-level testing determined the interaction of the CPM and GPM. The system was operated as a hardware-in-the-loop, which is shown in Figure 12. To ensure operation and testing under realistic electric conditions as given in automotive applications, an exemplary 400 V battery system was used. The power electronics was supplied by an isolated grid inverter, which provided a 3-phase grid with adjustable output voltage and frequency to enable the emulation of different grid types. The inverter itself was powered by the battery system, which closed the loop. The test bench was controlled via a measurement and control computer. This setup enabled operating either at a constant state of charge (i.e., charging mode) for efficiency tests or performing complete charging cycles (i.e., islanded mode). According to SAE J2954 [19], the CPM was fixed while the GPM was manually adjustable to examine the system behaviour during three-dimensional positioning. Analogous to the module testing, the temperature distributions were measured with the thermographic camera VarioCAM HD head 600 [27] on the top side and fibre-optic sensors [29] on the bottom side. The setup of the system testing is shown in Figure 13. In additional to the experimental investigation of the electromagnetic–thermal behaviour, efficiency measurements were performed “DC-to-DC”, i.e., from the DC link voltage of the power electronics on the transmitting side to the battery voltage on the receiving side. Consequently, the input rectifier or the power factor correction of the primary power electronics was not accounted for. Misalignment and air gap requirements were considered according to SAE J2954 [19].

Figure 12.
Block diagram of the hardware-in-the-loop test bench.
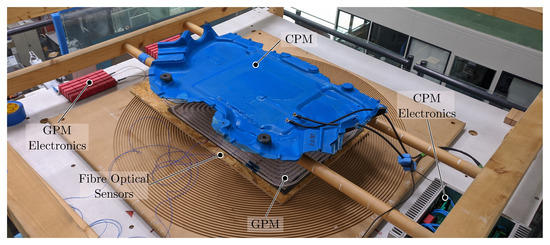
Figure 13.
Photograph of the experimental setup of the system testing.
6. Results and Discussion
In the subsequent sections, the results of the simulations and the experiments performed are presented and compared at the component, module and system level. Finally, the results are summarized and discussed.
6.1. Component Level
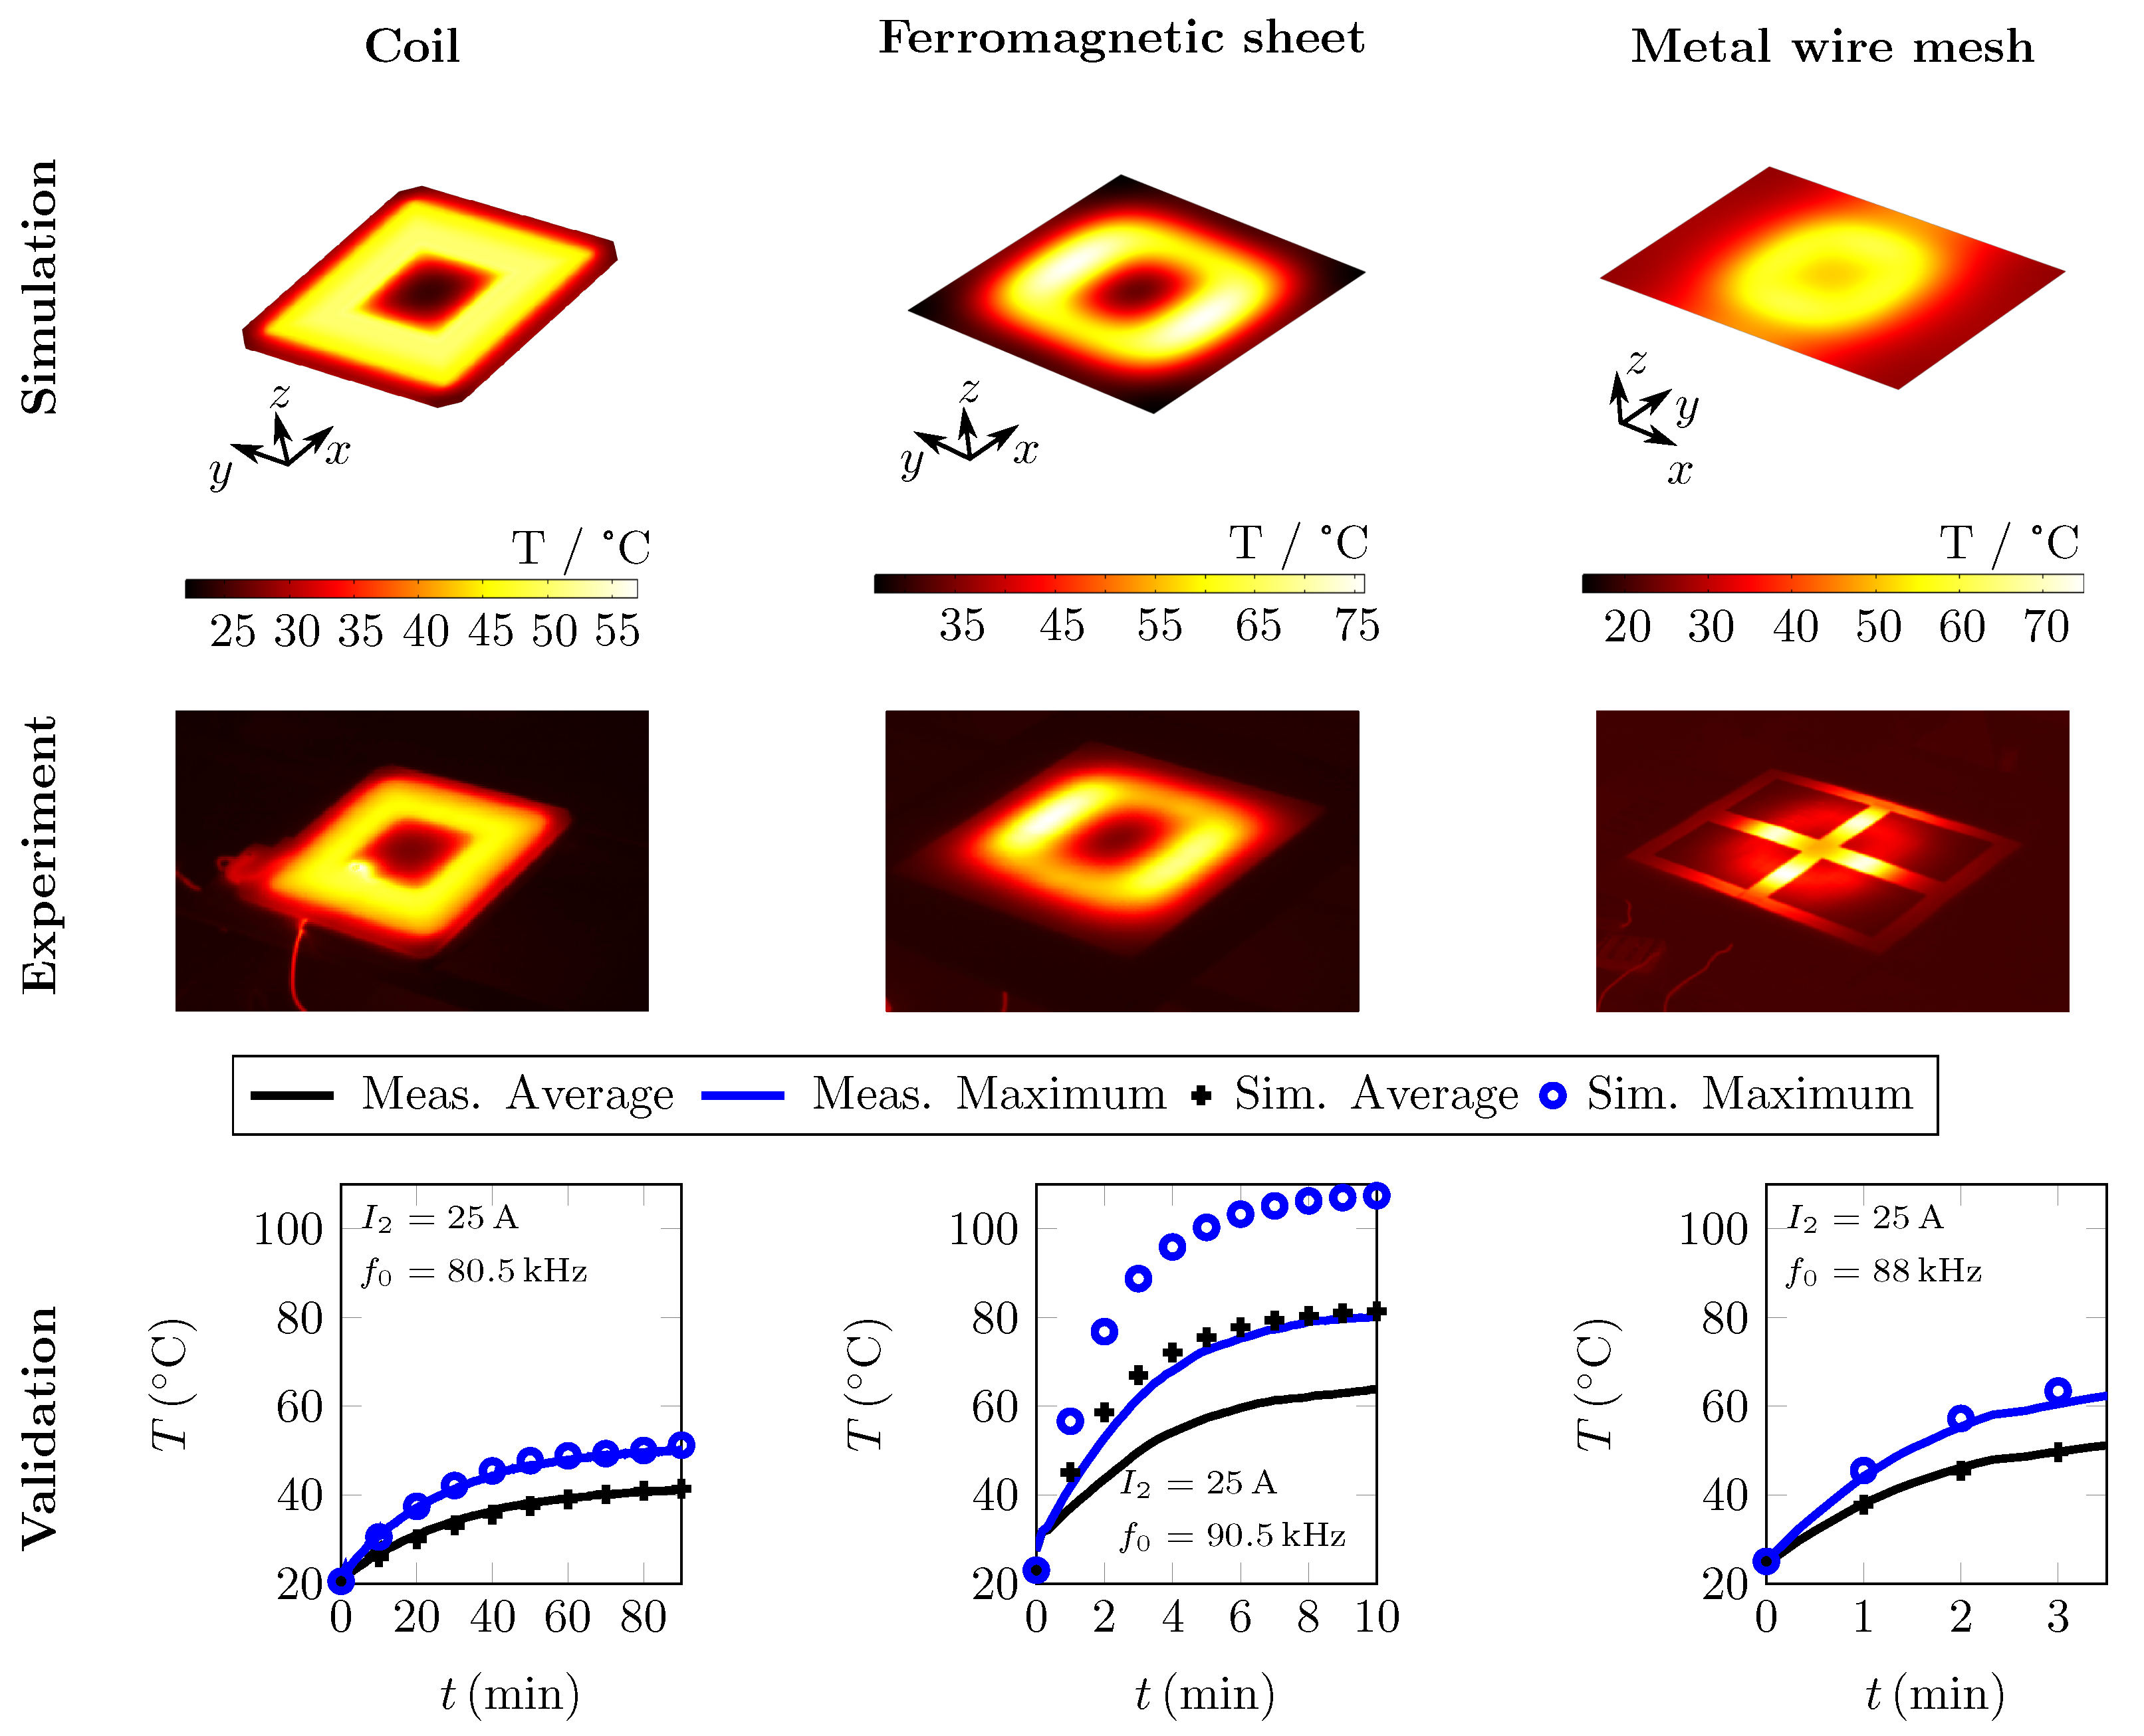
Figure 14 summarizes the results of the component-level validation. Regarding the litz wire model, both the average and maximum transient surface temperature curves of the electromagnetic–thermal simulation matched the infrared measurement very precisely. The well-matched transient behaviour verified the thermal properties of the composite composed of litz wire and epoxy resin. Moreover, the steady-state (i.e., ) temperatures proved the correct modelling of the litz wire loss characteristics, as well as correct heat transfer coefficients. This was also confirmed by power measurements in comparison with the calculated power losses, as shown in Table 4.

Figure 14.
Simulation and experimental validation of the electromagnetic–thermal simulation models at the component level after the maximum operation time.
Table 4.
Calculated and measured loss power at the component level.
The experimental data of the ferromagnetic sheet showed the already mentioned anisotropic in-plane temperature distribution. As datasheet information on this anisotropy was not provided, a compensation parameter was used to approximate the observed behaviour. As shown in the simulation, the effect was captured qualitatively well; however, the transient time behaviour and the steady-state temperatures showed some differences. This might be related to bad measurement conditions resulting in a lower measured temperature compared to the simulation. In parallel, the modelling of the unexpected temperature anisotropy may also add to this observation. Further investigations and consultation with the manufacturer are necessary to mitigate this issue or to provide more accurate material data, respectively. However, the measured and the simulated power losses within the ferromagnetic material showed a good consistency with less than 10% lower losses in the simulation (see Table 4).
Regarding the metal wire mesh, the simulated transient behaviour of the maximum temperature showed very good consistency with the measured infrared data. Furthermore, the observed and simulated heating pattern were consistent. Due to the applied tape (see Section 5.1), a cross-shaped heating pattern emerged in the measured infrared image.
From the experimental and simulation data, it can be concluded that the general validity of the proposed electromagnetic–thermal component-level models was successfully proven.
6.2. Module Level
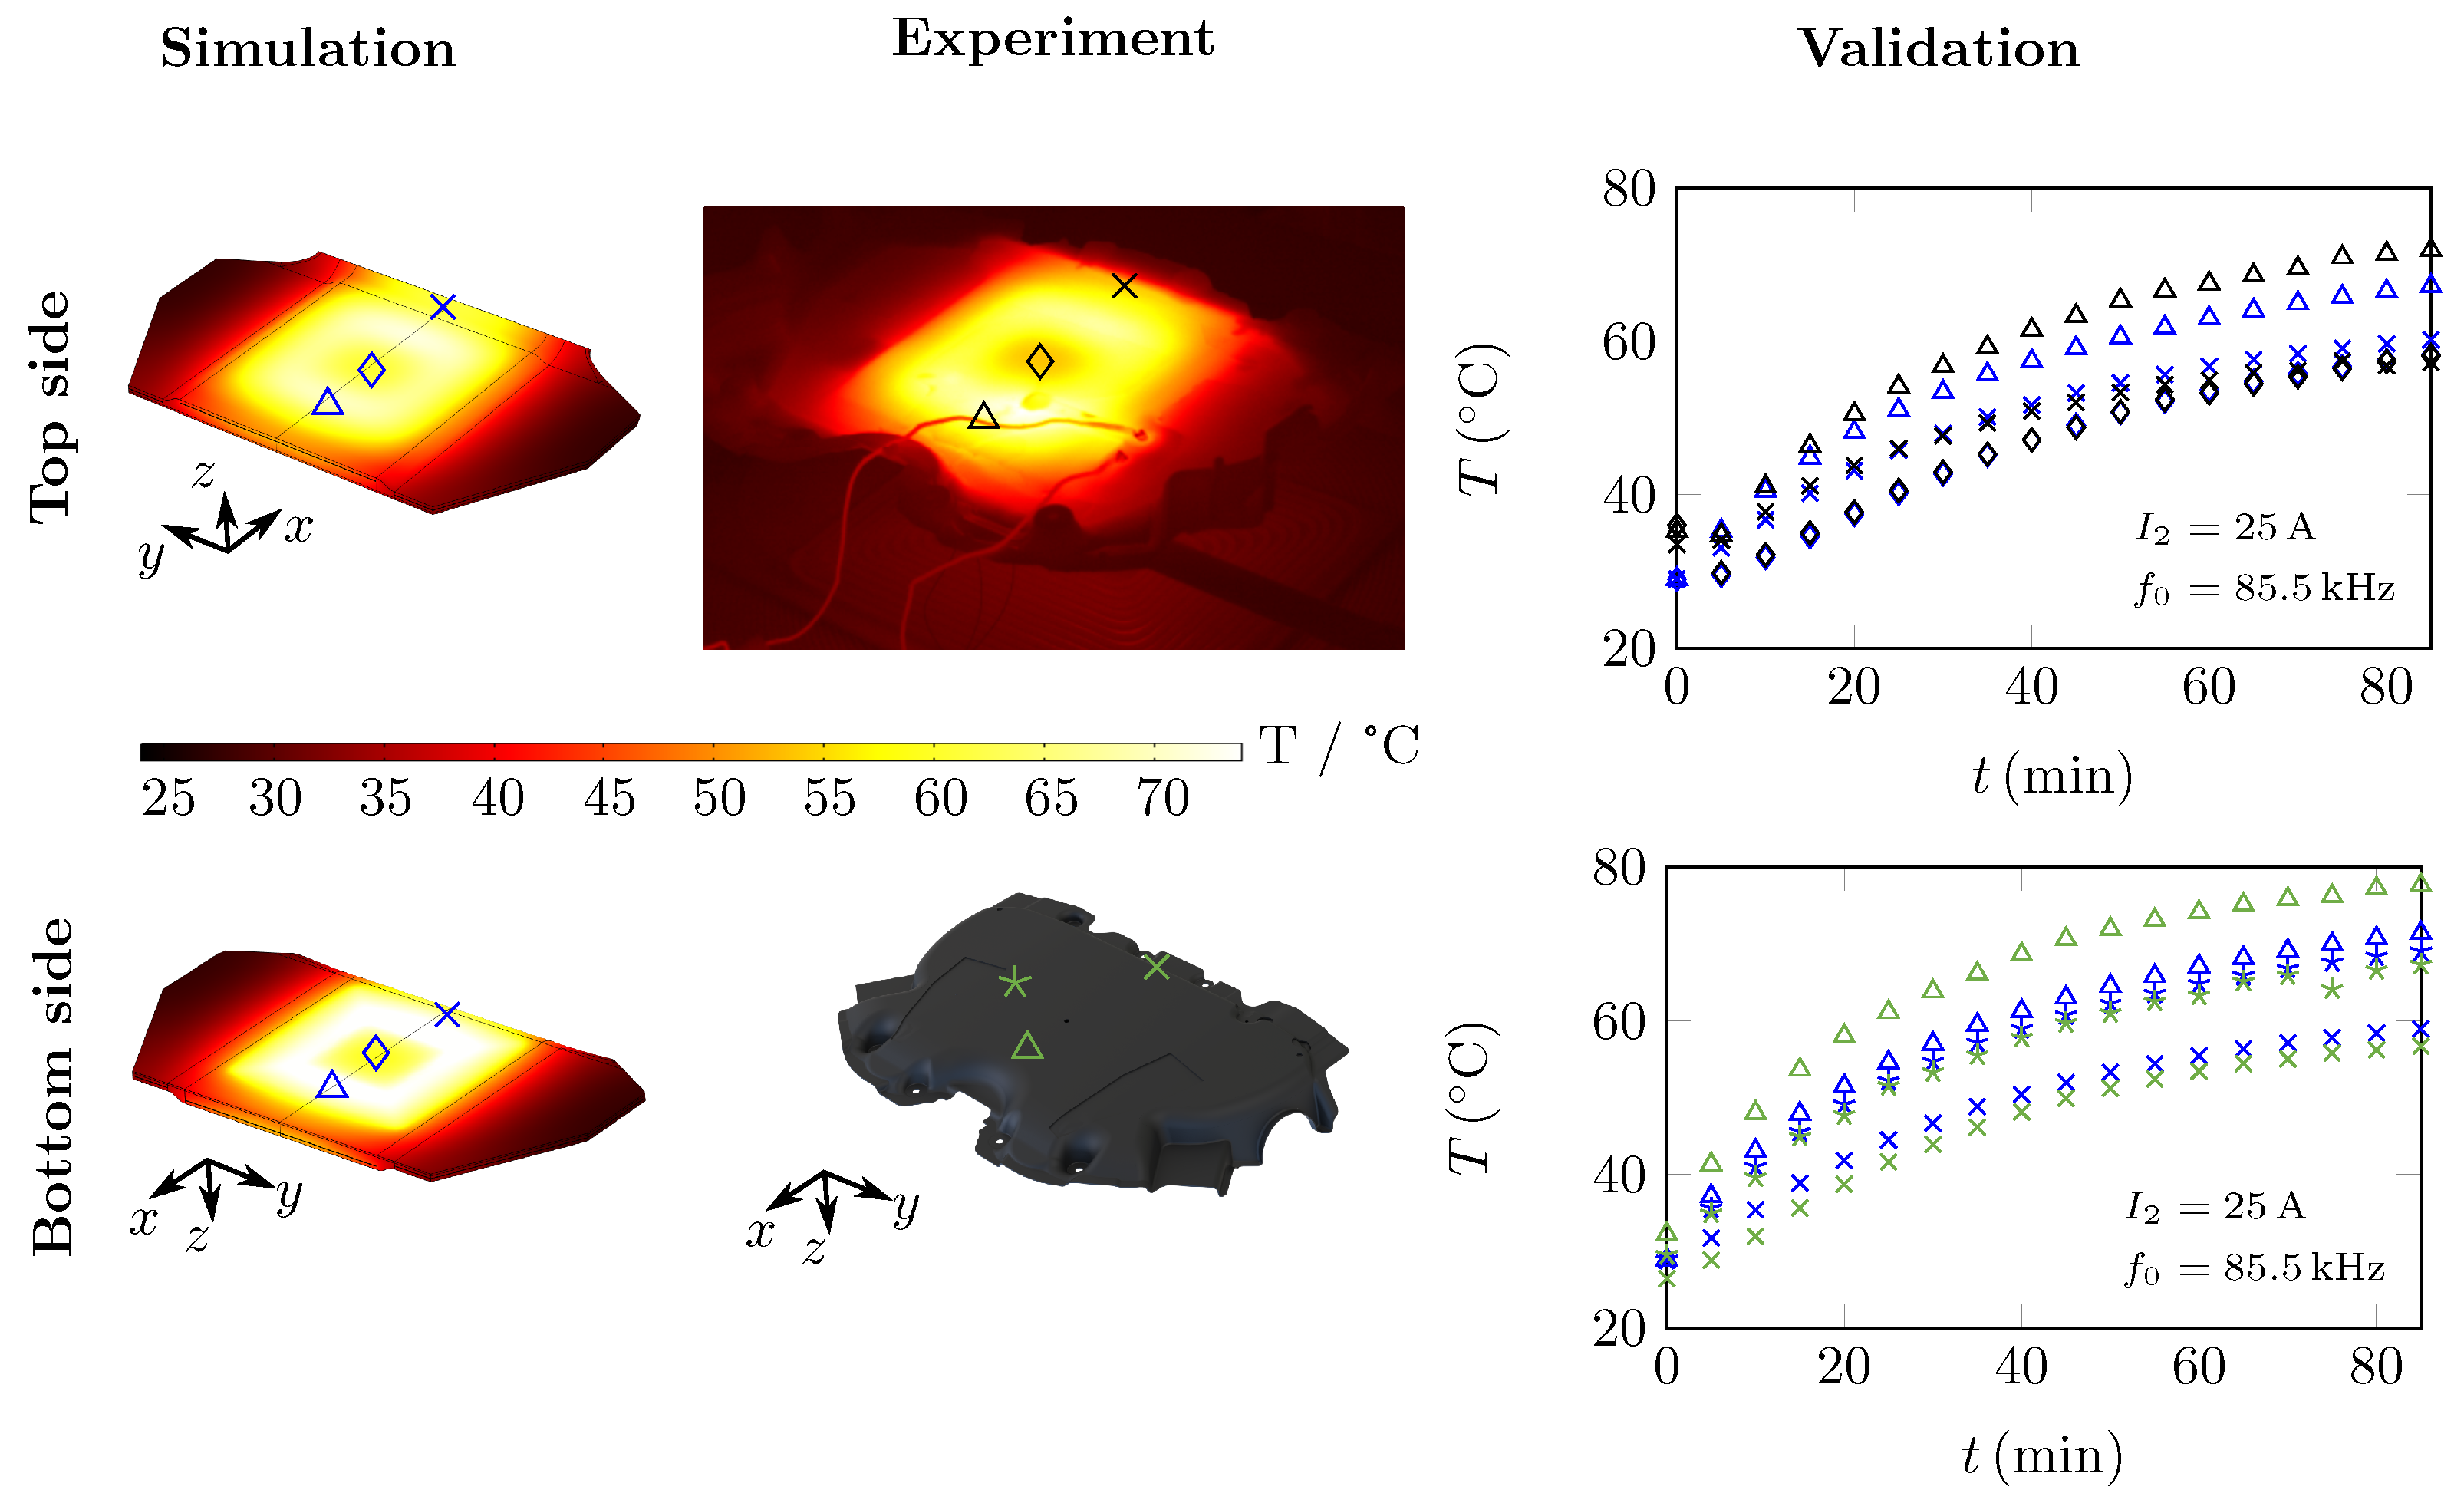
The results of the module-level simulation and measurements are shown in Figure 15. The infrared image and the associated simulation were taken after 90 min of operation. Both temperature distributions on the surface, aside from geometric simplifications in the model, showed a good consistency. Small deviations can be observed at the edges of the component, most notably higher measured temperatures at the rear, marked as (×) and on the left and right side. The transient behaviour, however, both at the measurement points of top and bottom side, was captured accurately in the simulation. At most, the difference between the simulation and measurement was less than 5 over the full 90 min operation time. On the basis of the module-level experiments and simulations performed, it can be concluded that the adoption of the prevalidated models from the component level to the module level was valid and gave accurate predictions.

Figure 15.
Simulation and experimental validation of the electromagnetic–thermal simulation models at the module level in the steady-state after 90 min in operation.
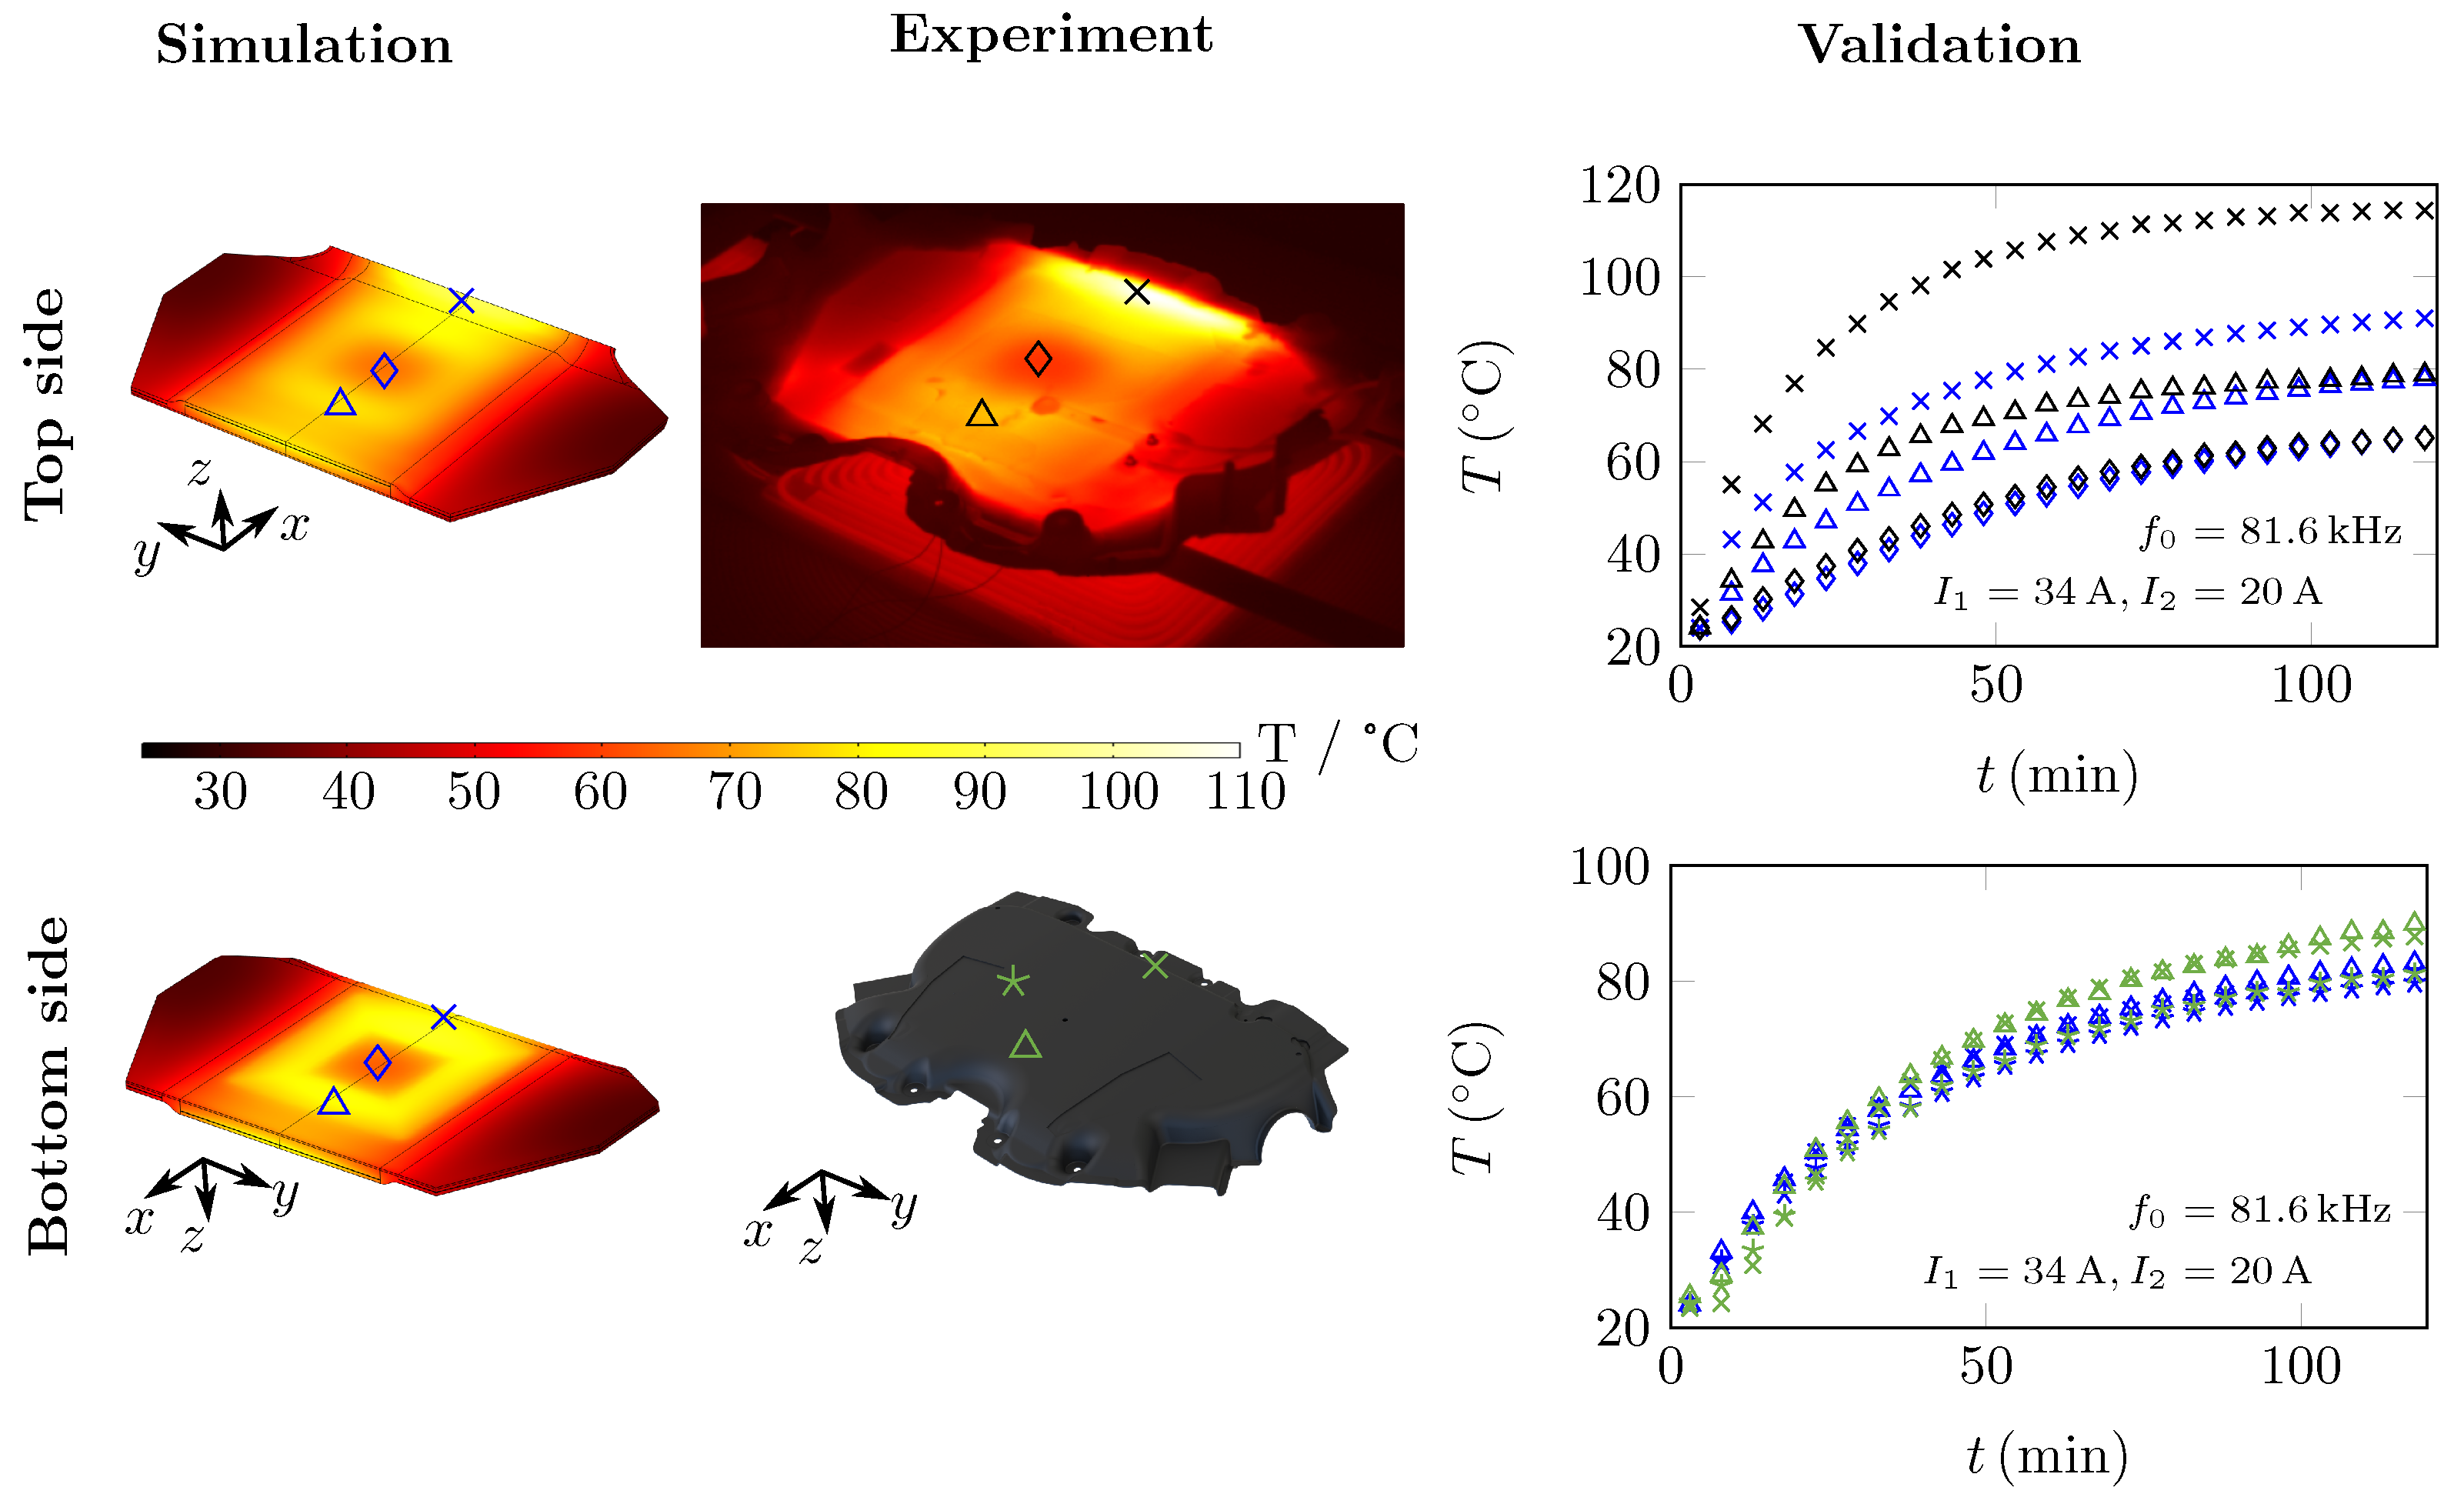
6.3. System Level
The results for the system-level simulation and validation are shown in Figure 16. In order to reach a sufficient steady-state approximation, the CPM was operated in the system for 120 min. As expected, in comparison to the module-level test, the average measured temperature level increased due to the additional magnetic field of the GPM. Again, both the simulation and measurement temperature distributions showed a good consistency with the exception of the rear edge, marked as (×). This hotspot was induced by the high magnetic field densities of the combined magnetic field of the CPM and GPM, which were concentrated locally due to the shielding effect of the copper wire mesh and the field guidance of the ferrite sheet. This effect could be observed in the simulation as well; however, the magnitude could not be reproduced. Since these losses occurred in the shielding, it can be concluded that the proposed copper mesh model is, as a result, not yet readily applicable to the system-level simulation. Thus, further research is required to specifically model the edge effects on metal wire meshes. It is suspected that locally occurring hotspots are strongly dependent on the local geometric details and sensitive to the effective local conductivity. Besides the deviations on the hotspot, the transient and steady temperature behaviour was well predicted by the simulation and consistent with the measurements. In total, after 120 min, the CPM reached a maximum temperature of 80 with a maximum hotspot temperature of 115 on the top side and 90 on the bottom side at a power level of kW.

Figure 16.
Simulation and experimental validation of the electromagnetic–thermal simulation models at the system level in the steady-state after 120 min in operation.
The results of the efficiency measurements are shown in Figure 17. The proposed CPM design achieved its highest efficiency of 92% at transmission distances of and mm. Both efficiency maps are very similar, with slightly decreased efficiency for the lower distance. This might be related to an out-of-tune resonant tank on the primary side, which increased the GPM current and thus losses. For the highest transmission distance of 155 mm, the efficiency dropped to 89% in the centre and to 75% at the maximum offsets, which was related to a very low coupling between the CPM and GPM. The observed efficiency asymmetry regarding the y-axis can be explained with a tilted GPM imitating an inclined parking position (rotation along the x-axis).
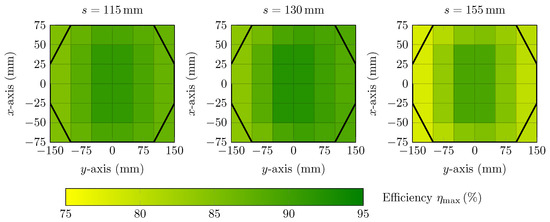
Figure 17.
Results of the efficiency analysis depending onthe air gap s.
In conclusion, despite the local hotspot and its impact on the surrounding region, the system-level simulation was consistent with the measurements, as the remaining top and bottom measurements showed. Thus, the proposed electromagnetic–thermal simulation models allowed an accurate prediction of the transient temperature distribution and the losses within the CPM components under the aforementioned restrictions. This provides the basis for a reliable WPTS design and optimization procedures in the future.
7. Conclusions
This paper presented a systematic investigation of the electromagnetic–thermal behaviour of a novel ultrathin onboard receiver module for vehicular wireless power transfer systems. The studied module was designed as an integral design, in which a receiver coil, a ferromagnetic sheet as a alternative to conventional ferrites and a metal wire mesh as the shielding were spatially and functionally integrated. The module is capable of receiving a power of up to to 7.2 kW at a transmission frequency of with a maximum efficiency of over a distance of to . Special emphasis was given to the validation of a novel two-way electromagnetic–thermal simulation model, which was developed systematically considering the component, module and system level. At each level, the simulation results were consistent with the experimental validation. However, at the component level, the transient time behaviour and the steady-state temperature of the ferromagnetic sheet must be improved quantitatively. However, the module simulation accurately reproduced the electromagnetic–thermal behaviour. At the system level, the simulation and measurement temperature distribution showed a good qualitative and quantitative consistency. Thus, the proposed two-way electromagnetic–thermal simulation model provided a significant contribution to a more sophisticated dimensioning of receiver modules, especially in regard to their integration in vehicle structures. However, future work is required to improve the quantitative prediction of local hotspots in the peripheral area of metal wire mesh.
Author Contributions
The authors contributed to this work by collaboration. Conceptualization, S.Z., M.H. and P.L.; software, M.H.; validation, S.Z., M.H. and P.L.; investigation A.W.; writing—review and editing, A.W.; supervision, N.M. All authors read and agreed to the published version of the manuscript.
Funding
This research received no external funding.
Institutional Review Board Statement
Not applicable.
Informed Consent Statement
Not applicable.
Conflicts of Interest
The authors declare no conflict of interest.
Abbreviations
The following abbreviations are used in this manuscript:
| AC | Alternating current |
| CPM | Car Pad Module |
| DC | Direct current |
| EVs | Electric vehicles |
| GPM | Ground Pad Module |
| HF | High frequency |
| HiL | Hardware-in-the-Loop |
| HV | High voltage |
| MOSFET | Metal–oxide–semiconductor field-effect transistor |
| PET | Polyethylene terephthalate |
| PFC | Power factor correction |
| RMS | Root mean square |
| WPTS | Wireless power transfer system |
References
- Fett, D.; Ensslen, A.; Jochem, P.; Fichtner, W. A Survey on User Acceptance of Wireless Electric Vehicle Charging. World Electr. Veh. J. 2018, 9, 36. [Google Scholar] [CrossRef] [Green Version]
- Khutwad, S.R.; Gaur, S. Wireless charging system for electric vehicle. In Proceedings of the 2016 International Conference on Signal Processing, Communication, Power and Embedded System (SCOPES), Paralakhemundi, India, 3–5 October 2016; pp. 441–445. [Google Scholar] [CrossRef]
- Zimmer, S.; Rothenberg, S.; Tattko, B.; Baumer, T.; Baier, K.; Glöggler, C.; Anja, W.; Niels, M. Vehicle Integration of wireless power transfer systems: An experimental safety investigation of underfloor impact scenarios. In Proceedings of the 31th International Electric Vehicle Symposium & Exhibition (EVS31), Kobe, Japan, 1–3 October 2018. [Google Scholar]
- Barth, H.; Jung, M.; Braun, M.; Schmuelling, B.; Reker, U. Concept Evaluation of an Inductive Charging System for Electric Vehicles. In Smart Grids and E-Mobility; Stoa, P., Günther, E., Eds.; Ostbayerisches Technologie-Transfer-Institut (OTTI): Regensburg, Germany, 2011. [Google Scholar]
- Onar, O.C.; Campbell, S.L.; Seiber, L.E.; White, C.P.; Chinthavali, M. Vehicular integration of wireless power transfer systems and hardware interoperability case studies. IEEE Trans. Ind. Appl. 2019, 55, 5223–5234. [Google Scholar] [CrossRef]
- Zimmer, S.; Lucas, P.; Helwig, M.; Winkler, A.; Modler, N. Systematic engineering of functionally integrated wireless power transfer systems for electric vehicles. Procedia Manuf. 2020, 52, 241–249. [Google Scholar] [CrossRef]
- Bosshard, R.; Kolar, J.W. Multi-Objective Optimization of 50 kW/85 kHz IPT System for Public Transport. IEEE J. Emerg. Sel. Top. Power Electron. 2016, 4, 1370–1382. [Google Scholar] [CrossRef]
- Moghaddami, M.; Sarwat, A. Time-Dependent Multi-Physics Analysis of Inductive Power Transfer Systems. In Proceedings of the 2018 IEEE Transportation Electrification Conference and Expo (ITEC), Long Beach, CA, USA, 13–15 June 2018; pp. 130–134. [Google Scholar] [CrossRef]
- Zhu, C.; Fu, C.; Wang, D.; Huang, X.; Zhang, H.; Dong, S.; Wei, G.; Song, K. Thermal Simulation and Optimization Study for Magnetic Coupler of Static Electric Vehicle Wireless Power Transfer Systems. In Proceedings of the 2019 22nd International Conference on Electrical Machines and Systems (ICEMS), Harbin, China, 11–14 August 2019; pp. 1–4. [Google Scholar] [CrossRef]
- Zimmer, S.; Helwig, M.; Lucas, P.; Winkler, A.; Modler, N. Investigation of Thermal Effects in Different Lightweight Constructions for Vehicular Wireless Power Transfer Modules. World Electr. Veh. J. 2020, 11, 67. [Google Scholar] [CrossRef]
- Dolara, A.; Leva, S.; Longo, M.; Castelli-Dezza, F.; Mauri, M. Coil design and magnetic shielding of a resonant wireless power transfer system for electric vehicle battery charging. In Proceedings of the 2017 IEEE 6th International Conference on Renewable Energy Research and Applications (ICRERA), San Diego, CA, USA, 5–8 November 2017; pp. 200–205. [Google Scholar] [CrossRef]
- Alsayegh, M.; Saifo, M.; Clemens, M.; Schmuelling, B. Magnetic and Thermal Coupled Field Analysis of Wireless Charging Systems for Electric Vehicles. IEEE Trans. Magn. 2019, 55, 1–4. [Google Scholar] [CrossRef]
- Biela, J. Wirbelstromverluste in Wicklungen Induktiver Bauelemente; Skriptum, ETH Zürich: Zürich, Switzerland, 2012. [Google Scholar]
- Liang, C.; Yang, G.; Yuan, F.; Huang, X.; Sun, Y.; Li, J.; Song, K. Modeling and Analysis of Thermal Characteristics of Magnetic Coupler for Wireless Electric Vehicle Charging System. IEEE Access 2020, 8, 173177–173185. [Google Scholar] [CrossRef]
- Bosshard, R.; Kolar, J.W.; Muhlethaler, J.; Stevanovic, I.; Wunsch, B.; Canales, F. Modeling and h-a-Pareto Optimization of Inductive Power Transfer Coils for Electric Vehicles. IEEE J. Emerg. Sel. Top. Power Electron. 2015, 3, 50–64. [Google Scholar] [CrossRef]
- Bosshard, R. Multi-Objective Optimization of Inductive Power Transfer Systems for EV Charging. Ph.D. Thesis, ETH Zürich, Zürich, Switzerland, 2015. [Google Scholar] [CrossRef]
- Kim, S.; Amirpour, M.; Covic, G.; Bickerton, S. Thermal Characterisation of a Double-D Pad. In Proceedings of the 2019 IEEE PELS Workshop on Emerging Technologies: Wireless Power Transfer (WoW), London, UK, 18–21 June 2019; pp. 1–5. [Google Scholar] [CrossRef]
- Niu, S.; Yu, H.; Jian, L. Thermal Behavior Analysis of Wireless Electric Vehicle Charging System under Various Misalignment Conditions. In Proceedings of the 2020 IEEE 4th Conference on Energy Internet and Energy System Integration (EI2), Wuhan, China, 30 October–1 November 2020; pp. 607–612. [Google Scholar] [CrossRef]
- Society of Automotive Engineers. (R) Wireless Power Transfer for Light-Duty Plug-In/Electric Vehicles and Alignment Methodology; SAE International: Warrendale, PA, USA, 2019. [Google Scholar]
- Hameed, Z.; Oien-Rochat, M.; Bruzzone, C.; Cummings, I.; Keeney, J.; Benson, M. Thin, Light & Flexible Magnetic Materials for 7.7 kW Wireless Power Transfer System. In Proceedings of the 2019 IEEE Wireless Power Transfer Conference (WPTC), London, UK, 18–21 June 2019; pp. 612–615. [Google Scholar] [CrossRef]
- Ferroxcube. Soft Ferrites: Ferrite Material Survey; Ferroxcube: Hong Kong, China, 2020; Available online: https://ferroxcube.home.pl/prod/assets/sfmatgra_frnt.pdf (accessed on 1 August 2021).
- Huntsman Advanced Materials GmbH. Data Sheet: Advanced Materials—Araldite CW 2243-2 L/Aradur HY 2966; Huntsman Advanced Materials GmbH: The Woodlands, TX, USA, 2012. [Google Scholar]
- Ashby, M.F. Composite Materials, Microstructural Design of. In Encyclopedia of Materials: Science and Technology; Elsevier: Amsterdam, Netherlands, 2001; pp. 1357–1361. [Google Scholar] [CrossRef]
- Cu-ETP. Deutsches Kupferinstitut: Düsseldorf, Germany, 2020. Available online: http://te-x-te.de/images/DA_DKI.pdf (accessed on 1 August 2021).
- Kern GmbH. Polyamid 6 (PA 6); Kern GmbH: Grossmaischeid, Germany, 2020. [Google Scholar]
- Paoli, G.; Biro, O.; Buchgraber, G. Complex representation in nonlinear time harmonic eddy current problems. IEEE Trans. Magn. 1998, 34, 2625–2628. [Google Scholar] [CrossRef]
- InfraTec GmbH. VarioCAM’HD Head: Infrarot-Thermografiesystem für den Industrie– und Laboreinsatz; InfraTec GmbH: Dresden, Germany, 2020. [Google Scholar]
- Cosinus Messtechnik GmbH. Data Sheet: CWT Mini; Cosinus Messtechnik GmbH: Taufkirchen, Germany, 2020. [Google Scholar]
- Weidmann Technologies Deutschland GmbH. TS2: Fiber Optic Temperature Sensor; Weidmann Technologies Deutschland GmbH: Dresden, Germany, 2020. [Google Scholar]


Publisher’s Note: MDPI stays neutral with regard to jurisdictional claims in published maps and institutional affiliations. |
© 2021 by the authors. Licensee MDPI, Basel, Switzerland. This article is an open access article distributed under the terms and conditions of the Creative Commons Attribution (CC BY) license (https://creativecommons.org/licenses/by/4.0/).