Abstract
Masonry buildings built in Italy in the 60 s and 70 s of the last century frequently require energy and seismic renovation. To this end, the use of a retrofitting technique based on a multilayer coating may be applied on the building façades in order to improve its seismic and energy performances, leading to the partial or total fulfilment of structural and energy code provisions. The coating consists of a layer of Steel Fiber Reinforced Mortar combined with thermal insulation materials to get a composite package applied on the building façade. After a brief description of the proposed technique, the paper reports the results of seismic and thermal analyses carried out to prove the structural and energy performance of the retrofitting intervention.
1. Introduction
According to recent statistics [1], at least 30% of the current European building stock consists of buildings that are more than 50 years old. Residential buildings made with unreinforced masonry represent one of the most widespread construction typologies. Moreover, about 50% of the masonry structures built during the period 1961–1990 are located in the seismic prone areas of Southern Europe, which include, among the others, Italy, the Balkan Peninsula and Greece. Existing buildings have low energy performances that do not comply with some recent requirements, such as the Italian Ministerial Decree (DM) on 26 June 2015 [2]. The latter implements the European directive 2010/31/EU on the energy performance of buildings [3]. It is estimated that existing buildings are responsible for 36% of energy-related CO2 emissions and that 40% of the primary energy consumption results from the building sector [4]. Besides the poor energy performance, existing buildings are frequently affected by a high seismic vulnerability due to the lack of seismic design codes at the time of their construction. Thus, upgrading existing masonry buildings has become an important target in order to reduce the potential economic losses and the human casualties resulting from seismic events.
When an earthquake hits a masonry structure, different failure mechanisms may occur, depending on the material and structural characteristics of the building. Out-of-plane collapses are the most frequent mechanisms in structures where there is not enough continuity between orthogonal bearing walls and floors are not adequately anchored to them. Therefore, any retrofitting or repairing intervention must firstly aim at eliminating all the vulnerabilities related to possible out-of-plane modes able to cause the failure of both façades and floor structures. In addition, buildings may experience in-plane failure modes due to the not sufficient shear resistance of masonry members. By focusing on in-plane mechanisms, different retrofitting strategies have been proposed over the last decades to improve the seismic behavior of masonry structures. Among other techniques such as FRP, textile, post-tensioning, etc., whose main features are well described and discussed elsewhere [5,6], the in-plane capacity and ductility of the walls can be improved by applying concrete or mortar coating on either one or both sides of masonry. Different research studies showed that a significant increase of the axial and lateral capacity could be obtained by spraying a cement-based mixture onto the surface of masonry in order to get an overlay with a thickness of about 40–50 mm. To control cracking, minimum reinforcement is provided to each shotcrete layer [7] by fixing a small diameter steel welded mesh on the wall surface. As an alternative to shotcreting, the masonry surface can be coated by a high-strength cement mortar layer reinforced with multiple layers of steel meshes. This technique, which is usually known as ferrocement, provides an improvement of the inelastic response of masonry that is strongly dependent on the mechanical and geometrical properties of the reinforcing mesh embedded in the mortar layer. An alternative coating-based technology developed in the last few years consists of applying a 20–50 mm thick layer of mortar reinforced with steel fibers randomly spread within the mortar matrix. The use of Steel Fiber Reinforced Mortar (SFRM) coating allows increasing the initial lateral stiffness and capacity of masonry walls [8]. Moreover, if relatively high (e.g., fiber volume fraction = 0.4%–0.6%) contents of steel fibers are used, the high tensile post-cracking strength and ductility of SFRM leads to a stable response of the retrofitted structure in the post-peak stage [8].
Energy improvement of masonry buildings can be partly attained by acting on the building envelope with the aim of increasing its thermal insulation. For this purpose, different kinds of insulation materials and technologies can be applied onto the masonry façades. In particular, the existing windows and doors can be replaced with more efficient ones. Thermal coatings are frequently used to enhance the energy performance of vertical walls. They consist of an insulating layer, which is preferably applied to the outer surface of the wall; this solution is more efficient than internal insulation because it leads to significantly lower thermal bridges and it preserves the existing thermal mass, thus optimizing the thermal inertia, which is a relevant issue in temperate climates.
In 2018, the European directive 2018/844/EU [9] was published, which amends the 2010/31/EU Directive on the energy performance of buildings and the 2012/27/EU Directive on energy efficiency [10]. Its aim is to speed up the deployment of energy-efficiency measures by integrating various aspects, focusing the attention on buildings with higher comfort levels and wellbeing for their occupants, according to the 2009 World Health Organization guidelines [11]. In Italy, it has been recently implemented with the Decree Presidency of the Italian Republic (DPR) n. 48 [12]. Among the innovations introduced by this regulation, only the request to check also the seismic risk when carrying out an energy requalification intervention is here highlighted.
Different research studies have recently shown that seismic and energy retrofitting can be successfully addressed by combining surface reinforcements, such as TRM, CFRP/GFRP or FRCM, with thermal insulation materials [13,14,15,16]. The present paper investigates a similar retrofitting strategy based on the combination of SFRM coating, which is able to provide the structure with improved seismic performance, with a thermal insulation layer applied only on its outer surface. The work has been subdivided into two main sections: the former focuses on the analysis of the behavior of the proposed technique based either on experimental tests or on numerical simulations. The latter part, which is more practically oriented, reports the analysis of an actual existing masonry building with the purpose of exploring the potential improvements resulting from retrofitting. To this end, pushover analyses have been performed to assess the seismic safety requirements recommended by the European and Italian structural codes. Finally, to estimate the sole impact of the modified external walls on the building thermal behavior, simulations with the EnergyPlusTM [17] software before and after the application of the new materials have been also carried out.
2. Properties of the Multilayer Retrofitting System
The proposed retrofitting methodology combines two systems that are designed, respectively, to get the maximum performances from both a structural and thermal point of view. As shown in Figure 1, an SFRM coating is first applied on the outer surface of the building in order to improve its seismic behavior. A thermal insulating layer is then connected to the SFRM coating by nylon anchors. Finally, depending on the architectural requirements, a finishing plaster is laid on the insulating layer for decorative purposes as well as for protecting the substrate from moisture and water penetration. Note that the generic dimensions tm, tcoat and tth depicted in Figure 1 represent, respectively, the thickness of the masonry wall, the SFRM coating and the thermal insulating layer.

Figure 1.
A schematic of a typical masonry wall cross-section retrofitted by the proposed multilayer system.
2.1. SFRM Coating Application
The proposed technique is designed to be applied only to the outer surface of the building. Such a choice is made to minimize the occupant discomforts typical of the retrofitting interventions involving the bearing walls located inside the building. Note that a single layer of SFRM laid only on the façades may not be always enough to fulfill the high seismic demand that characterizes tall masonry buildings (i.e., buildings with more than 3 stories) or buildings located on high seismicity sites (ag > 0.25 g). The latter cases may require additional strengthening interventions, including the inner surfaces of the perimeters walls as well as the internal bearing wall, when necessary.
As deeply discussed in previous works [18], the structural effectiveness of the SFRM coating is ensured provided that the following application procedure is fulfilled:
- Existing plaster must be removed from the wall surface to improve the adhesion of the strengthening overlay to the masonry surface. If connection deficiencies between walls are observed, proper interventions (e.g., the installation of steel ties, local dismantling and reconstruction of masonry) must be undertaken to provide continuity at wall intersections.
- As the wall surface is kept moist, a thin (about 5 mm thick) layer of mortar without steel fibers is applied on the wall to prepare a primer-bonding substratum. Masonry-to-coating connectors (i.e., about 6 connectors/m2, according to a previous study [18]) are then installed with a center-to-center spacing of about 400–500 mm. The properties of connectors must be chosen depending on the masonry typology. If masonry is made with solid clay bricks of good quality, the connector may consist of a steel self-tapping screw inserted in a pilot hole drilled in the bricks. On the contrary, when hollow units form the masonry texture, the steel screw can be anchored to the units by a nylon plug able to expand within the block holes. For usual applications, steel screws with a diameter of 6–8 mm can be generally adopted. The screw must be provided with a steel anchor plate that has the minimum dimensions of 50 × 50 × 1.8 (thickness) mm3 that is placed in the middle of the coating thickness.
- After installing the masonry-to-coating connectors, different layers of SFRM are applied to the wall until the required total thickness is obtained. Once the application procedure is completed, the wall surface is wet cured for about 3 days to mitigate shrinkage cracking.
2.2. Application of the Thermal Insulating Layer
The application of the thermal coating on top of the SFRM coating is performed by means of connecting elements. The thermal coating is fixed by nylon clips with a diameter of 10 mm applied approximately every 300 mm: the length through the wall must be sufficient to cross both the thermal coating and the SFRM coating. In this way, the thermal coating is fixed to the existing masonry wall as well. Finally, a layer of finishing plaster is applied. It is worth noting that the connecting elements act as point thermal bridges.
3. Seismic Performance of SFRM Coating and Validation of the Numerical Model
The assessment of the seismic behavior of buildings retrofitted with SFRM coating requires the adoption of numerical analysis tools able to take into account the fracture behavior of both SFRM and masonry. The present section reports the results of the nonlinear Finite Element (FE) analyses carried out to simulate the response of a test building before and after retrofitting. The aim of the simulations is to validate the numerical model used to perform the case study of Section 5 and highlight the structural improvements resulting from the retrofitting intervention. Note that the test building considered in the simulation is part of an experimental work described elsewhere [18,19]. Here, for the sake of brevity, a summary of the main properties of the specimen will be reported.
3.1. Specimen Description and Material Properties
Figure 2 reports the details of the full-scale building tested at the University of Brescia (Brescia, Italy) [18] and analyzed in this section. As one may note, the structure consists of four 200 mm thick Un-Reinforced Masonry (URM) walls supporting 2 composite wood–concrete floors. The URM is made with 250 (length) × 190 (height) × 200 (width) mm hollow clay blocks (void area: 60%) with vertical holes laid in a running bond pattern. Both the head and bed joints are filled with a 10 mm thick layer of a ready-mix cement-based mortar with a compressive strength of 8.9 MPa. The uniaxial compression tests performed on masonry wallets provided a mean compressive strength parallel and perpendicular to the holes equal to 2.93 MPa (CoV = 28.8%) and 0.59 MPa (CoV = 22.1%), respectively. A reinforced concrete (RC) chord running along the whole perimeter of the building connects the floors with the URM walls. Both the windows and the door are provided with RC-masonry lintels having the same thickness of the wall and a depth of 120 mm. A flexible wooden pitched roof is placed at the top of the building, over the second story floor. The 2 floors and the roof have, respectively, a self-weight of 1.82 kN/m2 and 0.61 kN/m2. A total overload of 2.6 kN/m2 is applied only on the first floor.

Figure 2.
Details of the adopted seismic retrofitting technique applied to a full-scale test building [18,19] (dimensions in mm).
The specimen was subjected to two horizontal cyclic forces acting at floor levels on both short sides of the building. The experimental test was subdivided into two different stages. During the first stage, the unstrengthened building was subjected to a series of loading cycles with increasing lateral drift up to the attainment of the maximum lateral capacity. Then, the damaged building was repaired by a 30 mm thick (tcoat) SFRM coating applied according to the procedure described in the previous section and detailed in Figure 2. Finally, the repaired building was re-tested under cyclic loading until the post-peak base shear was reduced to 70% of the maximum lateral resistance.
The SFRM was obtained by combining a commercial ready-mix cement-based mortar with 60 kg/m3 (0.76% by volume) of double hooked-end steel fibers having a length of 32 mm, a diameter (Ø) of 0.4 mm and a tensile strength higher than 2100 MPa. Uniaxial compression tests on 40 mm cubes resulted in a mean compressive strength of SFRM equal to 35.1 MPa (CoV = 15.6%). To assess the fracture behavior of the SFRM, Three-Point Bending Tests (3PBTs) on notched beams having dimensions 150 (height) × 600 (length) × 150 (thickness) mm (notch depth = 25 mm) were carried out according to EN 14651 [20] (Figure 3a). The flexural stress (f)-CMOD (Crack Mouth Opening Displacement) curves obtained from the 3PBTs are shown in Figure 3b together with the strength at the limit of proportionality (fL) and the mean residual strengths fR1, fR2, fR3 and fR4 corresponding, respectively, to CMOD values of 0.5 mm, 1.5 mm, 2.5 mm and 3.5 mm.
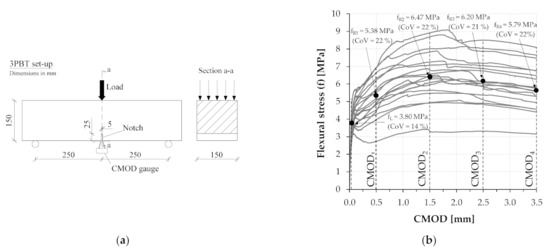
Figure 3.
Three-Point Bending Tests on SFRM beams: (a) the test set-up; (b) experimental nominal flexural stress–CMOD curves.
3.2. Numerical Analysis and Comparison Against Experimental Results
The behavior of the full-scale building was simulated by 3D Non-Linear Finite Element Analyses (NLFEAs) implemented in the commercial program Midas FEA [21].
The 3D FE model of the building is depicted in Figure 4a. Both the masonry walls and the RC chords were modelled with 8-node hexahedral brick elements, whereas the SFRM coating was represented by 4-node quadrilateral plane stress elements. Despite the high computational cost, the solid elements allow the consideration of the whole 3D behavior of masonry by including the effect of the stress and displacement fields acting transversally to the wall plane. The latter may not be generally neglected, especially when considering multilayer members such as the walls retrofitted by the SFRM coating used in this study. As no de-bonding of coating from the masonry surface was generally observed in previous tests [8], the SFRM layer was considered as perfectly bonded to the masonry surface. The floors were simulated by 4-node quadrilateral plate elements. As the pitch roof used in the test had high in-plane flexibility, its interaction with the masonry walls resulted totally negligible.
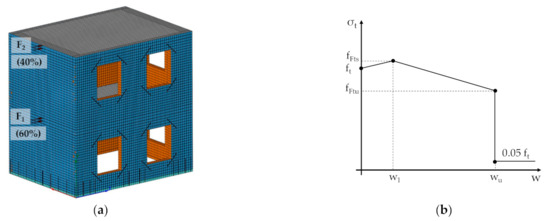
Figure 4.
The numerical model of the test building: (a) mesh of repaired building; (b) post-cracking uniaxial tensile stress–crack width curve of SFRM.
A smeared crack model based on the “total strain rotating” approach [22] was used to simulate the fracture behavior of masonry and SFRM. About masonry, a uniaxial stress–strain parabolic law and Hordijk’s model [23] were implemented to represent the compressive and the tensile behavior, respectively. The parabolic law depends on the compressive strength (fc) and the compressive fracture energy (Gc), according to Feenstra’s model [24]. Hordijk’s stress-crack width law is fully defined by the tensile strength (ft) and the mode-I fracture energy (GIf).
The compressive behavior of the SFRM was described by the Thorenfeldt model [25]. On the contrary, a linear curve with a constant slope equal to the elastic modulus (E) governed the behavior of SFRM in tension before cracking. After cracking, the uniaxial tensile stress (ft)-crack width (w) law of Figure 4b was implemented. The latter was defined according to Model Code 2010 (MC2010) [26], which recommends the use of a linear law interpolating the following residual strengths:
where fR1 and fR3 are the residual strengths provided by 3PBTs; w1 = 0.5 mm; wu = min (lcs·2%, 2.5 mm) is the ultimate crack width (in mm); lcs is the characteristic length; CMOD3 = 2.5 mm. As suggested by Rots [22], lcs is equal to Vel1/3 (Vel = element volume) for brick elements and Ael1/2 (Ael = element area) for quadrilateral elements. The constitutive law reported in Figure 4b can be implemented in the “total strain rotating” model provided that the crack widths w1 and wu are divided by lcs to get the corresponding uniaxial tensile strains. A summary of the mechanical parameters considered in the simulations is reported in Table 1.
fFts = 0.45·fR1,
fFtu = fFts−wu·(fFts−0.5·fR3 + 0.2·fR1)/CMOD3,

Table 1.
Material properties considered in the FE model of the test building.
A Von Mises yield criterion including strain hardening was adopted for steel rebars anchoring the SFRM coating to the foundation of the building. The yield strength, the ultimate strength and the corresponding strain were assumed equal to 510 MPa, 610 MPa and 10%, respectively.
The analyses were performed by monotonically increasing the lateral load and by controlling the post-peak degrading response with the arc-length technique. Figure 5 reports the total base shear (Vb) against the lateral deflection (d2) detected at the second-floor level. The grey curves represent the envelope of the experimental hysteretic responses exhibited by the masonry building before (curve MB-exp) and after repairing (curve MBR-exp). The black curves (MB-num, MBR-num) show the response predicted by the non-linear analyses. Table 2 summarizes the main analysis results related to both the positive (+) and the negative (−) loading direction, including the initial secant stiffness (Ks), the peak base shear (Vpeak) and the corresponding relative increments ΔK and ΔVpeak, which referred to the results of the test on the unstrengthened building (MB-exp).
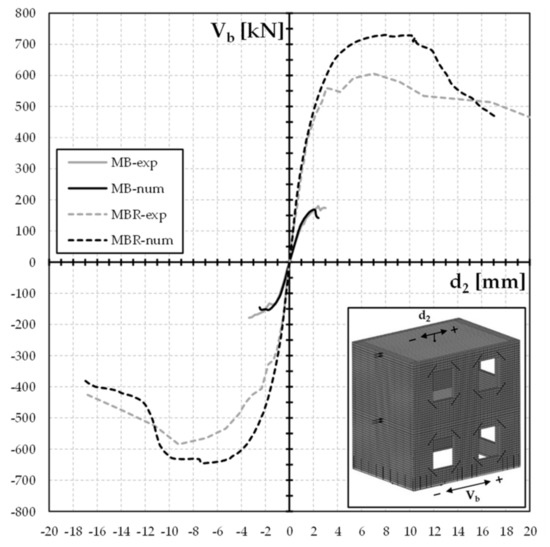
Figure 5.
Base shear (Vb) vs. second-floor displacement (d2) curves: numerical vs. experimental results.
Table 2.
Main experimental and numerical results concerning the behavior of the test building.
The experimental results show the significant increment of the lateral resistance and stiffness observed after repairing. As highlighted in Table 2, the capacity of the repaired structure was about 230% higher than that of the unstrengthened specimen. The initial lateral stiffness was also significantly improved as the relative increment ΔK ranged from 126% to 141%. Moreover, the final crack pattern observed on the East façade (Figure 6a) proves that the post-peak response of the repaired building was governed by the shear and flexural-shear mechanisms involving the first-story piers. The high number of small cracks (mean crack width <0.8 mm) spread over the surface of the coating is related to the internal stress redistribution promoted by the high tensile toughness of SFRM.
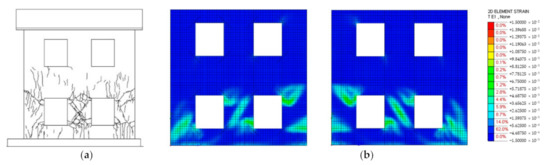
Figure 6.
(a) Final crack pattern observed on the East façade of the repaired building. (b) Numerical contours of principal tensile post-cracking strains acting on the East façade of the repaired building at d2 = 9.4 mm.
The NLFEAs were able to capture all the main failure mechanisms exhibited by the test building before and after retrofitting. The simulations accurately predicted both the lateral capacity and the initial stiffness of the unstrengthened specimen (see Table 2). On the contrary, both the initial stiffness and the capacity were over-predicted of a quantity ranging from 6% to 21% as compared to those observed in the experimental test MBR-exp. Such an overestimation is due to the partial inability of the MC2010′s constitutive law (Figure 4b) to accurately simulate the post-cracking response of SFRM. As discussed in previous work [19], a better prediction of the repaired building response can be obtained by implementing the tensile constitutive law resulting from the inverse analysis of the 3PBTs (Section 3.1; Figure 3b) results. The contours of the principal tensile strains, plotted in Figure 6b, well agree with the final crack pattern depicted in Figure 6a. It appears that the central pier exhibited a diagonal shear failure, whereas the two slender piers located on both sides of the wall presented flexural mechanisms combined with diagonal cracks starting from the corners of the openings. In conclusion, the adopted finite element model was effective in predicting the response of the test building in spite of the slight overestimation of the lateral capacity.
4. Thermal Characterization of Coating
The typical characteristics of buildings built in Italy in the 60 s and 70 s are collected in the UNI/TR 11552 technical report [27]. In a previous research activity on thermal and acoustic properties of insulating materials [28], three packages were proposed as thermal coatings, which are here analyzed as possible thermal complements to the SFRM layer. The packages had originally been chosen to try to use natural and sustainable materials as much as possible while meeting the criteria for the energy retrofit of the opaque walls in relation to the different Italian climate zones (from A to F with increasing degree-days). As stated by the DM 26 June 2015 [2], when performing energy upgrading interventions, the resulting thermal transmittance U of the opaque vertical envelope components must fulfill the following limit values: 0.40 W/(m2 K) for climate zones A and B, 0.36 W/(m2 K) for climate zone C, 0.32 W/(m2 K) for climate zone D, 0.28 W/(m2 K) for climate zone E and 0.26 W/(m2 K) for climate zone F. Two of the proposed packages are suitable for climatic zones A to E, allowing them to meet the limits of thermal transmittance for all construction types of the period of interest. Tailored solutions may be necessary in some cases only for zone F. The first package adopted an innovative solution based on the use of a 50 mm thick (tth) layer of a commercial panel made of needled fiberglass and silica aerogel. The second package (tth = 120 mm) was composed of two superimposed layers made with “light” and “heavy” wood fiber, respectively. The “light” wood fiber layer, having a thickness of 80 mm, formed the inner part of the package laid on the SFRM coating surface. To improve the summer performance, the 40 mm thick “heavy” wood fiber layer was applied on the outer side of the “light” layer. The third package consisted of an 80 mm thick (tth) wood fiber layer that met the thermal transmittance requirements for all construction types of the period of interest only for climatic zones A–C. The thermal properties of the insulating materials are collected in Table 3.
Table 3.
Thermal properties of the insulating materials.
The three packages were designed so that they can also improve summer comfort, reducing and postponing the thermal peak of the central hours of the day. In [28], both transmittance, according to ISO 6946 standard [29], and periodic thermal transmittance, according to ISO 13786 [30], were evaluated on a bare wall made of 200 mm thick hollow clay blocks. As discussed in Section 2.2, the thermal coating was connected to the wall by nylon clips. These connectors act as point thermal bridges. While linear thermal bridges must be included in the calculations (their influence is shown, for example, in [31,32]), point thermal bridges are usually neglected because their influence is minimal, as shown for example in [33]. However, since, in this case, the connections are numerous, their influence was investigated for the three packages installed on the 200 mm thick masonry wall retrofitted by a 30 mm thick SFRM layer. The three analyzed multilayer packages are therefore:
- Bare wall + SFRM + N.1: hollow blocks (tm = 200 mm), SFRM coating (tcoat = 30 mm), aerogel layer (tth = 50 mm).
- Bare wall + SFRM + N.2: hollow blocks (tm = 200 mm), SFRM coating (tcoat = 30 mm), thermal layer (tth = 120 mm) formed by “light” wood fiber (80 mm) combined with “heavy” wood fiber (40 mm).
- Bare wall + SFRM + N.3: hollow blocks (tm = 200 mm), SFRM coating (tcoat = 30 mm), wood fiber layer (tth = 80 mm).
By means of the software COMSOL Multiphysics [34], conduction was simulated through three solid calculation domains that represented the behaviour of a wall panel having total dimensions of 1080 × 1200 mm2. Because two planes of symmetry characterized the whole panel, appropriate boundary conditions were adopted so that only one-quarter of the whole panel (i.e., 540 mm width and 600 mm height) required discretization. The masonry-to-SFRM coating connectors (see Section 3) were placed with a spacing of 360 mm in the horizontal direction and 400 mm in the vertical direction. The nylon connectors for the thermal coating were positioned with a horizontal and vertical spacing of 270 mm and 300 mm, respectively. A typical analysis domain is shown in the schematic of Figure 7.
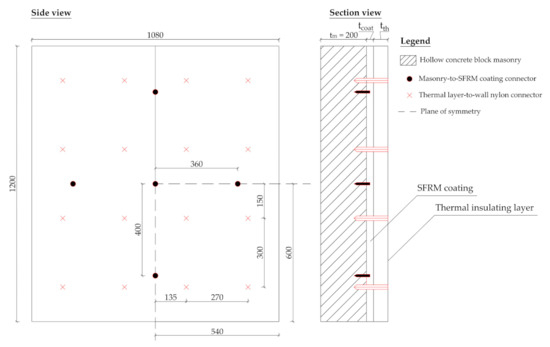
Figure 7.
Schematic of the calculation domain for the multilayer wall (dimensions in mm). The dashed lines represent the quarter model implemented in the simulations.
Convective boundary conditions were imposed on the internal and external surfaces of the multilayer wall, while the lateral surfaces were considered adiabatic. The internal and external heat transfer coefficients were chosen in accordance with the ISO 6946 [29] standard. The grid was built with elements with a maximum size of 20 mm and a minimum size of 1.5 mm. Where possible, the grid was obtained by extrusion in the direction normal to the wall, taking care to place at least three rows of cells in each layer.
For each multilayer package:
- a steady simulation imposing a difference of temperature ( T i– T e) of 20 K was carried out to determine the total resistance Rtot and the transmittance U of the wall;
- an unsteady simulation was carried out to determine the periodic thermal transmittance Yie, imposing:
In order to allow a stabilized periodic regime, ten consecutive days were simulated. Instead of the thermal conductance Lie introduced by the standard ISO 13786 [30] for inhomogeneous walls, the periodic thermal transmittances Yie were determined by using the value of the average specific heat flow on the internal wall; therefore, the result can be seen as mean equivalent value.
In order to make sure that the differences between analytical and numerical values are not due to the numerical resolution, preliminary simulations were carried out for the case of walls without connection elements, showing a perfect match between simulated and analytical values. By comparing the homogeneous (analytically determined) values with numerical simulations of the wall with connectors, summarized in Table 4, it can be seen that point thermal bridges have a negligible influence, despite their large number. This result justifies the assumption to neglect point thermal bridges in the thermal calculations.
Table 4.
Thermal transmittance and periodic thermal transmittance of the analyzed multilayer partitions; analytical values (an): homogeneous layers; numerical values (num): walls with connectors.
Regarding the periodic thermal transmittance Yie, it can be noted that package N.2 represents the best solution, as was expected given the presence of “heavy” wood fiber on the outer side of the wall. However, all three packages provide good summer performance. The values of Yie can, in fact, be compared with the limit value of 0.10 W/(m2 K) required by the DM 26 June 2015 [2] in case of major renovations for sites where the value of the average monthly irradiance on the horizontal plane during the month of highest summer insolation is greater than or equal to 290 W/m2: In this case, it is required that the value of the mass per unit area Ms is greater than 230 kg/m2, or that the value of the periodic thermal transmittance Yie is lower than 0.10 W/(m2 K) for all the opaque vertical walls excluding those included in the northwest/north/northeast quadrant.
5. Case Study
The case study reported in the present section refers to the retrofitting intervention performed on an existing residential masonry building constructed in the middle of the 1960s. As shown in Figure 8, the building is a two-story house having plan dimensions of 11.4 × 10.0 m2 and a total height of about 8.2 m. The bearing structure is made of 330 mm thick concrete hollow unit masonry walls constructed to support the ribbed one-way concrete slabs forming the two floors and the pitched roof. The building is located in L’Aquila, a city situated in central Italy.
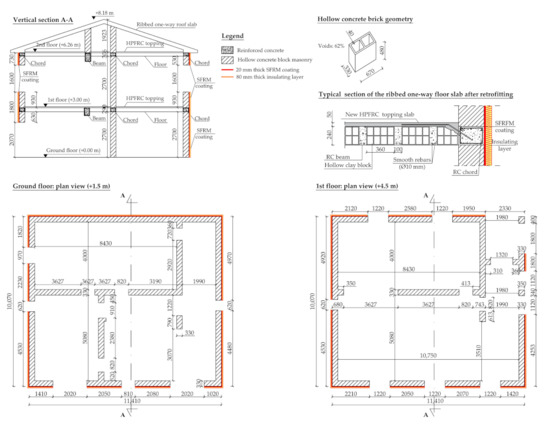
Figure 8.
Properties of the existing masonry building considered in the case study (dimensions in mm).
The following sections report and discuss the main features related to the procedure adopted to design the retrofitting intervention.
5.1. Seismic Verification of the Structure
5.1.1. Numerical Modelling
A series of 3D non-linear pushover analyses were carried out to assess the seismic performance of the structure. To compare the improvement resulting from retrofitting, two different models, named “CS” and after “CS-R(20),” were implemented in the finite element code Midas FEA [21] to simulate the building before and after retrofitting. The masonry and SFRM coating were modeled by 8-nodes hexahedral solid elements and by 4-node quadrilateral plane stress elements, respectively, adopting the same constitutive models for the test building analyzed in Section 3. Since data from field investigations were not available, the mean mechanical properties of masonry were determined according to the provisions reported in the Guidelines of MIT 2009 (Table C8A.2.1) [35]. As recommended by EN1998-3 [36] for the Limited Knowledge Level (KL1), the mean properties of masonry were divided by the Confidence Factor CF = 1.35 to get the design properties considered in the analyses (Table 5). About SFRM, the characteristic values of the properties reported in Section 3.1 and Section 3.2 were used in the simulation of the retrofitted building (Table 5). The same constitutive laws described in Section 3.2 were used to represent the inelastic behavior of materials.
Table 5.
Design properties of materials considered in the pushover analyses.
The finite element model of the building is shown in Figure 9. The floors were assumed as infinitely stiff and rigidly connected to the masonry walls. In addition to the self-weight of the walls, total vertical loads of 4.7 kN/m2 and 5.2 kN/m2, which included both the permanent and the variable actions, were applied to the first and second floor, respectively.
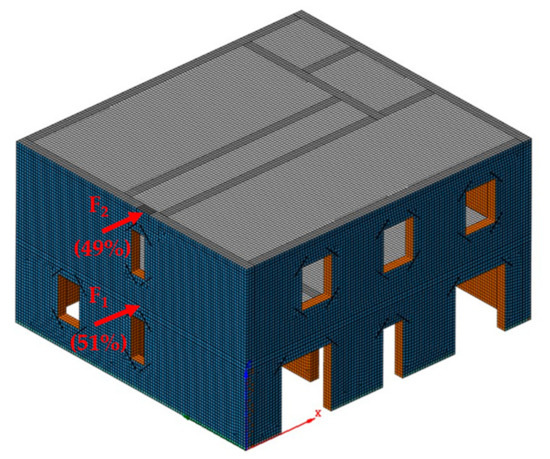
Figure 9.
The pushover analysis of the concrete unit masonry building: finite element mesh and lateral load distribution.
When performing a pushover analysis, one should consider two systems of horizontal forces applied at the story levels and acting in the two orthogonal directions coinciding with the principal axes of the building:
- a system of forces proportional to masses (i.e., typical of soft ground story response);
- a system of forces proportional to the first mode shape of the building (i.e., it is able to represent the structural dynamic amplification).
The results reported herein refer to the analyses concerning the most critical condition, which is the one including a lateral load distribution proportional to masses and oriented in the +X direction shown in Figure 9. As suggested by the Italian structural code NTC2018 [37] as well as by EN1998-1 [38], possible uncertainties in the distribution of masses were taken into account by an additional mass eccentricity (i.e., accidental eccentricity) corresponding to 5% of the width of the floor perpendicular to the direction of the acting seismic action.
5.1.2. Discussion of Analysis Results
A preliminary linear modal analysis was performed to determine the mass participation and the basic parameters required by the pushover analysis. Table 6 reports some of the obtained results related to the first mode, namely the fundamental period (T1), the modal participation mass in X-direction (Mx) as well as the modal participation factor (Г) [39]. Note that the first mode involved an amount of mass higher than 55% both for the unstrengthened and the retrofitted building. The fundamental period resulting from the dynamic analysis was compared with those provided by two empirical equations reported by structural codes [37,40]. The first-mode period T’1-NTC was calculated as
where d [m] is the lateral elastic displacement of the top of the building obtained from the application of gravity loads in horizontal direction. On the contrary, the period T’’1-NTC resulted from the following equation:
where H is the total height of the structure calculated from either a rigid basement or the foundation. As highlighted by Table 6, both equations overestimated by 60% (T’1-NTC of CS) to 240% (T’’1-NTC of CS-R(20)) the fundamental period resulting from the numerical models. However, one should consider that the empirical equations above are very rough and should be used only where the initial sizing of structural elements cannot easily be made [41]. As an alternative to the empirical equations reported above, one may perform an in situ dynamic characterization of the building able to provide a more accurate estimation of the fundamental period.
T’1-NTC = 2∙d1/2,
T’’1-NTC = 0.05∙H3/4,
Table 6.
Main results of eigenvalue analyses related to first mode and parameters of the SDOF idealized bi-linear curve.
The capacity curves resulting from the non-linear analyses of the building (i.e., the MDOF structure) are reported in Figure 10 (see the dotted curves). As compared to the reference structure (CS_MDOF), the repaired building (CS-R(20)_MDOF) exhibited both an initial stiffness and maximum capacity improvement equal to 128% and 92%, respectively. Moreover, the conventional ultimate displacement capacity du (see Table 7 and the cross marks depicted in Figure 10), which corresponded to the 20% reduction of the maximum capacity on the post-peak response according to [37], was 1.6 times higher than that exhibited by the unstrengthened building.
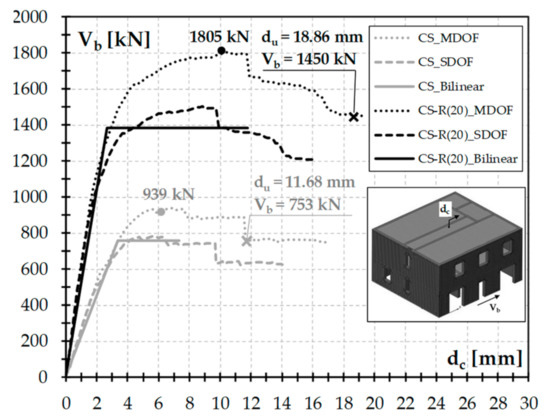
Figure 10.
Base shear (Vb) vs. second-floor displacement (dc) curves and the bi-linear idealized response.
Table 7.
Safety verification and q-factor.
The results of the pushover analyses were used to perform the seismic safety check according to the method proposed by NTC 2018 [37]. First, the force (V*b) and the displacement (d*c) of the SDOF system were calculated as:
where Vb and dc are, respectively, the total base shear and the displacement of the control node of the MDOF system. The idealized bi-linear SDOF capacity curve was obtained by the stiffness of the elastic branch (k*) resulting from the following equation (see NTC2018; clause 7.8.1.6):
in which V*b,max is the maximum base shear of the SDOF system, and d(0.7∙V*b,max) is the displacement corresponding to 70% of V*b,max. The yield resistance (F*y) of the idealized SDOF capacity curve was evaluated by the equal energy assumption, assuming d*u = du/Γ. Table 6 reports the parameters obtained from the equations above.
V*b = Vb/Γ,
d*c = dc/Γ,
k* = 0.7∙V*b,max/d(0.7∙V*bu),
As suggested by NTC2018, safety assessment considered the Life Safety at Ultimate Limit State (ULS)”. Figure 11a reports the elastic spectrum for the city of L’Aquila for a return period TR = 475 years, whereas Figure 11b shows the SLV performance points on the corresponding elastic demand spectrum for both the unstrengthened and the retrofitted structure. For the sake of clarity, the demand spectrum of Figure 11b was limited to a maximum displacement of 35 mm. The displacement demand dD-SLV represented by the performance points (see Figure 11b and Table 7) was calculated by the following relation [40]:
which depends on the parameters described below (see also Table 6): de,max = Se(T*)·(T*/2π)2 is the target displacement of an SDOF system with unlimited elastic behavior; T* = fundamental period of the idealized system; m* = equivalent mass of the structure; qu = Se(T*)∙m*/F*y ≥ 1 is the ratio between the elastic response force and the yield force of the equivalent SDOF system; Se(T*) = the elastic spectrum of L’Aquila corresponding to the period T*; Tc = 0.74 s is the corner period between the short and medium period range of the elastic spectrum.
dD-SLV = de,max·[1 + (qu-1) Tc/T*]/qu ≥ de,max with T* < Tc,

Figure 11.
Seismic assessment of the structure before and after retrofitting: (a) elastic spectrum of acceleration of L’Aquila; (b) a comparison between displacement capacity and demand. The performance points are represented by dot marks.
Each performance point was compared with the corresponding SLV capacity displacement dC-SLV (Table 7) calculated as:
dC-SLV = 3/4∙d*u,
The curves of Figure 11b highlight that the unstrengthened building (CS curve) did not fulfill the safety requirement as the capacity displacement was lower than the displacement demand. After retrofitting, the SLV performance point was satisfied as the capacity displacement of the retrofitted building (CS-R(20) curve) was more than five times higher than the displacement demand.
It is worth remarking that the increase in stiffness and capacity due to the SFRM coating was so high that the performance point fell within the elastic branch of the bi-linear capacity curve.
Figure 12 shows the contours of principal tensile post-cracking strains of the building (i.e., the MDOF system) at a lateral deflection d2 equal to Γ·dD-SLV, where dD-SLV corresponds to the displacement demand for the SDOF system. As expected, the crack pattern of the unstrengthened building was much more severe than that exhibited by the retrofitted building. In fact, as proved by Figure 12a, most of the piers located on the ground floor of the CS building presented a damage pattern typical of active diagonal shear mechanisms. On the contrary, the lower displacement demand, together with the higher initial stiffness, allowed the CS-R(20) building to remain mostly undamaged (Figure 12b). Besides small flexural cracks starting from the corners of the openings, only the internal pier showed incipient flexural mechanisms. This confirms the benefit provided by the proposed technique in terms of both better control of the cracking process and higher structure durability.
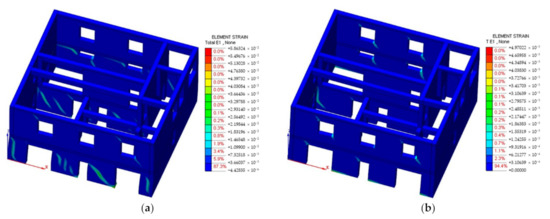
Figure 12.
Contours of the principal tensile post-cracking strains corresponding to a second-floor lateral displacement dc = Γ·dD-SLV: (a) the unstrengthened building; (b) the strengthened building.
The pushover analyses were finally used to estimate the behavior factor q of the structure before and after the retrofitting. The q-factor typically used in linear elastic analysis can be estimated as follows:
where q0 is the basic value of the behavior factor, whereas αu/α1 (Table 7) is an over-strength factor defined as follows: α1 is the multiplier of the horizontal seismic load for which the first pier reaches its ultimate shear or flexural resistance; αu is the 90% of the multiplier of the horizontal seismic load for which the structure reaches its maximum resistance.
q = q0∙αu/α1,
According to the Guidelines of MIT 2019 [40], q0 can be assumed equal to 1.75 for URM structures. As an alternative, q0 can be computed by the following equation [37,38]:
depending on the ductility μ = d*u·k*/F*y (Table 7) of the bi-linear SDOF system. Note that both the ratio αu/α1 and the ductility μ were obtained from the pushover analyses described above. The factors qNTC and qDUC reported in Table 7 were calculated by Equation (10): the former resulted from the implementation of the factor q0 proposed by the NTC2018, and the latter was obtained, including the factor q0 calculated by means of the Equation (11). As the q-factor predicted by the NTC2018 depends mainly on the over-strength factor, the factor qNTC of the unstrengthened structure was very close (i.e., 2% lower) to that of the strengthened building. It is worth noting that both values of qNTC are slightly lower than the maximum value (i.e., q = 2.6) recommended by the Guidelines of MIT 2019 [40] for buildings made with hollow block masonry. By including the structure ductility in the calculation of the q-factor, the factor qDUC of the retrofitted structure result was 25% higher than that of the unreinforced building. Moreover, the value of qDUC exhibited by the retrofitted structure was about 2.5. Based on the previous results, one may conclude that the methods adopted to determine the q-factor provided consistent results. In addition, the present case study suggests that the upper limit of q = 2.6 recommended by the Italian code for existing URM buildings may be suitable also for structures retrofitted by SFRM coating.
q0 = 1 + (μ − 1) T*/TC with T* < Tc
5.2. Energy Analysis
L’Aquila, with 2514 degree-days, is located in the climate zone E. Thus the thermal transmittance U must fulfil the limit value of 0.28 W/(m2 K) for any intervention on opaque vertical walls. To give an idea of the figures, if an ETICS solution with λ = 0.035 W/(m K) expanded polystyrene is considered, an 80 mm thick insulation layer would be sufficient to fulfil the limits. The only case in which this limit is not expressly required is that of a major first-level renovation that also involves the heating system. In that case, the overall heat transfer transmission coefficient value H’T must fulfil a limit value depending on the surface to volume ratio S/V and on the climate zone. Moreover, for sites characterized by the average monthly irradiance on the horizontal plane during the month of highest summer insolation higher than or equal to 290 W/m2, it is required that either the mass per unit area (Ms) is greater than 230 kg/m2 or the periodic thermal transmittance (Y ie) is lower than 0.10 W/(m2 K). The latter limitations apply to all opaque vertical walls, excluding those included in the northwest/north/northeast quadrant. In fact, even in the case of major second-level renovations, which may not involve the heating system, the thermal transmittance limit must be fulfilled, and a limit (i.e., 0.65 W/(m2 K) for the climatic zone E) on the global transmission coefficient is added.
The vertical walls of the building consisted of a 330 mm thick masonry wall provided with a 15 mm thick internal layer of plaster. Masonry and plaster had a thermal conductivity equal to 0.27 W/(m K) and 0.8 W/(m K), respectively. Package N.1, presented in Section 4, provided a U-value of 0.22 W/(m2 K) and package N.2 a U-value of 0.23 W/(m2 K), whereas package N.3 provided a thermal transmittance of 0.29 W/(m2 K). Therefore, to respect the law limits, package N.1 or package N.2 can be chosen. As reported in the recent works by Dickson and Pavía [42] and Kumar [43], the main benefit of aerogel-based insulation lies in the low thickness needed to fulfil thermal requirements, which makes it especially interesting in high-rent areas. The considerable initial cost of these materials is justified in cold climates, where building walls with a higher thermal resistance are more cost-effective. In the case at hand, the climate is temperate, and the wall thickness is not an issue; thus, the main parameters that can drive the choice are sustainability and cost. A comparison between embodied energy and embodied carbon of the two materials [43] reveals sensibly higher values for aerogel than for wood fiber, which turns out to be more sustainable in terms of global warming, ozone depletion and acidification potential, albeit not reaching the levels of other materials such as cellulose [42]. As concerns costs, the total market price of the two 80 mm and 40 mm layers of “light” and “heavy” wood fibers is 20 €/m2, against over 300 €/m2 for the considered aerogel-based material. In the light of these considerations, package N.2 is chosen over N.1.
Regarding ceilings, roofs and floors, typical details of the building’s construction period were adopted. Doors were assumed to be made of wood and 70 mm thick and windows made of a single 3 mm thick glass layer, having thermal transmittance of 5.89 W/(m2 K). As a further improvement, the replacement of single-glazed windows with double-glazed windows with argon cavity (thickness 3 mm – 9 mm – 3 mm, thermal transmittance 2.59 W/(m2 K)) was also simulated.
In this case, the global transmission coefficient of the vertical walls was estimated before and after the renovation, finding a reduction from 1.53 W/(m2 K) to 0.54 W/(m2 K), which allowed to meet the limit value of 0.65 W/(m2 K). To take into account linear thermal bridges, an increase factor for thermal transmittance equal to 0.10 for opaque walls before the renovation and equal to 0.05 after the renovation was used.
With EnergyPlusTM [17] software, the annual dynamic behavior of the building was simulated before the renovation, after the application of the multilayer package consisting of the SFRM coating and the chosen thermal coating, and finally after the further replacement of the windows. An ideal loads air system with a heating thermostat set-point was used to calculate the annual heating energy needs and to evaluate the behavior of the building in summer.
5.2.1. Numerical Modelling
The building was schematized as in Figure 13. Three zones were created: only the central body of the building was heated, while the roof space and the basement were considered unheated zones.
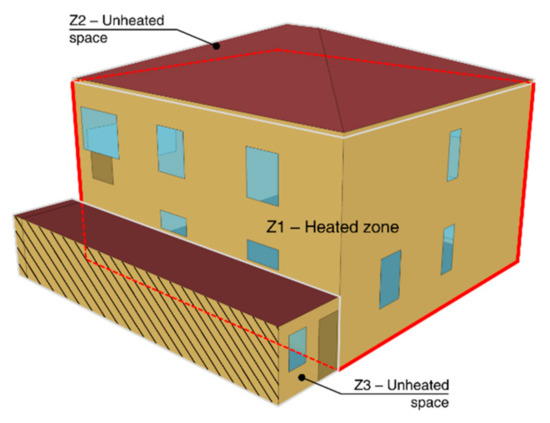
Figure 13.
Scheme of the building: Z1 heated zone, Z2 and Z3 unheated zones.
The settings used for simulations in EnergyPlusTM [17] were:
- typical meteorological year 2005–2014 for L’Aquila extracted from EU Photovoltaic Geographical Information System [44];
- constant temperature of the surfaces in contact with the ground, equal to 18 °C;
- internal gains equal to 450 W in the zone Z1, as stated from UNI/TS 11300-1:2014 [45];
- air changes per hour equal to 0.5 h−1 in the zone Z1, as stated form UNI/TS 11300-1:2014 [45];
- temperature between 20 °C and 40 °C (thermostat constant heating and cooling set-points) to model an ideal heating system and no cooling system;
- calculation timesteps of 15 min.
5.2.2. Results and Discussion of the Thermal Analysis
The energy needs of this building during the year are shown in Figure 14, and the total values are summarized in Table 8. It can be observed that the seismic and energy retrofitting of the vertical walls reduces the energy needs by 17.1%. If the replacement of the windows is added, the savings rise to 29.3%.
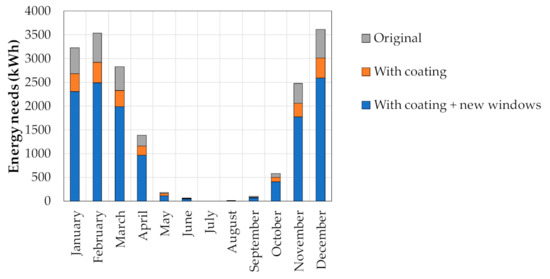
Figure 14.
The energy needs of the building during the year.
Table 8.
The energy needs and energy savings of the building with respect to the original configuration.
Regarding the summer performances, Figure 15 shows that the retrofitting intervention modifies the operative temperature profile, which appears to be lower after the addition of the coating. A further benefit in terms of maximum operative temperature reduction, particularly in daytime, can be obtained by replacing single glazing with better-performing windows.

Figure 15.
The operative temperature of the building during the hottest day of the year.
6. Conclusions
An integrated synergistic structural and energy upgrading system, especially designed for masonry buildings, was presented and discussed in this paper. The proposed technique combines a rather light and effective layer of SFRC mortar and an insulation layer; both applied only on the external masonry surfaces of buildings.
Some experimental evidence on the efficiency under a structural level was described first. The energy analyses of different insulation layers were therefore characterized in combination with the structural coating. An actual case study regarding a small building was finally proposed, and the benefits, both in terms of structural safety and energy savings, were depicted.
It can be certainly concluded that the idea of a combined retrofitting of masonry buildings, by implementing a structural and an insulation layer, applied only on the outer vertical surfaces to limit the occupant discomforts, is a promising and ready-to-use technique. The seismic performance is extremely improved, and the corresponding collapse mechanisms are postponed.
After evaluating the low effect of point thermal bridges due to layer connectors, it is estimated that the addition of the coating reduces the energy needs in winter and the peak operative temperature in summer. The replacement of poor-performing windows is strongly recommended in this case to fully exploit the potential of the retrofitting measures.
As proved by others [15,46], the use of an integrated retrofitting solution, such as that proposed herein, is generally able to minimize the economic losses since the initial investment is paid back faster. Future work will be devoted to the investigation of the economic efficiency of the proposed retrofitting method applied to buildings placed in different geographic areas.
Author Contributions
Data curation, M.P.; Formal analysis, L.F.; Funding acquisition, G.A.P.; Investigation, S.S.L. and B.G.; Methodology, F.M. and M.P.; Software, S.S.L. and B.G.; Supervision, L.F.; Writing—original draft, L.F., S.S.L. and B.G.; Writing—review and editing, F.M., M.P. and G.A.P. All authors have read and agreed to the published version of the manuscript.
Funding
The authors gratefully thank the University of Brescia and Tecnologia e Ricerca Italiana S.r.l. (TRI S.r.l) for the financial support to the “Health & Wealth” project “Sismacomf”, whose research activities led to the results described in this paper. The financial contribution provided by the RELUIS-DPC project 2014–2018 is gratefully acknowledged.
Institutional Review Board Statement
Not applicable.
Informed Consent Statement
Not applicable.
Data Availability Statement
All data, models, and code generated or used during the study appear in the published article.
Conflicts of Interest
The authors declare no conflict of interest.
References
- Economidou, M.; Atanasiu, B.; Despret, C.; Maio, J.; Nolte, I.; Rapf, O.; Laustsen, J.; Ruyssevelt, P.; Staniaszek, D.; Strong, D.; et al. Europe’s Buildings under the Microscope. A Country-by-Country Review of the Energy Performance of Buildings; Buildings Performance Institute Europe BPIE: Brussels, Belgium, 2011. [Google Scholar]
- Italian Ministry of Economic Development. DM 26 giugno 2015. Applicazione Delle Metodologie di Calcolo Delle Prestazioni Energetiche e Definizione Delle Prescrizioni e Dei Requisiti Minimi Degli Edifici; Supplement to the Official Gazette of the Italian Republic; Italian Ministry of Economic Development: Roma, Italy, 2015; n. 162 of 15 July 2015, Ordinary Supplement n. 39. (In Italian) [Google Scholar]
- European Parliament. 2010/31/EU Directive of the European Parliament and of the Council on the Energy Performance of Buildings (EPBD Recast); European Parliament: Brussels, Belgium, 2010. [Google Scholar]
- European Commission. Factsheet: Energy Performance in Buildings Directive. Available online: https://ec.europa.eu/energy/sites/default/files/documents/buildings_performance_factsheet.pdf (accessed on 4 May 2021).
- Oliveira, D.V.; Basilio, I.; Lourenço, P.B. Experimental bond behavior of FRP sheets glued on brick masonry. J. Compos. Constr. 2010, 15, 32–41. [Google Scholar] [CrossRef]
- Giaretton, M.; Dizhur, D.; Garbin, E.; Ingham, J.M.; da Porto, F. In-Plane Strengthening of Clay Brick and Block Masonry Walls Using Textile-Reinforced Mortar. J. Compos. Constr. 2018, 22, 04018028. [Google Scholar] [CrossRef]
- ElGawady, M.A.; Lestuzzi, P.; Badoux, M. Retrofitting of masonry walls using shotcrete. In Proceedings of the NZSEE Conference, Napier, New Zealand, 10–12 March 2006; Volume 45. [Google Scholar]
- Facconi, L.; Minelli, F.; Lucchini, S.; Plizzari, G. Experimental study of solid and hollow clay brick masonry walls retrofitted by steel fiber-reinforced mortar coating. J. Earthq. Eng. 2018, 24, 381–402. [Google Scholar] [CrossRef]
- European Parliament. 2018/844/EU Directive of the European Parliament and of the Council of 30 May 2018 amending Directive 2010/31/EU on the Energy Performance of Buildings and Directive 2012/27/EU on Energy Efficiency; European Parliament: Brussels, Belgium, 2018. [Google Scholar]
- European Parliament. 2012/27/EU Directive of the European Parliament and of the Council on Energy Efficiency, Amending Directives 2009/125/EC and 2010/30/EU and Repealing Directives 2004/8/EC and 2006/32/EC.; European Parliament: Brussels, Belgium, 2012. [Google Scholar]
- World Health Organization. WHO Guidelines for Indoor Air Quality: Dampness and Mould; World Health Organization: Geneva, Switzerland, 2009. [Google Scholar]
- Presidency of the Italian Republic. DPR 10 giugno 2020 n. 48. Attuazione della direttiva (UE) 2018/844 del Parlamento europeo e del Consiglio, del 30 maggio 2018, che modifica la direttiva 2010/31/UE sulla prestazione energetica nell'edilizia e la direttiva 2012/27/UE sull'efficienza energetica. In Official Gazette of the Italian Republic; Presidency of the Italian Republic: Rome, Italy, 2020; n. 146 of 10 June 2020. (In Italian) [Google Scholar]
- Bournas, D.A. Concurrent seismic and energy retrofitting of RC and masonry building envelopes using inorganic textile-based composites combined with insulation materials: A new concept. Compos. Part B Eng. 2018, 148, 166–179. [Google Scholar] [CrossRef]
- Karlos, K.; Tsantilis, A.; Triantafillou, T. Integrated Seismic and Energy Retrofitting System for Masonry Walls Using Textile-Reinforced Mortars Combined with Thermal Insulation: Experimental, Analytical, and Numerical Study. J. Compos. Sci. 2020, 4, 189. [Google Scholar] [CrossRef]
- Mistretta, F.; Stochino, F.; Sassu, M. Structural and thermal retrofitting of masonry walls: An integrated cost-analysis approach for the Italian context. Build. Environ. 2019, 155, 127–136. [Google Scholar] [CrossRef]
- Longo, F.; Cascardi, A.; Lassandro, P.; Aiello, M.A. Thermal and Seismic Capacity Improvements for Masonry Building Heritage: A Unified Retrofitting System. Sustainability 2021, 13, 1111. [Google Scholar] [CrossRef]
- EnergyPlus™, Version 9.4.0; U.S. Department of Energy’s (DOE) Building Technologies Office (BTO) and Managed by the National Renewable Energy Laboratory (NREL): Washington, DC, USA.
- Lucchini, S.S.; Facconi, L.; Minelli, F.; Plizzari, G.A. Cyclic Test on a Full-Scale Unreinforced Masonry Building Repaired with Steel Fiber-Reinforced Mortar Coating. J. Struct. Eng. 2021, 147, 04021059. [Google Scholar] [CrossRef]
- Lucchini, S.S.; Facconi, L.; Minelli, F.; Plizzari, G.A. Retrofitting a full-scale two-story hollow clay block masonry building by steel fiber reinforced mortar coating. In Proceedings of the 3rd FRC International Workshop Fibre Reinforced Concrete: From Design to Structural Applications, Lake Garda, Italy, 28–30 June 2018; Extended Abstract on pp. 114–115. ISBN 978-88-89252-44-4. [Google Scholar]
- UNI EN 14651:2007. Test Method for Metallic Fibre Concrete—Measuring the Flexural Tensile Strength (Limit of Proportionality (Lop), Residual); UNI EN: Milan, Italy, 2007. [Google Scholar]
- Midas FEA v1.1. Advanced Nonlinear and Detail FE Analysis System. Midas Information Technology Co. Ltd. Available online: https://www.cspfea.net/ (accessed on 15 July 2020).
- Rots, J.G. Computational Modeling of Concrete Fracture. Ph.D. Thesis, University of Technology of Delft, Delft, The Netherlands, 1988. [Google Scholar]
- Hordijk, D.A. Local Approach to Fatigue of Concrete. Ph.D. Thesis, University of Technology of Delft, Delft, The Netherlands, 1991. [Google Scholar]
- Feenstra, P.H. Computational Aspects of Biaxial Stress in Plain and Reinforced Concrete. Ph.D. Thesis, University of Technology of Delft, Delft, The Netherlands, 1993. [Google Scholar]
- Thorenfeldt, E.; Tomaszewicz, A.; Jensen, J.J. Mechanical properties of high-strength concrete and applications in design. In Proceedings of the Symposium on Utilization of High-Strength Concrete, Trondheim, Norway; 1987. [Google Scholar]
- International Federation for Structural Concrete. Fib Bulletin 65. Model Code 2010; Final Complete Draft; International Federation for Structural Concrete (fib): Lausanne, Switzerland, 2012. [Google Scholar]
- UNI/TR 11552:2014. Opaque Envelope Components of Buildings—Thermo-Physical Parameters; UNI EN: Milan, Italy, 2014. [Google Scholar]
- Neri, M.; Pilotelli, M.; Piana, E.A.; Lezzi, A.M. Prediction of the Acoustic and Thermal Performance of a Multilayer Partition. In Proceedings of the 4th IBPSA-Italy Conference on Building Simulation Applications, BSA 2019, Bolzano, Italy, 19–21 June 2020; pp. 275–282. [Google Scholar]
- ISO (International Organization for Standardization). ISO 6946 Building Components and Building Elements—Thermal Resistance and Thermal Transmittance—Calculation Methods; ISO: Geneva, Switzerland, 2017. [Google Scholar]
- ISO (International Organization for Standardization). ISO 13786 Thermal Performance of Building Components—Dynamic Thermal Characteristics—Calculation Methods; ISO: Geneva, Switzerland, 2017. [Google Scholar]
- Tenpierik, M.; van Der Spoel, W.; Cauberg, H. An Analytical Model for Calculating Thermal Bridge Effects in High Performance Building Enclosure. J. Build. Phys. 2008, 31, 361–387. [Google Scholar] [CrossRef]
- Luscietti, D.; Gervasio, P.; Lezzi, A.M. Computation of linear transmittance of thermal bridges in precast concrete sandwich panels. J. Phys. Conf. Ser. 2014, 547, 012014. [Google Scholar] [CrossRef]
- Benedetti, M.; Gervasio, P.; Luscietti, D.; Pilotelli, M.; Lezzi, A.M. Point Thermal Transmittance of Rib Intersections in Concrete Sandwich Wall Panels. Heat Transfer Eng. 2019, 40, 1075–1084. [Google Scholar] [CrossRef]
- COMSOL. Reference Manual, Version 5.6; COMSOL Corporation: Stockholm, Sweden, 2020. [Google Scholar]
- Circolare n. 617 del 2 febbraio 2009 del Ministero delle Infrastrutture e dei Trasporti. Istruzioni per l’applicazione delle Nuove Norme Tecniche delle Costruzioni di cui al DM 14 gennaio 2008; Ministero delle Infrastrutture e dei Trasporti (MIT): Rome, Italy, 2009. (In Italian)
- UNI EN 1998-3:2005. Eurocode 8: Design of Structures for Earthquake Resistance—Part 3: Assessment and Retrofitting of Buildings; UNI EN: Milan, Italy, 2005. [Google Scholar]
- NTC 2018: Decreto del Ministero delle Infrastrutture e dei Trasporti del 17 gennaio 2018. Aggiornamento delle Norme Tecniche per le Costruzioni; Ministero delle Infrastrutture e dei Trasporti (MIT): Rome, Italy, 2018. (In Italian) [Google Scholar]
- UNI EN 1998-1:2013. Eurocode 8: Design of Structures for Earthquake Resistance—Part 1: General Rules, Seismic Actions and Rules for Buildings; UNI EN: Milan, Italy, 2013. [Google Scholar]
- Fajfar, P.; Gašperšič, P. The N2 method for the seismic damage analysis of RC buildings. Earthq. Eng. Struct. Dyn. 1996, 25, 31–46. [Google Scholar] [CrossRef]
- Circolare, n. 7 del 21 gennaio 2019 del Ministero delle Infrastrutture e dei Trasporti. Istruzioni per l’applicazione dell’«Aggiornamento Delle “Norme Tecniche per le Costruzioni”» di Cui al DM 17 Gennaio 2018; Ministero delle Infrastrutture e dei Trasporti (MIT): Rome, Italy, 2019. (In Italian)
- Paulay, T.; Priestley, M.J.N. Seismic Design of Reinforced Concrete and Masonry Buildings; Wiley-Interscience: New York, NY, USA, 1992; 768p. [Google Scholar]
- Dickson, T.; Pavía, S. Energy Performance, Environmental Impact and Cost of a Range of Insulation Materials. Renew. Sustain. Energy Rev. 2021, 140, 110752. [Google Scholar] [CrossRef]
- Kumar, D.; Alam, M.; Zou, P.X.W.; Sanjayan, J.G.; Memon, R.A. Comparative Analysis of Building Insulation Material Properties and Performance. Renew. Sustain. Energy Rev. 2020, 131, 110038. [Google Scholar] [CrossRef]
- Photovoltaic Geographical Information System (PVGIS). Available online: https://ec.europa.eu/jrc/en/pvgis (accessed on 10 November 2020).
- UNI/TS 11300-1:2014. Prestazioni Energetiche Degli Edifici—Parte 1: Determinazione Del Fabbisogno Di Energia Termica Dell'edificio per La Climatizzazione Estiva Ed Invernale. Ente Nazionale Italiano di Unificazione (UNI): Milan, Italy; Rome, Italy. (In Italian)
- Gkournelos, P.D.; Bournas, D.A.; Triantafillou, T.C. Combined seismic and energy upgrading of existing reinforced concrete buildings using TRM jacketing and thermal insulation. Earthq. Struct. 2019, 16, 625–639. [Google Scholar]
Publisher’s Note: MDPI stays neutral with regard to jurisdictional claims in published maps and institutional affiliations. |
© 2021 by the authors. Licensee MDPI, Basel, Switzerland. This article is an open access article distributed under the terms and conditions of the Creative Commons Attribution (CC BY) license (https://creativecommons.org/licenses/by/4.0/).