
Performance Evaluation of a Prestressed Belitic Calcium Sulfoaluminate Cement (BCSA) Concrete Bridge Girder


Abstract
:1. Introduction
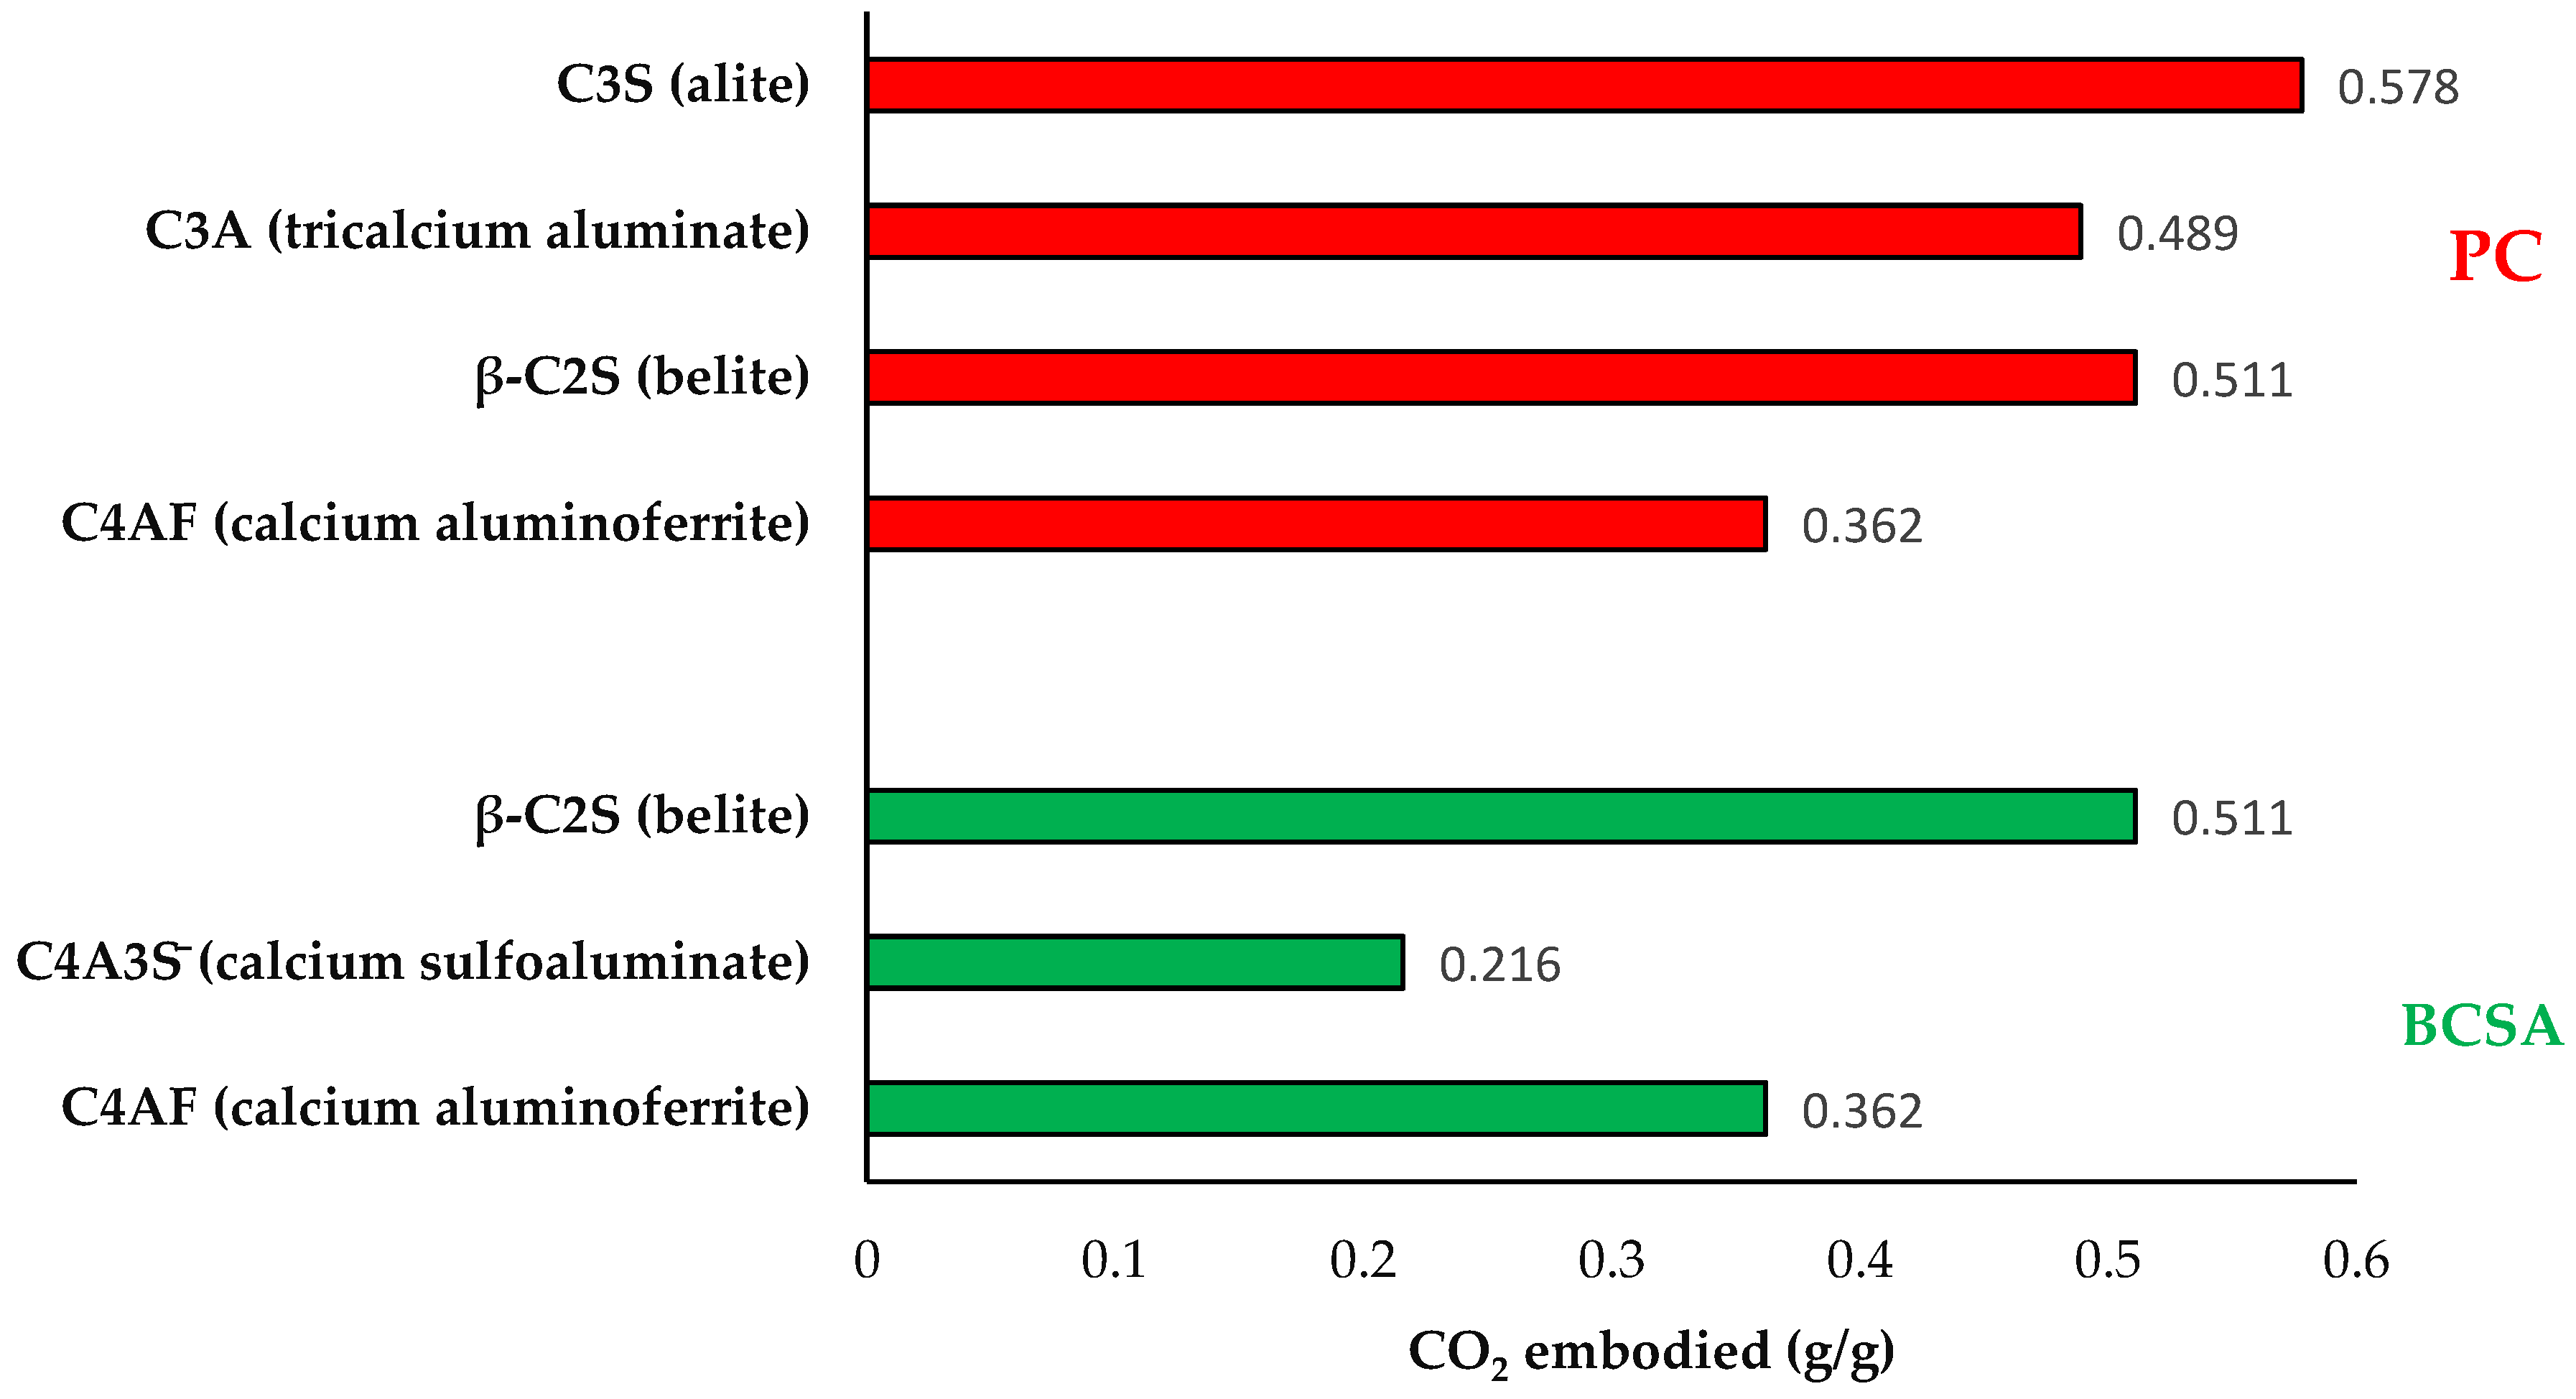
- Lower clinkering temperature, which reduces the energy and emissions associated with firing the kiln [5];
- Less calcium oxide in the clinker, which reduces the release of CO2 associated with calcination;
- Increased friability, which reduces the energy consumption of grinding [6]; and
- Higher proportion of interground components (e.g., calcium sulfate) that do not require firing, further reducing the embodied energy and emissions associated with clinkering.
- Demonstrates accelerated construction of a precast, prestressed voided deck slab bridge girder made with BCSA cement concrete;
- Quantifies the performance of said girder in terms of material properties, transfer length, prestress losses, crack initiation and reopening, flexural strength, and shear strength; and
2. Experimental Investigation
2.1. Materials
Concrete
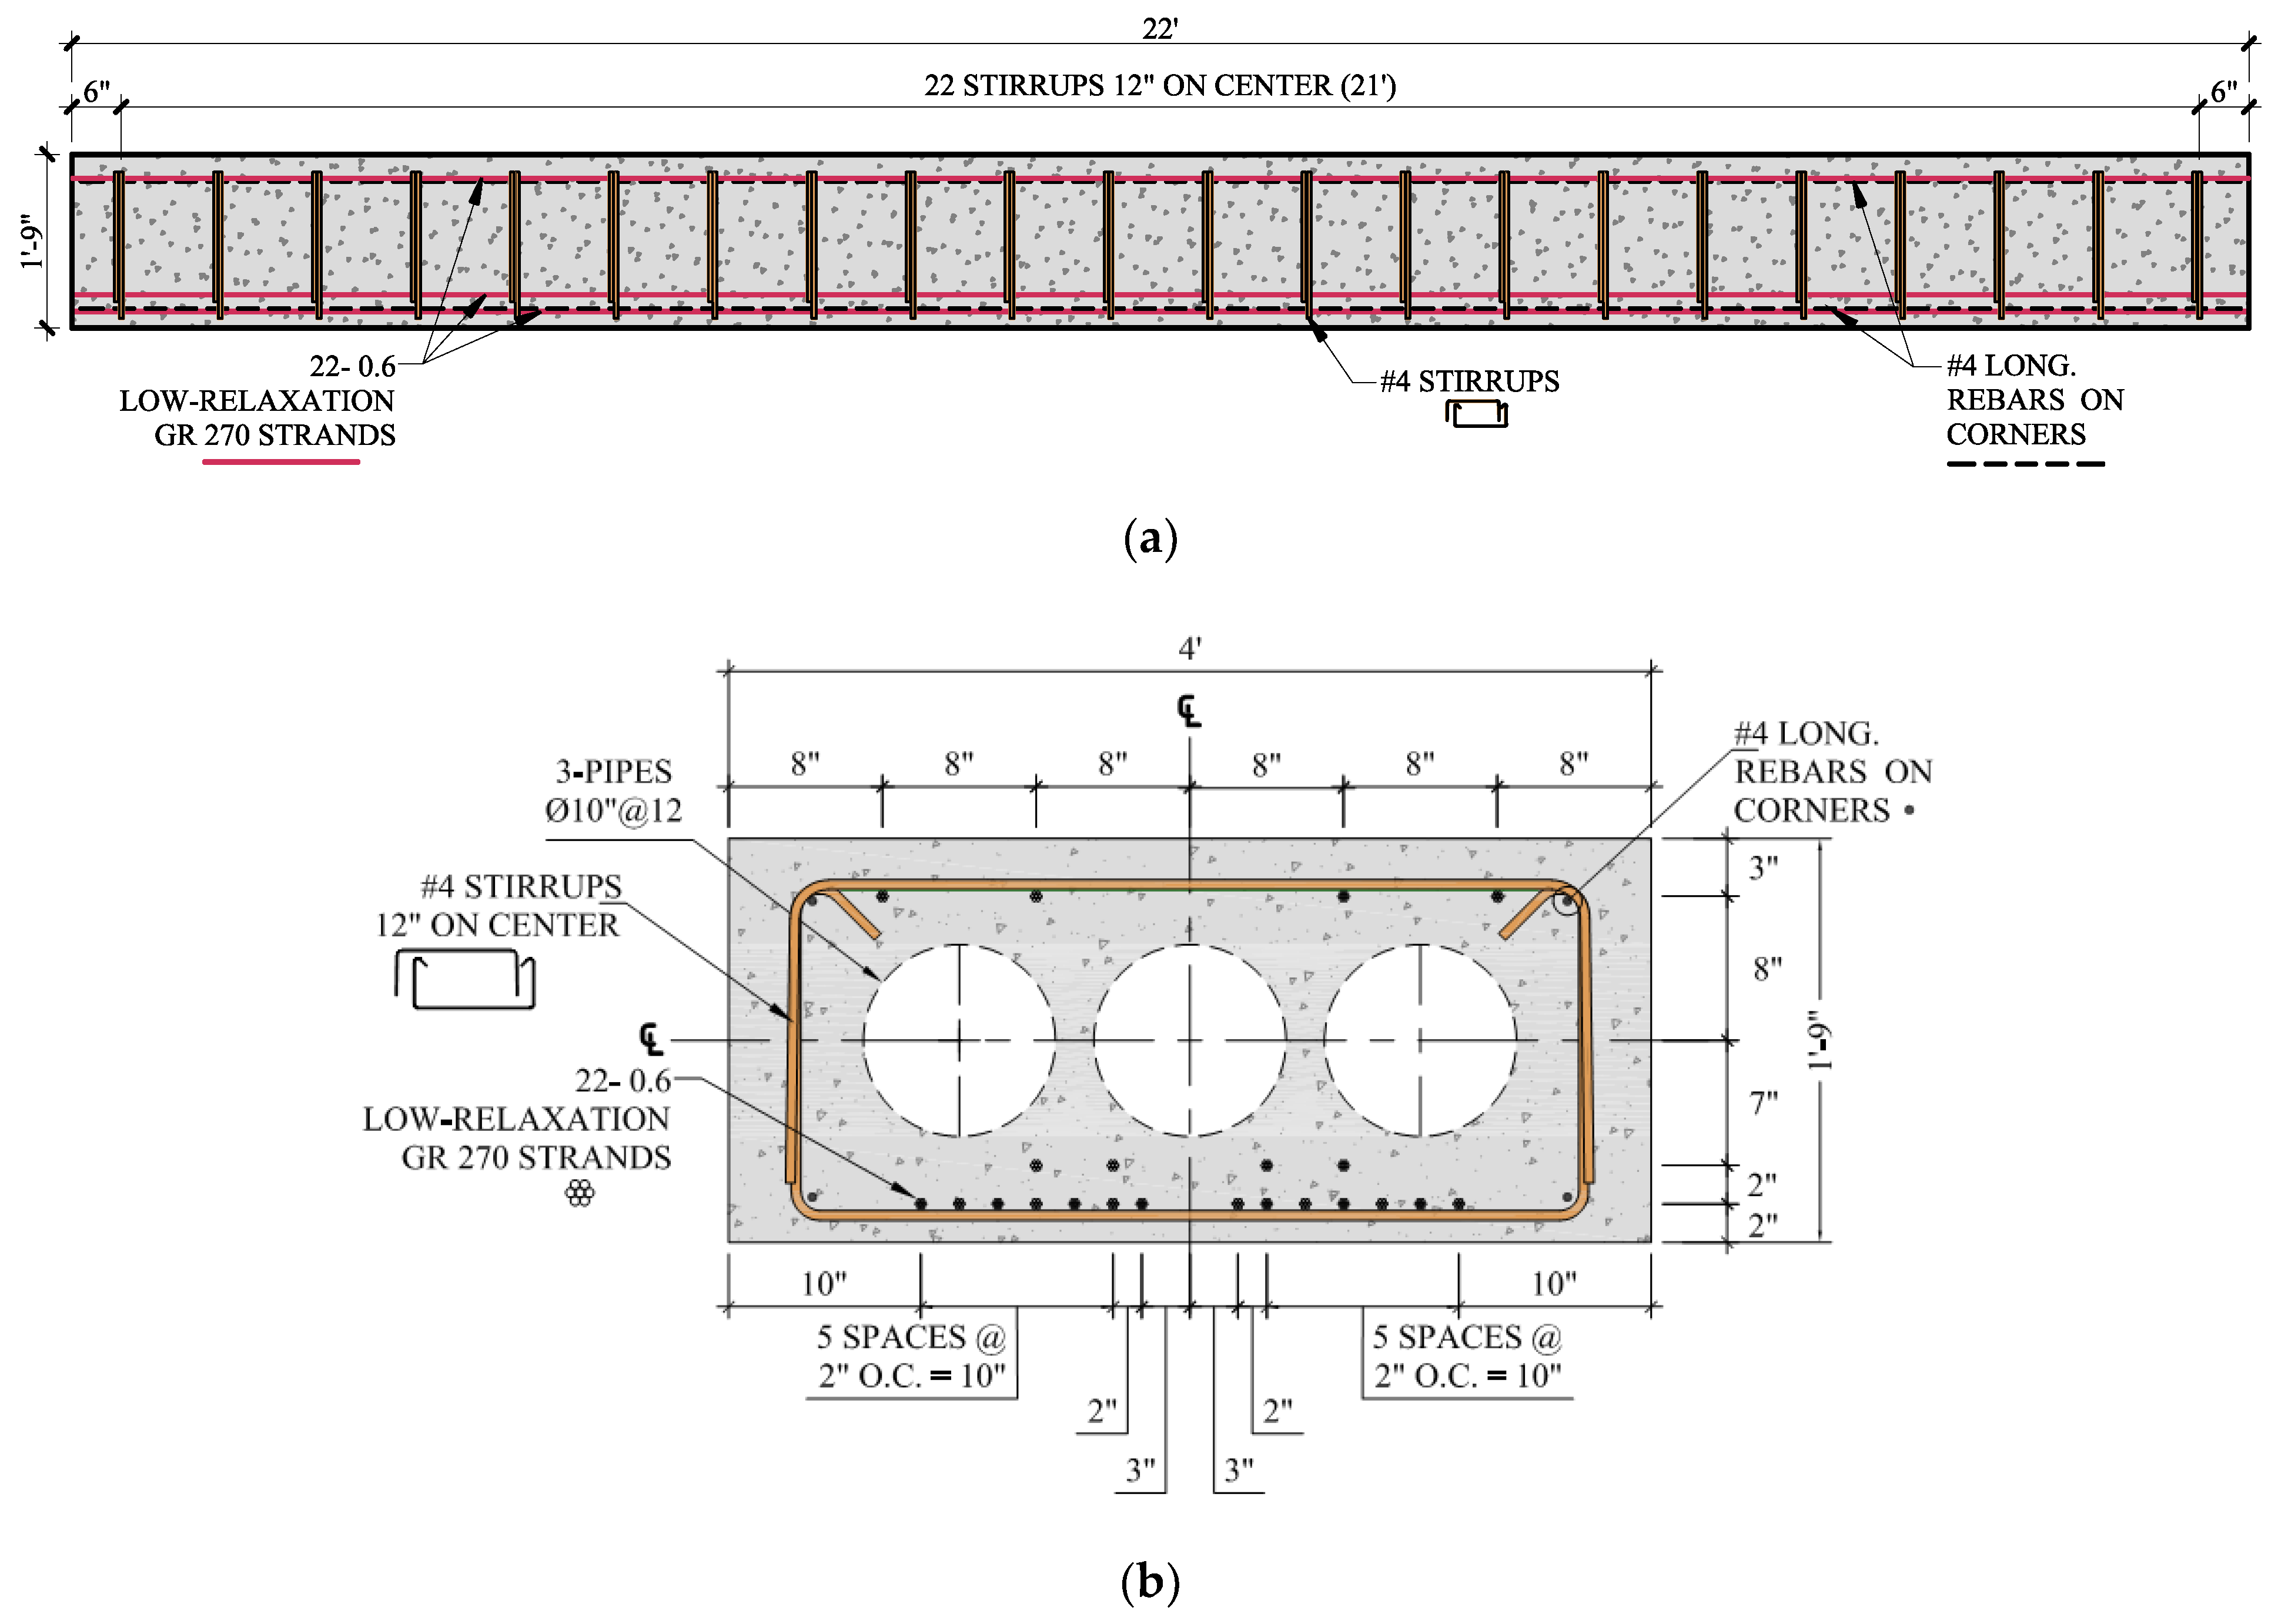
2.2. Voided Deck Slab Bridge Girder
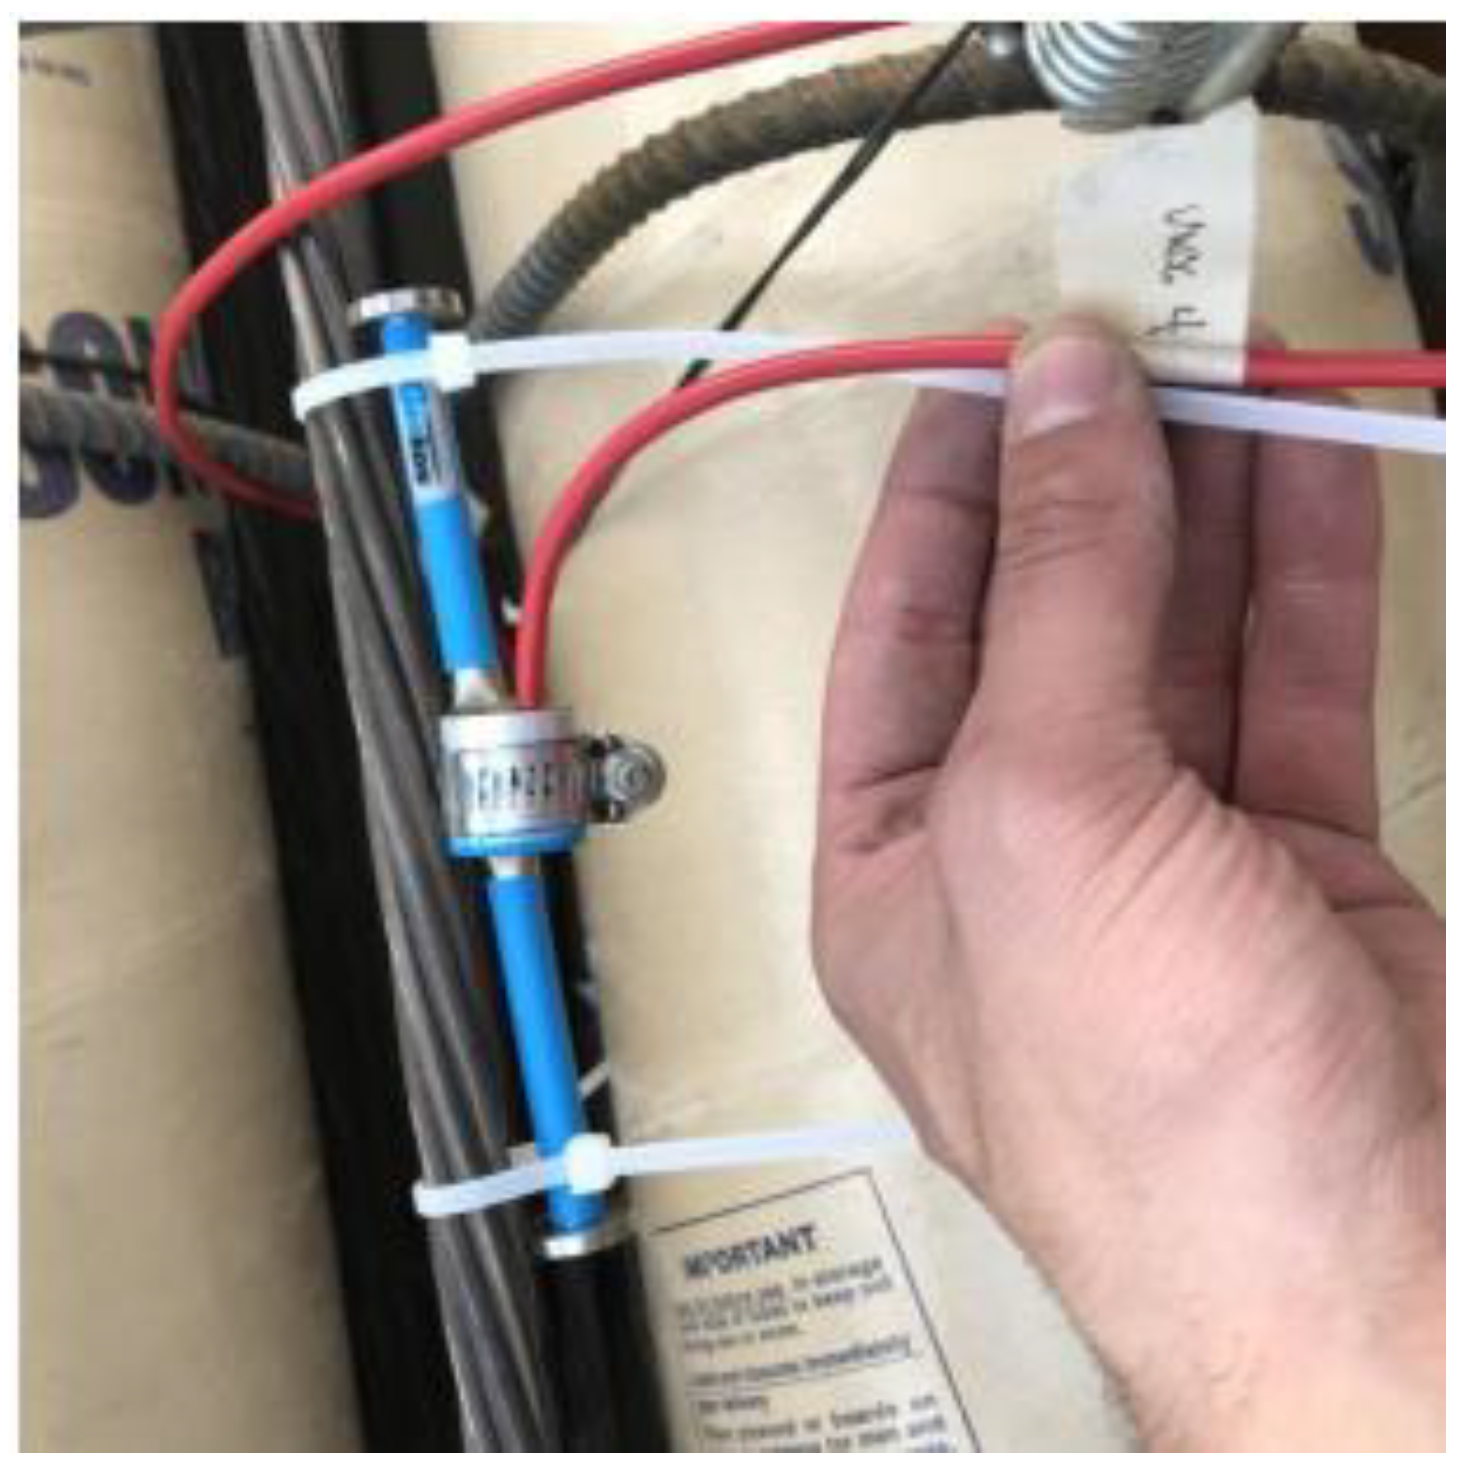
2.2.1. Casting
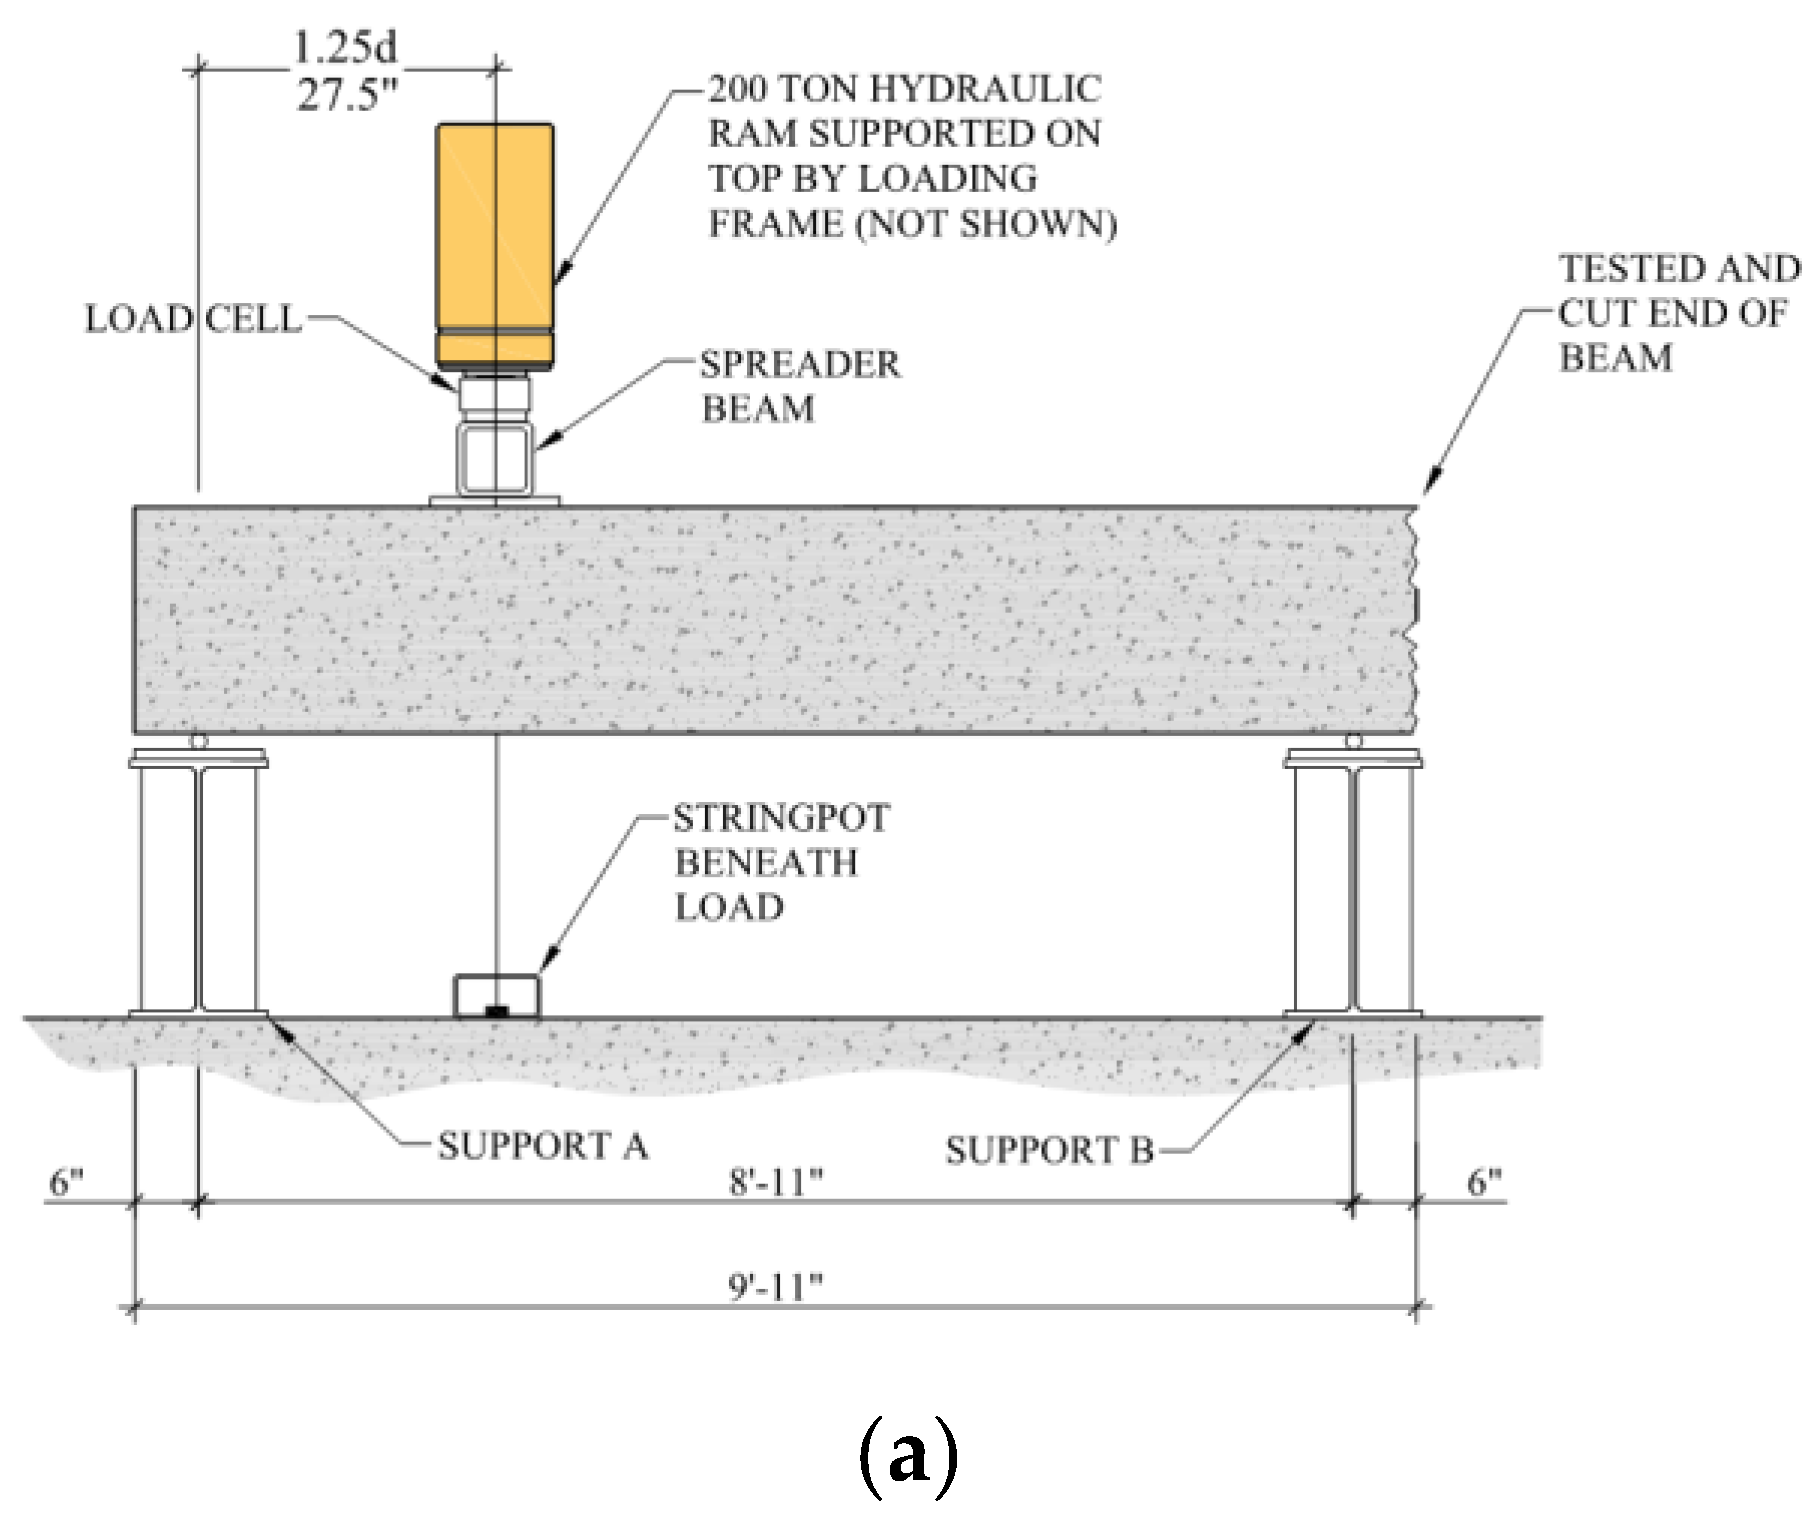
2.2.2. Testing
3. Experimental Results
3.1. Transfer Length
3.2. Prestress Losses
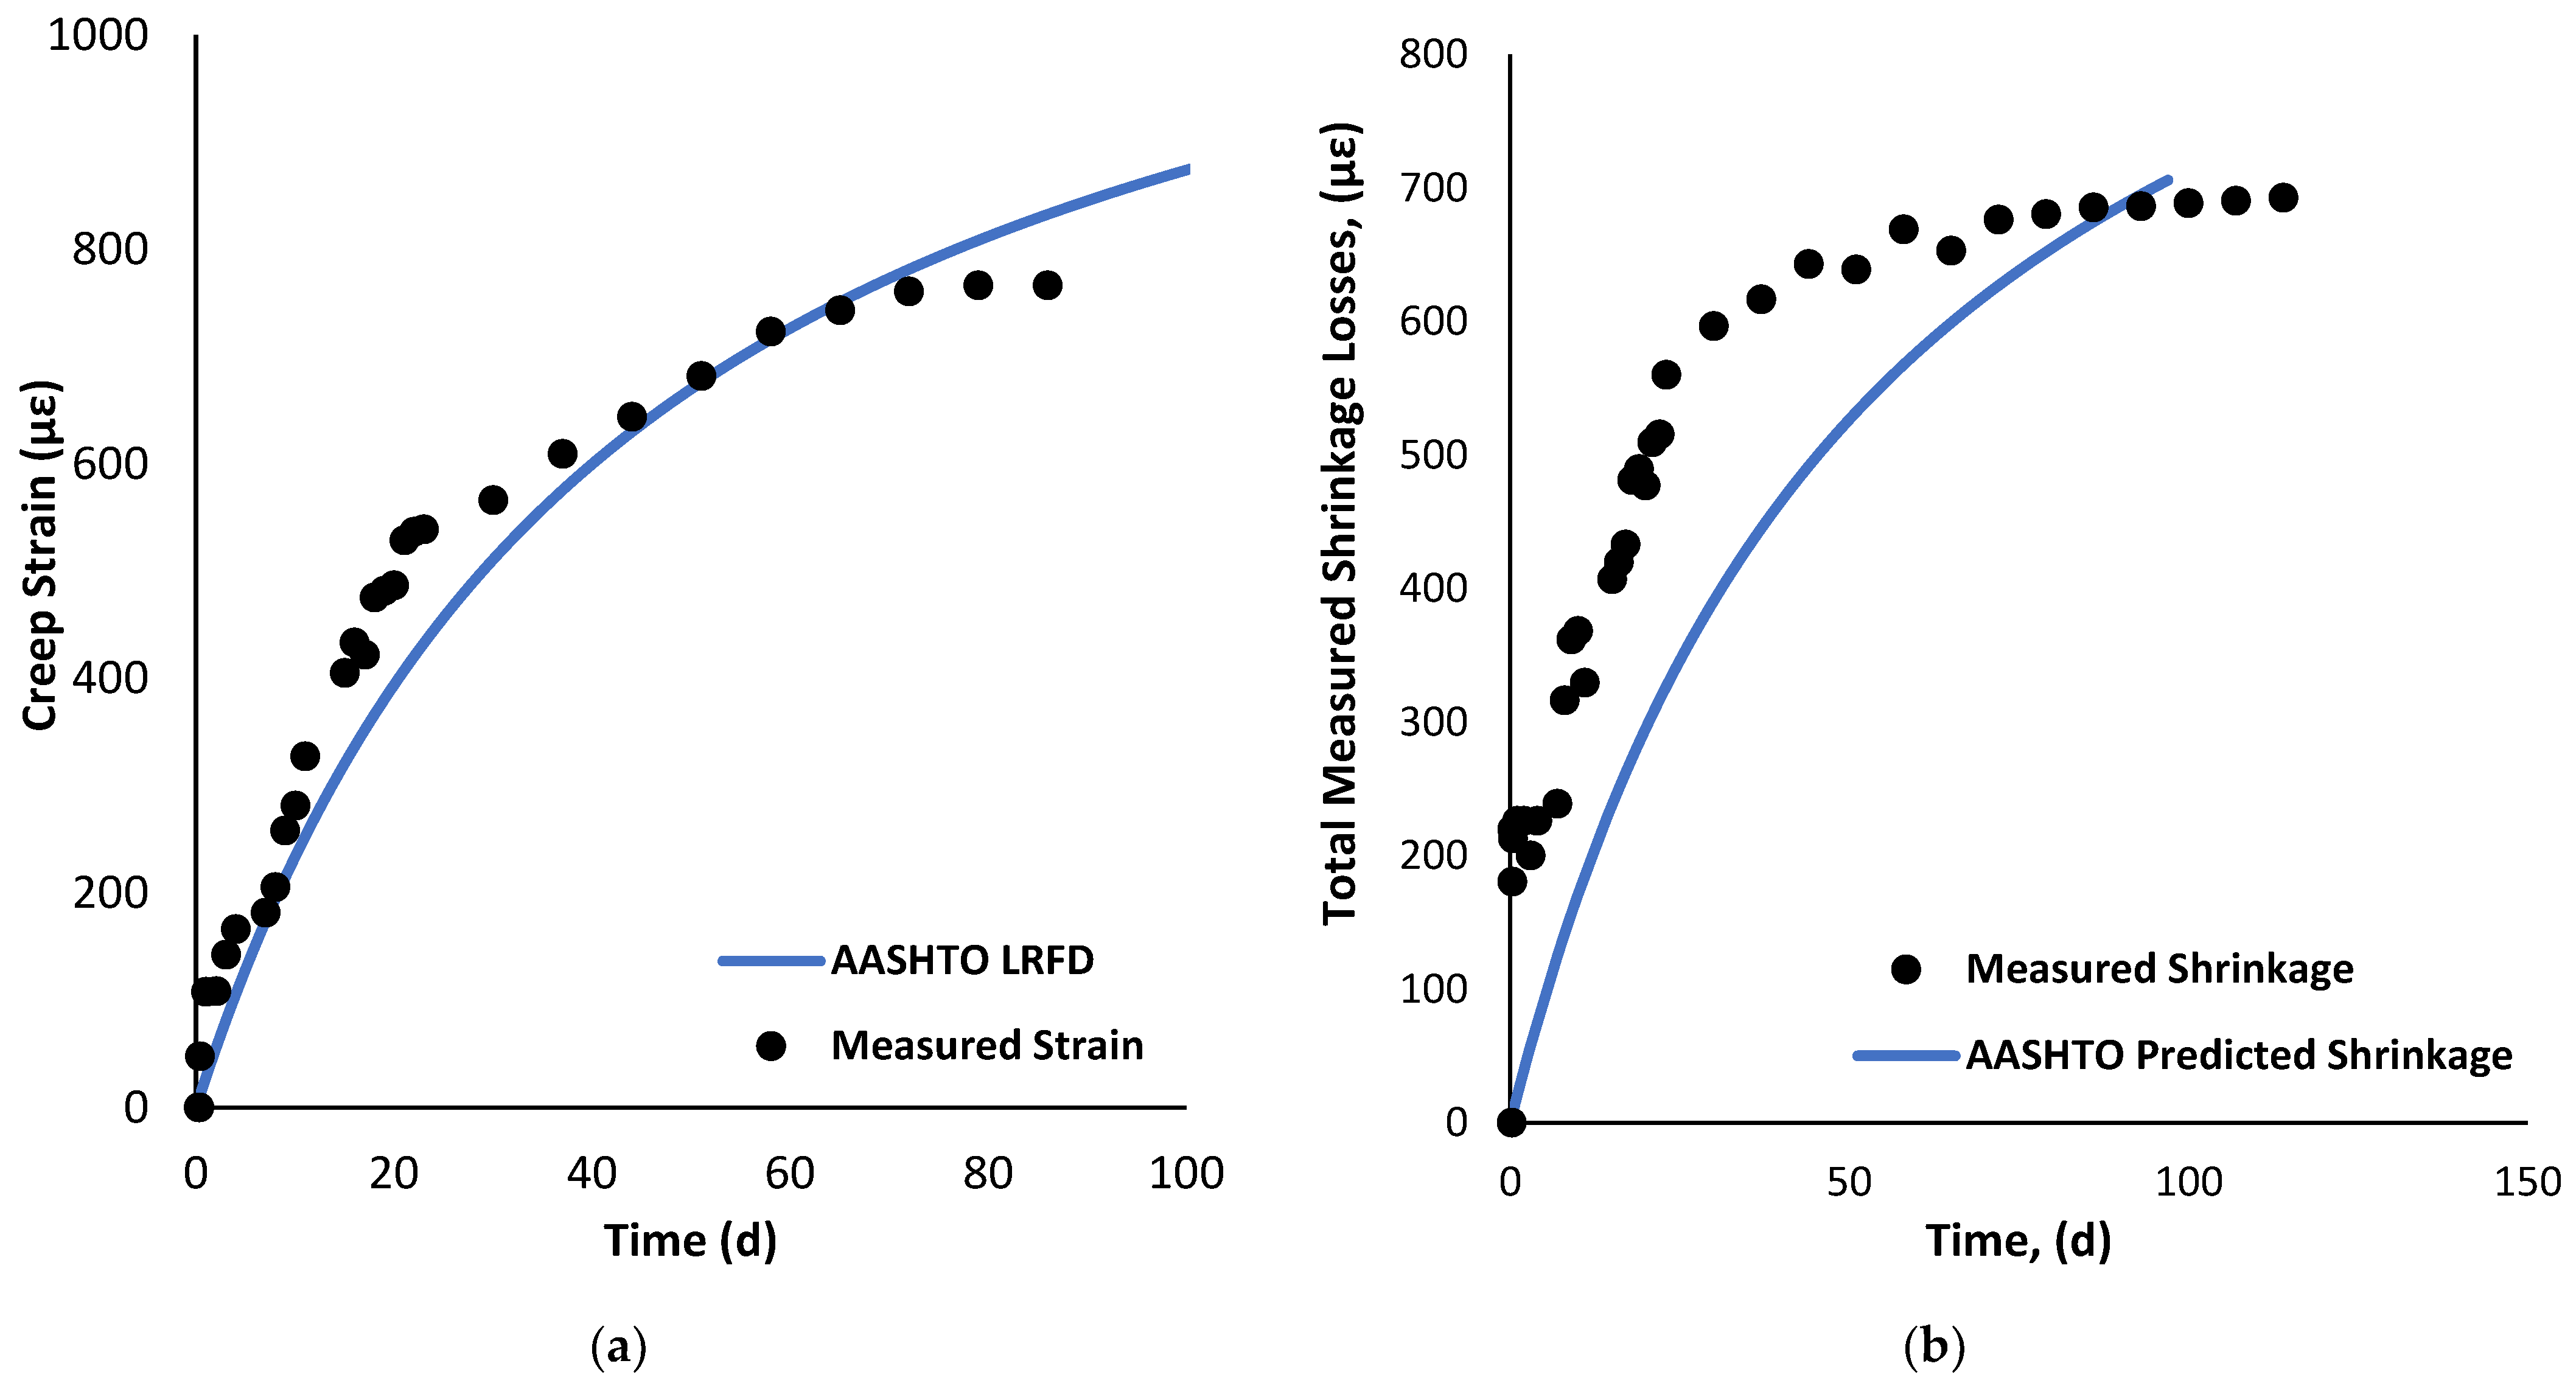
3.2.1. Creep
3.2.2. Shrinkage
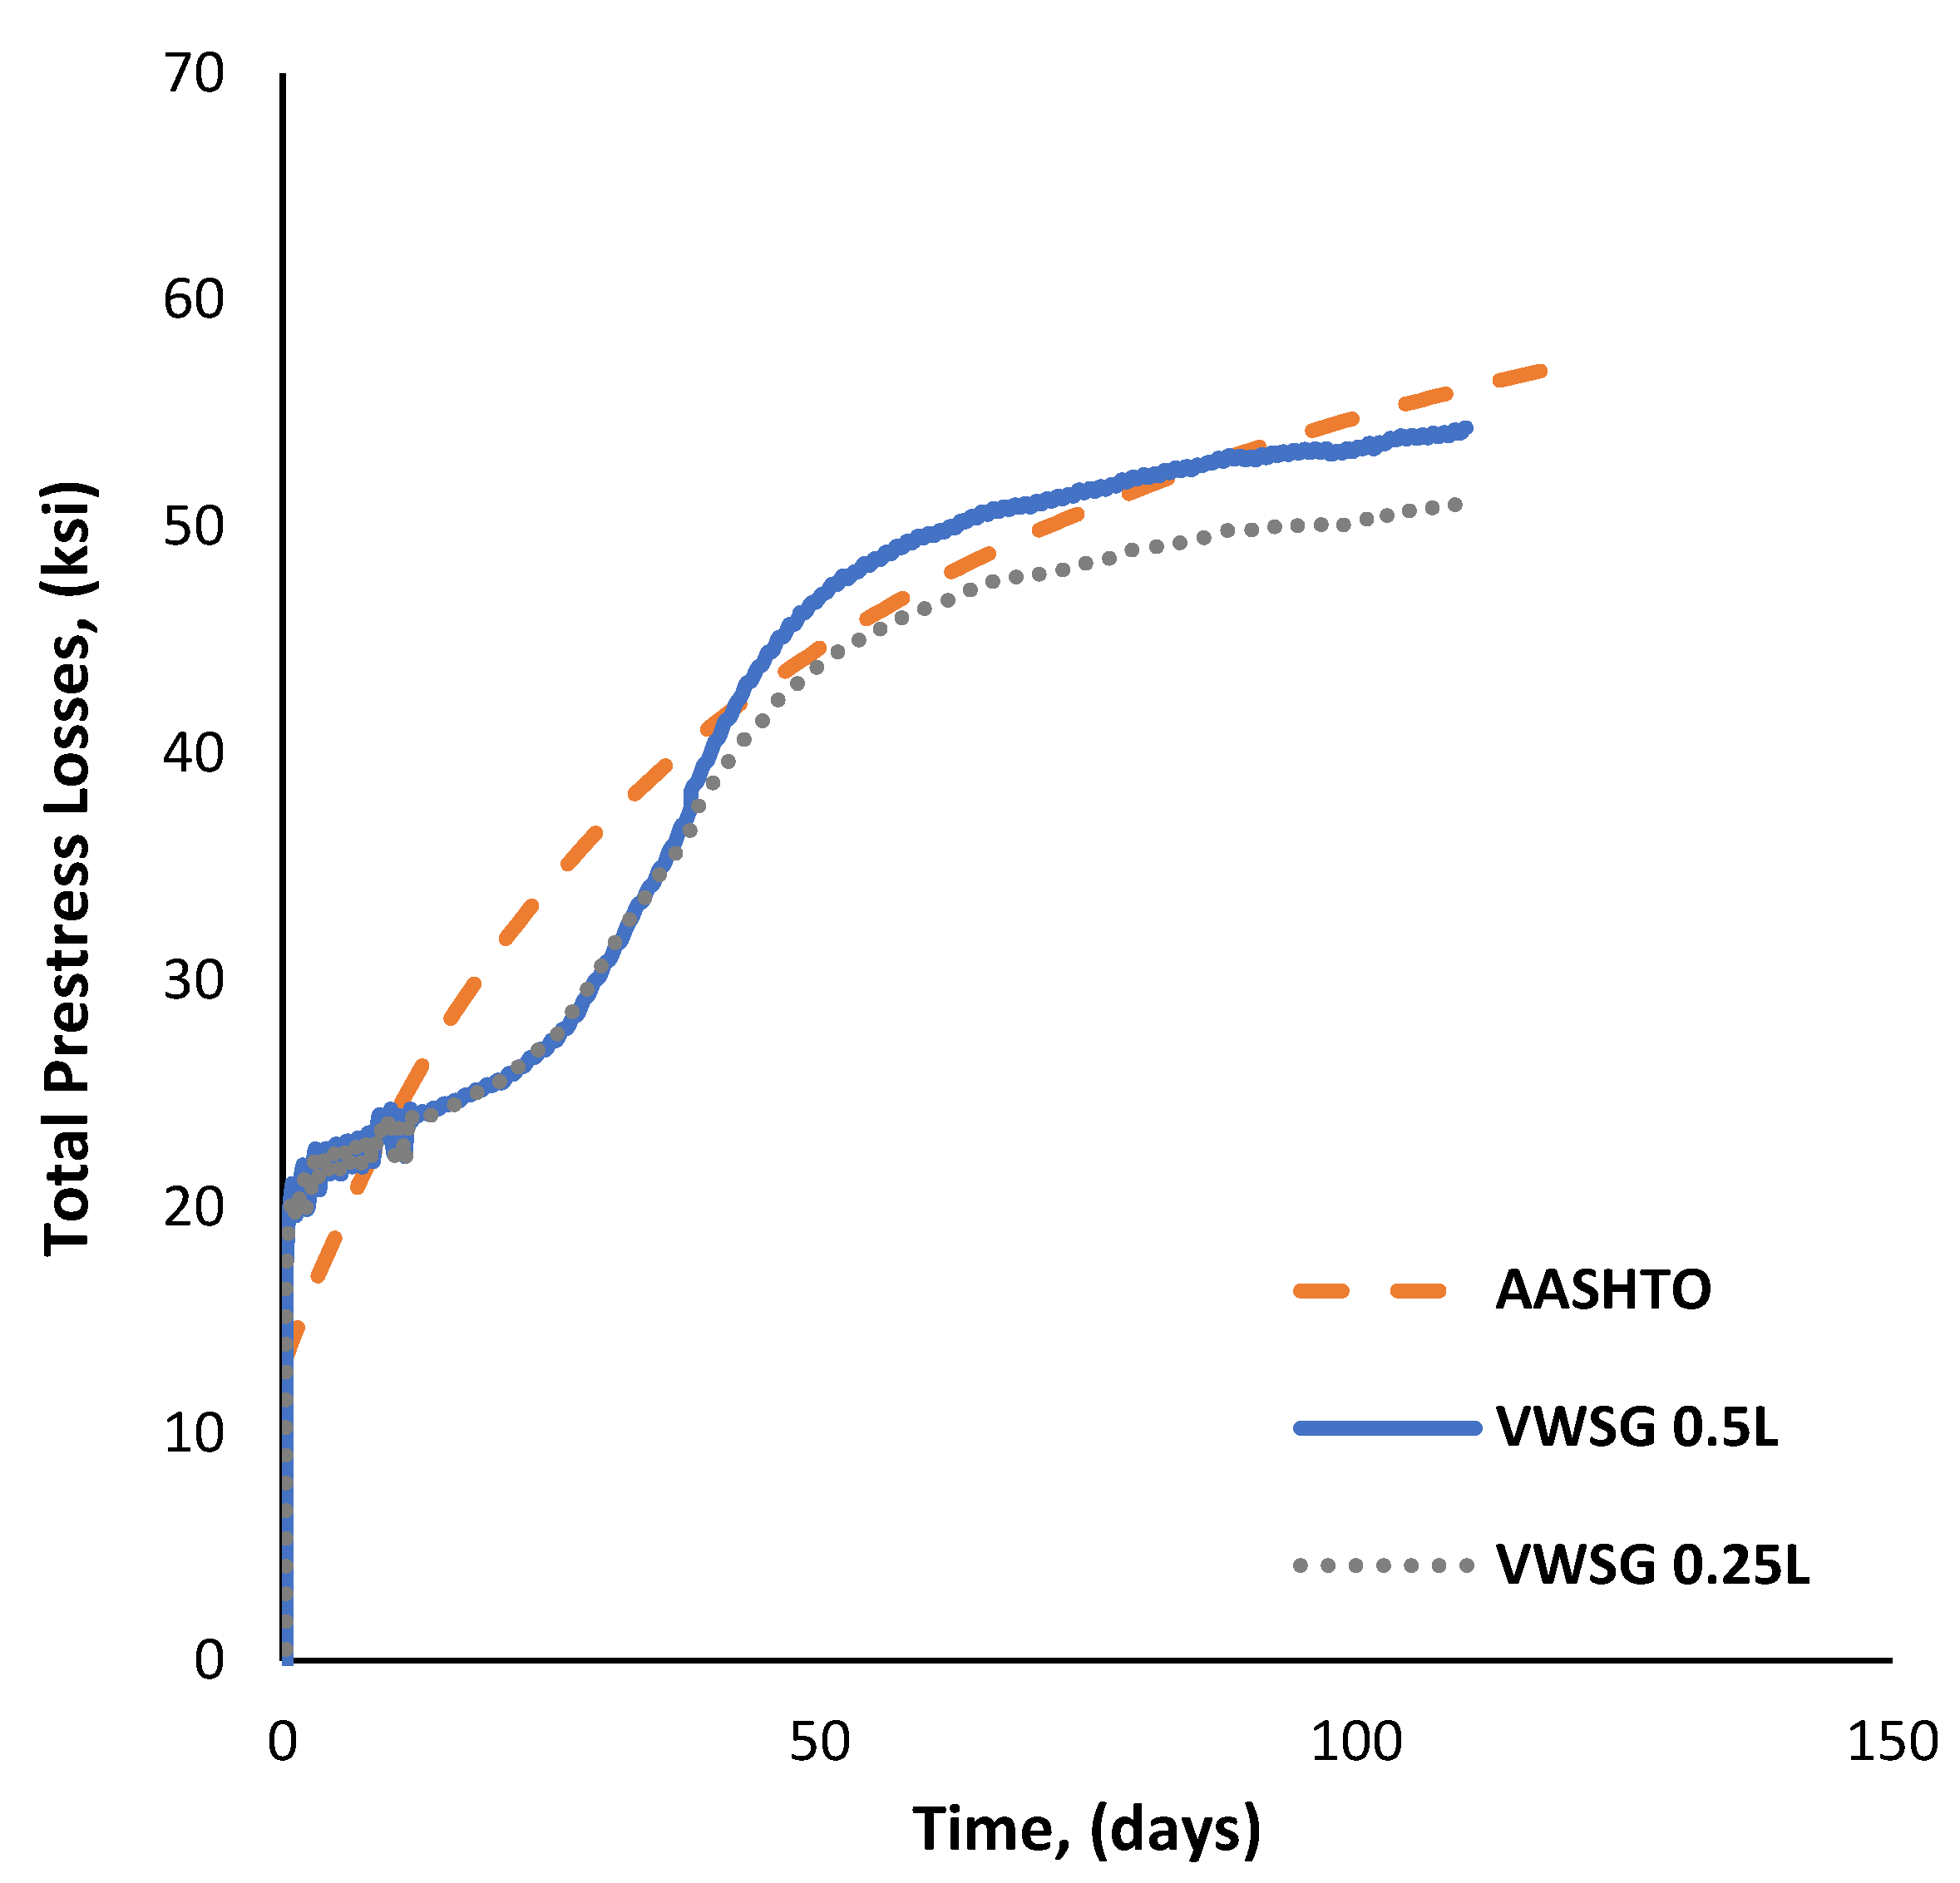
3.2.3. Total Prestressing Losses
3.2.4. Camber
3.3. Beam Testing
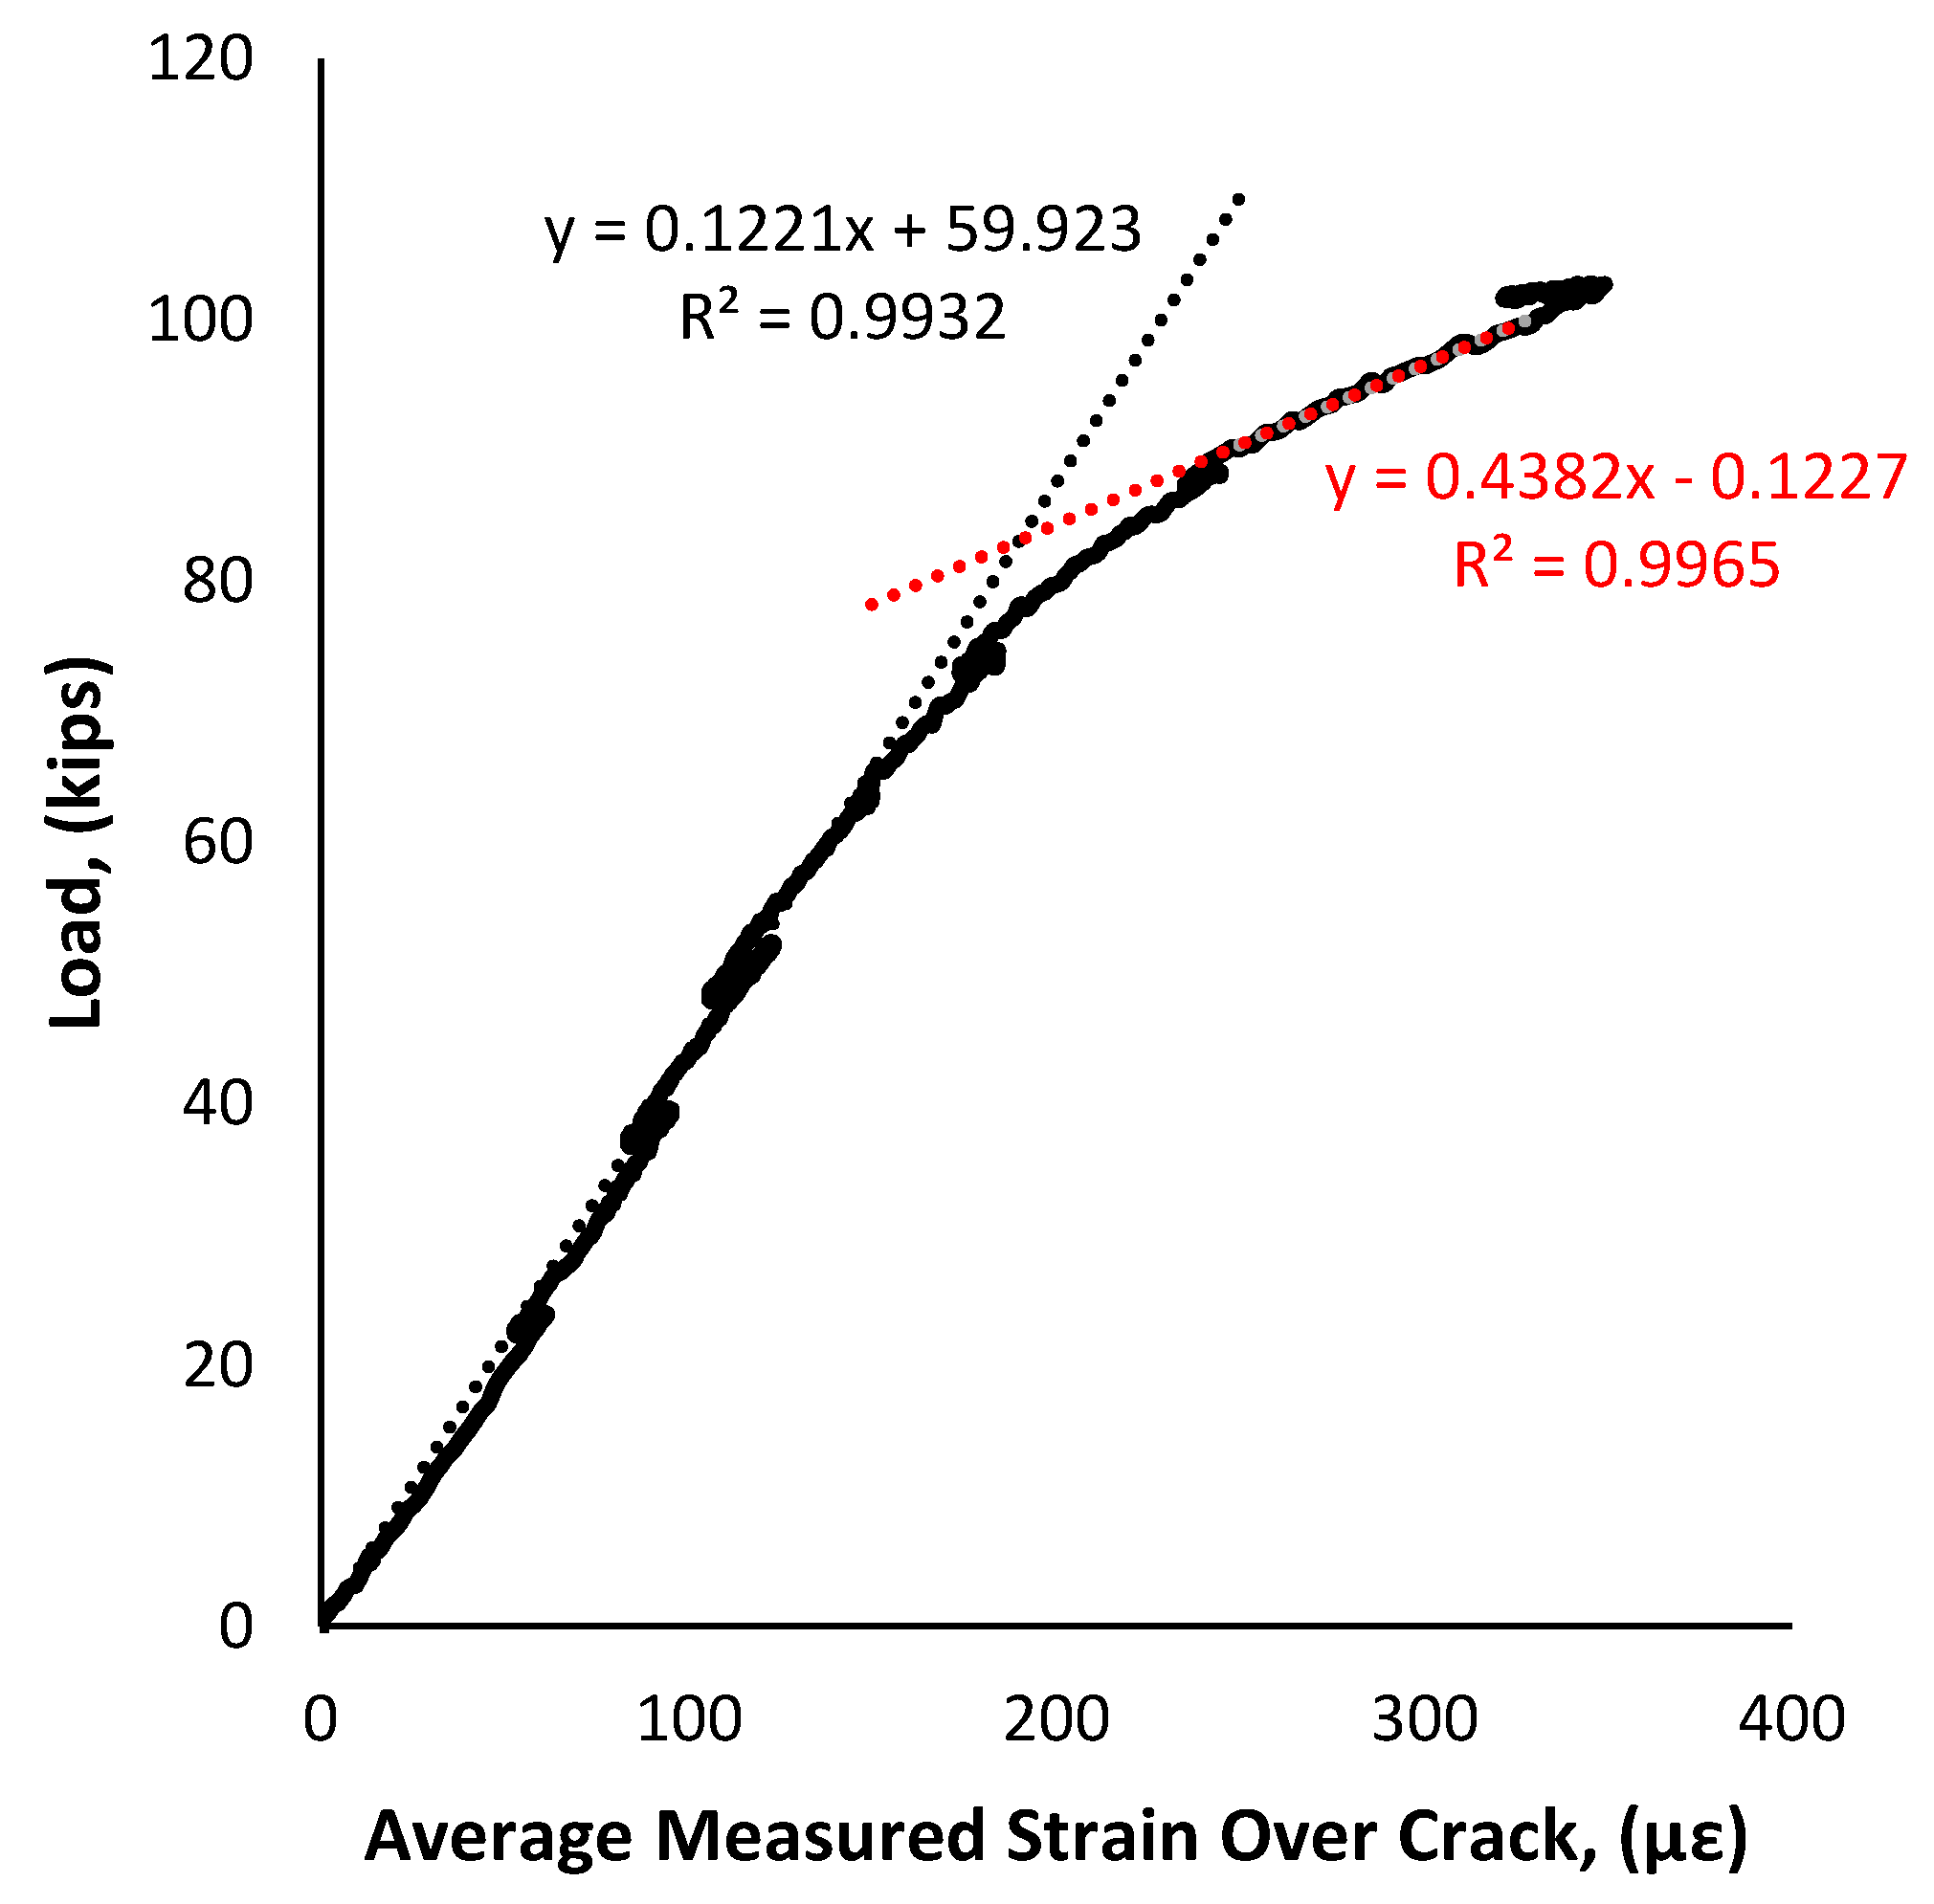
3.3.1. Crack Initiation and Reopening
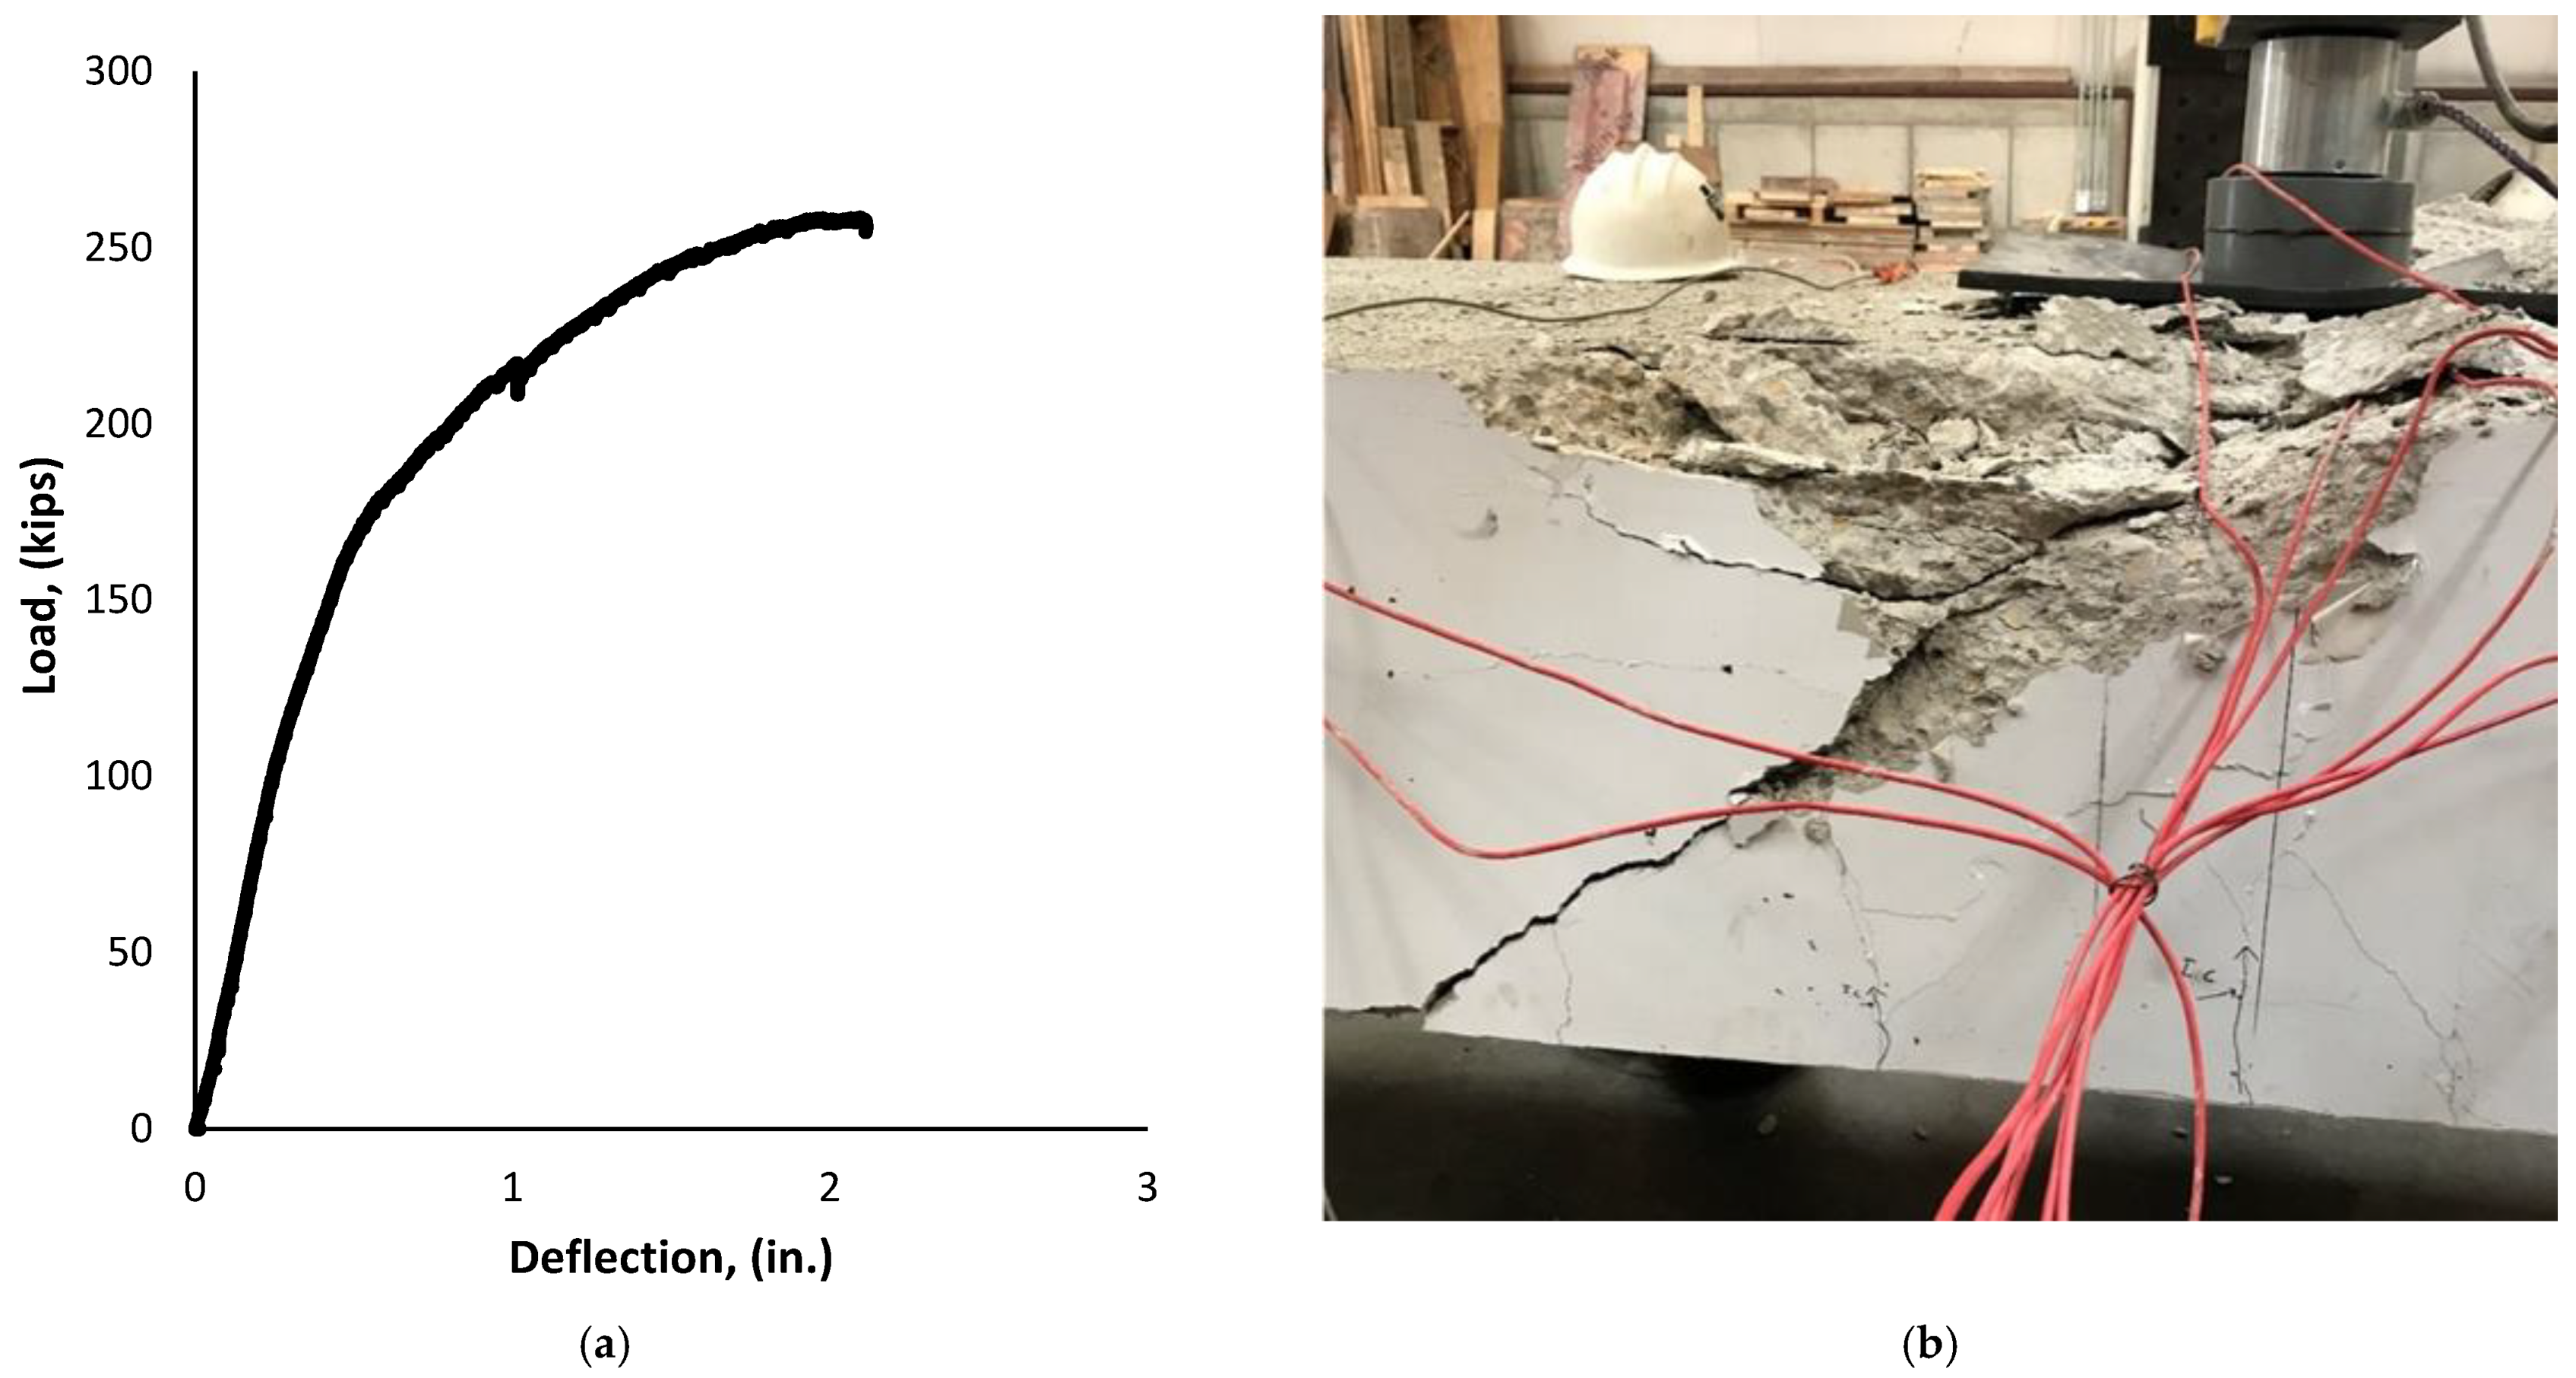
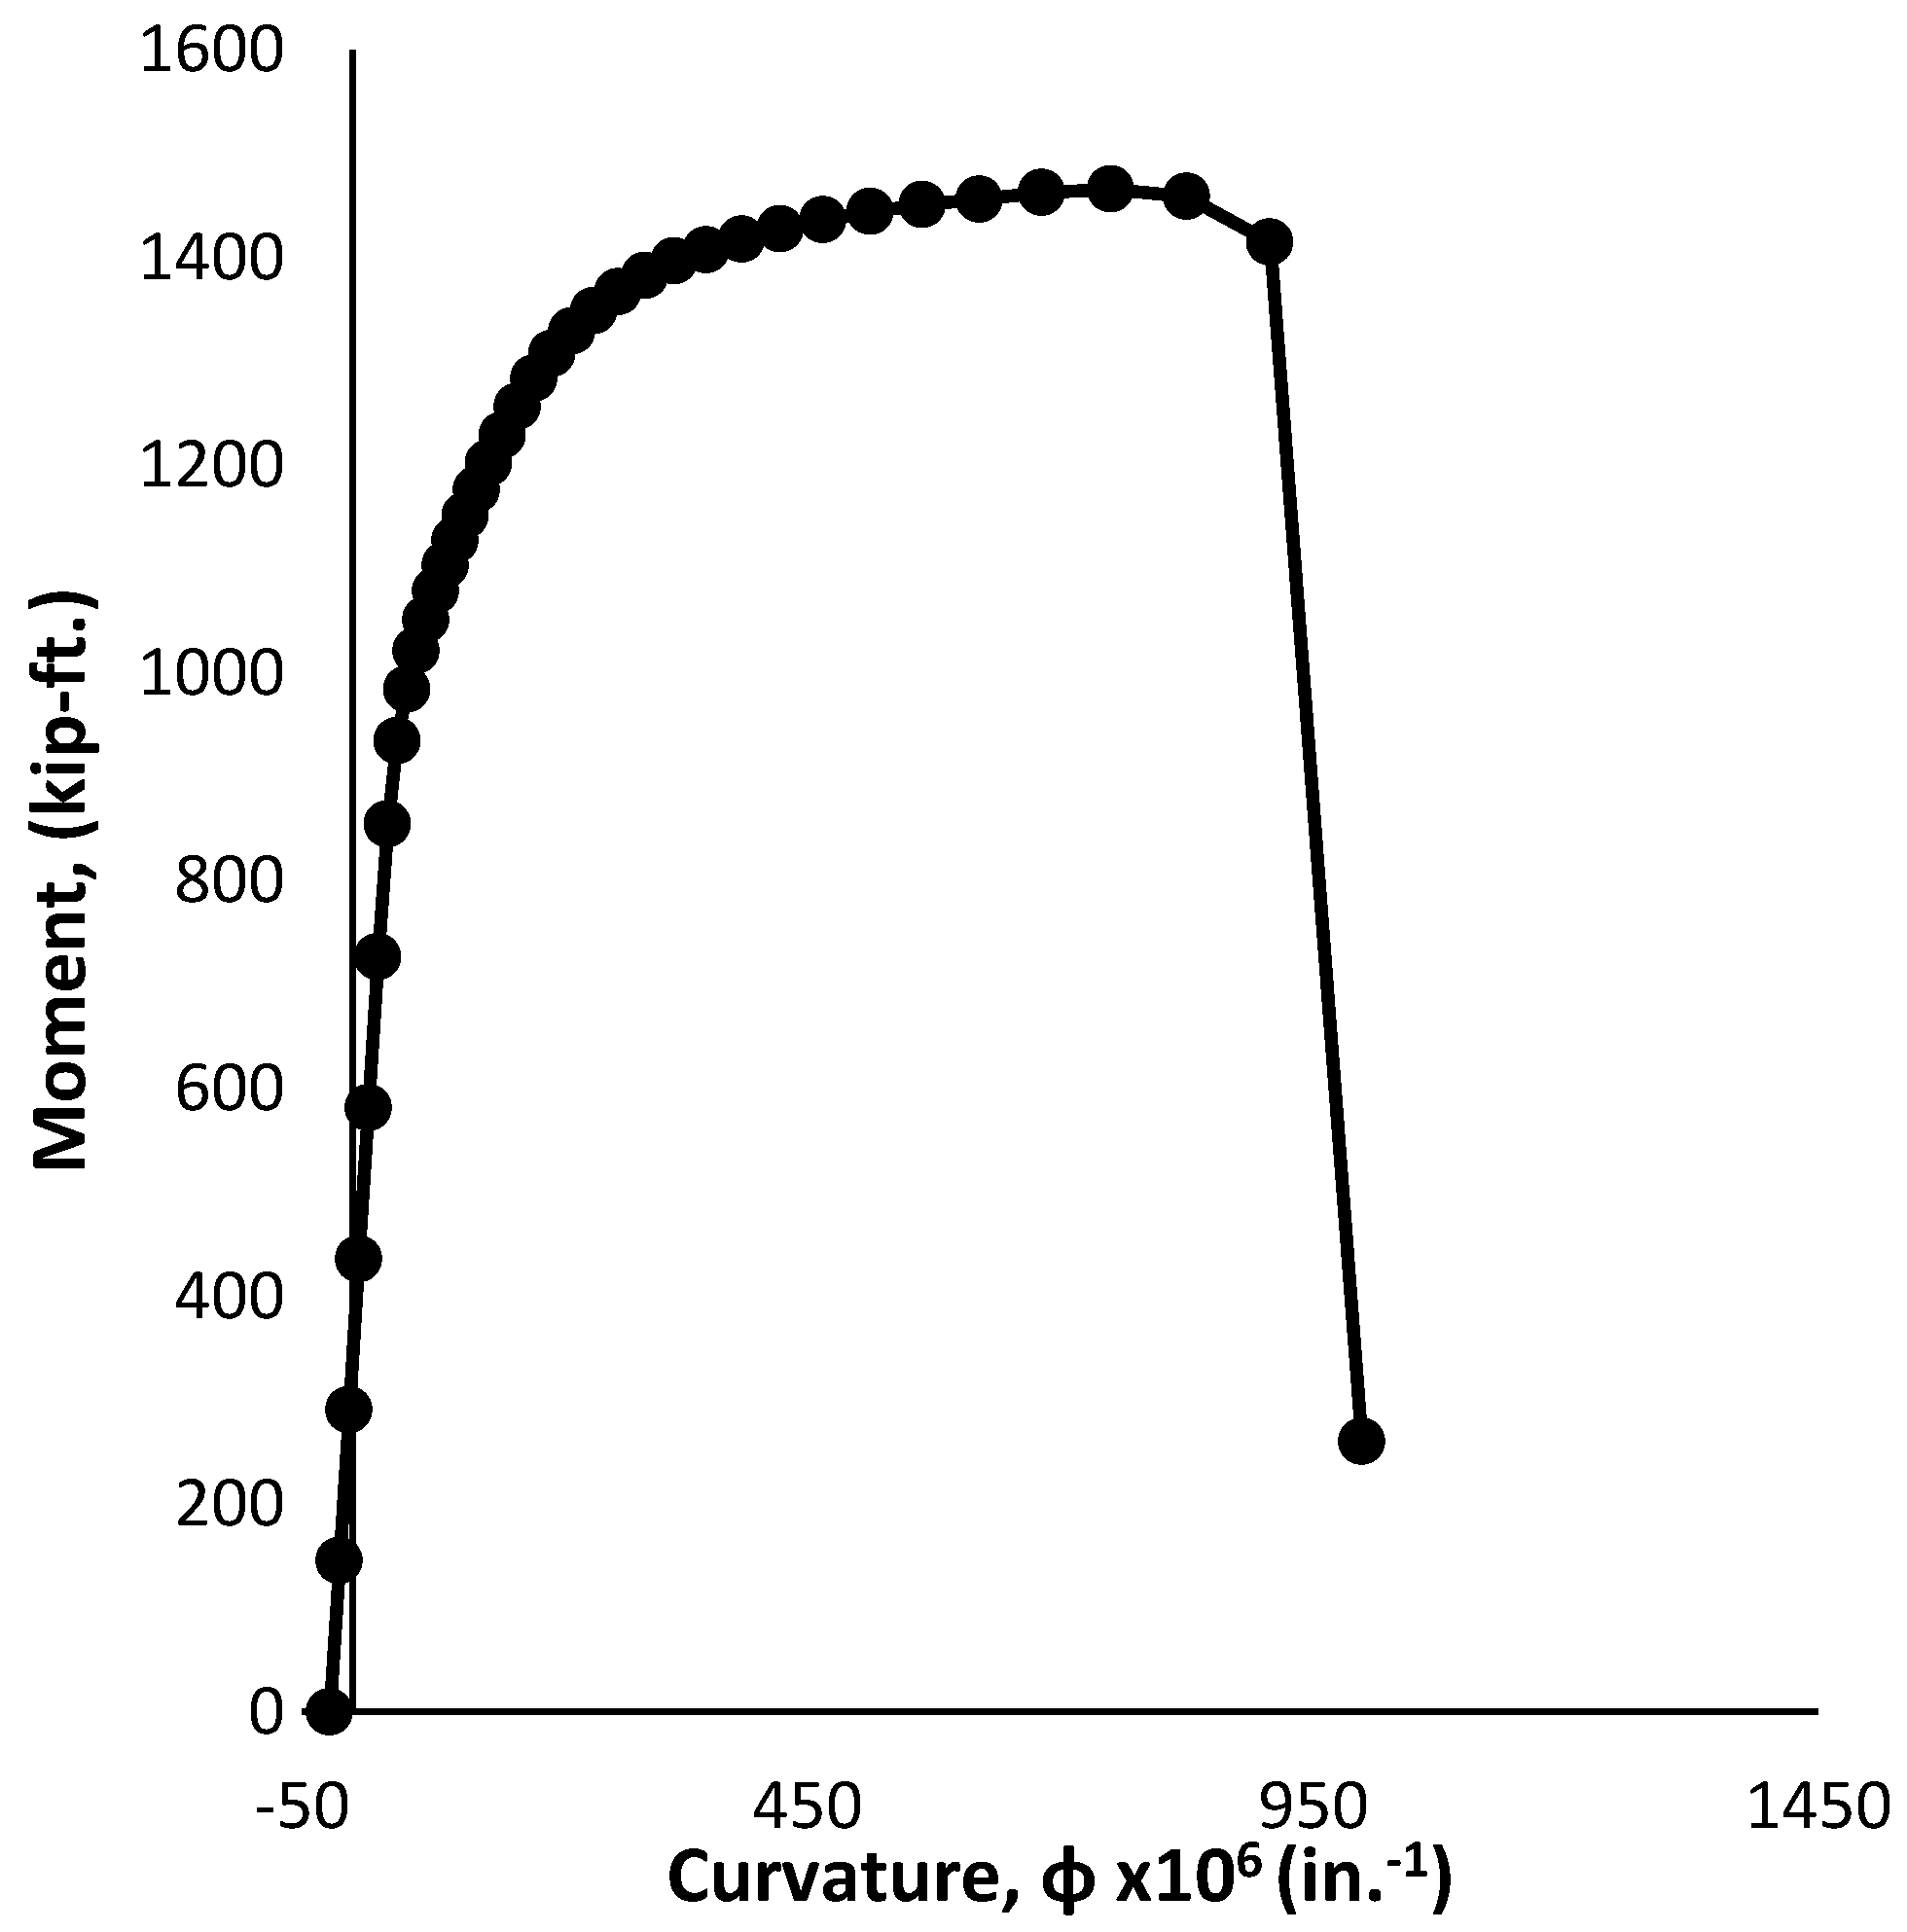
3.3.2. Load at Midspan
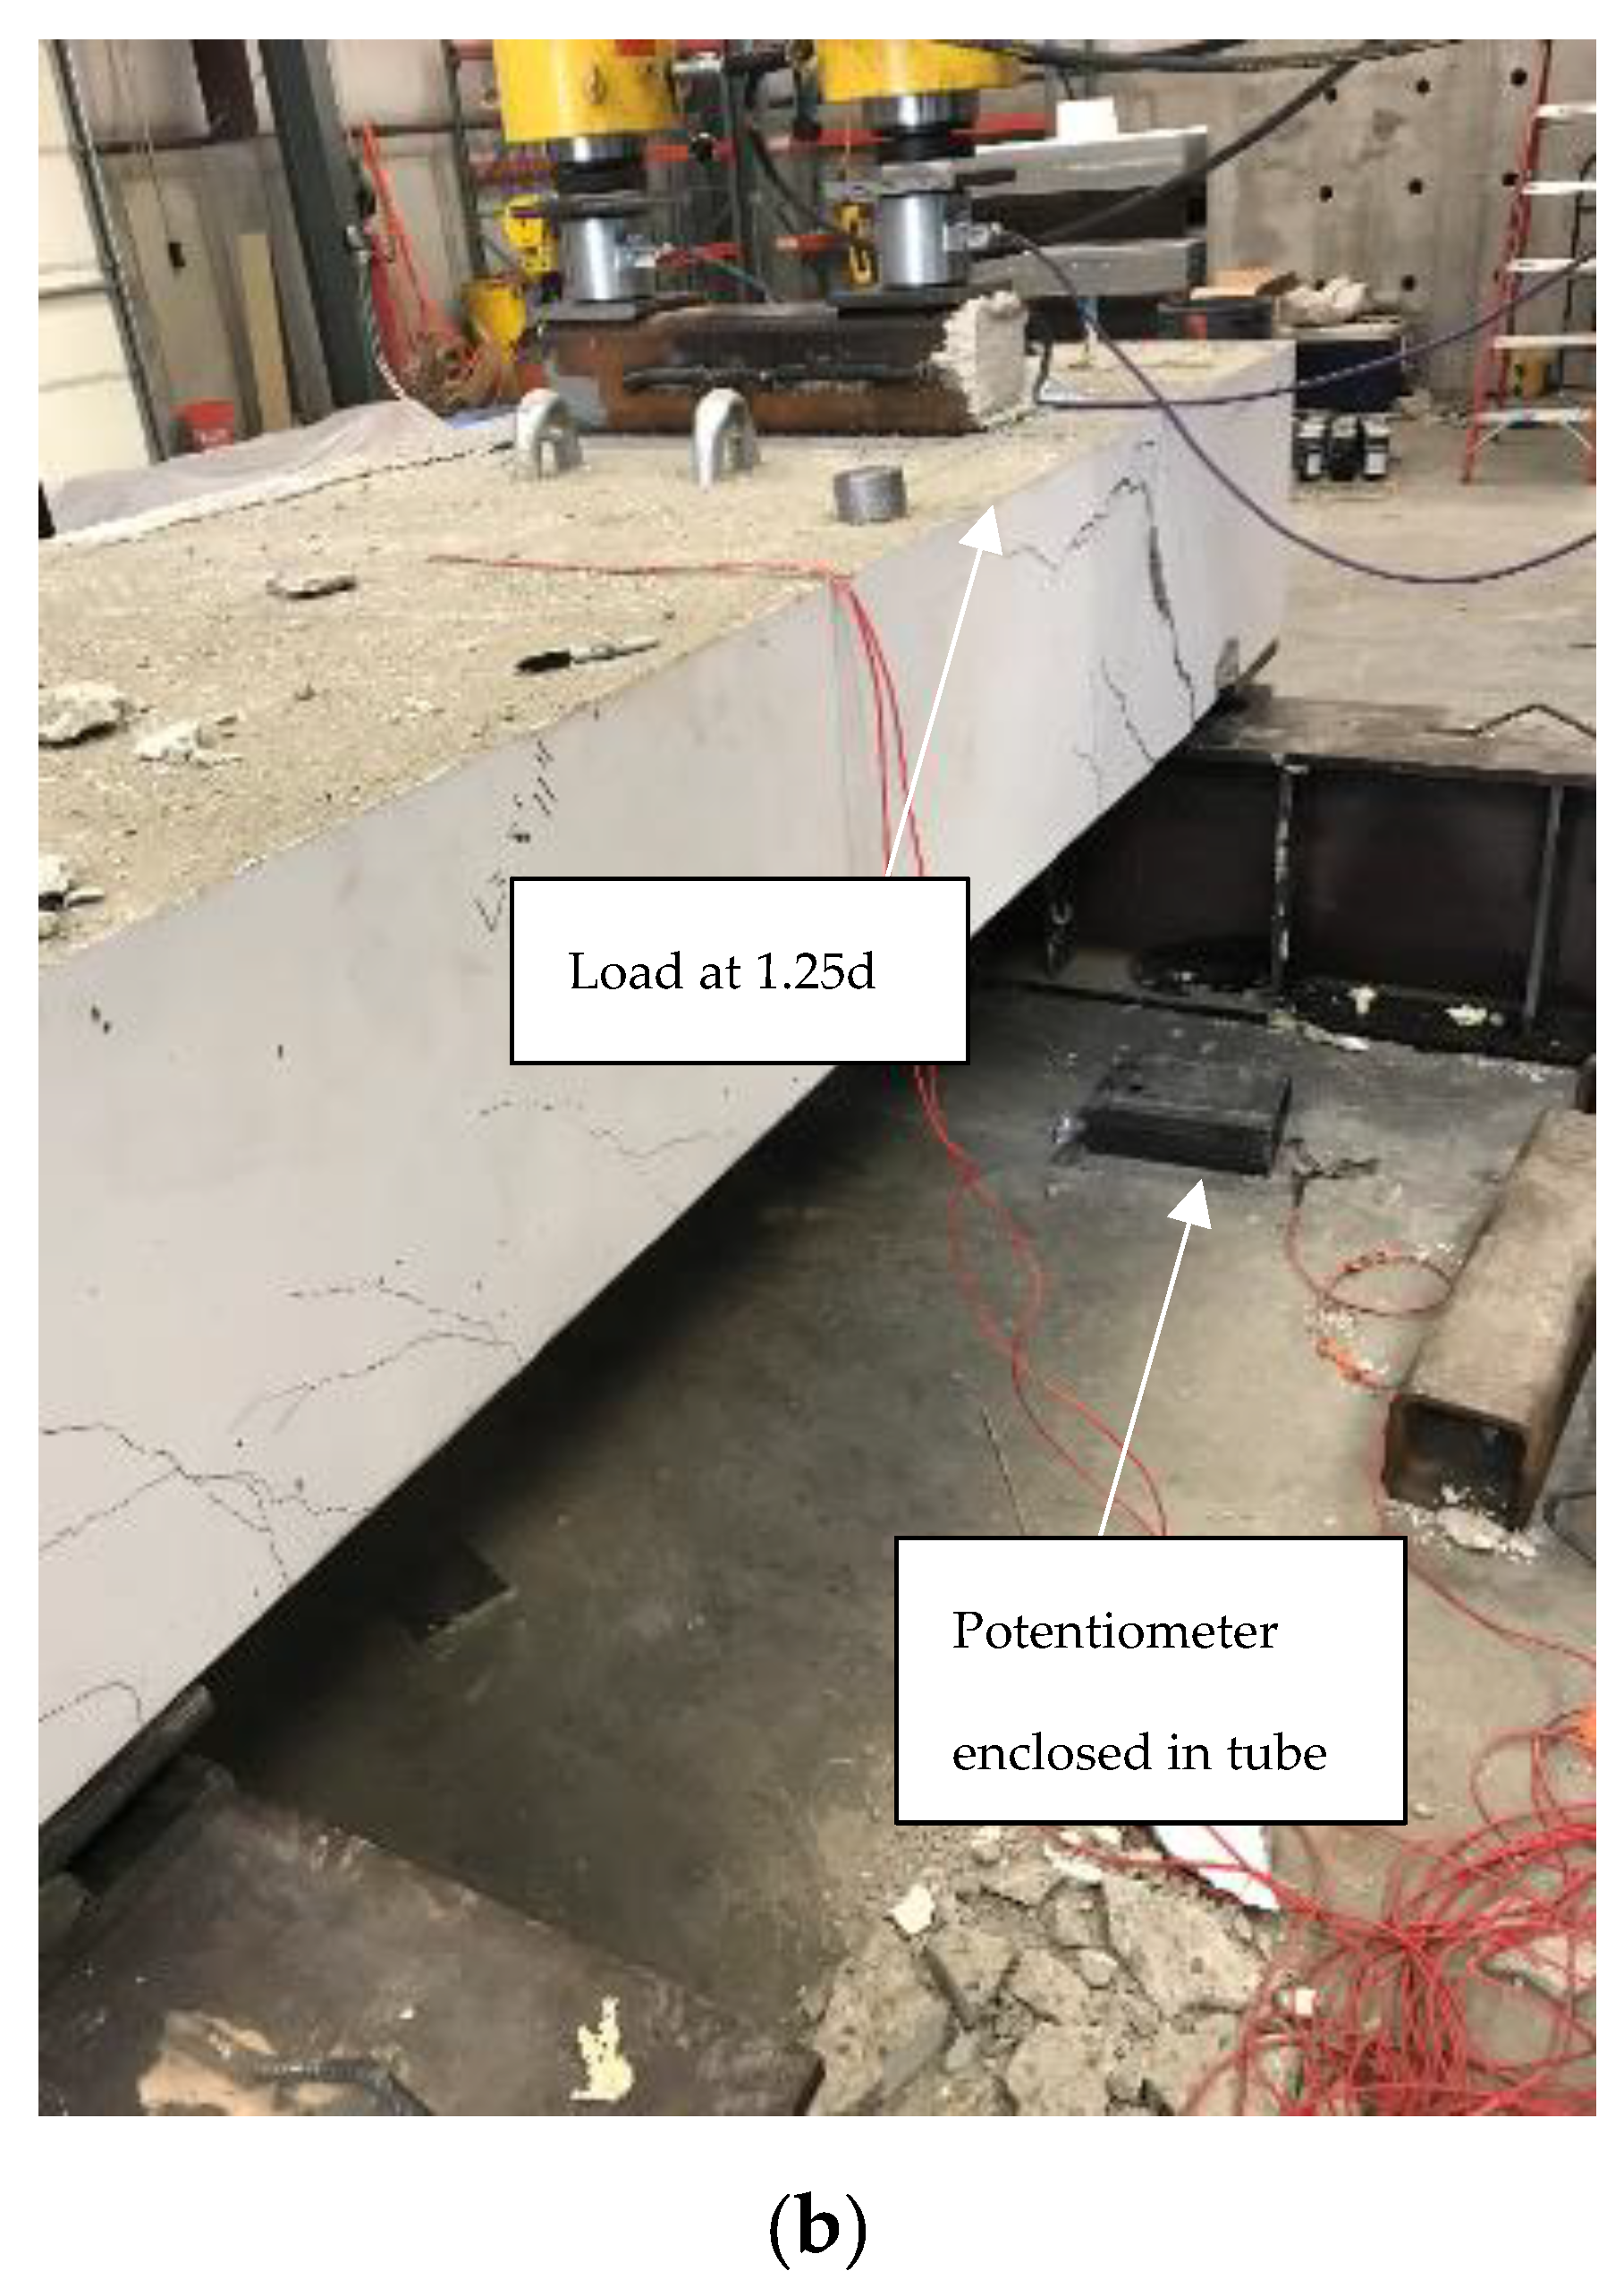
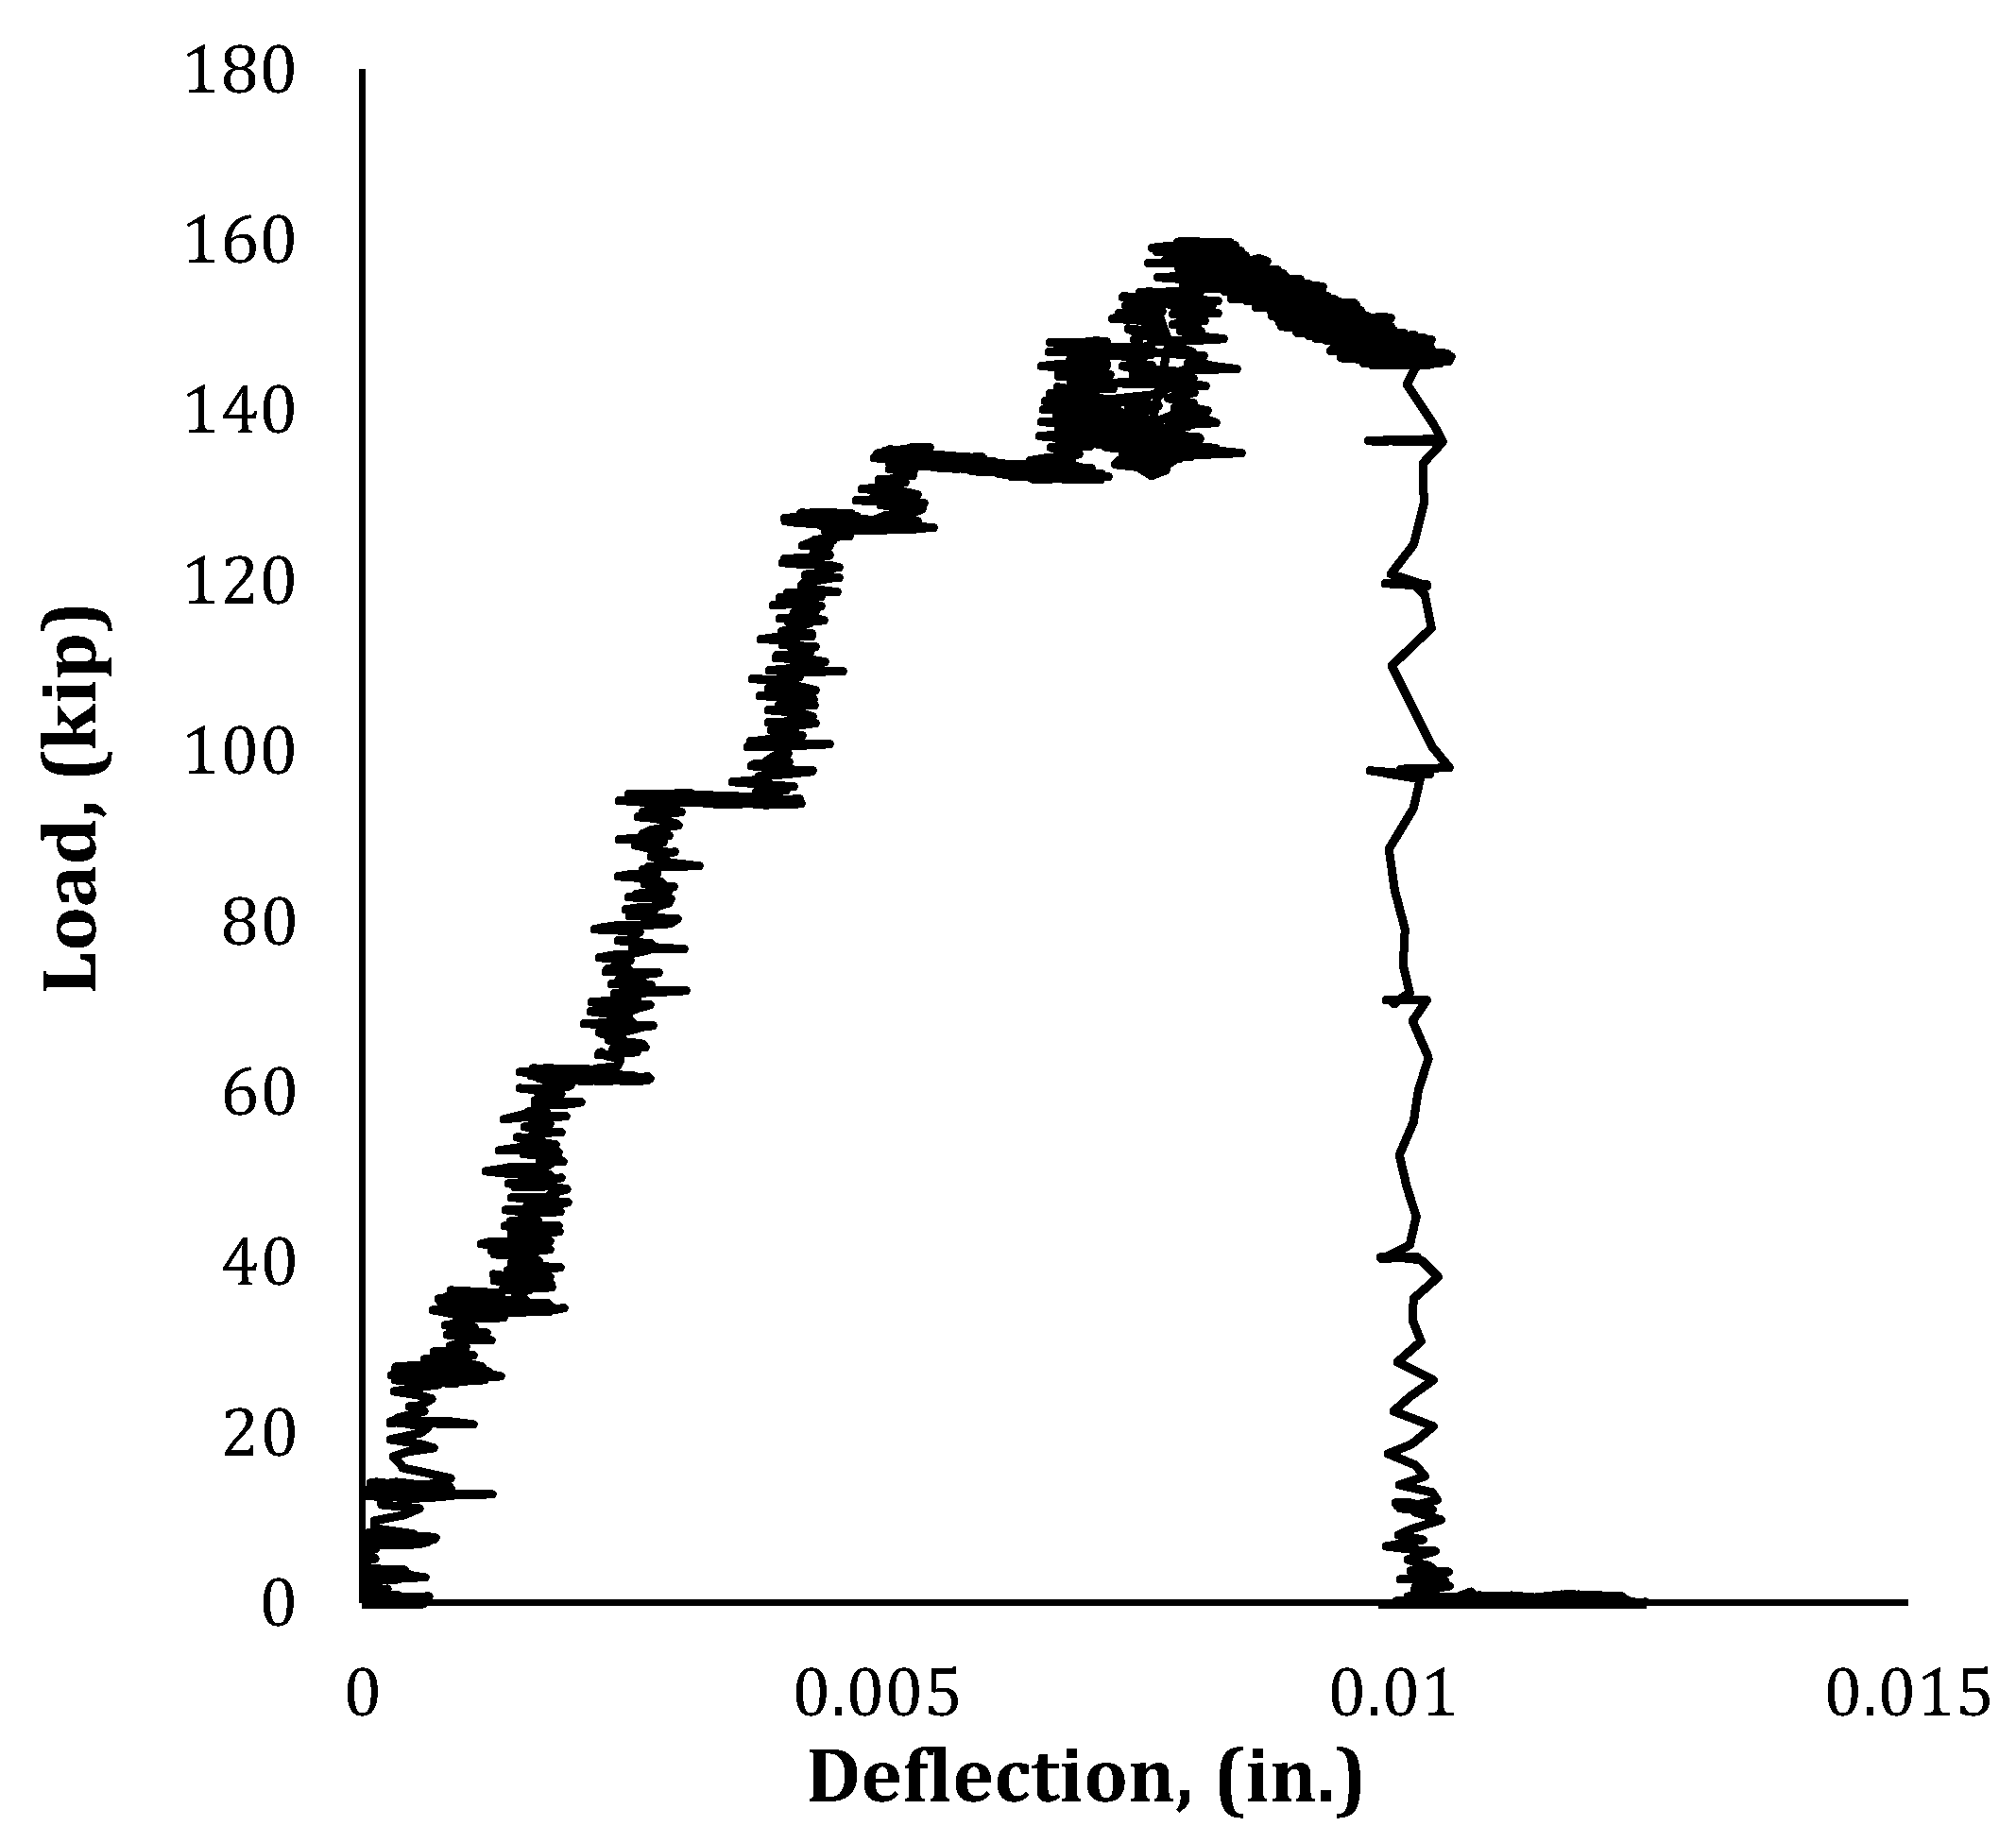
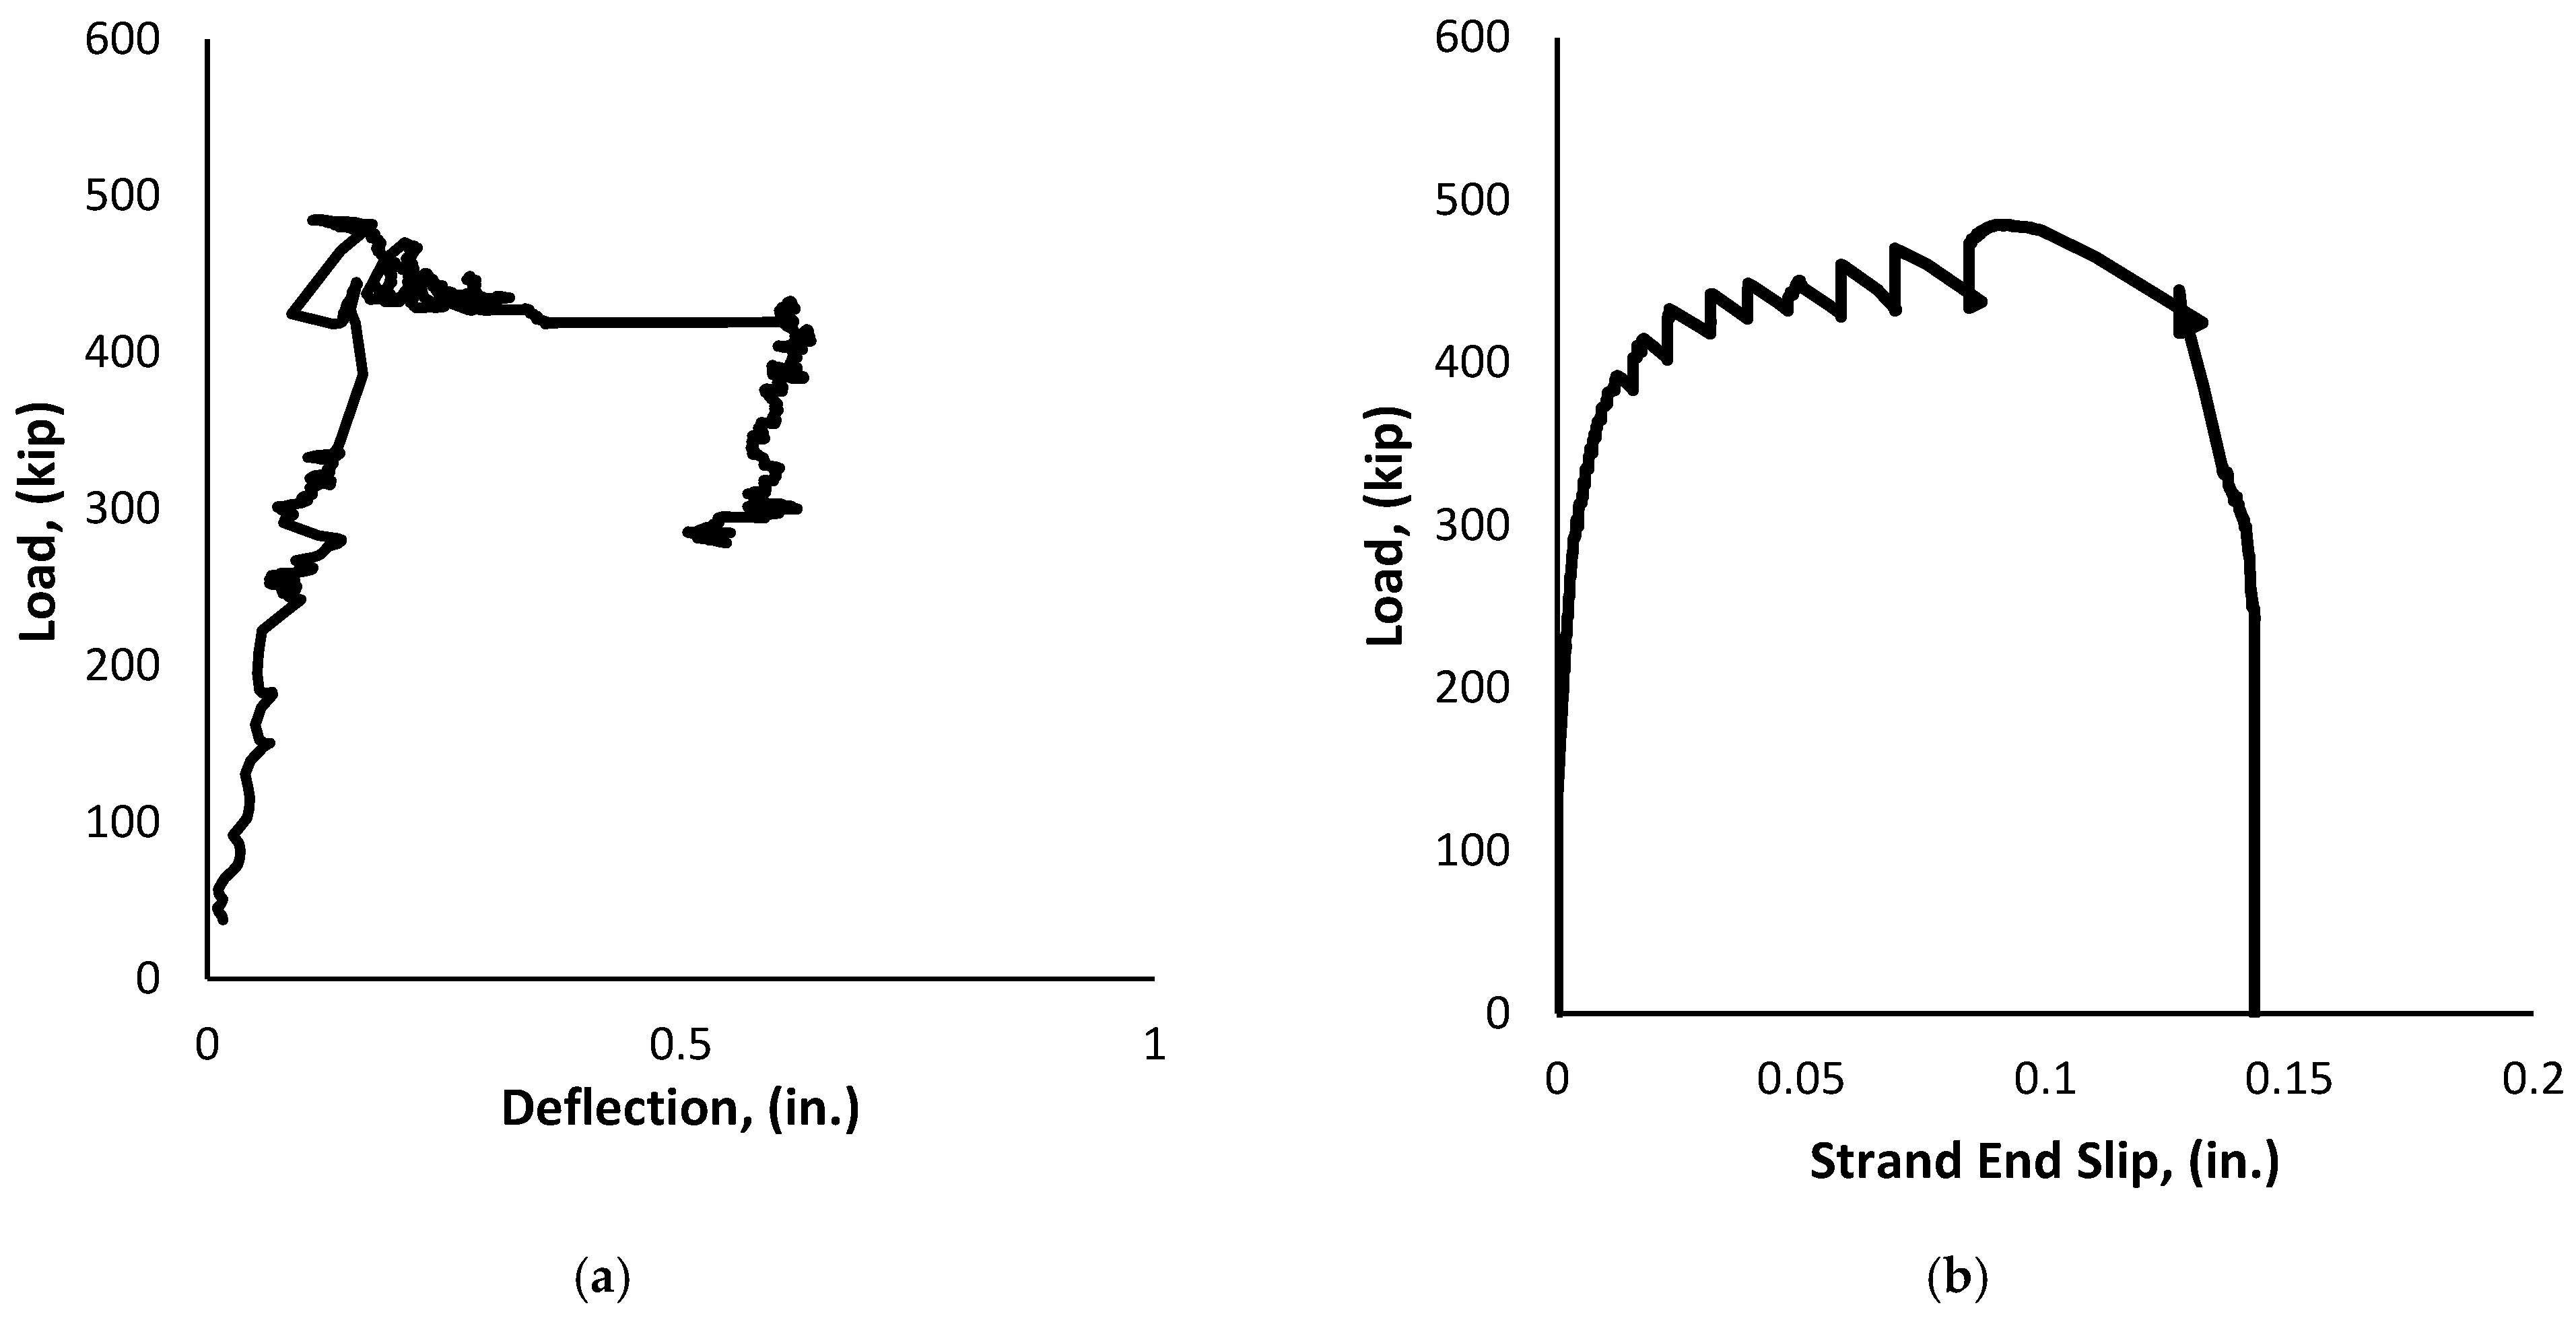
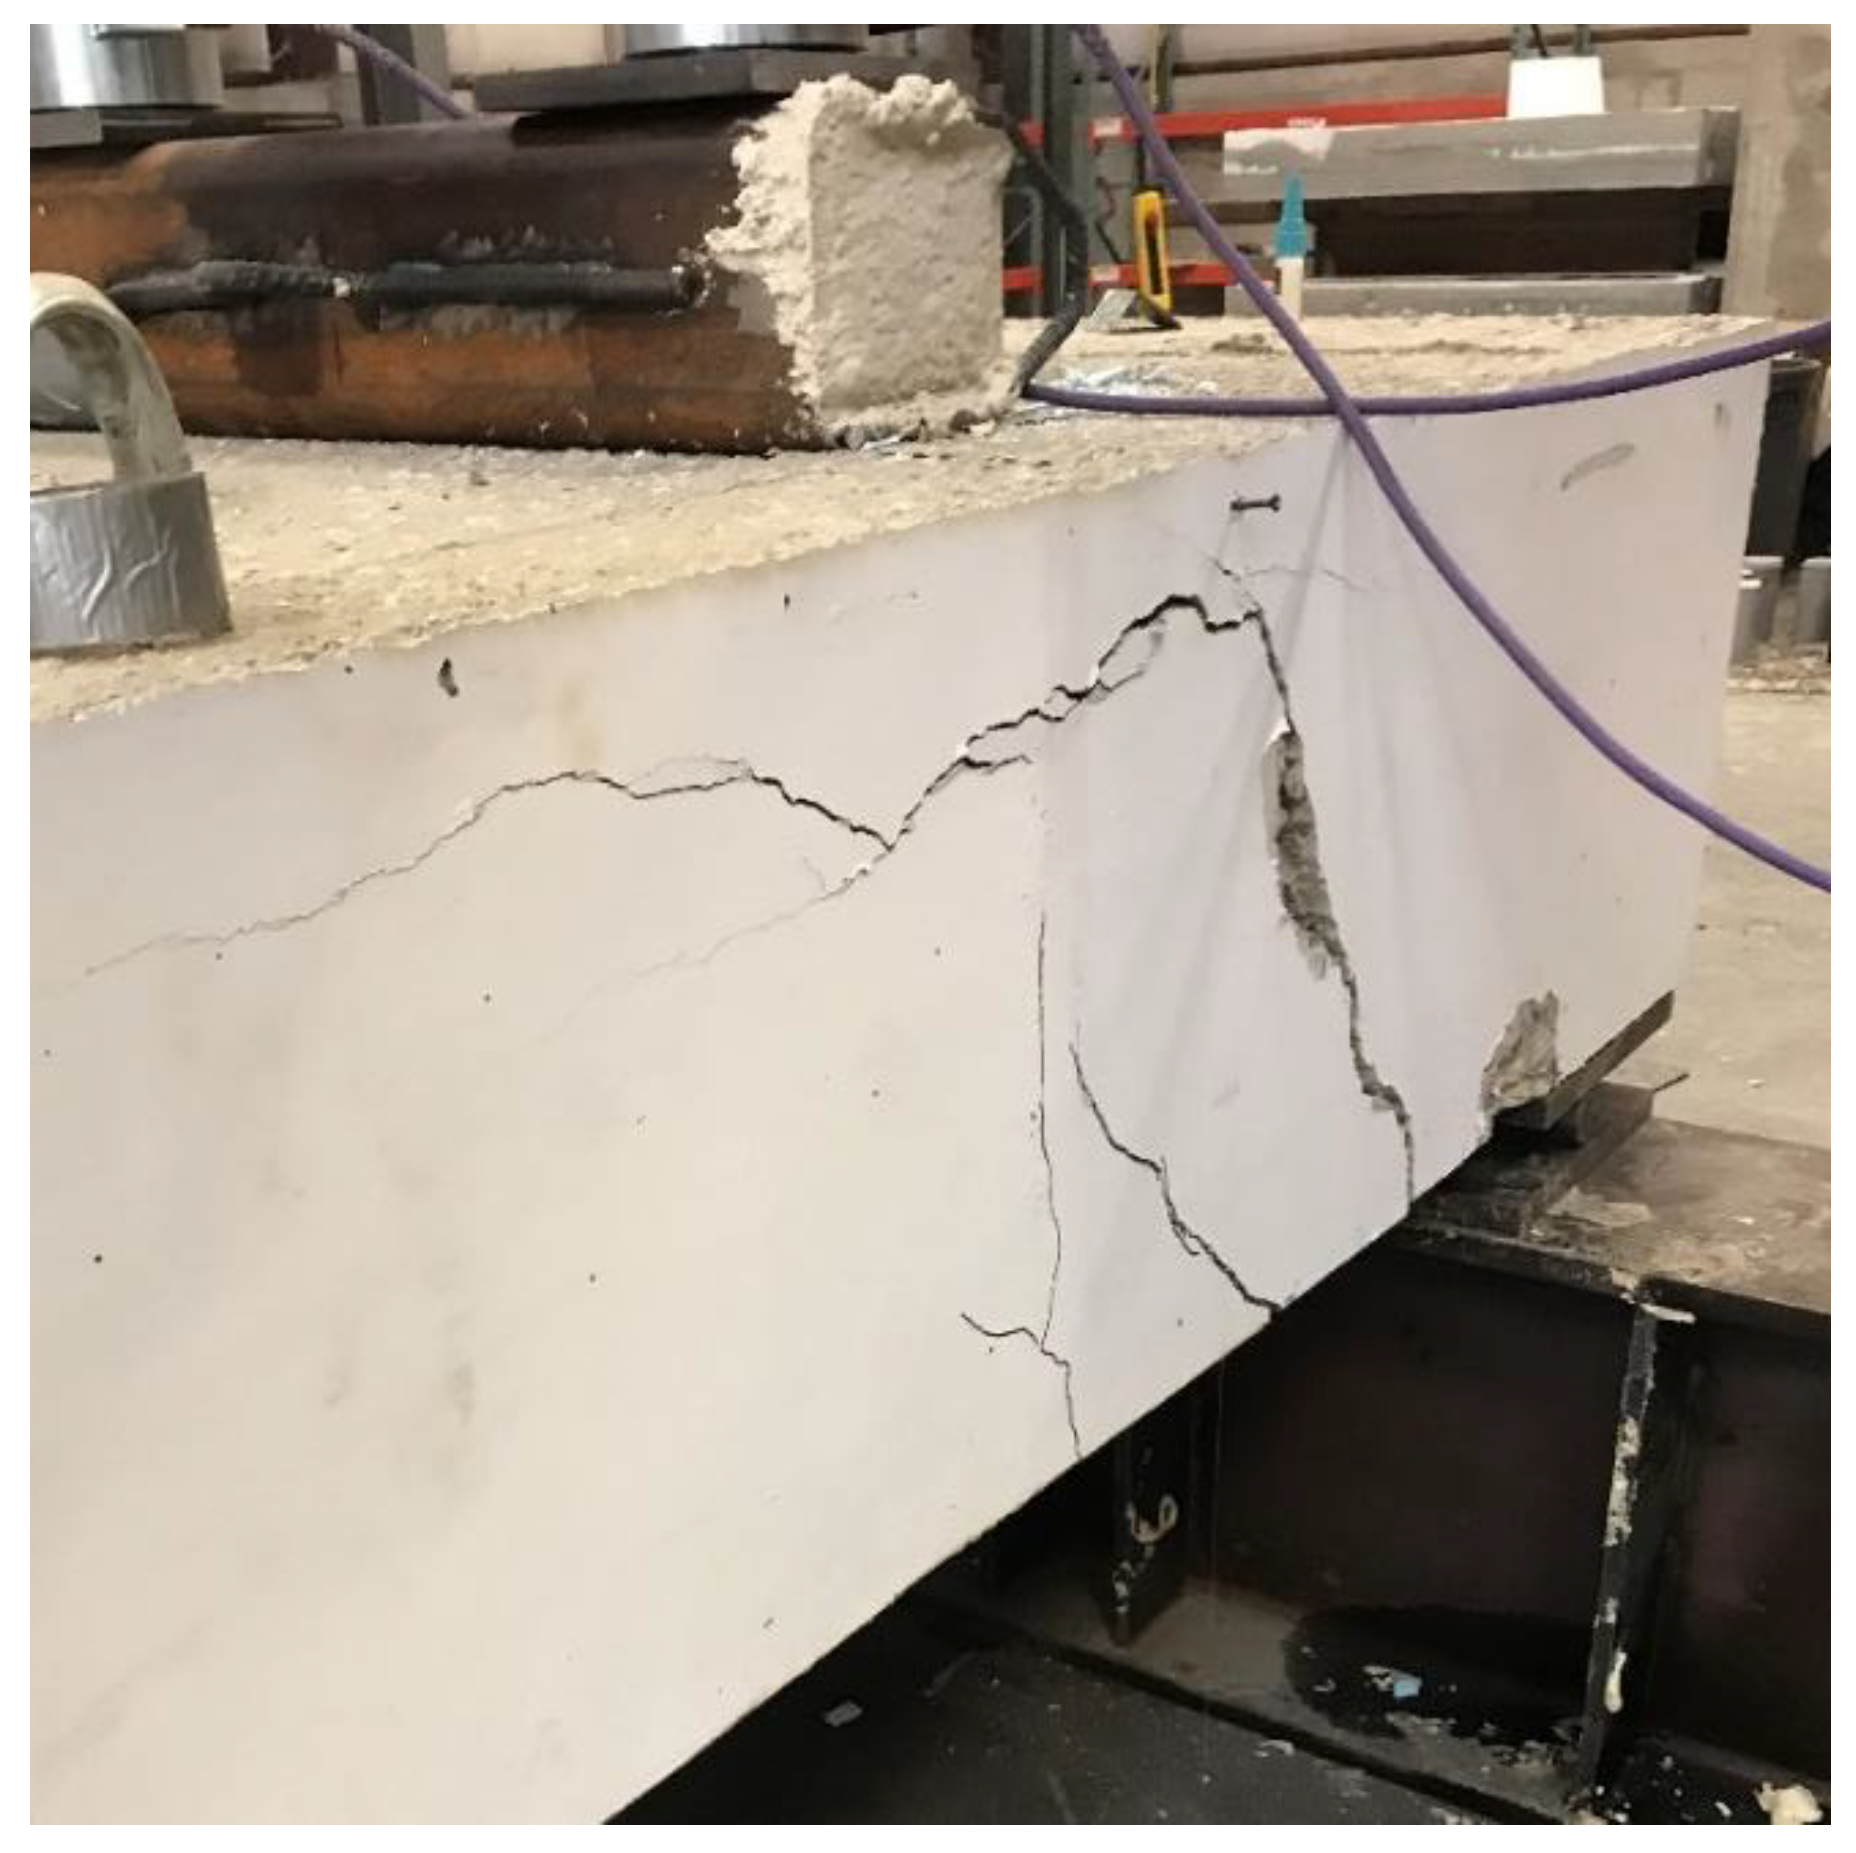
3.3.3. Load at
4. Discussion
5. Summary and Conclusions
- Creep and shrinkage strains were generally well predicted using AASHTO for BCSA cement concrete during the period of monitoring, but if trends continued, likely would overestimate both shrinkage and creep. Based on these results AASHTO predictions for losses are likely accurate enough for design and will be conservative for long-term predictions.
- Autogenous shrinkage for BCSA cement is significantly larger than in Portland cement, therefore it is important to include this behavior when estimating losses, though this is not currently explicitly covered in AASHTO LRFD provisions.
- The average measured effective prestress for BCSA cement concrete was 144.5 ksi +/− 5.8 ksi and showed good agreement with the AASHTO LRFD-predicted effective prestress for the time period predicted indicating safe use of AASHTO LRFD effective prestress provisions for BCSA concrete.
- The maximum applied shear for the mid-span test was 129.0 kips, while the AASHTO predicted nominal shear strength was 116.8 kips which is commensurate with the observed shear failure. Bridge loading analysis indicated shear envelope design is only 25 kips, which is much lower than the applied shear force (129.3 kips), due to the concentrated point load. Therefore, the observed failure mode will not occur in real bridge loading configuration and was only observed because of the testing conditions. These results indicate prediction of shear capacity for BCSA concrete members is accurate and conservative for the situation tested.
- No strand-end slip was observed during the mid-span testing indicating strands were fully developed for the applied moment of 1290 kip-ft with a development length of 11 ft.
- During the 1.25d test, the specimen failed at 484.9 kips after considerable strand slip, indicating bond failure. The calculated strand stress (fps) at failure was 256.9 ksi, which significantly exceeded the predicted value of 104.35 ksi using AASHTO LRFD transfer and development lengths criteria.
- Using the measured transfer length and the strand stress results from the 1.25d bond failure test, the expected embedment length to achieve 270 ksi in the strand is 27 in, much shorter than the 104 in predicted by the AASHTO LRFD bond length model. This indicates the use of AASHTO LRFD can be conservative in predicting the transfer and development length for BCSA concrete for the strength and strands used in this study.
Author Contributions
Funding
Institutional Review Board Statement
Informed Consent Statement
Data Availability Statement
Acknowledgments
Conflicts of Interest
Nomenclature
| transformed area of cross section | |
| area of prestressing strands | |
| total depth of concrete section | |
| static modulus of elasticity of concrete | |
| dynamic modulus of elasticity of concrete | |
| eccentricity of prestressing strands about center of gravity of cross section | |
| static modulus of elasticity of prestressing strand | |
| effective prestressing stress | |
| stress in prestressing strand just prior to transfer | |
| splitting tensile strength of concrete | |
| transformed moment of inertia of cross section | |
| transfer length | |
| total applied moment including self-weight | |
| distance from bottom concrete tension fiber to center of gravity of cross section | |
| shape factor of the bond stress distribution constant ( for constant or linear stress distribution, respectively). Constant stress distribution was assumed in this study. | |
| prestressing strand end slip | |
| measured strain in prestressing strand | |
| initial strain in prestressing strand | |
| predicted creep strain | |
| prestress loss due to creep calculated using AASHTO LRFD Eq. 5.9.5.4.2b-1 | |
| prestress loss due to shrinkage calculated using AASHTO LRFD Eq. 5.9.5.4.2a-1 |
References
- Klein, A. Calcium Aluminosulfate and Expansive Cements Containing Same. U.S. Patent 3,155,526, 3 November 1964. [Google Scholar]
- Mehta, P.K.; Klein, A. Investigations on the Hydration Products in System 4CaO-3Al2O3-SO3-CaSO4-CaO-H2O. In Highway Research Board Special Report; Highway Research Board: Washington, DC, USA, 1966; pp. 328–352. [Google Scholar]
- Ost, B.W.A.; Schiefelbein, B.; Summerfield, J.M. Very High Early Strength Cement. U.S. Patent 3,860,433, 14 January 1975. [Google Scholar]
- Thomas, R.; Maguire, M.; Sorensen, A.; Quezada, I. Calcium Sulfoaluminate Cement. Concr. Int. 2018, 40, 65–69. [Google Scholar]
- Habert, G. Assessing the environmental impact of conventional and ‘green’ cement production. In Eco-efficient Construction and Building Materials; Pacheco-Torgal, F., Cabeza, L.F., Labrincha, J., de Magalhães, A., Eds.; Woodhead Publishing: Sawston, UK, 2014; pp. 199–238. [Google Scholar]
- Glasser, F.P.; Zhang, L. High-performance cement matrices based on calcium sulfoaluminate-belite compositions. Cem. Concr. Res. 2001, 21, 1881–1886. [Google Scholar] [CrossRef]
- Ambroise, J.; Péra, J. Immobilization of calcium sulfate contained in demolition waste. J. Hazard. Mater. 2008, 151, 840–846. [Google Scholar] [CrossRef] [PubMed]
- Jewell, R.B. Influence of Calcium Sulfoaluminate Cement on the Pullout Performance of Reinforcing Fibers: An Evaluation of the Micro-Mechanical Behavior. Ph.D. Thesis, Civil Engineering, University of Kentucky, Lexington, KY, USA, 2015. [Google Scholar]
- Gartner, E. Industrially interesting approaches to “low-CO2” cements. Cem. Concr. Res. 2004, 34, 1489–1498. [Google Scholar] [CrossRef]
- Gartner, E.; Sui, T. Alternative cement clinkers. Cem. Concr. Res. 2018, 114, 27–39. [Google Scholar] [CrossRef]
- Bescher, E.; Stremfel, J.; Ramseyer, C. The Role of Calcium Sulfoaluminate in Concrete Sustainability. In Proceedings of the Twelfth International Conference on Recent Advances in Concrete Technology and Sustainability Issues, Prague, Czech Republic, 1 October 2012. [Google Scholar]
- Bescher, E.; Kim, J. Belitic Calcium Sulfoaluminate Cement: History, Chemistry, Performance, and Use in the United States. In Proceedings of the 1st International Conference on Innovation in Low Carbon Cement and Concrete Technology, London, UK, 25 June 2019. [Google Scholar]
- Maggenti, R.; Gomez, S.; Luena, R. Bridge Hinge Reconstruction. Struct. Mag. 2015, 30–32. Available online: https://www.structuremag.org/wp-content/uploads/2014/12/F-BridgeHinge-Maggenti-Jan151.pdf (accessed on 14 July 2021).
- Floyd, R.W.; Ramseyer, C. Behavior of Precast, Prestressed Calcium Sulfoaluminate Cement Concrete Beams. In Proceedings of the PCI Convention and National Bridge Conference, Nashville, TN, USA, 5 March 2016. [Google Scholar]
- Murray, C.D.; Floyd, R.W.; Ramseyer, C.C.E. Using belitic calcium sulfoaluminate cement for precast, prestressed concrete beams. PCI J. 2019, 64, 55–67. [Google Scholar] [CrossRef]
- Bowser, T. Development Length of 0.6 in. In Prestressing Strands in Precast, Prestressed Calcium Sulfoaluminate Cement Concrete, M.S. in Civil Engineering; University of Oklahoma: Norman, OK, USA, 16 December 2016. [Google Scholar]
- ACI Committee 318. Building Code Requirements for Structural Concrete (ACI 318-14) and Commentary (ACI 318R-14). Farmington Hills; American Concrete Institute: Michigan, MI, USA, 2014. [Google Scholar]
- American Association of State Highway and Transportation Officials (AASHTO). In LRFD Bridge Design Specifications, 7th ed.; AASHTO: Washington, DC, USA, 2014.
- ASTM C403/C403M-16. Standard Test Method for Time of Setting of Concrete Mixtures by Penetration Resistance; ASTM International: West Conshohocken, PA, USA, 2016. [Google Scholar]
- ASTM C39/C39M-18. Standard Test Method for Compressive Strength of Cylindrical Concrete Specimens; ASTM International: West Conshohocken, PA, USA, 2018. [Google Scholar]
- ASTM C1698-14. Standard Test Method for Autogenous Strain of Cement Paste and Mortar; ASTM International: West Conshohocken, PA, USA, 2014. [Google Scholar]
- ASTM C496/496M-17. Standard Test Method for Splitting Tensile Strength of Cylindrical Concrete Specimens; ASTM International: West Conshohocken, PA, USA, 2017. [Google Scholar]
- ASTM C469/C469M-14e1. Standard Test Method for Static Modulus of Elasticity and Poisson’s Ratio of Concrete in Compression; ASTM International: West Conshohocken, PA, USA, 2014. [Google Scholar]
- ASTM C215-19. Standard Test Method for Fundamental Transverse, Longitudinal, and Torsional Resonant Frequencies of Concrete Specimens; ASTM International: West Conshohocken, PA, USA, 2019. [Google Scholar]
- ASTM C157/C157M-17. Standard Test Method for Length Change of Hardened Hydraulic-Cement Mortar and Concrete; ASTM International: West Conshohocken, PA, USA, 2017. [Google Scholar]
- Markosian, N. Calcium Sulfoaluminate Cement Concrete for Prestressed Bridge Girders: Prestressing Losses, Bond, and Strength Behavior. Master’s Thesis, Utah State University, Logan, UT, USA, 2019. [Google Scholar]
- PCI Bridge Design Manual, 3rd ed.; Precast/Prestressed Concrete Institute: Chicago, IL, USA, 2014.
- Guyon, Y. Prestressed Concrete; John Wiley & Sons: New York, NY, USA, 1960. [Google Scholar]
- Bentz, E.C. Sectional Analysis of Reinforced Concrete Members. Ph.D. Thesis, University of Toronto, Toronto, ON, Canada, 2000. [Google Scholar]
- Tawadrous, R.; Morcous, G. Shear Strength of Deep Hollow-Core Slabs. ACI Struct. J. 2018, 115, 699–709. [Google Scholar] [CrossRef]
- Devalapura, R.K.; Tadros, M.K. Stress-Strain Modeling of 270 ksi Low-Relaxation Prestressing Strands. PCI J. 1992, 32, 100–106. [Google Scholar] [CrossRef]


| BCSA Mixture Proportions | ||
|---|---|---|
| BCSA | 700 | lb/cy |
| Water | 280 | lb/cy |
| Coarse aggregate | 1650 | lb/cy |
| Fine aggregate | 1150 | lb/cy |
| Air | 6 | % |
| Superplasticizer (GCP ADVA Cast 555) | 98 | fl oz/cy |
| Air entrainer (GCP Daravair 1000) | 52.5 | fl oz/cy |
| Retarder (GCP Recover) | 182 | fl oz/cy |
| Prestress release | 4300 | 347 | 2200 | 3800 |
| Full-scale testing | 9760 | - | 2500 | 4000 |
| Beam End | Measured Transferred Length (in.) | Predicted Transfer Length (in.) | ||
|---|---|---|---|---|
| DEMEC | Strand end slip | AASHTO LRFD (60 Ld) | ACI 318-14 (50 Ld) | |
| Live end | 15.9 | 23 | 36 | 30 |
| Dead end | 15.9 | 22.9 | 36 | 30 |
Publisher’s Note: MDPI stays neutral with regard to jurisdictional claims in published maps and institutional affiliations. |
© 2021 by the authors. Licensee MDPI, Basel, Switzerland. This article is an open access article distributed under the terms and conditions of the Creative Commons Attribution (CC BY) license (https://creativecommons.org/licenses/by/4.0/).
Share and Cite
Markosian, N.; Tawadrous, R.; Mastali, M.; Thomas, R.J.; Maguire, M. Performance Evaluation of a Prestressed Belitic Calcium Sulfoaluminate Cement (BCSA) Concrete Bridge Girder. Sustainability 2021, 13, 7875. https://doi.org/10.3390/su13147875
Markosian N, Tawadrous R, Mastali M, Thomas RJ, Maguire M. Performance Evaluation of a Prestressed Belitic Calcium Sulfoaluminate Cement (BCSA) Concrete Bridge Girder. Sustainability. 2021; 13(14):7875. https://doi.org/10.3390/su13147875
Chicago/Turabian StyleMarkosian, Nick, Raed Tawadrous, Mohammad Mastali, Robert J. Thomas, and Marc Maguire. 2021. "Performance Evaluation of a Prestressed Belitic Calcium Sulfoaluminate Cement (BCSA) Concrete Bridge Girder" Sustainability 13, no. 14: 7875. https://doi.org/10.3390/su13147875