Article

Evaluation of Livelihood Sustainability in the Context of Natural Forest Land Degradation Vulnerability: A Case Study of Five Counties in China

School of Economics and Management, Beijing Forestry University, Beijing 100083, China
*
Author to whom correspondence should be addressed.
Sustainability 2021, 13(12), 6580; https://doi.org/10.3390/su13126580
Submission received: 17 May 2021 / Revised: 4 June 2021 / Accepted: 6 June 2021 / Published: 9 June 2021

Abstract

:
Land degradation, especially natural forest land degradation (NFLD), is a severe environmental concern in China. This natural disaster itself and its derivative control policies have caused some impacts on surrounding farmers’ livelihood level and strategies, but the literature on the sustainable livelihood of different households in NFLD vulnerability is limited, and there is an urgent need to bridge the gap and conduct studies on the sustainable livelihood of Changting, Libo, Lixian, Menghai and Wuxi, the typical NFLD-prone areas in China. A new livelihood sustainability index (LSI) including livelihood asset, livelihood strategy and sustainability engagement is constructed to assess the basic situation. The results showed that: (1) The overall LSI of five NFLD areas was not high, and the social, financial and natural assets, in particular, were relatively low. A disparity was found among the five areas, and the rank sequence of the LSI value was sorted in a descending order: Changting > Menghai > Libo > Lixian > Wuxi. (2) In detail, farmers in Changting had the relative highest LSI because of the inherent high value of livelihood assets, which constrain the scores of the livelihood strategy and sustainability engagement. (3) Households in Libo, Menghai and Lixian had middle level LSI scores. The relative low livelihood assets in Libo and Menghai drove parts of local farmers to carry out off-farm/forestry employment, leading to high scores of livelihood strategy, while farmers in Lixian had lower livelihood diversification scores and higher sustainability engagement due to their working content for the local forestry bureau. (4) The low scores of the livelihood asset and sustainability engagement restricted farmers in Wuxi. A discussion of LSI in the NFLD vulnerability was conducted to determine the characteristics and analyze the reasons. Accordingly, targeted policy recommendations were proposed to realize a sustainable livelihood in NFLD areas.

1. Introduction

At present, land degradation, especially the natural forest land degradation (NFLD), is one of the global environmental concerns that influences everyone, through food insecurity, climate change, natural disasters, and the loss of biodiversity and ecosystem services such as soil and water conservation [1,2]. According to United Nations Convention to Combat Desertification (UNCCD), land degradation has caused impacts on the lives of at least 3.2 billion people, and there are persistent declining trends or stress in productivity in an estimated 20% of the earth’s vegetated surface, partly due to poor management practices, leading to potential mass species extinction and loss in ecosystem services valued at 10% of the global gross domestic product [3]. Data show that the global land degradation in dry lands results in land productivity losses valued around USD 13 to 28 billion per year [4]. From 1990 to 2015, global forests have declined from 4128 million to 3999 million ha, whereas the global areas of natural forests have also decreased at an alarming rate, a net 6.5 million ha per year from 2010 to 2015 and 10.6 million ha per year for the period 1990 to 2000 [5]. In response, the global community has set several sustainable goals to address this, including the United Nations strategic plan for forests (2017–2030), the Bonn Challenge and the UN Decade on Ecosystem Restoration (2021–2030), etc.
Land degradation is also a major challenge in today’s China, seriously impacting those living in the affected areas [6,7,8]. In most regions of China, deforestation is one of root causes of land degradation, together with soil erosion, soil salinization and other severe natural disasters, ultimately leading to the ecosystem services decline in these areas [9]. In 1998, an extraordinary flood in the Yangtze River area caused a direct economic loss of CNY 166.6 billion at that time, a level of destruction seldom seen in history [10,11]. The area affected by soil and water losses, due to water-induced soil erosion and water run-off, amounted to 1,293,200 km2 according to 2011 statistics, of which 78.8% were mildly to moderately affected, whilst 21.2% of land were rated intense or above [2]. In response, China has implemented a number of major restoration projects for NFLD, such as the Natural Forest Protection Program (NFPP), the Land Conversion from Farmland back to Forestland Project and the and Desertification (Rocky) Control Project, resulting in certain positive trends. As of 2016, the area of soil erosion by water in China has decreased from 1,744,100 km2 in 1985 and 1,648,800 km2 in 2000 to 1,293,200 km2 in 2011 [2], increasing China’s forest coverage rate from 16.5% in 1998 to 22.9% in 2018 [12]. Moreover, in order to further curb land degradation, China completely stopped the commercial logging of natural forests in 2016 [12] and unveiled a plan, named after the Plan for the Protection and Restoration of Natural Forests (PPRNF). This new plan was formulated to advance the conservation and restoration of the country’s forests, with the aim of reaching a total area of 200 million ha by 2035.
The land degradation as well as its derivative control policy and projects will inevitably cause some impacts on the livelihood of surrounding farmers and changes and constraints on the choice of their livelihood strategies [13]. Therefore, farmers’ livelihood is always regarded as an imperative indicator for relevant land degradation programs such as the NFPP [14] and PPRNF [15], at the domestic level, and Reducing Emissions from Deforestation and Forest Degradation (REDD+), at the international level [16], which is also a hot topic for scholars. In general, the research on this topic could be mainly divided into three agendas. The first agenda is to elucidate the relation between the household livelihood and land degradation. The spatial and temporal difference of the land degradation status is always assessed first in combination with specific environmental and socio-economic factors. Then, the mechanism of environmental deterioration leading to land productivity losses and cultivation cost increase can be elaborated with an empirical analysis [17,18,19]. The second agenda is to evaluate the vulnerability or sustainable livelihood (SL) of farmers regarding land degradation. Approaches including model evaluation, indicator evaluation and stakeholder assessing can always be adopted to assess the status of livelihood vulnerability or sustainability of farmers, with the analysis of the drivers, mechanism and community perception of vulnerability [20,21,22,23,24]. The last agenda is about solutions to land degradation and revenue-generating options for local farmers. Approaches such as adaptive farming strategy, fire management practices, community involvement and control projects will be assessed or analyzed in specific contexts, with a further policy recommendation proposed as reference [25,26,27,28].
This paper belongs to the second agenda, which aims to evaluate SL in the context of land degradation. Through the literature review, it was found that insufficient attention was paid to the sustainable livelihood of different households in large-scale natural forest land degradation (NFLD) areas. Farmers’ livelihoods are usually heterogeneous rather than homogeneous due to their different inherent livelihood assets, livelihood strategies, adaptive capacities and participation in Payments for Ecosystem Services (PES) [20,29], which contribute to the disparities of livelihood outputs and livelihood sustainability. Therefore, it is of significance to bridge the gap of the evaluation of farmers’ SL in the NFLD-prone areas, which could also provide the baseline data for PPRNF, the latest natural forest conservation program, as reference.
Our research aims to evaluate the SL of farmers in different regions, based on the sustainable livelihood framework (SLF), proposed by the Department for International Development (DFID) in the United Kingdom [30]. There are three main research contents in our analysis. (1) First, five different NFLD regions, which are also covered by NFPP, PPRNF and other NFLD control projects, are selected as our study area. (2) Second, an innovative livelihood sustainability index (LSI) system is constructed, in the context of NFLD. (3) Last, a comparative analysis based on the above-mentioned LSI system and entropy method is conducted in five NFLD regions. The rest of the paper is divided into four sections as follows. The methodology and results are described in Section 2 and Section 3 respectively. Section 4 discusses the mechanism behind the results and major findings, and policy recommendations as well as the contribution of the research are presented in the last section. Additionally, relevant policy recommendations are also formulated for NFLD regions and PPRNF and other natural forest conservation projects as reference.

2. Methodology

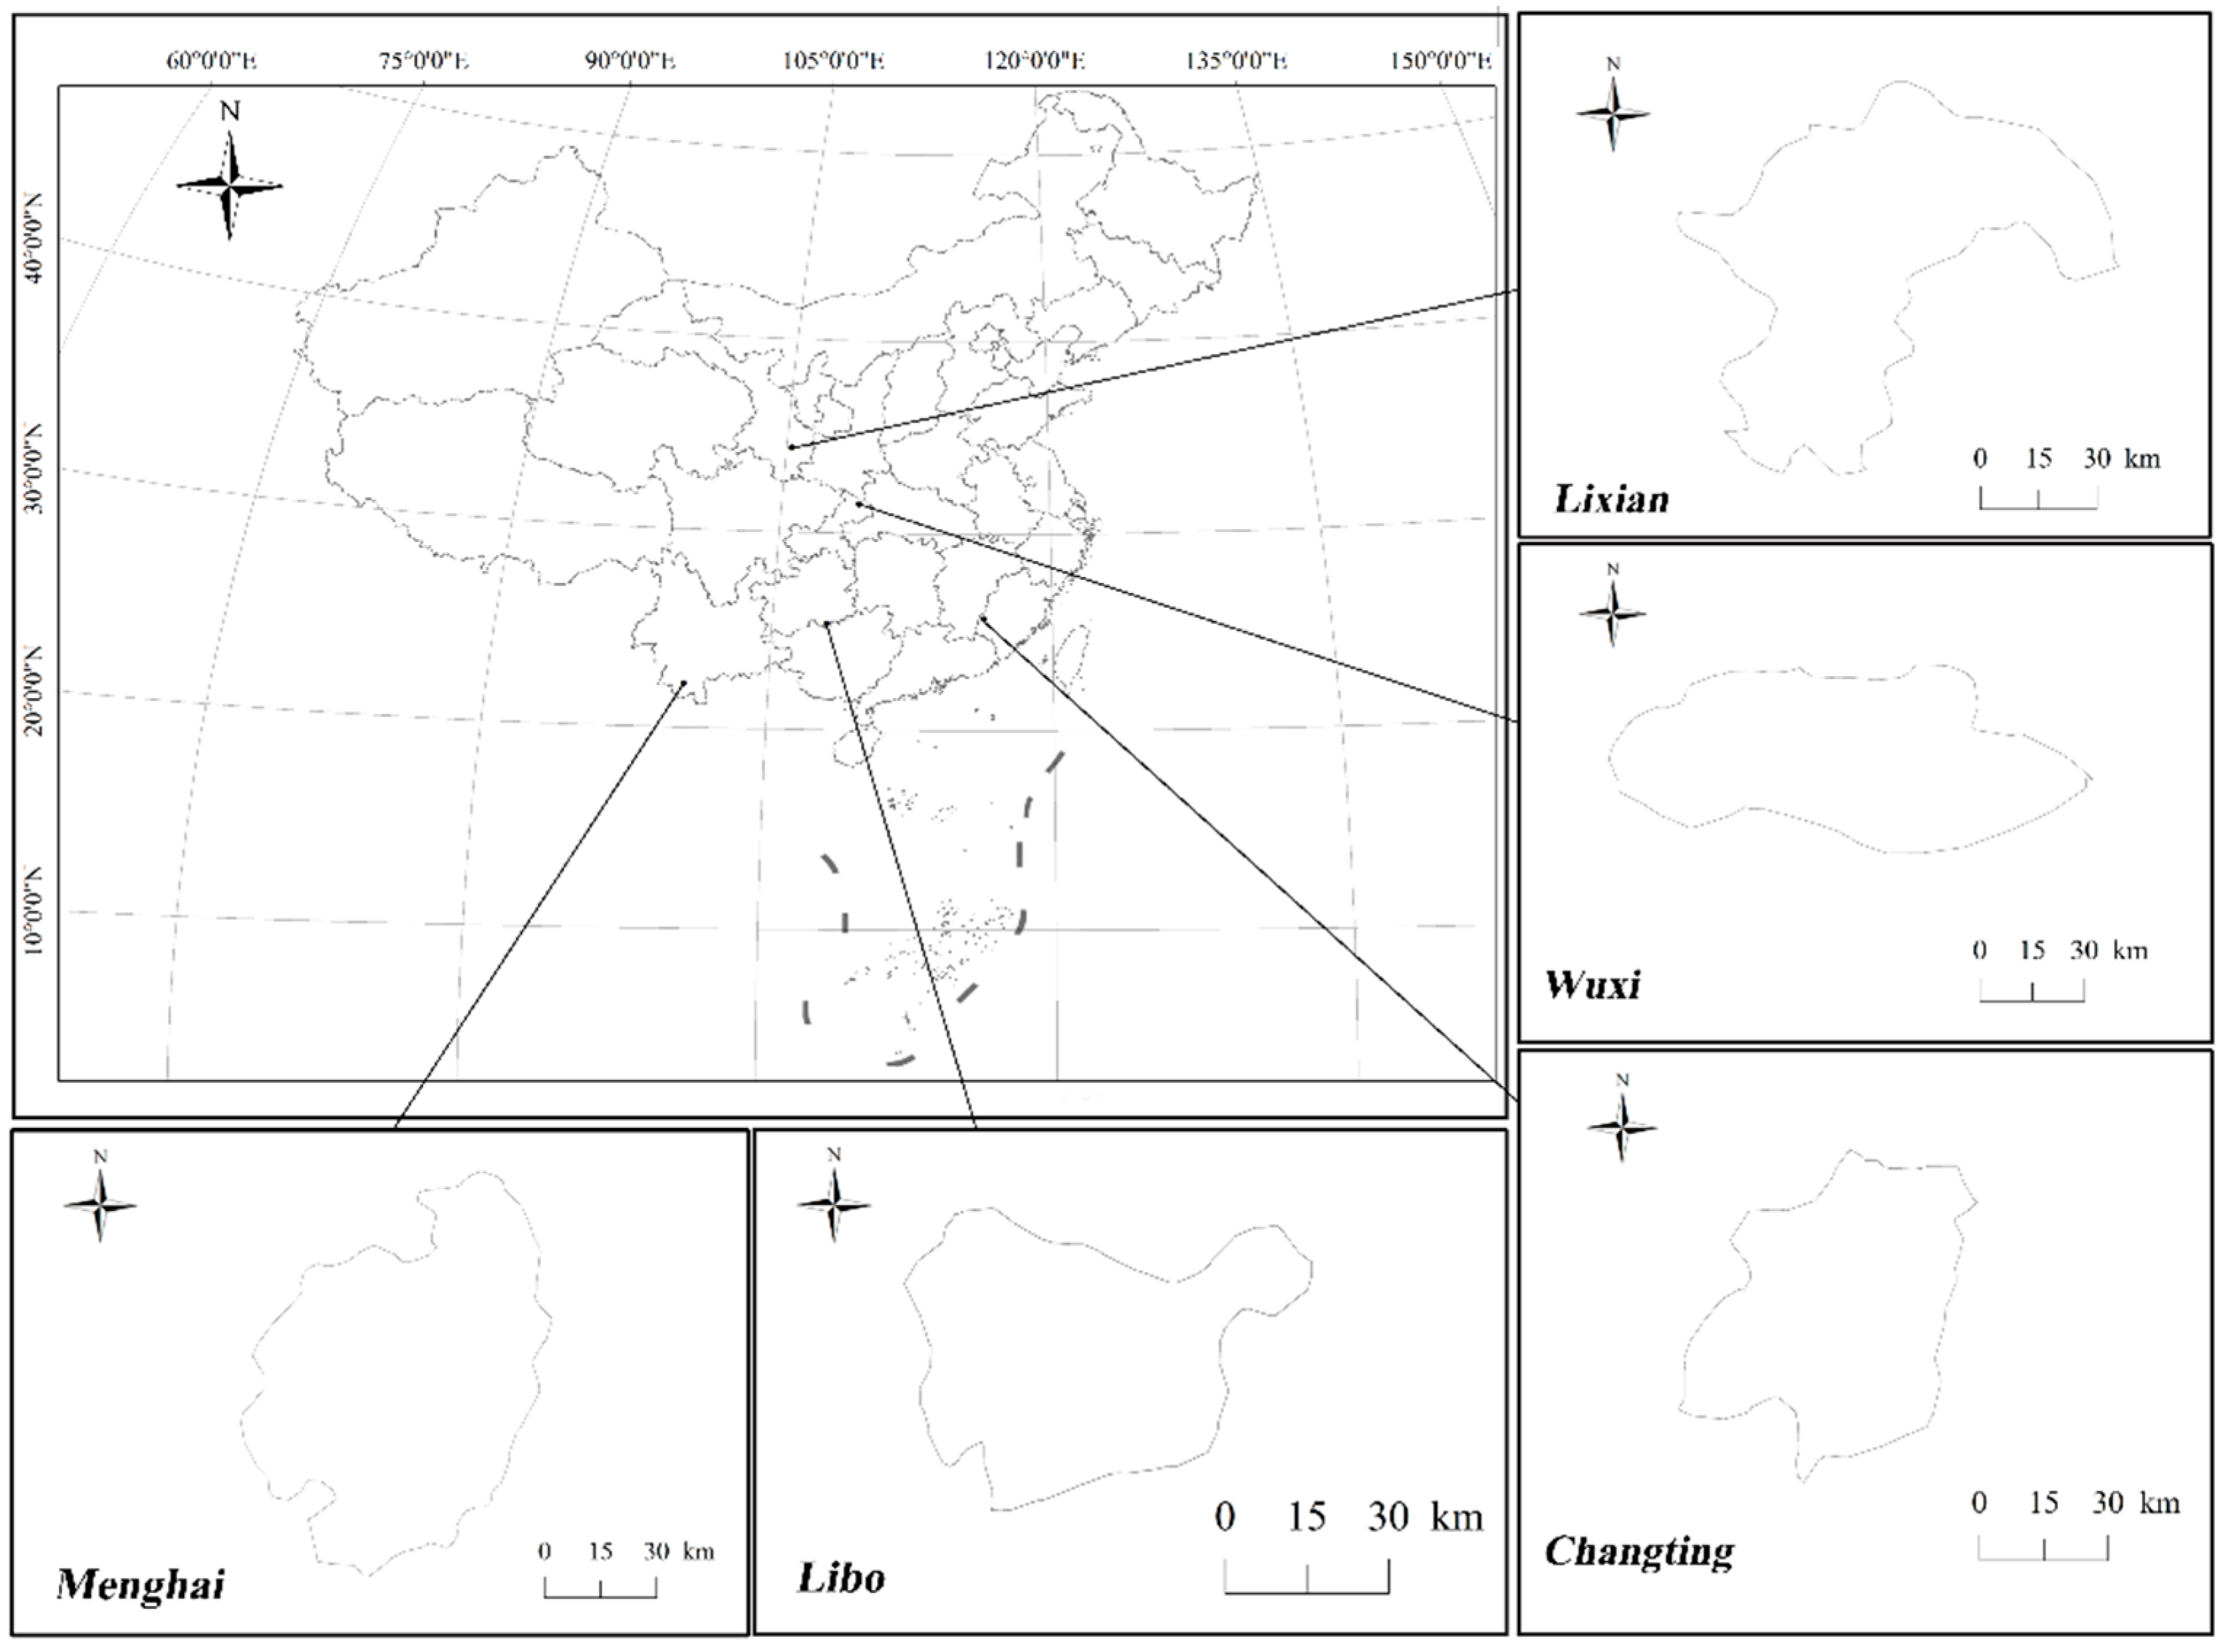
2.1. Overview of the Study Area

Five targeted NFLD areas (Figure 1) have been selected as the study areas because of two considerations: (1) all of the places have high biological values, either close to imperative rivers or having become the home of many treasured species. For instance, Libo, Lixian and Wuxi are close to the Yangtze River, and Menghai to the Mekong River, whilst the Han River goes through Changting. (2) These places are in the typical soil erosion regions of China covered by NFPP, PPRNF and other NFLD control projects. For example, according to survey data, the total natural forest land area in Wuxi is about 326,933 ha, while the NFLD area reaches 140,309 ha [31]. The percentage of the NFLD area rating as intense or above is about 67%. The other basic information is as follows (Table 1):

2.2. Data Collection

The authors conducted field research in five NFLD areas from August to September 2020 through the participatory rural assessment method, and many available data in our research stem form field investigation and surveys. First, the in-depth interviews were conducted with village organizations and relevant village heads to acquire data on the basic information of natural forest protection and farmers’ livelihood situation. Second, through random sampling, 325 farmers living around the NFLD area were selected from five sites, and the in-depth interview was conducted during the survey. The investigation duration for each household was about 45 min on average. The survey content included (1) households’ basic information (name, age, education level, etc.); (2) the status quo of livelihood assets and strategies; (3) the participation or engagement in NFPP, PPRNF and other sustainable activities. After eliminating four invalid records, 321 effective questionnaires remained.

2.3. Analysis Framework

2.3.1. Construction of the Livelihood Sustainability Index

The Livelihood Sustainability Index (LSI) in this paper is based on DFID’s SLF. This framework is composed of five major components, including vulnerability context, livelihood assets, transforming structure and process, livelihood strategies and livelihood outcomes. The livelihood assets mainly include human (H), natural (N), physical (P), financial (F) and social (S) assets, and the vulnerability context refers to the external environment in which people exist, including climate change, natural disasters, socio-economic changes, etc. The range and combination of activities and choices that people make in order to achieve their livelihood goals are mentioned as livelihood strategies [30].
It is of significance to identify appropriate attributes and variables related to SL before constructing an LSI [32]. Based on the field survey and previous research, the first component, livelihood assets, is chosen to evaluate the basic livelihood level of local farmers, including human assets and the other four factors mentioned before. The livelihood diversification has been verified to be sustainable, and off-farm income has also been well-examined as a solution to boost sustainable livelihood [33]. Specifically, the off-farm income here refers to the revenue irrelevant to traditional agricultural and forest-dependent activities, since these are major livelihood strategies for local farmers in these five NFLD areas. Besides, aiming at combatting NFLD in China, authorities at different levels have promulgated a series of policies and implemented projects such as the NFPP and PPRNF, indicating a trend seeking a win-win solution between revenue-generating for farmers and natural forest conservation, which raises the need for an asset-based engagement approach. Therefore, sustainable activities engagement is selected as the last component, including a top-down approach, like the employment as forest rangers in the NFPP, and a bottom-up path. This path includes sustainable forestry relevant industries integrating conservation with economic development [20], which is encouraged in the PPRNF, such as traditional Chinese medicinal herbs planting, eco-tourism, leisure and health care. Finally, we obtained the key attributes and proxy variables to measure the SL of five NFLD areas (Table 2).

2.3.2. Entropy Method

Shannon’s Entropy method was applied to determine the weights of different factors [38]. In general, a greater degree of dispersion indicates a larger differentiation in the system structure, and more information can be derived [39]. The calculation method and the process of the rural household livelihood asset index are as follows:
(1) The range method is used to standardize the data of each indicator of the interviewed rural households, where i = 1, 2 … n represents the interviewed households, and j = 1, 2… k represents the index.
Y i j = X i j min ( X j ) max ( X j ) min ( X j )
(2) The second step is to calculate the ratio of the index j value of the rural household i to the sum of the index j values of all farmers.
P i j = Y i j / j = 1 k Y i j
(3) The third step is to calculate the entropy value of the index j.
e j = ( 1 ln   n ) i = 1 n P i j ln ( P i j )
(4) The fourth step is to calculate the value of each index weight.
w j = ( 1 e j ) / m = 1 k ( 1 e m )
(5) The fifth step is to calculate the livelihood sustainability index, which represents the aggregated index of the interviewed rural household i.
z i = j = 1 k w j Y i j
For the single index, the maximum value Z = 1, indicating that the single indicator of the surveying farmer is in an absolutely good state. When Z = 0, the situation is absolutely bad; when Z = 0.5, the situation is neither good nor bad. The larger index value reflects a better sustainable livelihood level.

3. Results

3.1. Livelihood Assets

In sum, from the perspective of five areas in total, the general livelihood asset was 1.6849 (33.70% of the full mark of five livelihood assets), and there are disparities among different assets. Physical and human assets were exceeding or approaching the median value whilst social, financial and natural assets are far lower (Table 3).
Moreover, livelihood assets also showed disparities among different natural forest land degradation (NFLD) areas. Farmers in Changting had relatively high values of livelihood assets (1.9785), while farmers in Libo, Lixian and Menghai were at a close level (1.6753, 1.6442 and 1.6304, respectively). In comparison, farmers in Wuxi were at a relatively lower level, 1.4958, which was 24.40% lower than those in Changting.

3.1.1. Human Assets

From the perspective of the human assets index, the results showed that there were large disparities among the five NFLD areas (Table 4). Households in Wuxi and Lixian were in the first category, whose index value was overpassing the median value, followed by Libo and Changting, approaching the median value, and Menghai, in the lowest position. Three variables, including labor force ratio, labor education and training, were adopted to measure the quality and quantity of human assets. According to the labor force ratio indicator, farmers in all of the five NFLD areas were exceeding 0.5, thus indicating that nearly one half of family members could be regarded as labor force, and Menghai ranked first (0.6483). The education indicator value of households in Libo was 3.2500, indicating that most of them had a high school diploma, followed by Wuxi, Changting and Lixian, at the junior high school level, and Menghai, at the primary school level. Similarly, the training situation of farmers in Menghai ranked lowest (0.7143), suggesting that most of the surveyed farmers did not receive any training capacity building, while farmers in other four areas did but regarded this training as having no effects.
In general, the surveyed households in five NFLD areas had a middle level of human assets (0.4548). The labor force ratio was over the median value (0.5795), and the education situation was at the primary school level, while most of the interviewees received training but considered it to have no effects.

3.1.2. Natural Assets

A great disparity was also found in natural assets (Table 5). The households surveyed in Menghai had the highest value of natural assets (0.2617), followed by Changting (0.2255), Lixian (0.1771) and Libo (0.1036), and Wuxi had the lowest value (0.0673), 74.28% lower than in Menghai. Three variables, including farmland area, woodland area and access to water, were selected as indicators for assessing the natural assets from the perspective of land and water resources. The results showed that farmers in Menghai had the most farmland (39.0571 Mu per capita) and woodland (17.8571 Mu per capita), which were 173.65% and 65.21% higher than the average level, respectively, indicating that the local agricultural and natural resources were abundant and that there was little limit to them. Regarding the indicator of access to water, ranging from 1.5101 to 1.7000, it showed that most farmers supposed that the access to water resources were either sufficient or convenient, while there was still a gap to the ideal situation.
Looking at the five NFLD areas together, the natural assets (0.1670) ranked lowest in comparison with the other four assets. Moreover, the single farmers had a farmland of 14.2725 Mu and woodland of 10.8090 Mu on average, and most supposed that the access to water was either sufficient or convenient (1.6036).

3.1.3. Physical Assets

In terms of physical assets, the results showed that there was a minor difference in the five NFLD areas (Table 6). For the overall physical assets index value, the general rank sequence was Changting (0.6838), Libo (0.5833), Menghai (0.5180), Wuxi (0.4356) and Lixian (0.4099). Two variables, including household equipment assets and housing conditions, were adopted to evaluate the physical assets. It was found that households in Menghai had the highest equipment value (2.3929) and lowest housing condition (2.2857), indicating that those in Menghai had relatively good travelling and bad living conditions.
In general, the farmers in the five NFLD areas had only one vehicle (1.6241) and a one-story house (2.4353) on average, and the physical assets ranked first among the five assets (0.5261).

3.1.4. Financial Assets

Three variables were chosen to reflect the financial assets of farmers, including difficulty in borrowing, difficulty in loaning and the family savings situation. A certain disparity was observed, given the values of financial assets (Table 7). Farmers in Changting had the highest value of overall financial assets (0.3489), whilst those in Lixian had the lowest one (0.1902), 45.49% lower than in Changting, and Menghai (0.2636), Wuxi (0.2265) and Libo (0.2257) were in the middle group. The surveyed households in Changting had the highest value of the first (1.6333) and second indicators (0.9667), which were 21.56% and 66.01% higher than the average level, indicating that farmers there had relatively good financial access and resources. Regarding the savings indicator, farmers in Libo had the highest value (0.9219), indicating that most of the surveyed households had a small amount of deposit.
Judging from the general level, farmers in the five NFLD areas had the second lowest value (0.2510), and, on average, the surveyed households had 1.3436 channels of borrowing and supposed that their difficulty in loaning was between “difficult” and “general” (0.5823), and that their savings situation was between “none” and “a small amount of deposit” (0.6913)

3.1.5. Social Assets

The results showed that a minor disparity was observed in terms of social assets (Table 8). Menghai and Lixian had the first and second highest overall value (0.3366 and 0.3272, respectively), followed by Libo (0.2937), Changting (0.2623) and Wuxi (0.2096). Two variables were selected to measure the social assets, including connections to local cooperatives and social network supports. Regarding the first indicator, the surveyed farmers in Menghai had the highest value (1.3929), 123.19% higher than the average level, which indicated that there were cooperatives in Menghai but local farmers were not willing to join. The social network support indicator ranged from 2.2857 to 2.6333 in five areas, among which Changting ranked first, being 8.13% higher than the average, which suggested that there were village cadres assigned to Changting to help local farmers, and most of them thought of it as having little effect.
Looking at social assets from a comprehensive perspective, they ranked third (0.2859), seconded by physical and human assets. The first and the second indicator of surveyed farmers in the five NFLD areas were 0.6241 and 2.4354, respectively, indicating that the cooperatives situation was between “no such organization” and “there was such institution but not willing to join”, and most farmers on average thought there were assigned cadres with little effects.

3.2. Livelihood Strategies

In confrontation with natural forest land degradation (NFLD) vulnerability and its derivative limit access to traditional natural resources, farmers in different NFLD areas showed a certain disparity with regard to the livelihood arrangements (Table 9). In general, farmers in Libo (0.2801), Menghai (0.2723) and Wuxi (0.2256) had relative high values of livelihood strategy index, 25.10%, 21.62% and 0.76% higher than the average level, respectively, and the values of the surveyed households in Changting (0.1740) and Lixian (0.1676) were 22.29% and 25.15% lower than the average.

3.2.1. Diversification of Livelihoods

Judging from the indicator value, a large disparity could be found in different NFLD areas. Farmers in Menghai had the highest value (0.1991), followed by those in Libo, Lixian and Changting, which had the second most various livelihoods, with values of 0.1440, 0.1220 and 0.1211, respectively. Those in Wuxi had the least livelihood strategies, with the value of 0.0826, which was 58.51% lower than in Menghai. The reason why the results distinguished each other was that farmers in different regions had relatively different opportunities of livelihood to choose from. For example, farmers in Menghai had 3.4643 types of opportunities, whilst those in Wuxi only had 2.4027 types, being 30.64% lower than in Menghai.

3.2.2. Off-Farm/Forestry Activities

Farms in different NFLD areas also have a large difference in terms of off-farm/forestry activities. Farmers in Wuxi (0.1430) and Libo (0.1361) had relatively more activities irrelevant for traditional agricultural and forestry exploitation livelihoods, whilst those in Menghai (0.0732), Changting (0.0529) and Lixian (0.0456) had less, which were 18.76%, 41.29% and 49.39% lower than the average level. The farmers in Wuxi and Libo had high values of this indicator owing to the fact that the ratio of alternative off-farm/forestry activities (such as local labor, migrant labor and business) to the total income source was large, with the proportion of 70.30% and 61.09%, respectively.

3.3. Sustainability Engagement Index

The results showed a large disparity among the five NFLD areas in terms of the sustainability engagement index value (Table 10). Farmers in Lixian had the highest value (0.1505), followed by Menghai (0.1155) and Libo (0.1036), exceeding the average level. However, the surveyed households in Wuxi (0.0736) and Changting (0.0647) had relatively lower values, which were lower than the average level.
A similar conclusion could also be found in the selected second variable, sustainable forestry-related activities. Farmers in Lixian ranked first (0.0837), followed by those in Libo, Menghai and Wuxi, and those in Changting was in the last position (0.0208), which is consistent with the fact that the higher the value is, the more farmers engage in sustainable activities related to forestry, such as eco-tourism, Chinese medicinal herbs planting, etc. For instance, the ratio of sustainable forestry-related activities to all income sources was 0.0333 in Changting, 79.19% lower than that in Lixian (0.1600).
Regarding the indicator of participation in natural forest protection, households in Menghai had the highest value (0.0693), closely followed by Lixian (0.0667), but the other three areas—Wuxi, Changting and Libo—were 0.0477, 0.0439 and 0.0393, respectively, all lower than the average level.

3.4. Comprehensive Livelihood Sustainability Index

A minor disparity could be observed in the comprehensive livelihood sustainability index (LSI) value (Table 11). The LSI score of different NFLD areas was sorted in descending order: Changting > Libo > Menghai > Lixian > Wuxi. Farmers in Changting had the highest LSI because they also had the highest livelihood assets values, while those in Wuxi ranked lowest owing to their relatively low livelihood assets and sustainability engagement index values. In general, the scores of five NFLD areas were not high, with the value of 2.0103.

4. Discussion

Sustainable livelihood has been prominent in the fields of development and environment issues, and the sustainable livelihood framework (SLF) emerged as an effective tool to offer a way to think about the livelihoods of rural residents, particularly the vulnerable population [30]. This framework encompasses the livelihood assets and livelihood strategies. Moreover, the vulnerability context, including natural disasters and climate changes that affect people’s livelihoods, was also highlighted in the SLF [32]. Therefore, the SLF is a suitable instrument to assess the livelihood in the context of NFLD vulnerability in this case, and to explore a sustainable solution to combat vulnerability and accumulate livelihood assets. Additionally, inter-rural heterogeneity is also a significant feature in contemporary China due to households’ different livelihood assets, coping strategies and participation degrees in sustainable activities [29]. It is also vital to apply the means of the SLF to assess the sustainable livelihood of different households in large-scale NFLD areas. Through the livelihood sustainability index constructed in this study, the findings are as follows.
First, from the integrated perspective of the five NFLD areas, the livelihood sustainability index (LSI) was not high, indicating that there was still a gap to the ideal situation. Regarding the livelihood assets, the social, financial and natural assets were relatively low. The NFLD and its related policy prohibiting farmers to acquire natural resources as previously restricted the accumulation of natural assets, the five selected NFLD areas were also in the relative impoverished area, and the per capita disposable income of local residents was below the national average level over the previous years (Figure 2), except Changting, which was consistent with the fact that financial assets were also not high. Together with its low social capital, which reflects the limited support from social networks and institutions, the livelihood assets were at an unsatisfactory level. The low inherent livelihood assets and formidable natural conditions have driven parts of farmers from traditional forestry and agriculture industries to other fields, migrating to other cities to work. These, on the other hand, were affected by China’s rapid urbanization and industrialization process. According to the surveyed farmers in five NFLD areas, the top four priority income sources were sorted in descending order: plating crops > migrant working > local working > breeding, which has reduced the pressure on the local natural forests and other resources. However, judging from the results of the livelihood strategy index, there was still a gap to bridge. Moreover, regarding the sustainability engagement index, few farmers in the five areas would participate in the top-down approach as forest rangers in the NFPP, etc., or in the bottom-up approach including ecotourism and traditional Chinese medicinal herbs planting, which could become a sustainable way to cope with NFLD. Taking the three major components into consideration, the general LSI value was not high. This reflects that the NFLD and related control policies have caused a certain impact on the livelihoods of the surrounding rural residents, which is in line with existing studies which concluded that the general household livelihood is influenced by natural disasters or land degradation vulnerability [40,41,42,43,44,45].
Second, the results showed that a disparity was found among the five NFLD areas. The rank sequence of the LSI value was sorted in descending order: Changting > Menghai > Libo > Lixian > Wuxi. Among these areas, farmers in Wuxi had the lowest value, 1.7905, which was 19.24% lower than the highest value of Changting (2.2171). The five areas could be further divided into three categories. (1) The first category was Changting. Farmers in Changting had high values of LSI because of relatively high livelihood assets, particularly physical assets and financial assets, which was consistent with the fact that Changting was located in a coastal province with a high level development level. Moreover, owing to its inherent high value of livelihood assets, which made little pressure on farmers regarding strategy transformation and sustainable activities engagement, it showed the second lowest livelihood strategy value and the lowest value of sustainability engagement. (2) Libo, Menghai and Lixian were in the second category, with a middle level of LSI value in total. The average livelihood asset index value of the three NFLD areas was 1.6500, 16.60% lower than in Changting, which drove part of the farmers to change their original livelihoods, leading to the high values in the diversification of income sources and the ratio of off-farm/forestry activities. For example, farmers in Libo had the second lowest natural and financial assets due to its karst landform and NFLD situation, with limited arable land areas, and thus they were forced to pursue other strategies. This resulted in the highest value in the livelihood strategy index, including the second highest value in the diversification of livelihoods and non-agricultural employment. Besides, Lixian was a special case among the five areas. Most of the surveyed farmers were hired by the local forestry bureau to carry out the protection and management of natural forests, given the severe NFLD situation, so they could receive a fixed salary, which led to their low dependence on the natural forest resources and discouraged them to multiply their other income sources. That is the reason why farmers in Lixian had the lowest livelihood strategy index and the highest sustainability engagement. (3) The last group was that of Wuxi: except for the human asset, the other four assets were at the lowest or second lowest level among the five NFLD areas, contributing to their overall low livelihood assets. The natural asset, in particular, was the lowest limited, by its rocky alpine landform and small fragmented arable lands. Therefore, more farmers in Wuxi were squeezed to carry out other industries, such as migrant labors in the surrounding big cities, which resulted in the area’s low engagement with local sustainable activities and a middle level off-farm/forestry employment. The results of the disparity or heterogeneity of the different households were also emphasized by many existing studies [46,47,48].
Third, regarding the other NFLD areas, even though the NFLD vulnerability context, together with conservation policies and underdeveloped economic conditions, restricted the livelihood assets situation, the scores of the livelihood strategy and sustainability engagement of farmers in these areas were prone to rise due to the following trends. In China, more than 45% of rural populations have migrated to other areas to work (Table 12) in the push-and-pull mechanism [49,50]. The needs of industrialization and urbanization, high salaries and convenient infrastructure in cities pulled them in, whilst the NFLD situation and prohibition policies pushed them out of their existing areas. This would result in an increasing trend of off-farm/forestry opportunities and diversified livelihoods. Another trend led the conceptions of community engagement and sustainable development to be regarded as more significant for the authorities. For example, the central government underlined the community-engaged forest rangers mechanism, the public participation mechanism of natural forest conservation and restoration, and sustainable industries including ecotourism, leisure and health care and characteristic planting and breeding activities in the PPRNF, the latest natural forest protection plan promulgated in 2019 [15]. In sum, the trend of migrated working and policy support would give rise to the livelihood strategy and sustainability engagement situation. However, the pressure on the natural forest resources in these NFLD areas was still a challenge. Due to China’s large rural population base and its uncompleted urbanization process, the rural permanent residents reached 551.62 million in 2019 [51], and part of them lived in areas surrounded by natural forests. Farmers with limited livelihood assets and other livelihood sources might cause pressure on the natural forest resources, which is liable to accelerate the NFLD situation in some cases. Therefore, building greater resilience and improving the overall livelihood security should be taken into full consideration in the rural policy-making process.

5. Conclusions

This study has been an attempt to examine the livelihood sustainability of local farmers in the vulnerability of natural forest land degradation (NFLD), given that the natural disaster and its related conservation policy has caused some impact on their livelihood assets and shifted their choice of livelihood strategies, which also raised the need of sustainable engagement activities as an adaptive coping mechanism or win-win solution between livelihood improvement and environmental protection. This is particularly imperative, since land degradation, and especially the NFLD, has become a serious environmental issue, which caused massive challenges in biological safety and socio-economic development in the surrounding areas.

5.1. Policy Recommendation

Moreover, this study also provides guidance on specific solutions to cope with NFLD vulnerabilities in three perspectives. First, regarding the whole five NFLD areas, supports from natural, financial and social assets shall be provided to local farmers, such as the building of infrastructure for water access, subsidies and a stakeholder coordination mechanism. Furthermore, farmers shall also be guided to multiply their livelihood strategies and engage in more sustainable activities. Second, in detail, (1) for farmers in Changting, the sustainability engagement shall be further improved in combination with its advantage in livelihood assets. Other options could be adopted, including local characteristic husbandry (e.g., of Hetian Chicken) or non-timber forest product (NTFP) planting (e.g., of Chinese medicinal herbs). Moreover, given that Changting has the advantages of a convenient transportation infrastructure and a favorable geological position, close to Amoy City—which is a coastal city with a high socio-economic development—ecotourism could be developed here. (2) Farmers in Libo, Menghai and Lixian were in the second group, with a middle-level LSI. Regarding Libo and Menghai, the farmers there had relevant off-farm/forestry experiences, so the local authorities could offer some jobs in a local nature reserve and a primitive forest park, respectively. As regards Lixian, under the premise of finishing their daily protection and management, local farmers could be trained in non-agricultural skills like e-commerce and ecotourism services, etc. (3) For the households in Wuxi, active and comprehensive supports shall be adopted. Wuxi is located in Chongqing, a regional center municipality in southwestern China with large needs of ecological tourism. Therefore, revenue-generating options could be adopted, including ecotourism and Chinese traditional medicinal herbs which are suited to the natural conditions of Wuxi. Accordingly, those farmers with such guidance and support tend to engage more in sustainable livelihoods and multiply their income sources.
Third, regarding the other NFLD areas in China, farmers will face the opportunities of migrated working and the authorities’ support regarding sustainable development, while the challenges of the pressure on natural forests from the large rural population still exist. Therefore, integrated NFLD management measures with alternative livelihood or livelihood assets improvement shall be the priorities for policy-makers in order to curb NFLD deterioration and elevate the livelihood of farmers, an especially vulnerable segment of the population. In this process, the sustainability engagement elements shall be included. For instance, for those with employment experience, jobs related to sustainable engagement such as forest rangers and protection personnel could be offered by the local authorities in areas like Lixian, Libo and Menghai. Moreover, farmers in NFLD areas shall also develop sustainable revenue-generating options in combination with local comparative advantages and policy supports. In detail, ecotourism could be developed in areas with location and transportation advantages like Changting and Wuxi, whilst leisure and health care industries are suitable for areas with landscape values. Moreover, farmers could also try NTFPs including traditional Chinese herb planting and characteristic breeding in areas with climate advantages and local resources.

5.2. Contribution to the Literature

Through this study, two main contributions are made to the literature. First, the previous vulnerability studies mainly focused on other natural disasters, including flooding and droughts [52,53,54,55,56], rather than NFLD. However, as a prominent environmental issue, NFLD is of significance as a research subject. Therefore, an innovative livelihood sustainability index is constructed to analyze the livelihood in the vulnerability to NFLD. On the basis of the livelihood assets and livelihood strategy components, sustainability engagement as an imperative complementary part of the index is proposed, which is an effective measuring criterion, an adaptive coping mechanism and a win-win solution to NFLD. Second, this article enriches the research on the heterogeneity of different rural households in a larger scale and in a new vulnerability context. The heterogeneity and overall evaluation of farmers’ sustainable livelihood in the background of NFLD is verified and elaborated through empirical study, which bridges the research gap in this field and provides a reference as baseline data for the PPRNF and other natural forest conservation projects.
This research is based on cross-section or static data, with limited content on a dynamic study [57] on sustainable livelihood and livelihood vulnerability. Therefore, the tracing study or time-serial analysis of the dynamic process of livelihood could be further studied. Moreover, regarding the vulnerability, it is more complex in reality and usually comes in plural forms [40,58]. For example, some NFLD areas suffer from land degradation as well as other natural disasters, including typhoon and flooding, in some cases, which is also worth exploring further. In terms of natural forest protection projects and policies, it contains the social, economic and ecological perspectives which are relevant to the Sustainable Development Goals (SDG) [59,60]. The future study could focus on synergies to contribute to gender equity, environmental conservation mainstreaming and vulnerable population welfare safeguarding through the relevant natural forest conservation policies and projects.

Author Contributions

Conceptualization, methodology, software, validation, formal analysis, investigation, resources, data curation, Y.L.; writing—original draft preparation, writing—review and editing, visualization, Y.L. and C.H.; supervision, project administration, funding acquisition C.H. Both authors have read and agreed to the published version of the manuscript.

Funding

This research received no external funding.

Acknowledgments

This research was supported by the UNDP-GEF Land Degradation Project (Restoration of Degraded Natural Forests and Soil Erosion Management Improvement in Erosion-Prone Regions of China).

Conflicts of Interest

The authors declare no conflict of interest.

References

  1. Gao, J.; Liu, Y. Determination of land degradation causes in Tongyu County, northeast China via land cover change detection. Int. J. Appl. Earth Obs. Geoinf. 2010, 12, 9–16. [Google Scholar] [CrossRef]
  2. CCICCD. China Final National Report of the Voluntary Land Degradation Neutrality (LDN) Target Setting Programme; China National Committee to Implement the UNCCD: Beijing, China, 2017. [Google Scholar]
  3. UNCCD. Forests and Trees: At the Heart of Land Degradation Neutrality; UNCCD: Bonn, Germany, 2019. [Google Scholar]
  4. Scherr, S.J.; Yadav, S.N. Land Degradation in the Developing World: Implications for Food, Agriculture, and the Environment to 2020; Vision Discussion Papers; International Food Policy Research Institute (IFPRI): Washington, DC, USA, 1996. [Google Scholar]
  5. FAO. Global Forest Resources Assessment 2015; FAO: Rome, Italy, 2015. [Google Scholar]
  6. Bai, Z.G.; Dent, D. Recent land degradation and improvement in China. Ambio 2009, 38, 150–156. [Google Scholar] [CrossRef]
  7. Deng, X.; Li, Z. Economics of Land Degradation in China; Springer: Cham, Switzerland, 2016. [Google Scholar]
  8. Zhang, K.; Li, X.; Zhou, W.; Zhang, D.; Yu, Z. Land resource degradation in China: Analysis of status, trends and strategy. Int. J. Sustain. Dev. World Ecol. 2010, 13, 397–408. [Google Scholar] [CrossRef]
  9. Berry, L. Land Degradation in China: Its Extent and Impact; UNCCD: Bonn, Germany, 2003. [Google Scholar]
  10. Yuexian, Y. Impacts and Effectiveness of Logging Bans in Natural Forests: People’s Republic of China; FAO Regional Office for Asia and the Pacific: Bangkok, Thailand, 2001. [Google Scholar]
  11. Yang, H. China’s natural forest protection program: Progress and impacts. For. Chron. 2017, 93, 113–117. [Google Scholar] [CrossRef] [Green Version]
  12. NFGA. Forest Resources in China: The 9th National Forest Inventory; National Forestry and Grassland Administration: Beijing, China, 2019. [Google Scholar]
  13. Mullan, K.; Kontoleon, A.; Swanson, T.; Zhang, S. Evaluation of the impact of the natural forest protection program on rural household livelihoods. Environ. Manag. 2010, 45, 513–525. [Google Scholar] [CrossRef]
  14. Yu, J.; Ying, H. Research on the impact of financial input of natural forest protection project on the development level of people’s livelihood in forest areas. Issues For. Econ. 2020, 40, 595–601. [Google Scholar]
  15. Chunguang, S.; Zhenfeng, Z.; Lirong, C. Connotation, characteristics and development of natural forest protection public welfare undertakings in the new period. Issues For. Econ. 2021, 41, 13–19. [Google Scholar]
  16. Bayrak, M.; Marafa, L. Livelihood implications and perceptions of large scale investment in natural resources for conservation and carbon sequestration: Empirical evidence from REDD+ in Vietnam. Sustainability 2017, 9, 1802. [Google Scholar] [CrossRef] [Green Version]
  17. Tun, K.K.K.; Shrestha, R.P.; Datta, A. Assessment of land degradation and its impact on crop production in the dry zone of Myanmar. Int. J. Sustain. Dev. World Ecol. 2015, 22, 533–544. [Google Scholar] [CrossRef]
  18. Nyssen, J.; Frankl, A.; Zenebe, A.; Deckers, J.; Poesen, J. Land management in the northern Ethiopian highlands: Local and global perspectives; past, present and future. Land Degrad. Dev. 2015, 26, 759–764. [Google Scholar] [CrossRef]
  19. Htwe, T.N.; Brinkmann, K.; Buerkert, A. Spatio-temporal assessment of soil erosion risk in different agricultural zones of the Inle Lake region, southern Shan State, Myanmar. Environ. Monit. Assess. 2015, 187, 617. [Google Scholar] [CrossRef] [PubMed]
  20. Wang, C.; Zhang, Y.; Yang, Y.; Yang, Q.; Kush, J.; Xu, Y.; Xu, L. Assessment of sustainable livelihoods of different farmers in hilly red soil erosion areas of southern China. Ecol. Indic. 2016, 64, 123–131. [Google Scholar] [CrossRef]
  21. Chen, S.; Zha, X.; Bai, Y.; Wang, L. Evaluation of soil erosion vulnerability on the basis of exposure, sensitivity, and adaptive capacity: A case study in the Zhuxi watershed, Changting, Fujian Province, southern China. Catena 2019, 177, 57–69. [Google Scholar] [CrossRef]
  22. Alam, G.M. Livelihood cycle and vulnerability of rural households to climate change and hazards in Bangladesh. Environ. Manag. 2017, 59, 777–791. [Google Scholar] [CrossRef] [PubMed]
  23. Sarker, M.; Wu, M.; Alam, G.; Shouse, R. Livelihood vulnerability of riverine-island dwellers in the face of natural disasters in Bangladesh. Sustainability 2019, 11, 1623. [Google Scholar] [CrossRef] [Green Version]
  24. Xueyan, Z. Sustainable livelihoods research from the perspective of geography: The present status, questions and priority areas. Geogr. Res. 2017, 36, 1859–1872. [Google Scholar]
  25. Davies, G.M.; Pollard, L.; Mwenda, M.D. Perceptions of land-degradation, forest restoration and fire management: A case study from Malawi. Land Degrad. Dev. 2010, 21, 546–556. [Google Scholar] [CrossRef]
  26. Li, H.; Zhang, X.; Zhang, Y.; Yang, X.; Zhang, K. Risk assessment of forest landscape degradation using bayesian network modeling in the Miyun reservoir catchment (China) with emphasis on the Beijing-Tianjin sandstorm source control program. Land Degrad. Dev. 2018, 29, 3876–3885. [Google Scholar] [CrossRef]
  27. Teka, K.; Haftu, M.; Ostwald, M.; Cederberg, C. Can integrated watershed management reduce soil erosion and improve livelihoods? A study from northern Ethiopia. Int. Soil Water Conserv. Res. 2020, 8, 266–276. [Google Scholar] [CrossRef]
  28. Hella, J.P.; van Huylenbroeck, G.; Mlambiti, M.E. Small farmers’ adaptive efforts to rainfall variability and soil erosion problem in semiarid Tanzania. J. Sustain. Agric. 2003, 22, 19–38. [Google Scholar] [CrossRef]
  29. Rahman, S.; Akter, S. Determinants of livelihood choices: An empirical analysis from rural Bangladesh. J. South Asian Dev. 2014, 9, 287–308. [Google Scholar] [CrossRef]
  30. DFID. Sustainable Livelihoods Guidance Sheets; Department for International Development: London, UK, 1999; p. 445. [Google Scholar]
  31. WCFB. The 9th Second-Type Inventory of Forest Resources in Wuxi; Wuxi County Forestry Bureau: Wuxi, China, 2019. [Google Scholar]
  32. Zhao, Y.; Fan, J.; Liang, B.; Zhang, L. Evaluation of sustainable livelihoods in the context of disaster vulnerability: A case study of Shenzha County in Tibet, China. Sustainability 2019, 11, 2874. [Google Scholar] [CrossRef] [Green Version]
  33. Zhang, L.; Zhang, Y.; Yan, J.; Wu, Y. Livelihood diversification and cropland use pattern in agro-pastoral mountainous region of eastern Tibetan plateau. J. Geogr. Sci. 2008, 18, 499–509. [Google Scholar] [CrossRef]
  34. Li, H.; Nijkamp, P.; Xie, X.; Liu, J. A new livelihood sustainability index for rural revitalization assessment: A modelling study on smart tourism specialization in China. Sustainability 2020, 12, 3148. [Google Scholar] [CrossRef] [Green Version]
  35. Li, Z.; Hongmei, L.; Pei, L. Impact of livelihood capital on the choice of livelihood strategy for resettled farmers: Based on the survey of resettled farmers in Hunan province. Econ. Geogr. 2020, 40, 167–174. [Google Scholar]
  36. Nazari, S.; Rad, G.P.; Sedighi, H.; Azadi, H. Vulnerability of wheat farmers: Toward a conceptual framework. Ecol. Indic. 2015, 52, 517–532. [Google Scholar] [CrossRef]
  37. Dawei, X. Research on sustainable livelihoods of relocate migrants based on poverty alleviation. J. Arid Land Resour. Environ. 2020, 34, 66–71. [Google Scholar]
  38. Shannon, C.E.; Weaver, W. The Mathematical Theory of Communication; University of Illinois Press: Champaign, IL, USA, 1949. [Google Scholar]
  39. Zhu, Y.; Tian, D.; Yan, F. Effectiveness of entropy weight method in decision-making. Math. Probl. Eng. 2020, 2020, 3564835. [Google Scholar] [CrossRef]
  40. De Silva, M.M.G.T.; Kawasaki, A. Socioeconomic vulnerability to disaster risk: A case study of flood and drought impact in a rural Sri Lankan community. Ecol. Econ. 2018, 152, 131–140. [Google Scholar] [CrossRef]
  41. Guo, S.L.; Liu, S.Q.; Peng, L.; Wang, H.M. The impact of severe natural disasters on the livelihoods of farmers in mountainous areas: A case study of Qingping Township, Mianzhu City. Nat. Hazards 2014, 73, 1679–1696. [Google Scholar] [CrossRef]
  42. Yang, H.B.; Dietz, T.; Yang, W.; Zhang, J.D.; Liu, J.G. Changes in human well-being and rural livelihoods under natural disasters. Ecol. Econ. 2018, 151, 184–194. [Google Scholar] [CrossRef]
  43. Qiu, X.P.; Yang, X.T.; Fang, Y.P.; Xu, Y.; Zhu, F.B. Impacts of snow disaster on rural livelihoods in southern Tibet-Qinghai plateau. Int. J. Disaster Risk Reduct. 2018, 31, 143–152. [Google Scholar] [CrossRef]
  44. Barbier, E.B.; Hochard, J.P. Land degradation and poverty. Nat. Sustain. 2018, 1, 623–631. [Google Scholar] [CrossRef]
  45. Jendoubi, D.; Hossain, M.S.; Giger, M.; Tomicevic-Dubljevic, J.; Ouessar, M.; Liniger, H.; Speranza, C.I. Local livelihoods and land users’ perceptions of land degradation in northwest Tunisia. Environ. Dev. 2020, 33, 100507. [Google Scholar] [CrossRef]
  46. Wang, C.C.; Pang, W.; Hong, J. Impact of a regional payment for ecosystem service program on the livelihoods of different rural households. J. Clean. Prod. 2017, 164, 1058–1067. [Google Scholar] [CrossRef]
  47. Cai, J.; Wang, T.; Xia, X.L.; Chen, Y.Z.; Lv, H.Q.; Li, N. Analysis on the choice of livelihood strategy for peasant households renting out farmland: Evidence from western poverty-stricken areas in China. Sustainability 2019, 11, 1424. [Google Scholar] [CrossRef] [Green Version]
  48. Liang, Y.C.; Li, S.Z.; Feldman, M.W.; Daily, G.C. Does household composition matter? The impact of the grain for green program on rural livelihoods in China. Ecol. Econ. 2012, 75, 152–160. [Google Scholar] [CrossRef]
  49. Qi, J.L. Agglomeration and radiation effect of the pull of urbanization. Chin. Geogr. Sci. 2003, 13, 224–227. [Google Scholar] [CrossRef]
  50. Xu, D.D.; Zhang, J.F.; Xie, F.T.; Liu, S.Q.; Cao, M.T.; Liu, E.L. Influential factors in employment location selection based on “push-pull” migration theory-a case study in three gorges reservoir area in China. J. Mt. Sci. 2015, 12, 1562–1581. [Google Scholar] [CrossRef]
  51. National Bureau of Statistics. China Yearbook of Household Survey in 2019; National Bureau of Statistics: Beijing, China, 2019. [Google Scholar]
  52. Gharibvand, H.K.; Azadi, H.; Witlox, F. Exploring appropriate livelihood alternatives for sustainable rangeland management. Rangel. J. 2015, 37, 345–356. [Google Scholar] [CrossRef]
  53. Shunji, O.; Kadirbyek, D. Recovery from a winter disaster in Tov Province of Mongolia. J. Arid Environ. 2017, 139, 49–57. [Google Scholar]
  54. Hoq, M.S.; Raha, S.K.; Hossain, M.I. Livelihood vulnerability to flood hazard: Understanding from the flood-prone haor ecosystem of Bangladesh. Environ. Manag. 2021, 67, 532–552. [Google Scholar] [CrossRef] [PubMed]
  55. Thao, N.T.T.; Khoi, D.N.; Xuan, T.T.; Tychon, B. Assessment of livelihood vulnerability to drought: A case study in Dak nong Province, Vietnam. Int. J. Disaster Risk Sci. 2019, 10, 604–615. [Google Scholar] [CrossRef] [Green Version]
  56. Keshavarz, M.; Maleksaeidi, H.; Karami, E. Livelihood vulnerability to drought: A case of rural Iran. Int. J. Disaster Risk Reduct. 2017, 21, 223–230. [Google Scholar] [CrossRef]
  57. Peng, W.J.; Robinson, B.E.; Zheng, H.; Li, C.; Wang, F.C.; Li, R.N. Telecoupled sustainable livelihoods in an era of rural-urban dynamics: The case of China. Sustainability 2019, 11, 2716. [Google Scholar] [CrossRef] [Green Version]
  58. Toufique, K.A.; Islam, A. Assessing risks from climate variability and change for disaster-prone zones in Bangladesh. Int. J. Disaster Risk Reduct. 2014, 10, 236–249. [Google Scholar] [CrossRef]
  59. Leal, W.; Azeiteiro, U.; Alves, F.; Pace, P.; Mifsud, M.; Brandli, L.; Caeiro, S.S.; Disterheft, A. Reinvigorating the sustainable development research agenda: The role of the sustainable development goals (SDG). Int. J. Sustain. Dev. World Ecol. 2018, 25, 131–142. [Google Scholar] [CrossRef] [Green Version]
  60. Griggs, D.; Stafford-Smith, M.; Gaffney, O.; Rockstrom, J.; Ohman, M.C.; Shyamsundar, P.; Steffen, W.; Glaser, G.; Kanie, N.; Noble, I. Sustainable development goals for people and planet. Nature 2013, 495, 305–307. [Google Scholar] [CrossRef] [PubMed]
Figure 1. Study area map.
Sustainability 13 06580 g001
Figure 2. Per capita disposable income of rural residents in five NFLD areas. Source: According to the Statistical Yearbook of each county from 2015 to 2019.
Sustainability 13 06580 g002
Table 1. Basic conditions of surveying NFLD areas.
CountyChangtingLiboLixianMenghaiWuxi
Coordinates34°19′ N
105°18′ E
25°8′ N
107°57′ E
25°40′ N
116°20′ E
21°96′ N
100°45′ E
31°29′ N
109°21′ E
Province (municipality)FujianGuizhouGansuYunnanChongqing
Area (km2)30992432429953684030
Population (thousand)530180537329543
Climate condition Subtropical Monsoon
Climate
Subtropical Monsoon
Climate
Temperate Continental Monsoon
Climate
Tropical Monsoon
Climate
Subtropical Monsoon
Climate
Table 2. Livelihood Sustainability Index System.
Major ComponentsSub-ComponentsProxy Indicator Description of Indicators
Livelihood assets (E1)Human asset (0.0509)Household labor force ratio (0.0052) [32,34]Total labor force population/total household population
Labor education (0.0079) [34]Below primary school = 0; primary school = 1; junior high school = 2; high school = 3; college and above = 4
Labor skill training (0.0379) [34]Not trained = 0; trained with no effects = 1; trained with a little effects = 2; trained with great effects = 3
Natural asset (0.2260)Household farmland area (0.0824) [34](Mu)
Household woodland area (0.1336) [35](Mu)
Access to water (0.0100) [34,36]Insufficient and inconvenient = 0; either sufficient or convenient = 1; sufficient and convenient = 2;
Physical asset (0.0224)Household equipment assets (0.0140) [32]No = 0; 1 motorcycle = 1; 1 car/tractor = 2; 1 truck = 3
Housing condition (0.0083) [34]No houses = 0; rented house = 1; one-story house = 2; multi-story house = 3
Financial asset (0.1950)Difficulty in borrowing (0.1018) [34]Numbers of borrowing channels
Difficulty in loaning (0.0567) [34]Difficult = 0; general = 1; easy = 2
Family savings (0.0365) [34]No = 0; a small amount = 1; a large amount = 2
Social asset (0.1171)Connection to local cooperatives (0.0933) [37]No such organizations here = 0; have such organizations but not willing to join = 1; joined = 2;
Social network support (0.0238) [34]No assigned cadres = 0; yes but no effects = 1; yes with a little effects = 2; yes with great effects = 3
Livelihood strategies (E2)Diversification of livelihoods (0.0381)Number of livelihood activities (0.0381) [32,34]
Off-farm/forestry activities (0.0158)Ratio of employment irrelevant with traditional agricultural and forestry activities to all (0.0158) [32]
Sustainability engagement (E3)Participation in natural forest protection (0.1407)Times of participation in natural forest conservation projects as forestry rangers (0.1407)
Sustainable forestry-related activities (0.1939)Ratio of sustainable forestry-related activities to all (0.1939)
Note: Mu is the land area unit in China. 1 Mu = 0.0667 ha = 666.6667 square meters.
Table 3. Results of livelihood assets in different NFLD areas and original indicators.
LocationHuman AssetsNatural AssetsPhysical AssetsFinancial AssetsSocial AssetsLivelihood Assets
Changting0.4580 0.2255 0.6838 0.3489 0.2623 1.9785
Libo0.4690 0.1036 0.5833 0.2257 0.2937 1.6753
Lixian0.5397 0.1771 0.4099 0.1902 0.3272 1.6442
Menghai0.2506 0.2617 0.5180 0.2636 0.3366 1.6304
Wuxi0.5569 0.0673 0.4356 0.2265 0.2096 1.4958
Average0.4548 0.1670 0.5261 0.2510 0.2859 1.6849
Table 4. Description of indicators of human assets in different NFLD areas.
LocationLabor Force RatioEducationTrainingHuman Assets
Changting0.59102.80001.66670.4580
Libo0.57803.25001.32810.4690
Lixian0.50642.50001.58000.5397
Menghai0.64831.60710.71430.2506
Wuxi0.57382.88591.53690.5569
Average0.57952.60861.36520.4548
Table 5. Description of indicators of natural assets in different NFLD areas.
LocationFarmlandWoodlandAccess to WaterNatural Assets
Changting7.5497 10.5133 1.7000 0.2255
Libo9.9214 9.1655 1.6250 0.1036
Lixian8.0240 2.6500 1.5400 0.1771
Menghai39.0571 17.8571 1.6429 0.2617
Wuxi6.8104 13.8592 1.5101 0.0673
Average14.2725 10.8090 1.6036 0.1670
Table 6. Description of indicators of physical assets in different NFLD areas.
LocationEquipmentHousing ConditionPhysical Assets
Changting1.5333 2.6333 0.6838
Libo1.4375 2.4219 0.5833
Lixian1.2600 2.4000 0.4099
Menghai2.3929 2.2857 0.5180
Wuxi1.4966 2.4362 0.4356
Average1.6241 2.4354 0.5261
Table 7. Description of indicators of financial assets in different NFLD areas.
LocationDifficulty in Borrowing Difficulty in LoaningFamily SavingsFinancial Assets
Changting1.6333 0.9667 0.6667 0.3489
Libo1.1719 0.4375 0.9219 0.2257
Lixian1.2400 0.6400 0.5000 0.1902
Menghai1.3571 0.3571 0.5357 0.2636
Wuxi1.3154 0.5101 0.8322 0.2265
Average1.3436 0.5823 0.6913 0.2510
Table 8. Description of indicators of social assets in different NFLD areas.
LocationCooperativesSocial Network Social Assets
Changting0.5333 2.6333 0.2623
Libo0.4375 2.4219 0.2937
Lixian0.2600 2.4000 0.3272
Menghai1.3929 2.2857 0.3366
Wuxi0.4966 2.4362 0.2096
Average0.6241 2.4354 0.2859
Table 9. Values of livelihood strategies index in different NFLD areas.
LocationDiversification of LivelihoodsOff-Farm/Forestry ActivitiesLivelihood Strategy Index
Changting0.1211 0.0529 0.1740
Libo0.1440 0.1361 0.2801
Lixian0.1220 0.0456 0.1676
Menghai0.1991 0.0732 0.2723
Wuxi0.0826 0.1430 0.2256
Average0.1338 0.0901 0.2239
Table 10. Values of sustainability engagement index in different NFLD areas.
LocationParticipation in Natural Forest ProtectionSustainable Forestry-Related ActivitiesSustainability Engagement Index
Changting0.0439 0.0208 0.0647
Libo0.0393 0.0643 0.1036
Lixian0.0667 0.0837 0.1505
Menghai0.0693 0.0462 0.1155
Wuxi0.0477 0.0259 0.0736
Average0.0534 0.0482 0.1016
Table 11. Values of livelihood sustainability index in different NFLD areas.
LocationLivelihood AssetsLivelihood StrategiesSustainability Engagement Livelihood Sustainability Index
Changting1.9785 0.1740 0.0647 2.2171
Libo1.6753 0.2801 0.1036 2.0590
Lixian1.6442 0.1676 0.1505 1.9622
Menghai1.6304 0.2723 0.1155 2.0182
Wuxi1.4958 0.2256 0.0736 1.7950
Average1.6849 0.2239 0.1016 2.0103
Table 12. Situation of rural migrant labors in China. (Source: China Yearbook of Household Survey from 2015 to 2019).
YearMigrant Labor Population (Million)Ratio to Total Rural Population
2015277.4745.98%
2016281.7147.77%
2017286.5249.69%
2018288.3651.13%
2019290.7752.71%
Publisher’s Note: MDPI stays neutral with regard to jurisdictional claims in published maps and institutional affiliations.

