Abstract
Pedestrian safety is becoming a global concern and an understanding of the contributing factors to severe pedestrian crashes is crucial. This study analyzed crash data for San Antonio, TX, over a six-year period to understand the effects of pedestrian–vehicle crash-related variables on pedestrian injury severity based on the party at fault and to identify high-risk locations. Bivariate analysis and logistic regression were used to identify the most significant predictors of severe pedestrian crashes. High-risk locations were identified through heat maps and hotspot analysis. A failure to yield the right of way and driver inattention were the primary contributing factors to pedestrian–vehicle crashes. Fatal and incapacitating injury risk increased substantially when the pedestrian was at fault. The strongest predictors of severe pedestrian injury include the lighting condition, the road class, the speed limit, traffic control, collision type, the age of the pedestrian, and the gender of the pedestrian. The downtown area had the highest crash density, but crash severity hotspots were identified outside of the downtown area. Resource allocation to high-risk locations, a reduction in the speed limit, an upgrade of the lighting facilities in high pedestrian activity areas, educational campaigns for targeted audiences, the implementation of more crosswalks, pedestrian refuge islands, raised medians, and the use of leading pedestrian interval and hybrid beacons are recommended.
1. Introduction
Pedestrian–motor vehicle crashes are a common global occurrence [1] and every year millions of people get injured or killed from these crashes [2]. Pedestrians are fragile and usually travel at a much slower speed compared to motor vehicles, putting themselves at a disadvantage when a crash occurs compared to drivers or vehicle occupants, and therefore, they are much more susceptible to severe injuries and fatalities from crashes [3]. With the increase in automobile usage and the current trends in accommodating pedestrians and bicyclists on city streets, vulnerable road users (bicyclists, pedestrians, and motorcyclists) are expected to become more susceptible to traffic crashes, especially in places where traffic laws are poorly enforced [1].
Ensuring pedestrian safety on roadways to develop a safe, sustainable, and dynamic transportation system with minimal fatalities has become a major concern for transportation planners, engineers, and stakeholders because of the unprotected nature of pedestrians. The significant contribution of walking to the reduction in chronic disease rates and health care costs and improving public health has resulted in an increasing trend in the practice of walking [4]. Although roads are usually shared by both pedestrians and vehicles, often less consideration is given to pedestrian safety compared to the ease of movement of vehicles and driver safety, making it difficult for drivers and pedestrians to share the roadway. Hence, an understanding of the effects of crash-related variables (human/temporal/roadway/environmental) on pedestrian injury severity is of great importance in the process of robust countermeasure planning. In 2016, nearly 6000 pedestrians were killed in traffic crashes in the United States accounting for about 16% of all fatal traffic crashes [5]. Pedestrian crashes are often unreported, especially minor and non-injury crashes and crashes that did not occur on public roadways. Some states require several criteria to be fulfilled for a crash to be reported, which leaves many crashes unreported [6]. A review of 18 previous studies made at different times and localities that compared police, hospital, and insurance reported injury data found that 20% of severe injuries, 50% of minor injuries, and up to 60% of non-injury crashes were not reported [7].
1.1. Literature Review
Pedestrian crashes are influenced by several factors such as the age and gender of the pedestrians, lighting conditions, vehicle type, driver/pedestrian distraction, time of day, day of the week, road type, vehicle speed, traffic control, environment characteristics, road geometry, traffic volume, intersection presence, drug and alcohol influence, spatial location, and problematic driving behaviors [5,8,9]. Pedestrian mobility directly influences the odds of a pedestrian being involved in a crash or getting injured. Children and older pedestrians usually require more time to cross the road and have greater odds of getting involved in crashes. Pedestrians and drivers face difficulties in following traffic rules when they are distracted and become more susceptible to crashes [10]. In 2015, 16% and 21% of all fatalities involved older pedestrians (>65 years) and children (<15 years), respectively in the United States [11]. The influence of alcohol on drivers and/or pedestrians significantly increases the odds of pedestrian crashes. In 2016, the influence of alcohol on the pedestrian and/or driver was reported in about 50% of all fatal pedestrian crashes. More than 34% of fatal pedestrian crashes involved pedestrians with a blood alcohol concentration of at least 0.08 g/dL, and 15% involved drivers with a blood alcohol concentration of at least 0.08 g/dL [11]. Insufficient lighting on roadways affects the vision of drivers and pedestrians alike, which often leads to more frequent crashes and severe injuries. Pedestrians are much more susceptible to fatal crashes under dark conditions than any other light conditions based on the crash data for the 1997–2006 period in the U.S. [12]. Bad lighting conditions coupled with other crash contributing factors such as alcohol influence on pedestrians and high-speed limits on limited access roadways were found to greatly exacerbate the risk of pedestrian injuries and fatalities [13]. The effect of lighting conditions on fatal crash incidents is evident from the reduced crash frequency resulting from the implementation of daylight-saving time. Using data for 5 years (1987–1991), the analysis found that a one-hour daylight shift towards the evening hours prevented an estimated 727 pedestrian fatalities [13]. Both the severity of pedestrian injury and the rate of mortality appear to be related to gender. Male pedestrians were found to be more susceptible to severe injuries and fatalities compared to their female counterparts based on 2000–2004 data in Baltimore, MD [14]. Two-year data (2008–2009) from the U.S. Fatality Analysis Reporting System, General Estimates System, National Household Travel Survey, and population estimates were analyzed for the age group greater than 5 years old and it was found that the pedestrian fatality rate for males was more than twice than that for females. The ratio of male to female in terms of walking exposure was 0.995 and the collision risk and case fatality rate were 1.191 and 1.976, respectively [15].
The speed of motor vehicles is considered to be one of the most influential factors which determines injury severity. A detailed investigation of 176 fatal pedestrian crashes from 1983 to 1991 in Adelaide, Australia found that the reduction in the speed limit from 60 km/h to 50 km/h resulted in a 13–48% reduction in fatal pedestrian collisions [16]. Higher average traffic volumes at intersections were responsible for a relatively increased number of pedestrian crashes, while the rate of increase in pedestrian crashes was steeper at lower values of average traffic volume [17]. Hostile weather conditions (e.g., heavy rain, snow, fog, hail) can reduce visibility and decrease the friction between tires and the road surface, making the vehicle-maneuvering more difficult. In the U.S. and Great Britain, about 12% of all crashes happen during rain, and around 16% in Canada [18]. These proportions are much higher than the proportions during dry weather. Every year in the U.S., around 22% of vehicle crashes, 16% of fatal crashes, and 19% of crash injuries occur during adverse weather conditions [19]. A crash-based matched-pairs analysis approach with high resolution precipitation products (hourly, 4 × 4 km) found that rainfall increases the crash risk across the state by about 57% [20].
1.2. Economic Impact and Focus on San Antonio
The total cost of pedestrian and bicyclist injuries in 2000 was estimated to reach a total of $40.4 billion over the lifetimes of the injured [21]. This value represents the lifetime economic impact and losses for fatalities, non-fatal injuries, and damaged vehicles. There are also several indirect costs associated with pedestrian–vehicle collisions such as the loss of bodily and mental functions, productivity, etc. A study was carried out to determine the lifetime economic costs for 41,821 fatalities, 5.3 million non-fatal injuries, and 28 million damaged vehicles which occurred in 2000 in terms of the monetary value in 2002, which equated to $230.6 billion [22]. A more recent report from 2010 indicates the total cost is about $242.0 billion [23]. About 38,000 deaths from traffic crashes in 2018 resulted in $55.0 billion in medical and work loss costs [24]. Pedestrian crashes are one of the major contributors to this cost. The costs of these types of crashes continue to increase [25]. San Antonio (located in Bexar County) is one of the fastest-growing cities in the United States and the seventh most populous city in the country with a 2019 population of 1.533 million [26]. The population of San Antonio increased by 15.5% from 2010 to 2018 and the current proportion of females in the total population is slightly greater (50.6%) than males [27]. The population of San Antonio grew by 24,408 from 2016 to 2017, which is more than any other city in the United States [28]. This population growth is expected to increase the number of pedestrians and vehicles occupying the roads, leading to increased interactions unless proper countermeasures are adopted. The “Walk Score” measures the walkability of any address/location by analyzing the walking routes to nearby amenities, and points are awarded to the address/location based on their distance from amenities. The “Walk Score” of San Antonio is only 38 out of 100 [29], and San Antonio is ranked as the 18th most dangerous city for pedestrians out of 51 of the largest metro areas [30] in the United States. The number of people walking on the road is one of the best measures of exposure for pedestrians [31,32,33]; however, obtaining continuous pedestrian volume is very difficult.
1.3. Statistical Approaches and Scope of Study
Researchers have adopted several techniques in traffic safety analyses in previous studies: the simultaneous equations model [34], the negative binomial model [35,36,37], the random effect ordered logit model [38], the ordinal probit model [39], the random effect negative binomial model [40], and the Bayesian hierarchical binomial logistic model [41]. More recent approaches that have analyzed the injury severity from accidents include the generalized ordered approach [42], the zero inflated model [43], the fractional split approach [44], the copula approach [45], and the panel mixed approach [46]. Logistic regression can measure associations, can control for confounding variable effects [47], and has been widely used in previous pedestrian crash analysis studies to determine the associations between the injury severity and the contributory factors [48], to identify the fatal crash-related risk factors [49,50], and to analyze the vulnerability of older pedestrians [51].
The severity of a crash can be influenced by the party at fault in a crash and a few studies have explored how the party at fault influences the severity of the crash [52,53,54]. The failure to provide the right of way to motor vehicles is the primary fault of pedestrians. Fault from the pedestrians’ end gives motor vehicle drivers comparatively less reaction time and increases the injury severity risk [53]. This paper aims to contribute to the city of San Antonio’s plan to reduce severe pedestrian crashes on roadways by identifying severe pedestrian crash hotspots, determining the variables significantly associated with severe pedestrian crashes, analyzing how these predictors affect the crash severity to ensure the proper allocation of resources, and suggesting relevant countermeasures. The results are expected to aid the city of San Antonio, the Texas Department of Transportation, and other stakeholders to make informed decisions regarding future designs and to run campaigns for a targeted audience. This study contributes to the literature by identifying the strongest predictors for different levels of pedestrian injuries and by estimating how these predictors affect the different levels of injuries as stand-alone variables and in conjunction with other variables based on the party at fault.
2. Materials and Methods
The crash data for the period of January 2013 to December 2018 were acquired from the Texas Department of Transportation’s (TxDOT) Crash Records Information System (CRIS). The crash data are a collection of all the crashes that occurred on the roads throughout the State of Texas as reported by law enforcement officers. The CRIS database covers crash records starting from 2003. The law enforcement officer is required to forward a report on a crash that resulted in the injury or the death of any person, to the Texas Department of Transportation (TxDOT) no later than the 10th day after the date of the crash. Any crash that resulted in property damage to any one person’s property of $1000 or more must be reported to the TxDOT after investigation. The CRIS data for each year are categorized in the following files: crash, charge, person, primary person, unit, damage, restriction, and endorsement. CRIS provides the location (geographical coordinates) and the time of the crash along with the relevant information pertaining to the crash (e.g., environmental, driver, and vehicle characteristics).
Pedestrian-at-fault crashes were selected based on the contributing factors of the crashes. For each crash, up to three contributing factors are reported, the first one being the most relevant. Pedestrian-at-fault crashes were classified as crashes where at least one of the contributing factors for a pedestrian crash was the failure of the pedestrian to yield the right of way to vehicles. The injuries suffered by the pedestrians were divided into two categories: KA (fatal or incapacitating) injury and KAB (fatal, incapacitating, or non-incapacitating) injury. In other words, a KA injury indicates only severe injuries while a KAB injury indicates any type of confirmed injury. Three datasets were prepared for analyses: all pedestrian-related crashes, pedestrian-not-at-fault crashes, and pedestrian-at-fault crashes.
A heat map was constructed using pedestrian crash coordinates to represent the density of pedestrian crashes over the study area, using a color scheme incorporating a set of smoothly varying colors representing lower to higher density of crashes [55]. In the density calculation, the kernel density method was used which is suitable for the visualization of crash data as a continuous surface [56] and counts the number of crashes at each location as a density estimation. The density value is at the maximum at the center and gradually declines away from the center [57,58]. The KDE tool uses the quartic kernel function:
where = is the kernel function for 2-dimensional . Generally, is the radially symmetric unimodal probability density function [57].
The predicted density at a location is determined by the following formula:
where = are input points or point crashes; is the population field value of point ; and is the distance between point and the location.
Statistically significant spatial clusters of high values (hot spots) and low values (cold spots) were identified using the hot spot analysis (Getis-Ord Gi*). The mechanism creates an output feature with a z-score, p-value, and a confidence level bin for each input feature. In this analysis, a Complete Spatial Randomness (CSR) of the features or the values associated with those features was the underlying null hypothesis. To reject the null hypothesis, a statistically significant clustering or a dispersion of the features or the values associated with features based on the z-score and p-value was required. The p-value represents the probability of randomness in clustering and z-scores are standard deviations. When the p-value is very small along with a very high/low z-score, it suggests that the probability of a cluster being produced by random distribution is very small. False Discovery Rate correction was applied to account for multiple testing and the spatial dependence of the data. If the search bandwidth is too large, the produced pattern would be too smooth, making the process of differentiation harder between local hotspot locations. On the other hand, a narrow search bandwidth results in a spiky density pattern highlighting individual hotspot locations. As false conclusions can occur from such results, the “trial and error” method was adopted to resolve the problem as recommended by previous studies [59,60,61].
Severe pedestrian crash-prone locations are not revealed from the heat maps produced using crash density. A weight needs to be provided to each pedestrian crash based on the severity of the crash to identify hot/cold spots. The compromise approach where greater weight is provided to more severe crashes has been popular, but there is no standard optimum weighting system [62]. The Roads and Traffic Authority of New South Wales used a severity index of 3.0, 1.8, 1.3, and 1.0 for fatal, serious injury, other injury, and property damage only crashes, respectively [63]. Another study used a severity index of 5.0, 3.0, and 1.0 for fatal, serious, and light injury crashes [64]. Relatively greater weights were provided to pedestrian crashes resulting in fatal/serious injuries in this study to identify significantly high-risk locations for pedestrians and the severity () of a location was computed using the following equation:
where X1 is the total number of fatal crashes; X2 is the total number of incapacitating/serious injury crashes; X3 is the total number of non-serious injury crashes; X4 is the total number of possible injury crashes; and X5 is the total number of no injury/property damage only crashes.
The crash associated variables used in this study (Table 1) were selected from a literature review to analyze their effect on the severity of pedestrian crashes as stand-alone variables and in conjunction with other variables. The numbers and percentages of each class within each variable gives an initial impression of the effect of a variable on the severity of pedestrian crashes. This study explored the relationship between the severity of pedestrian crashes and pedestrian crash-associated variables as standalone variables using a bivariate analysis. Bivariate analysis identifies the relationship between two variables and can be used as an exploratory tool in testing the hypothesis of the association between a dependent variable and an independent variable. The chi-squared test was used in the bivariate analysis to determine statistically significant differences in two or more groups in the distribution of a categorical variable. Although the chi-squared test can determine whether two variables are related to one another, possible confounding factors are not controlled in the process and hence it cannot establish a definite causal relationship. Logistic regression models were developed to test the relationship of the severity of the pedestrian crash to the crash-associated variables (weather condition, lighting condition, surface condition, speed limit, road class, collision type, time, period of week, month, intersection presence, road alignment, traffic control, vehicle type) and the variables related to pedestrian characteristics (age, gender, ethnicity) using the severity of the pedestrian crash as the response variable. The logistic regression model is advantageous over the bivariate analysis as it can determine how a predictor affects the severity of the pedestrian crash while controlling for other predictors. The logistic regression analysis was performed using RStudio [65] and the values of the null deviance and the residual deviance along with their respective degrees of freedom obtained from the analysis were used to evaluate the overall performance of each model, where the null deviance suggests how well the model can predict the response with only an intercept, and the residual deviance shows the effectiveness of the response prediction by the model when predictors are included in the model. In other words, the difference between the null and the residual deviance represents the reduction in the deviance as a result of the inclusion of the predictor variables in the null model. An odds ratio was used to check the strength of the association of a significant variable class in the logit model. In this paper, the logit was the natural logarithm of the odds that the response variable Y was severe (Y = 1) versus non-severe (Y = 0), as shown by Equation (4):
where Q is the probability of severe crashes, Zi is the independent variable, and βi is the model coefficient directly determining the odds ratio. Figure 1 represents the step-by-step procedures of this study:
Logit (Q) = In (Q/1−Q) = β0 + β1*Z1 +…. + βi*Zi

Table 1.
Description of the study variables.
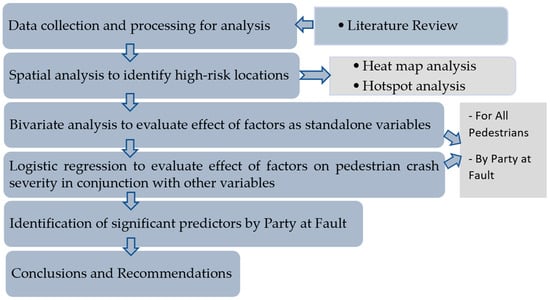
Figure 1.
Flow chart of study process.
This study had a few limitations. The injury severity was determined by the officer on duty and the officers’ judgement could be subject to error. The party at fault was determined based on the contributing factors reported by the officer and could be subject to judgement error. There is also the possibility of bias in the sample selection, which is often associated with crash data analyses as people involved in crashes might not be representative of the general road user population. The coordinates were unavailable for 28.1% of the crashes, so the heat maps and hotspots were prepared using only 71.9% of all crashes. The crash severity was reported as unknown when the severity could not be determined (e.g., hit and run, fled scene).
3. Results and Discussion
3.1. Spatial Analysis
A heat map and hotspot visualization were used to describe the spatial distribution of crashes and the areas with higher densities of severe crash occurrences (Figure 2, Figure 3, Figure 4 and Figure 5). The World Geodetic System (WGS 1984, EPSG:4326) was used as the geographic coordinate system for Figure 2, Figure 3, Figure 4 and Figure 5 with the World Street Map as the base map. Pedestrian crash density was highest in the downtown area, especially at intersections. This was expected since pedestrians constitute an essential element of downtown traffic for all cities. The intersections on E Houston St, E Travis St, E Commerce St, E Market St, S Zarzamora St, Fredericksburg Rd, and Wurzbach Rd were associated with frequent pedestrian crashes (Figure 2).
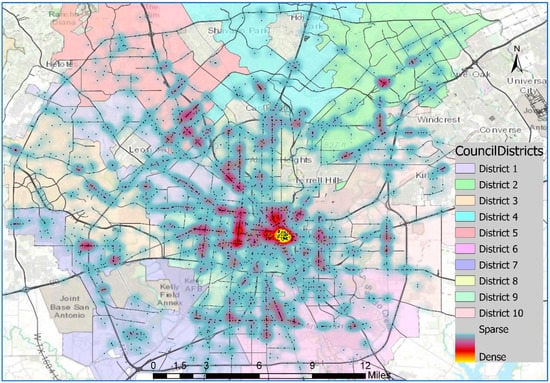
Figure 2.
Heat map of pedestrian crashes in San Antonio based on crash density.
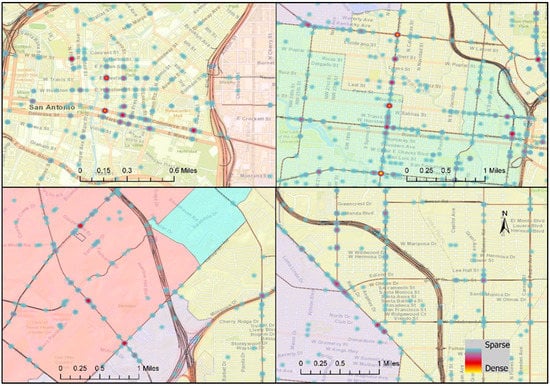
Figure 3.
Locations with frequent pedestrian crashes: intersections in the city center (top left), intersections on Zarzamora St (top right), intersections on Fredericksburg Rd and Wurzbach Rd (bottom left), and near the intersection of Fredericksburg Rd and Vance Jackson Rd (bottom right).
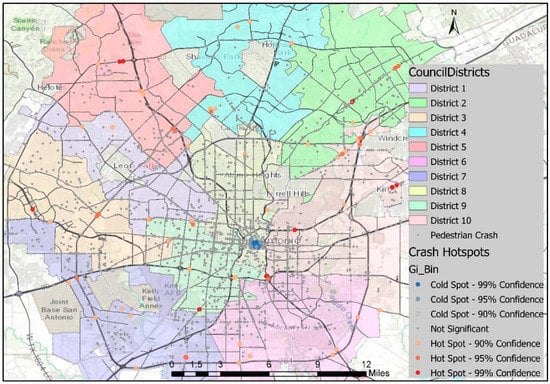
Figure 4.
Hotspots of pedestrian crashes in San Antonio based on crash severity.
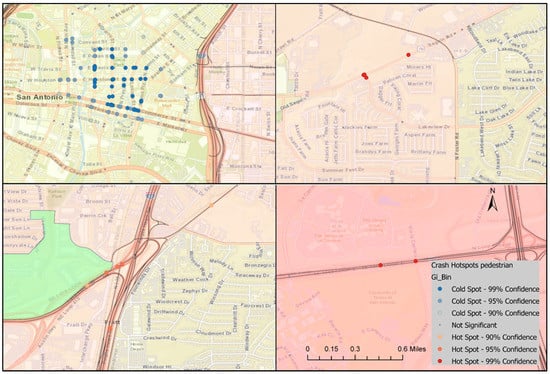
Figure 5.
Locations with statistically significant clusters of pedestrian crashes near the intersections at: E Houston St and Navarro St (top left), Seguin Rd and Lakeview Dr (top right), NE Loop 410 and Interstate-35 (bottom left), and La Cantera Pkwy and Loop-1604 (bottom right).
The spatial distribution of the locations with a high/low risk of severe crashes obtained from the hotspot analysis (Figure 4) was very different from the crash density distribution (Figure 2). Cold spots (locations with statistically significant clusters of non-severe crashes) were observed surrounding the intersections of major roads at the heart of the city (the same area with the highest pedestrian crash density). The statistical analysis concluded that the presence of intersections reduces the crash risk, justifying the distribution of these cold spots. Previous studies also found pedestrian crashes at intersections to be less severe compared to mid-block pedestrian crashes [62,66]. However, pedestrian crashes at the intersections in San Antonio still resulted in a substantial proportion of severe pedestrian injuries [67]. Hot spots were observed at locations with a relatively lower crash frequency: on loop 1604 near La Cantera, near the junction of I-10 and I-37, on Seguin Rd near Rittiman Creek, around the junction of Austin highway and 410 loop, and on Nacogdoches Rd on the NE part of the city (Figure 5).
Pedestrian crashes accounted for a total of 5316 crashes (5694 pedestrians involved) from 2013 to 2018, or 1.77% of the total crashes in San Antonio. However, pedestrian crashes represented 33.2% of all fatal crashes (305), 15.7% of all incapacitating injury crashes (713), and 8.9% of all non-incapacitating injury crashes (1969) in San Antonio. Figure 6 shows the variation in injury severity of pedestrians by the party at fault. Pedestrians were at fault for 1228 crashes (23.1%), and these crashes resulted in substantially higher KA injuries compared to crashes where pedestrians were not at fault (36.4% vs. 14.7%). This is because pedestrians encounter vehicles driving at relatively high speeds when the vehicle has the right of way. Figure 7 quantifies the extreme vulnerability of pedestrians to severe crashes by showing the annual proportions of pedestrian crashes and KA and KAB injuries over the study period. Although the proportion of pedestrian crashes slightly decreased over time, the proportion of pedestrian KA injuries followed an increasing trend.
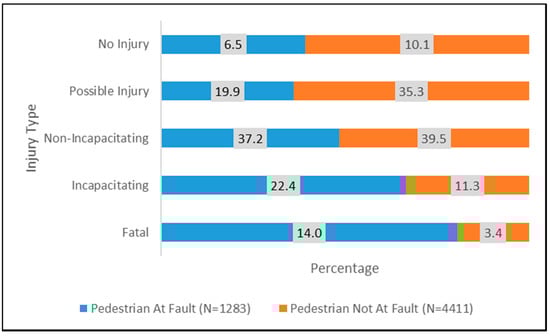
Figure 6.
Injury severity in pedestrian crashes by party at fault.
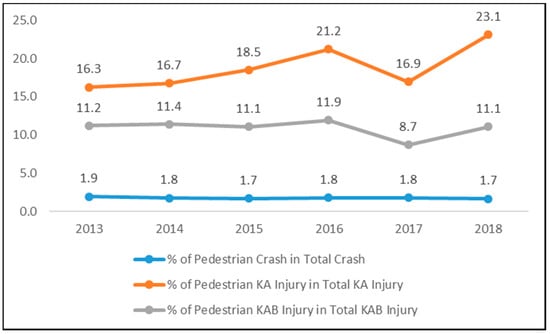
Figure 7.
Pedestrian crashes and injuries as proportions of the total traffic crashes and injuries.
3.2. Bivariate Analysis
Table 2, Table 3 and Table 4 provide the frequencies and the proportions of the pedestrian crashes and the crash severity levels against the selected variables that are potential crash contributing factors. This gives a preliminary idea of how these variables are related to the different levels of crash severity along with their frequencies. When the severe injuries of all the pedestrians are considered, the following crash variables are associated with a greater injury risk as observed from their respective injury percentages: dark lighting (both lighted and not lighted) conditions, interstate roads, a higher speed limit, the weekend period, not being at an intersection, nighttime, a collision while the vehicle is moving straight, curve (grade/hillcrest) alignment, motorcycle and emergency vehicles (police car, ambulance), and a divider/marked lane as a traffic control. For almost all cases, the severe injury risk of pedestrians was substantially higher when the pedestrians were at fault. The differences of proportions among the classes of individual variables were less striking when all the crashes that resulted in any type of confirmed pedestrian injury were considered. The differences among the classes were more prominent for lighting conditions, speed limit, road class, time of day, road alignment, alcohol influence, and traffic control. The influence of alcohol on drivers was an infrequent contributing factor for crashes when pedestrians failed to yield the right of way.
Table 2.
Proportions of pedestrian severe injury (KA) and any injury (KAB) crashes in San Antonio from 2013to 2018 for environmental -, temporal -, and vehicle-related variables.
Table 3.
Proportions of pedestrian KA and KAB crashes in the city of San Antonio from 2013to 2018 for different road characteristics variables.
Table 4.
Proportions of pedestrian KA and KAB crashes in the city of San Antonio from 2013to 2018 for human-related variables.
Details of the chi-squared test results and the respective OR values for the classes within each variable for all pedestrians, pedestrians-at-fault, and pedestrians-not-at-fault crashes are provided in Table 5, Table 6 and Table 7, respectively. In these tables, the classes within some of the variables were modified (compared to Table 2, Table 3 and Table 4) to better understand their effects on the crash severity. “Dark, lighted” and “Dark, not lighted” were combined and labeled as “Dark”. All inclement weather conditions (rain, snow, fog, hail) were labeled as “Rain”. Interstate roads, US highway, and FM roads were combined in one group (Highway/FM Road) while the rest were labeled as “Other Roads”. Classes within the road alignment variable were clustered in two new classes: Straight/Curve (Level) and Straight/Curve (Grade/Hillcrest). The ethnicity of the pedestrians was divided into two classes: Hispanic and non-Hispanic.
Table 5.
Chi-squared test results and OR for KA and KAB injury risks (all pedestrians).
Table 6.
Chi-squared test results and OR for KA and KAB injury risks (pedestrians at fault).
Table 7.
Chi-squared test results and OR for KA and KAB injury risks (pedestrians not at fault).
3.2.1. Environmental and Temporal Characteristics
The increased severe injury risk associated with some of the factors is intuitively apparent. Dark lighting conditions are understandably more dangerous for pedestrians, especially when the pedestrians are at fault, as the combined effect of the unexpectedness of the crash and the reduced visibility would most likely increase the reaction time of the drivers. Under dark lighting conditions, the likelihood of severe injury and any type of injury were quadrupled and doubled, respectively, compared to daylight conditions when pedestrians were at fault. Dark lighting conditions had a similar effect on severe pedestrian injury in previous studies [12,66]. The majority of pedestrian crashes occurred under clear/cloudy weather conditions on dry road surfaces. Rainy weather had no effect when only severe pedestrian injuries are considered. However, contrary to a previous study [20], rainy weather slightly reduced the injury risk when the crashes resulting in any type of pedestrian injury are considered. Non-severe injury is largely associated with a lower vehicle speed, and the rainy weather/wet surface might force drivers to drive with more caution, resulting in fewer non-severe injuries under these conditions.
The increased likelihood of severe injury during nighttime (8 p.m.–6 a.m.) could also be related to reduced visibility. Compared to daytime injury severity risk, severe pedestrian injury risk during the nighttime was almost three times higher. About 41.4% of pedestrian crashes occurred under dark lighting conditions. However, these crashes accounted for 63.8% of severe crashes. The weekend period is generally associated with a greater number of drunk drivers/pedestrians [68,69], which might have contributed to the increased severe injury risk (overall OR of 1.41) during this period. The risk of pedestrian injury was high during the weekend, irrespective of the party at fault and the severity of injury. Fall (September–November) and summer (June–August) seasons had a greater severe injury risk when the pedestrians were not at fault (statistically significant) and a greater non-severe injury risk when the pedestrians were at fault (statistically not significant).
3.2.2. Road and Vehicle Characteristics
The proportion of severe injury crashes was substantially higher on interstate roads (41.6%) compared to city streets (19.2%) and increased with the speed limit of the road (23.1% on roads with a speed limit >25 mph vs. 8.5% when ≤25 mph) for all pedestrian crashes as the injury would be more severe when the collision occurred at a higher speed. This observation is consistent with previous studies [16,70]. Moving-straight vehicles generally have a greater speed compared to turning or backing vehicles, which explains the greater severe injury risk in collisions when vehicles were moving straight. Pedestrian crashes on non-traffic ways are substantially less severe and mostly include crashes where the pedestrians were not the party at fault. However, when the pedestrians were at fault, the severe injury risk was almost three times the overall injury risk on these roads. Left-turning crashes have a much lower severe injury risk than straight moving crashes.
Intersections are usually well equipped with pedestrian signage and the vehicle speed is relatively lower at intersections, which might be the reasons behind the lower proportion of severe crashes at intersections (OR of 0.63). When pedestrians were not at fault, the presence of the intersection reduced the proportion of severe injuries more compared to non-severe injuries. The severity of both fatal/incapacitating and non-incapacitating injury was lower at intersections when the pedestrians were at fault. The curve alignment (grade/hillcrest) of roads affects visibility and makes maneuvering relatively more difficult, making pedestrian crashes more severe. The grade/hillcrest alignment almost doubled the proportions of both types of injury severity. Crosswalks and stop signs were associated with notably low proportions of severe crashes, especially when pedestrians were not at fault. Severe injury proportions at the divider and the marked lanes were approximately three times higher compared to the crosswalk/stop sign. The crosswalk also substantially reduced the pedestrian crash proportions resulting in injuries. Emergency vehicles (e.g., police cars, ambulances, fire trucks) represented a greater proportion of severe pedestrian injury crashes compared to other types of vehicles as they generally travel at higher speeds. Motorcycle crashes resulted in severe pedestrian injury approximately half of the time regardless of the party at fault. Approximately 9 out of 10 pedestrian crashes with motorcycles resulted in some sort of injury of the pedestrians irrespective of the party at fault. Collision with a bus had the lowest severe pedestrian injury risk; this is another reason to promote the use of public transportation services.
3.2.3. Pedestrian Characteristics
The age and gender of pedestrians are strongly related to the risk of severe injury as observed from their respective proportions. An increase in the age of the pedestrian increased the severe injury risk, probably due to a decreased mobility and an increased reaction time. Pedestrians aged 65 or above were at the highest severe injury risk while the risk for young pedestrians (age < 19) was the lowest. Overall, male pedestrians were more common victims (58.2%), and had higher severe injury proportions, consistent with previous studies [14,15]. However, in pedestrian-at-fault crashes, 67.7% were male, which implies that the male population might be more reluctant to comply with the regulations and/or are more associated with risky behavior [71,72]. When the total population of San Antonio were considered, 25.3% were aged less than 18 years and 11.8% were aged 65 or over [22]. The proportions of the age groups in the total population of San Antonio were in concert with the proportions of pedestrian crash incidents. The increased odds of severe injuries for older and male pedestrians are consistent with previous studies [14,73].
The proportions of severe injury among pedestrians, however, were more uniform among different ethnicities. Hispanic pedestrians were dominant in the crash data, consistent with the demographics of San Antonio. When pedestrians were divided into two groups (Hispanic and non-Hispanic), the non-Hispanic group had a slightly greater severe injury risk (OR 1.14). The age distribution among those of Hispanic ethnicity shows a greater proportion of young pedestrians (age ≤ 18 years) which might explain the associated lower severe injury risk as young pedestrians are less prone to severe injury. When pedestrians were at fault, the KAB injury severity was slightly greater for those of non-Hispanic ethnicity. The association between the KAB injury severity and the pedestrian characteristic-related variables was relatively weaker compared to the KA injury severity. Lastly, the influence of alcohol on drivers also significantly influenced the severe injury risk, especially when pedestrians were not the party at fault. This calls for the implementation of stricter policies to discourage driving when intoxicated.
3.3. Logistic Regression Results
The association between the severity of the pedestrian crash and key human-, environment, and vehicle-related factors was further analyzed using logistic regression analysis. For each combination of datasets and the level of the injury severity, two logit models were constructed (one included human-related factors and the other one included the rest of the factors). Table 8 and Table 9 include the coefficient estimates in log-odds terms for each category in a variable along with the respective reference category, significance, and odds ratio. The differences among the coefficient estimates of the categorical variables are indicative of their effects on the crash severity. When the estimate coefficient associated with a variable is negative, it indicates a decrease in the odds of a severe injury. On the other hand, a positive estimate coefficient suggests an increase in the odds of severe pedestrian injury. For example, the negative coefficient estimate associated with the daylight lighting condition (−0.63) for all pedestrians in Table 8 implies that a change from dark lighting conditions to daylight conditions decreases the log odds of a severe pedestrian injury by 0.63, and the significance of the variable expressed in the form of asterisks indicates that daylight lighting conditions significantly reduce severe pedestrian injury crashes. Similarly, the positive coefficient (0.86) and significance (***) associated with the male gender class when all pedestrians are considered (Table 8) suggests that male pedestrians have significantly higher odds of being involved in a severe pedestrian crash. The odds ratio is determined from the regression coefficient estimate and represents the strength of the association of a predictor variable with severe pedestrian crashes. The odds ratio is essentially the ratio of the odds of the occurrence of an event given the presence of the independent variable compared to the odds of the occurrence of that event in the absence of that independent variable. For example, the odds of a severe pedestrian crash under daylight lighting conditions were almost half (OR 0.53) compared to dark lighting conditions, while the odds of a male pedestrian being involved in a severe crash (OR 1.45) were greater compared to the odds for a female pedestrian when all pedestrian crashes were considered.
Table 8.
Logistic Regression Model Results for Severe Pedestrian Injury (KA).
Table 9.
Logistic Regression Model Results for Any Type of Pedestrian Injury (KAB).
Overall, the results from the logistic regression model were consistent with the bivariate analysis. The statistical significance of the variables and their strength of association with the severity of pedestrian crashes varied between the bivariate analysis and the logistic regression model, but the relationship direction (positive/negative) between the crash severity and a variable was similar regardless of the crash severity and the party at fault in a crash. The gender of the pedestrian, the road type, and the speed limit of the road were strong predictors of pedestrian injury irrespective of severity. Traffic controls, lighting conditions, and the age of the pedestrian have a greater association with severe pedestrian injury while the collision type and the crash occurrence time have a stronger association with non-severe injury. Except for the road speed limit, the factors affecting driver reaction time (e.g., lighting condition, traffic control device, vehicle type) were generally strong predictors of severe injury-related pedestrian-at-fault crashes. On the other hand, the factors related to the characteristics of the road environment (e.g., road type, road speed limit, road alignment, lighting condition) were better predictors of severe pedestrian crashes where pedestrians were not at fault. The day of the week was a significant predictor in determining both types of injury severity in the bivariate analysis as a stand-alone variable. However, when analyzed in conjunction with other variables in the logistic regression model, the day of the week was not significant in determining severe pedestrian crashes.
In the case of KAB injuries, the crash occurrence time and a collision while driving straight were common significant predictors regardless of the party at fault. Other than these two predictors, lighting conditions, the gender of the pedestrian, and the age of the pedestrian were significant predictors of any type of pedestrian injury when pedestrians were the party at fault. Pedestrian crashes where pedestrians were not the party at fault and which resulted in any type of pedestrian injury had several strong predictors (collision type, road type, speed limit, road alignment, crash occurrence time, season, age of the pedestrian), but the collision type was the most significant among them. When severe pedestrian injury is considered, collisions while driving straight have the highest odds of severe pedestrian injury irrespective of the party at fault and left-turn crashes have a higher pedestrian injury risk compared to right-turn crashes, especially when the pedestrians were at fault. However, when any type of pedestrian injury is considered, left-turn crashes had the highest odds of injury when the pedestrians were not at fault whereas right-turn crashes had higher odds of pedestrian injury compared to left-turn crashes when pedestrians were at fault. Right turns are often preceded by a stop of the vehicle, and the available space for a vehicle to make a right turn is generally shorter compared to the space available for a left turn, resulting in a reduced vehicle speed while taking a right turn. Moreover, drivers and pedestrians are less aware of a collision when a vehicle is taking a left turn compared to a right turn, as at least one party often remains outside of the line of sight of the other party, especially when the pedestrian is moving from the near end/mid-section of the road to the far end. This might contribute to the greater severe pedestrian injury risk associated with left-turning vehicles compared to right-turning vehicles. In general, the most significant predictors of severe pedestrian injury crashes were related to the vehicle speed (higher road speed limit, highway roads, straight moving vehicle), lighting conditions (dark lighting condition, 8 p.m.–6 a.m. period), and the age of the pedestrian. The odds of older pedestrians (age ≥ 65 years) being involved in a severe pedestrian crash are more than double compared to young pedestrians (age ≤ 18), irrespective of the party at fault (Table 8). However, when any type of confirmed pedestrian injury is considered, the increased odds of injury for older pedestrians were only significant when the pedestrians were not at fault and the odds of KAB injury were lower compared to the odds of severe injury. Hispanic pedestrians have slightly higher odds of severe injury in a crash, but the association is not significant. Curved road alignment (grade/hillcrest) increased the odds of severe pedestrian injury more when the pedestrians were at fault compared to when the pedestrians were not at fault, probably due to the reduced available reaction time for drivers performing relatively difficult maneuvering tasks. The presence of intersections reduced the odds of pedestrian injury, especially severe pedestrian injury. The traffic at intersections is often controlled by stop signs, signals, and crosswalks. These traffic controls significantly reduce the odds of pedestrian injury and might be one of the reasons that explain the reduced odds of pedestrian injury at intersections. Although rainy weather conditions did not affect severe pedestrian injuries as a stand-alone variable in the bivariate analysis, the odds of severe injury of pedestrians increased (not statistically significant) in rainy weather conditions when its effect was analyzed in conjunction with other variables in the logistic regression model. However, when any type of confirmed pedestrian injury is considered, the effect of rainy weather on pedestrian injury was similar in both the bivariate analysis and the logistic regression model.
4. Conclusions
Pedestrians are the most vulnerable road users and there is a rising trend of pedestrian crashes in the US in recent years. This study tried to understand the complex relationships between the severity of the pedestrian injury and the crash-associated factors using six-year crash data for the city of San Antonio, Texas. The crash data included the location (geographical coordinates) and the time of the crash along with the relevant information pertaining to the crash (e.g., environmental, driver, pedestrian, road, and vehicle characteristics). Pedestrian crashes were divided into two sub-groups based on the party at fault in the crash. For each sub-group, the relationship between different human-, environment-, and vehicle-related factors and the proportions of pedestrian crashes with two different injury severity levels (KA and KAB) was examined using a bivariate analysis and logistic regression modeling.
While some variables (the gender of the pedestrian, road type, road speed limit) are strong predictors of pedestrian injury irrespective of the severity of injury, lighting conditions, traffic controls, and the age of the pedestrian are significantly strong predictors of severe pedestrian injury only. Road dividers as traffic controls and dark lighting conditions increase the required reaction time of the driver by reducing the visibility and creating unexpected encounters with pedestrians, leading to more deadly collisions and severe injuries. Pedestrian-at-fault crashes resulted in a substantially higher proportion of severe pedestrian injuries compared to crashes where pedestrians were not at fault. The lighting conditions, the age of the pedestrian, and the vehicle type were strong predictors of severe pedestrian injury irrespective of the party at fault. The variables affecting driver reaction time such as lighting conditions, traffic controls, and vehicle types were generally strong predictors of severe pedestrian injury in crashes where pedestrians were the party at fault. On the other hand, the variables related to the characteristics of the road environment such as road type, road speed limit, and road alignment along with the type of collision were better predictors of crashes where pedestrians were not at fault. The influence of alcohol on drivers and nighttime conditions (8 p.m.–6 a.m.) substantially increased the risk of severe pedestrian injury irrespective of the party at fault. The day of the week was a significant predictor only for pedestrian-not-at-fault crashes and the odds of severe pedestrian injury increased during the weekend, which might imply increased faulty driver behavior during the weekend. The implementation of anti-drunk driving technologies such as a breathalyzer or a touch sensor that prevents a drunk driver from starting a vehicle based on his blood alcohol concentration should be encouraged.
In addition to emergency vehicles, which expectedly travel at high speeds, pick-up trucks had relatively higher odds of severe injury, probably due to their rigid body structures, which calls for the promotion of vehicles designed for improved pedestrian safety. Crosswalks as traffic controls have significantly lower severe injury risks compared to other traffic control situations. Crosswalks, raised medians, and pedestrian refuge islands should be introduced at locations with high frequencies of severe pedestrian injury. Hybrid detection approach techniques could be helpful in determining large pedestrian flows in urban areas to determine suitable locations to implement pedestrian facilities [74]. Leading pedestrian intervals at intersections and pedestrian hybrid beacons at midblock crossings and uncontrolled intersections are proven techniques to minimize pedestrian–vehicle crashes [75] and should be introduced more on roadways. A higher road speed limit reduces driver and pedestrian reaction times and increases the severe injury risk, especially under dark lighting conditions and on curved (grade/hillcrest) road segments where the visibility of road users is affected. The identification of such road segments, a reduction in the permissible speed limit of vehicles on those segments, and the implementation of reflective signs for drivers in advance along with the provision of sufficient lighting and pedestrian facilities may help to reduce severe pedestrian injuries.
The primary contributing factor for pedestrians was a failure to yield the right of way to vehicles, while driver inattention was the primary contributing factor related to vehicle drivers followed by the failure to yield the right of way to pedestrians. Following the Texas roadway design manual, many districts in Texas have restricted legal access of pedestrians on highways, bridges, and busy roads in high-traffic areas. Even on roads with pedestrian access, pedestrians are expected to abide by certain rules and regulations, such as the mandatory use of sidewalks when provided and available. Many pedestrians are unaware of these rules and restrictions, resulting in their failure to safely share the roadway with vehicles. Severe pedestrian crashes resulting from driver inattention could be reduced by implementing the mandatory installation of pedestrian automatic emergency braking systems (PAEB) and encouraging the use of autonomous vehicles [76,77]. Pedestrian crash frequency is higher in the city center and the introduction of pedestrian overcrossings at high-risk locations might help to minimize pedestrian–vehicle collisions. Further studies using spatiotemporal regression and simulation models could be helpful in determining the high-risk locations to implement pedestrian overcrossings [78,79].
The city of San Antonio adopted the Vision Zero safety approach in 2015 with the guiding principle being the elimination of loss of life on roadways [80], and this study could assist the city of San Antonio in achieving this goal. The identification of the high-risk locations and the primary contributing factors of severe pedestrian crashes are expected to aid the city of San Antonio in making informed and effective decisions in prioritizing resource allocation. Understanding the effects of crash-associated variables on the different levels of the severity of pedestrian crashes based on the party at fault could help the policymakers run effective campaigns for targeted audiences, to make practical modifications to existing facilities and policies, and to implement future pedestrian facilities. This study did not include traffic volume data in the spatial analysis due to the unavailability of city-wide traffic volume data and the temporal correlation in the data over the years was not taken into consideration, which could adversely affect the precision of parameter estimates [81]. Additionally, only the basic demographic information was used as pedestrian-related human factors due to the limited availability of other information. Moreover, the human factors related to motor vehicle drivers could be further explored to determine the crashes where the pedestrians were not at fault. The injury severity information of pedestrians was not linked to hospital data or cross-checked with external sources and solely relied on the judgment of law enforcement officers, which is another limitation of this study. Future studies could adopt a more parsimonious approach in terms of losing samples by using the full data with the party at fault as a variable to address the reduction in the sample size from data segmentation [46]. The city of San Antonio, the Texas Department of Transportation, and other stakeholders should assign policies based on the suggested recommendations in the previous sections to reduce severe pedestrian crash incidents in San Antonio.
Author Contributions
H.O.S. and S.D. guided this research, contributed significantly to preparing the manuscript for publication and contributed to developing the research methodology. K.B. processed the data, developed the scripts used in the analysis, and performed the analysis. K.B. prepared the first draft. H.O.S. and S.D. performed the final overall proof reading of the manuscript. All authors have read and agreed to the published version of the manuscript.
Funding
The financial support of the Transportation Consortium of South-Central States (Tran-SET) is greatly appreciated (Tran-SET Project 20SAUTSA35 and Grant Number 69A3551747106). This research was partially funded by a professional service agreement between the University of Texas at San Antonio and the city of San Antonio.
Institutional Review Board Statement
Not applicable.
Informed Consent Statement
Not applicable.
Data Availability Statement
Publicly available datasets were analyzed in this study. The data can be found here: https://cris.txdot.gov/ (accessed on 18 May 2019).
Conflicts of Interest
The authors declare no conflict of interest.
References
- Beck, L.F.; Dellinger, A.M.; O’Neil, M.E. Motor Vehicle Crash Injury Rates by Mode of Travel, United States: Using Exposure-Based Methods to Quantify Differences. Am. J. Epidemiol. 2007, 166, 212–218. [Google Scholar] [CrossRef]
- Khan, M.A.B.; Grivna, M.; Nauman, J.; Soteriades, E.S.; Cevik, A.A.; Hashim, M.J.; Govender, R.; Al Azeezi, S.R. Global Incidence and Mortality Patterns of Pedestrian Road Traffic Injuries by Sociodemographic Index, with Forecasting: Findings from the Global Burden of Diseases, Injuries, and Risk Factors 2017 Study. Int. J. Environ. Res. Public Health 2020, 17, 2135. [Google Scholar] [CrossRef] [PubMed]
- Zegeer, C.V.; Bushell, M. Pedestrian Crash Trends and Potential Countermeasures from around the World. Accid. Anal. Prev. 2012, 44, 3–11. [Google Scholar] [CrossRef]
- Lee, I.-M.; Buchner, D.M. The importance of walking to public health. Med. Sci. Sports Exerc. 2008, 40, S512–S518. [Google Scholar] [CrossRef]
- National Center for Statistics and Analysis. Pedestrian: 2016 Data; Traffic Safety Facts. Report No. DOT HS 812 493; National Highway Traffic Safety Administration: Washington, DC, USA, 2018.
- Hauer, E. The frequency-severity indeterminacy. Accid. Anal. Prev. 2006, 38, 78–83. [Google Scholar] [CrossRef] [PubMed]
- Hauer, E.; Hakkert, A.S. Extent and some implications of incomplete accident reporting. Transp. Res. Rec. 1988, 1185, 17. [Google Scholar]
- Da Silva, M.P.; Smith, J.D.; Najm, W.G. Analysis of Pedestrian Crashes April. 2003. Available online: https://trid.trb.org/view/678125 (accessed on 18 April 2020).
- Ming, S.; Sun, X.; Shan, D. Pedestrian Crash Analysis with Latent Class Clustering Method. Accid. Anal. Prev. 2019, 124, 50–57. [Google Scholar] [CrossRef]
- Fleiter, J.J.; Watson, B. Addressing the Road Trauma Burden in China: Exploring Attitudes, Behaviours, Risk Perceptions and Cultural Uniqueness. Accid. Anal. Prev. 2016, 95, 326–333. [Google Scholar] [CrossRef] [PubMed]
- National Highway Traffic Safety Administration. Traffic Safety Facts 2015 Data—Pedestrians; Publication No. DOT-HS-812-375; US Department of Transportation, National Highway Traffic Safety Administration: Washington, DC, USA, 2017. Available online: https://crashstats.nhtsa.dot.gov/Api/Public/ViewPublication/812375 (accessed on 13 February 2018).
- Chang, D. National Pedestrian Crash Report, June. 2008. Available online: https://trid.trb.org/view/865004 (accessed on 18 April 2020).
- Ferguson, S.A.; Preusser, D.F.; Lund, A.K.; Zador, P.L.; Ulmer, R.G. Daylight saving time and motor vehicle crashes: The reduction in pedestrian and vehicle occupant fatalities. Am. J. Public Health 1995, 85, 92–95. [Google Scholar] [CrossRef] [PubMed]
- Clifton, K.J.; Burnier, C.V.; Akar, G. Severity of Injury Resulting from Pedestrian–vehicle Crashes: What Can We Learn from Examining the Built Environment? Transp. Res. Part D Transp. Environ. 2009, 14, 425–436. [Google Scholar] [CrossRef]
- Zhu, M.; Zhao, S.; Coben, J.H.; Smith, G. Why more male pedestrians die in vehicle-pedestrian collisions than female pedestrians: A decompositional analysis. Inj. Prev. 2013, 19, 227–231. [Google Scholar] [CrossRef] [PubMed]
- Anderson, R.W.G.; McLean, A.J.; Farmer, M.J.B.; Lee, B.H.; Brooks, C.G. Vehicle Travel Speeds and the Incidence of Fatal Pedestrian Crashes. Accid. Anal. Prev. 1997, 29, 667–674. [Google Scholar] [CrossRef]
- Lee, C.; Abdel-Aty, M. Comprehensive Analysis of Vehicle–pedestrian Crashes at Intersections in Florida. Accid. Anal. Prev. 2005, 37, 775–786. [Google Scholar] [CrossRef] [PubMed]
- Sun, X.; Hu, H.; Habib, E.; Magri, D. Quantifying Crash Risk under Inclement Weather with Radar Rainfall Data and Matched-Pair Method. J. Transp. Saf. Secur. 2011, 3, 1–14. [Google Scholar] [CrossRef]
- Federal Highway Administration. Road Weather Management Program: How Do Weather Events Impact Roads? 2017. Available online: https://ops.fhwa.dot.gov/weather/qlroadimact.htm (accessed on 3 July 2017).
- Omranian, E.; Sharif, H.; Dessouky, S.; Weissmann, J. Exploring Rainfall Impacts on the Crash Risk on Texas Roadways: A Crash-Based Matched-Pairs Analysis Approach. Accid. Anal. Prev. 2018, 117, 10–20. [Google Scholar] [CrossRef]
- Miller, T.R.; Zaloshnja, E.; Lawrence, B.A.; Crandall, J.; Ivarsson, J.; Finkelstein, A.E. Pedestrian and Pedalcyclist Injury Costs in the United States by Age and Injury Severity. Annu. Proc. Assoc. Adv. Automot. Med. 2004, 48, 265–284. [Google Scholar] [PubMed]
- Blincoe, L.J.; Seay, A.G.; Zaloshnja, E.; Miller, T.R.; Romano, E.O.; Luchter, S.; Spicer, R.S. The Economic Impact of Motor Vehicle Crashes, 2000; National Highway Traffic Safety Administration: Washington, DC, USA, 2002.
- Blincoe, L.J.; Miller, T.R.; Zaloshnja, E.; Lawrence, B.A. The Economic and Societal Impact of Motor Vehicle Crashes, 2010; Report No. DOT HS 812 013; National Highway Traffic Safety Administration: Washington, DC, USA, 2015.
- State-Specific Costs of Motor Vehicle Crash Deaths|Motor Vehicle Safety|CDC Injury Center. 6 November 2020. Available online: https://www.cdc.gov/transportationsafety/statecosts/index.html (accessed on 22 May 2021).
- Gaither, T.W.; Sanford, T.A.; Awad, M.A.; Osterberg, E.C.; Murphy, G.P.; Lawrence, B.A.; Miller, T.R.; Breyer, B.N. Estimated total costs from non-fatal and fatal bicycle crashes in the USA: 1997–2013. Inj. Prev. 2018, 24, 135–141. [Google Scholar] [CrossRef] [PubMed]
- The United States Census Bureau. Fastest-Growing Cities Primarily in the South and West; The United States Census Bureau: Suitland, MD, USA, 2019. Available online: https://www.census.gov/newsroom/press-releases/2019/subcounty-population-estimates.html (accessed on 27 January 2020).
- U.S. Census Bureau QuickFacts: San Antonio City, Texas. Available online: https://www.census.gov/quickfacts/fact/table/sanantoniocitytexas/PST045218#PST045218 (accessed on 1 March 2020).
- Royall, E. Census Data: San Antonio Leads Nation in 2017 Population Growth; Rivard Report. 24 May 2018. Available online: https://therivardreport.com/census-data-san-antonio-leads-nation-in-2017-population-growth (accessed on 3 March 2020).
- List of Cities in Texas on Walk Score. Walk Score. Available online: https://www.walkscore.com/TX/ (accessed on 3 March 2020).
- National Complete Streets Coalition. Smart Growth America. Available online: https://smartgrowthamerica.org/program/national-complete-streets-coalition (accessed on 3 March 2020).
- Davis, D.G.; Braaksma, J.P. Adjusting for luggage-laden pedestrians in Airport terminals. Trans. Res. Part A Gen. 1988, 22, 375–388. [Google Scholar] [CrossRef]
- Qin, X.; Ivan, J. Estimating pedestrian exposure prediction model in rural areas. Trans. Res. Rec. J. Trans. Res. Board 2001, 1773, 89–96. [Google Scholar] [CrossRef]
- Lam, W.W.; Yao, S.; Loo, B.P. Pedestrian exposure measures: A time-space framework. Travel Behav. Soc. 2014, 1, 22–30. [Google Scholar] [CrossRef]
- Lee, J.; Abdel-Aty, M.; Jiang, X. Multivariate crash modeling for motor vehicle and non-motorized modes at the macroscopic level. Accid. Anal. Prev. 2015, 78, 146–154. [Google Scholar] [CrossRef] [PubMed]
- Lee, J.; Abdel-Aty, M.; Choi, K.; Siddiqui, C. Analysis of residence characteristics of drivers, pedestrians, and bicyclists involved in traffic crashes. In Proceedings of the Transportation Research Board 92nd Annual Meeting, Washington, DC, USA, 13–17 January 2013. [Google Scholar]
- Abdel-Aty, M.; Siddiqui, C.; Huang, H.; Wang, X. Integrating trip and roadway characteristics in managing safety at traffic analysis zones. Transp. Res. Rec. J. Transp. Res. Board 2011, 2213, 20–28. [Google Scholar] [CrossRef]
- Milton, J. and F. Mannering. The relationship among highway geometrics, traffic-related elements and motor-vehicle accident frequencies. Transportation. 1998, 25, 395–413. [Google Scholar] [CrossRef]
- Obeng, K. Injury severity, vehicle safety features, and intersection crashes. Traffic Inj. Prev. 2008, 9, 268–276. [Google Scholar] [CrossRef] [PubMed]
- Tay, R.; Rifaat, S.M. Factors contributing to the severity of intersection crashes. J. Adv. Transp. 2007, 41, 245–265. [Google Scholar] [CrossRef]
- Chin, H.; Quddus, M. Applying the random effect negative binomial model to examine traffic accident occurrence at signalized intersections. Accid. Anal. Prev. 2003, 35, 253–259. [Google Scholar] [CrossRef]
- Huang, H.; Chin, H.C.; Haque, M.M. Severity of driver injury and vehicle damage in traffic crashes at intersections: A Bayesian hierarchical analysis. Accid. Anal. Prev. 2008, 40, 45–54. [Google Scholar] [CrossRef] [PubMed]
- Kabli, A.; Bhowmik, T.; Eluru, N. A Multivariate Approach For Modeling Driver Injury Severity By Body Region. Anal. Methods Accid. Res. 2020, 28, 100129. [Google Scholar] [CrossRef]
- Fountas, G.; Anastasopoulos, P.C. Analysis of accident injury-severity outcomes: The zero-inflated hierarchical ordered probit model with correlated disturbances. Anal. Methods Accid. Res. 2018, 20, 30–45. [Google Scholar] [CrossRef]
- Wang, K.; Bhowmik, T.; Zhao, S.; Eluru, N.; Jackson, E. Highway safety assessment and improvement through crash prediction by injury severity and vehicle damage using Multivariate Poisson-Lognormal model and Joint Negative Binomial-Generalized Ordered Probit Fractional Split model. J. Saf. Res. 2021, 76, 44–55. [Google Scholar] [CrossRef]
- Wang, K.; Yasmin, S.; Konduri, K.C.; Eluru, N.; Ivan, J.N. Copula-based joint model of injury severity and vehicle damage in two-vehicle crashes. Transp. Res. Rec. J. Transp. Res. Board 2015, 2514, 158–166. [Google Scholar] [CrossRef]
- Bhowmik, T.; Yasmin, S.; Eluru, N. Do We Need Multivariate Modeling Approaches to Model Crash Frequency by Crash Types? A Panel Mixed Approach to Modeling Crash Frequency by Crash Types. Anal. Methods Accid. Res. 2019, 24, 100107. [Google Scholar] [CrossRef]
- Stoltzfus, J.C. Logistic Regression: A Brief Primer. Acad. Emerg. Med. 2011, 18, 1099–1104. [Google Scholar] [CrossRef]
- Sze, N.N.; Wong, S.C. Diagnostic Analysis of the Logistic Model for Pedestrian Injury Severity in Traffic Crashes. Accid. Anal. Prev. 2007, 39, 1267–1278. [Google Scholar] [CrossRef]
- Sarkar, S.; Tay, R.; Hunt, J.D. Logistic Regression Model of Risk of Fatality in Vehicle–Pedestrian Crashes on National Highways in Bangladesh. Transp. Res. Rec. J. Transp. Res. Board 2011, 2264, 128–137. [Google Scholar] [CrossRef]
- Kim, K.; Brunner, I.M.; Yamashita, E. Modeling Fault among Accident—Involved Pedestrians and Motorists in Hawaii. Accid. Anal. Prev. 2008, 40, 2043–2049. [Google Scholar] [CrossRef]
- Kim, S.; Ulfarsson, G.F. Traffic Safety in an Aging Society: Analysis of Older Pedestrian Crashes. J. Transp. Saf. Secur. 2019, 11, 323–332. [Google Scholar] [CrossRef]
- Savolainen, P.; Mannering, F. Probabilistic Models of Motorcyclists’ Injury Severities in Single- and Multi-Vehicle Crashes. Accid. Anal. Prev. 2007, 39, 955–963. [Google Scholar] [CrossRef] [PubMed]
- Salon, D.; McIntyre, A. Determinants of Pedestrian and Bicyclist Crash Severity by Party at Fault in San Francisco, CA. Accid. Anal. Prev. 2018, 110, 149–160. [Google Scholar] [CrossRef] [PubMed]
- Ulfarsson, G.F.; Kim, S.; Booth, K.M. Analyzing Fault in Pedestrian-Motor Vehicle Crashes in North Carolina. Accid. Anal. Prev. 2010, 42, 1805–1813. [Google Scholar] [CrossRef] [PubMed]
- Environmental Systems Research Institute (ESRI). ArcGIS Pro Tool Reference. Density Toolset Concept. 2014. Available online: https://pro.arcgis.com/en/pro-app/tool-reference/spatial-analyst/how-kernel-density-works (accessed on 12 June 2020).
- Chainey, S.; Ratcliffe, J. GIS and Crime Mapping; John Wiley & Sons: Hoboken, NJ, USA, 2013. [Google Scholar]
- Silverman, B.W. Density Estimation for Statistics and Data Analysis; CRC Press: Boca Raton, FL, USA, 1986. [Google Scholar]
- Vemulapalli, S.S. GIS-Based Spatial and Temporal Analysis of Aging-Involved Crashes in Florida. Ph.D. Thesis, The Florida State University, Tallahassee, FL, USA, 2015. [Google Scholar]
- Harirforoush, H.; Bellalite, L. A New Integrated GIS-Based Analysis to Detect Hotspots: A Case Study of the City of Sherbrooke. Accid. Anal. Prev. 2019, 130, 62–74. [Google Scholar] [CrossRef] [PubMed]
- Young, J.; Park, P.Y. Hotzone identification with GIS-based post-network screening analysis. J. Transp. Geogr. 2014, 34, 106–120. [Google Scholar] [CrossRef]
- Plug, C.; Xia, J.C.; Caulfield, C. Spatial and temporal visualisation techniques for crash analysis. Accid. Anal. Prev. 2011, 43, 1937–1946. [Google Scholar] [CrossRef]
- Truong, L.; Somenahalli, S. Using GIS to Identify Pedestrian-Vehicle Crash Hot Spots and Unsafe Bus Stops. J. Public Transp. 2011, 14. [Google Scholar] [CrossRef]
- RTA. Road Traffic Accidents in NSW—1993; Roads and Traffic Authority of NSW: Sydney, Australia, 1994.
- Geurts, K.; Wets, G.; Brijs, T.; Vanhoof, K. Identification and ranking of black spots: Sensitivity analysis. Transp. Res. Rec. J. Transp. Res. Board 2004, 1897, 34–42. [Google Scholar] [CrossRef]
- RStudio Team. RStudio: Integrated Development Environment for R. RStudio; PBC: Boston, MA, USA, 2020; Available online: http://www.rstudio.com/ (accessed on 12 June 2020).
- Siddiqui, N.A.; Chu, X.; Guttenplan, M. Crossing Locations, Light Conditions, and Pedestrian Injury Severity. Transp. Res. Rec. J. Transp. Res. Board 2006, 1982, 141–149. [Google Scholar] [CrossRef]
- Billah, K.; Adegbite, Q.; Sharif, H.O.; Dessouky, S.; Simcic, L. Analysis of Intersection Traffic Safety in the City of San Antonio, 2013–2017. Sustainability 2021, 13, 5296. [Google Scholar] [CrossRef]
- Yu, J.; Shacket, R.W. Drinking-driving and riding with drunk drivers among young adults: An analysis of reciprocal effects. J. Stud. Alcohol 1999, 60, 615–621. [Google Scholar] [CrossRef]
- Hezaveh, A.M.; Cherry, C.R. Walking under the influence of the alcohol: A case study of pedestrian crashes in Tennessee. Accid. Anal. Prev. 2018, 121, 64–70. [Google Scholar] [CrossRef]
- Uddin, M.; Ahmed, F. Pedestrian Injury Severity Analysis in Motor Vehicle Crashes in Ohio. Safety 2018, 4, 20. [Google Scholar] [CrossRef]
- Han, Z.; Sharif, H.O. Investigation of the Relationship between Rainfall and Fatal Crashes in Texas, 1994–2018. Sustainability 2020, 12, 7976. [Google Scholar] [CrossRef]
- Paul, S.H.; Sharif, H.O.; Crawford, A.M. Fatalities Caused by Hydrometeorological Disasters in Texas. Geosciences 2018, 8, 186. [Google Scholar] [CrossRef]
- Niebuhr, T.; Junge, M.; Rosén, E. Pedestrian injury risk and the effect of age. Accid. Anal. Prev. 2016, 86, 121–128. [Google Scholar] [CrossRef]
- Zhang, K.; Wang, M.; Wei, B.; Sun, D. Identification and Prediction of Large Pedestrian Flow in Urban Areas Based on a Hybrid Detection Approach. Sustainability 2017, 9, 36. [Google Scholar] [CrossRef]
- Proven Safety Countermeasures—Leading Pedestrian Intervals—Safety|Federal Highway Administration. Available online: https://safety.fhwa.dot.gov/provencountermeasures/lead_ped_int/ (accessed on 28 April 2021).
- Driver Assistance Technologies|NHTSA. Available online: https://www.nhtsa.gov/equipment/driver-assistance-technologies#collision-intervention-30656 (accessed on 21 May 2021).
- Detwiller, M.; Gabler, H.C. Potential reduction in pedestrian collisions with an autonomous vehicle. In Proceedings of the 25th International Technical Conference on the Enhanced Safety of Vehicles (ESV); Detroit, MI, USA, 5–8 June 2017, National Highway Traffic Safety Administration: Washington, DC, USA, 2017. [Google Scholar]
- Sun, D.; Zhang, K.; Shen, S. Analyzing spatiotemporal traffic line source emissions based on massive didi online car-hailing service data. Transp. Res. Part D Transp. Environ. 2018, 62, 699–714. [Google Scholar] [CrossRef]
- Feliciani, C.; Gorrini, A.; Crociani, L.; Vizzari, G.; Nishinari, K.; Bandini, S. Calibration and validation of a simulation model for predicting pedestrian fatalities at unsignalized crosswalks by means of statistical traffic data. J. Traffic Transp. Eng. 2020, 7, 1–18. [Google Scholar] [CrossRef]
- City of San Antonio Public Works Department. San Antonio Severe Pedestrian Injury Areas Report 2014–2018; City of San Antonio Public Works Department: San Antonio, TX, USA, 2020.
- Wan, Q.; Liang, Q.; Zheng, B.; Wang, H.; Li, Z. Considering Temporal Correlation in Crash Data Analysis. CICTP 2014 2014, 3723–3730. [Google Scholar] [CrossRef]


Publisher’s Note: MDPI stays neutral with regard to jurisdictional claims in published maps and institutional affiliations. |
© 2021 by the authors. Licensee MDPI, Basel, Switzerland. This article is an open access article distributed under the terms and conditions of the Creative Commons Attribution (CC BY) license (https://creativecommons.org/licenses/by/4.0/).