
An Analytical Approach to Assess the Influence of Expert Panel Answer on Decision Making: The Case of Sustainable Land Use in Ribadavia Banda Norte, Salta (Argentina)


 , and
, and
Abstract
:1. Introduction
2. Materials and Methods
2.1. The Study Area
2.2. Survey for an Expert Panel
2.3. Selection of Expert Panel
2.4. Concordance Matrix and Dendrograms
- Find the greatest element sij (elements with higher similitude).
- Merge elements i and j into a single new cluster.
- Calculate a new set of distances defined as the minimum distance (maximum similitude) between the new cluster and the remaining elements.
- Repeat steps 1–3 until a single group contains all elements (in step >1, the element could be clusters derived from the previous agglomeration).
2.5. Discrete MCDA Method
3. Results
3.1. Survey
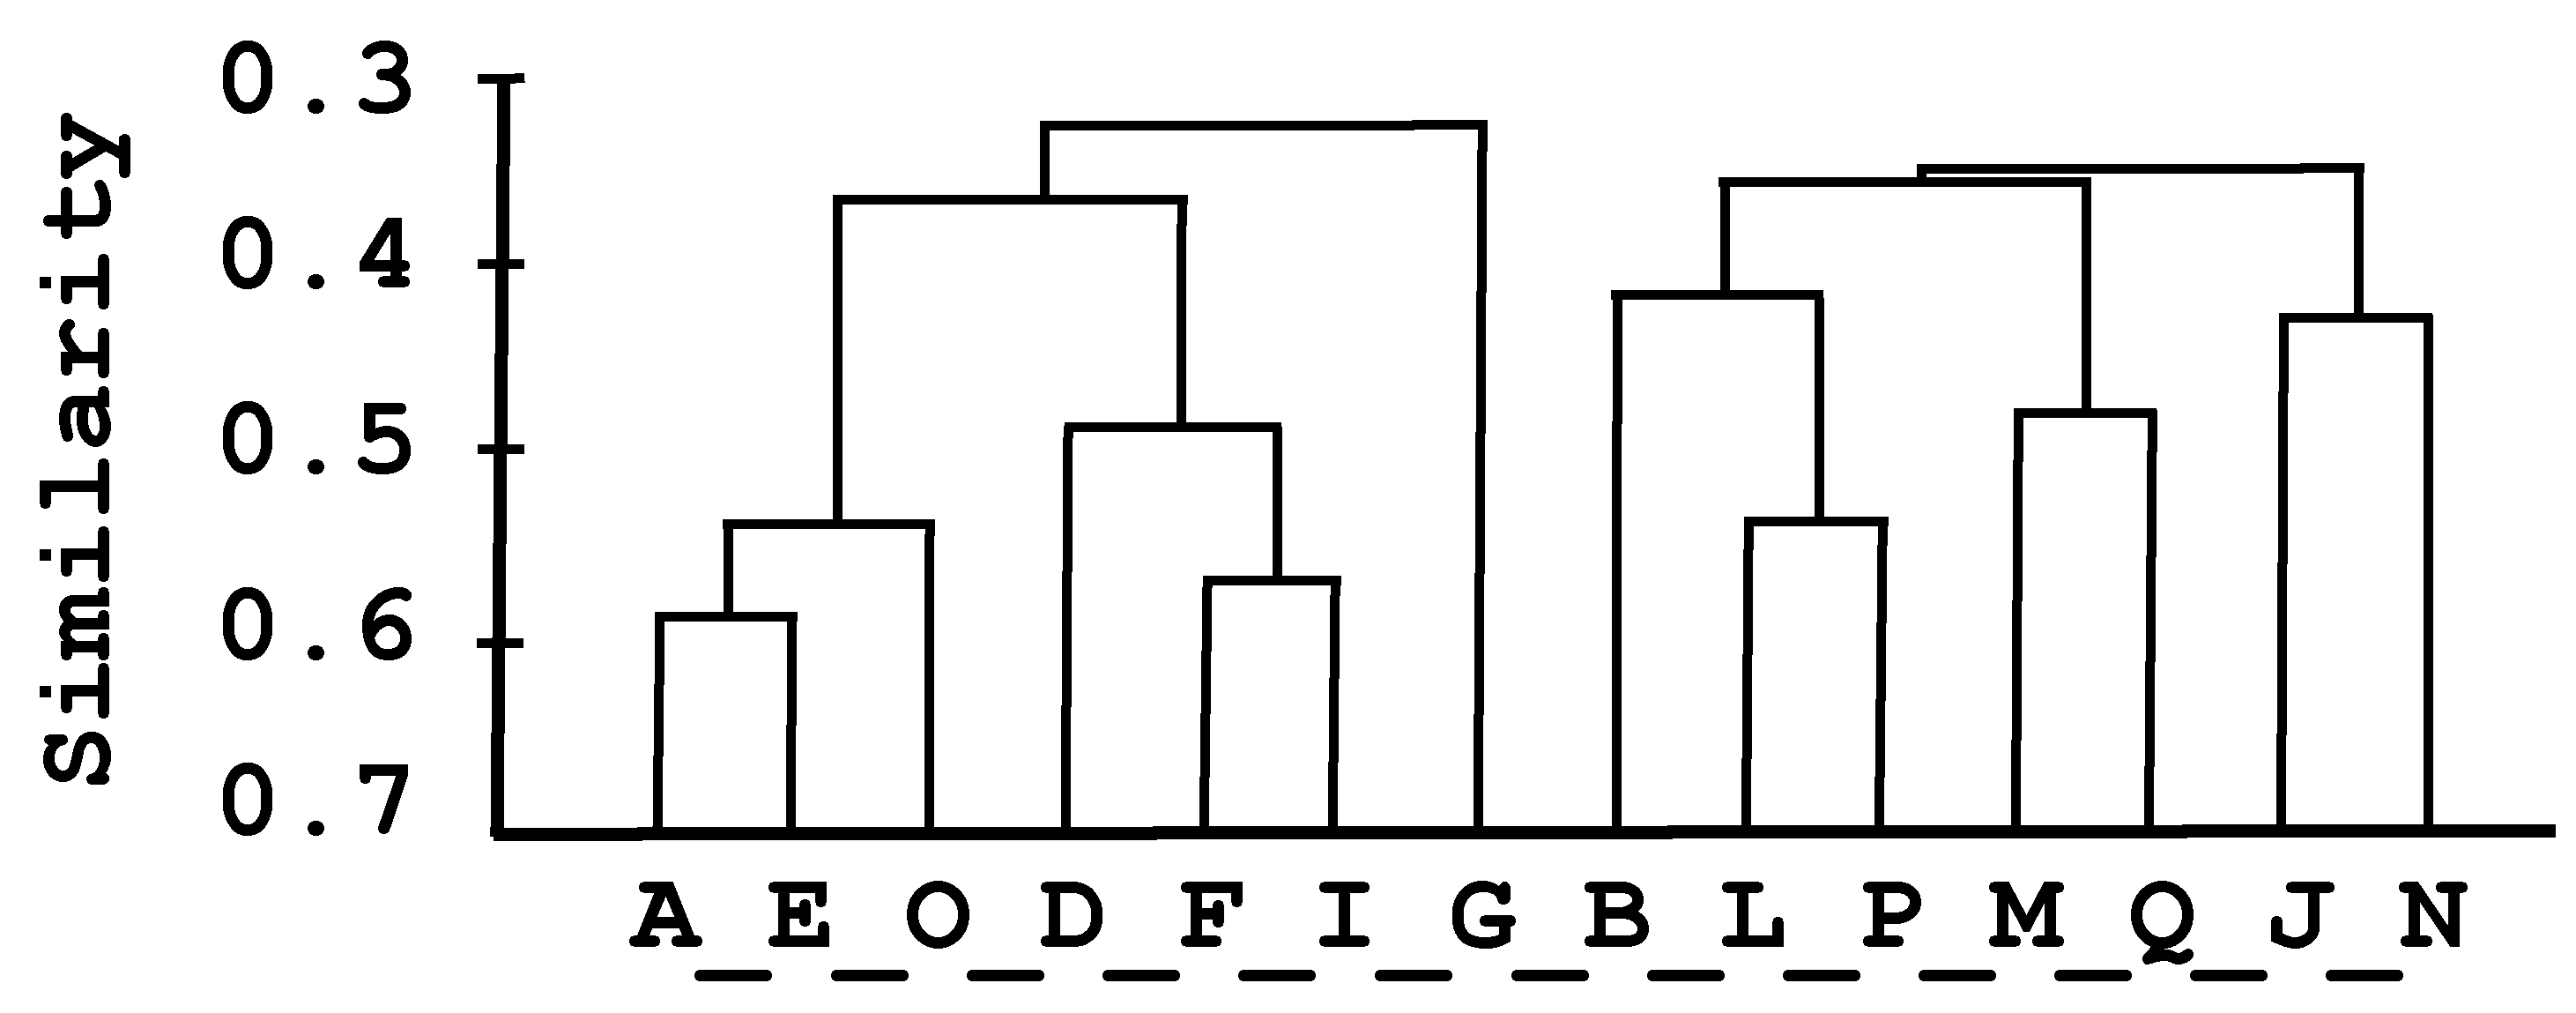
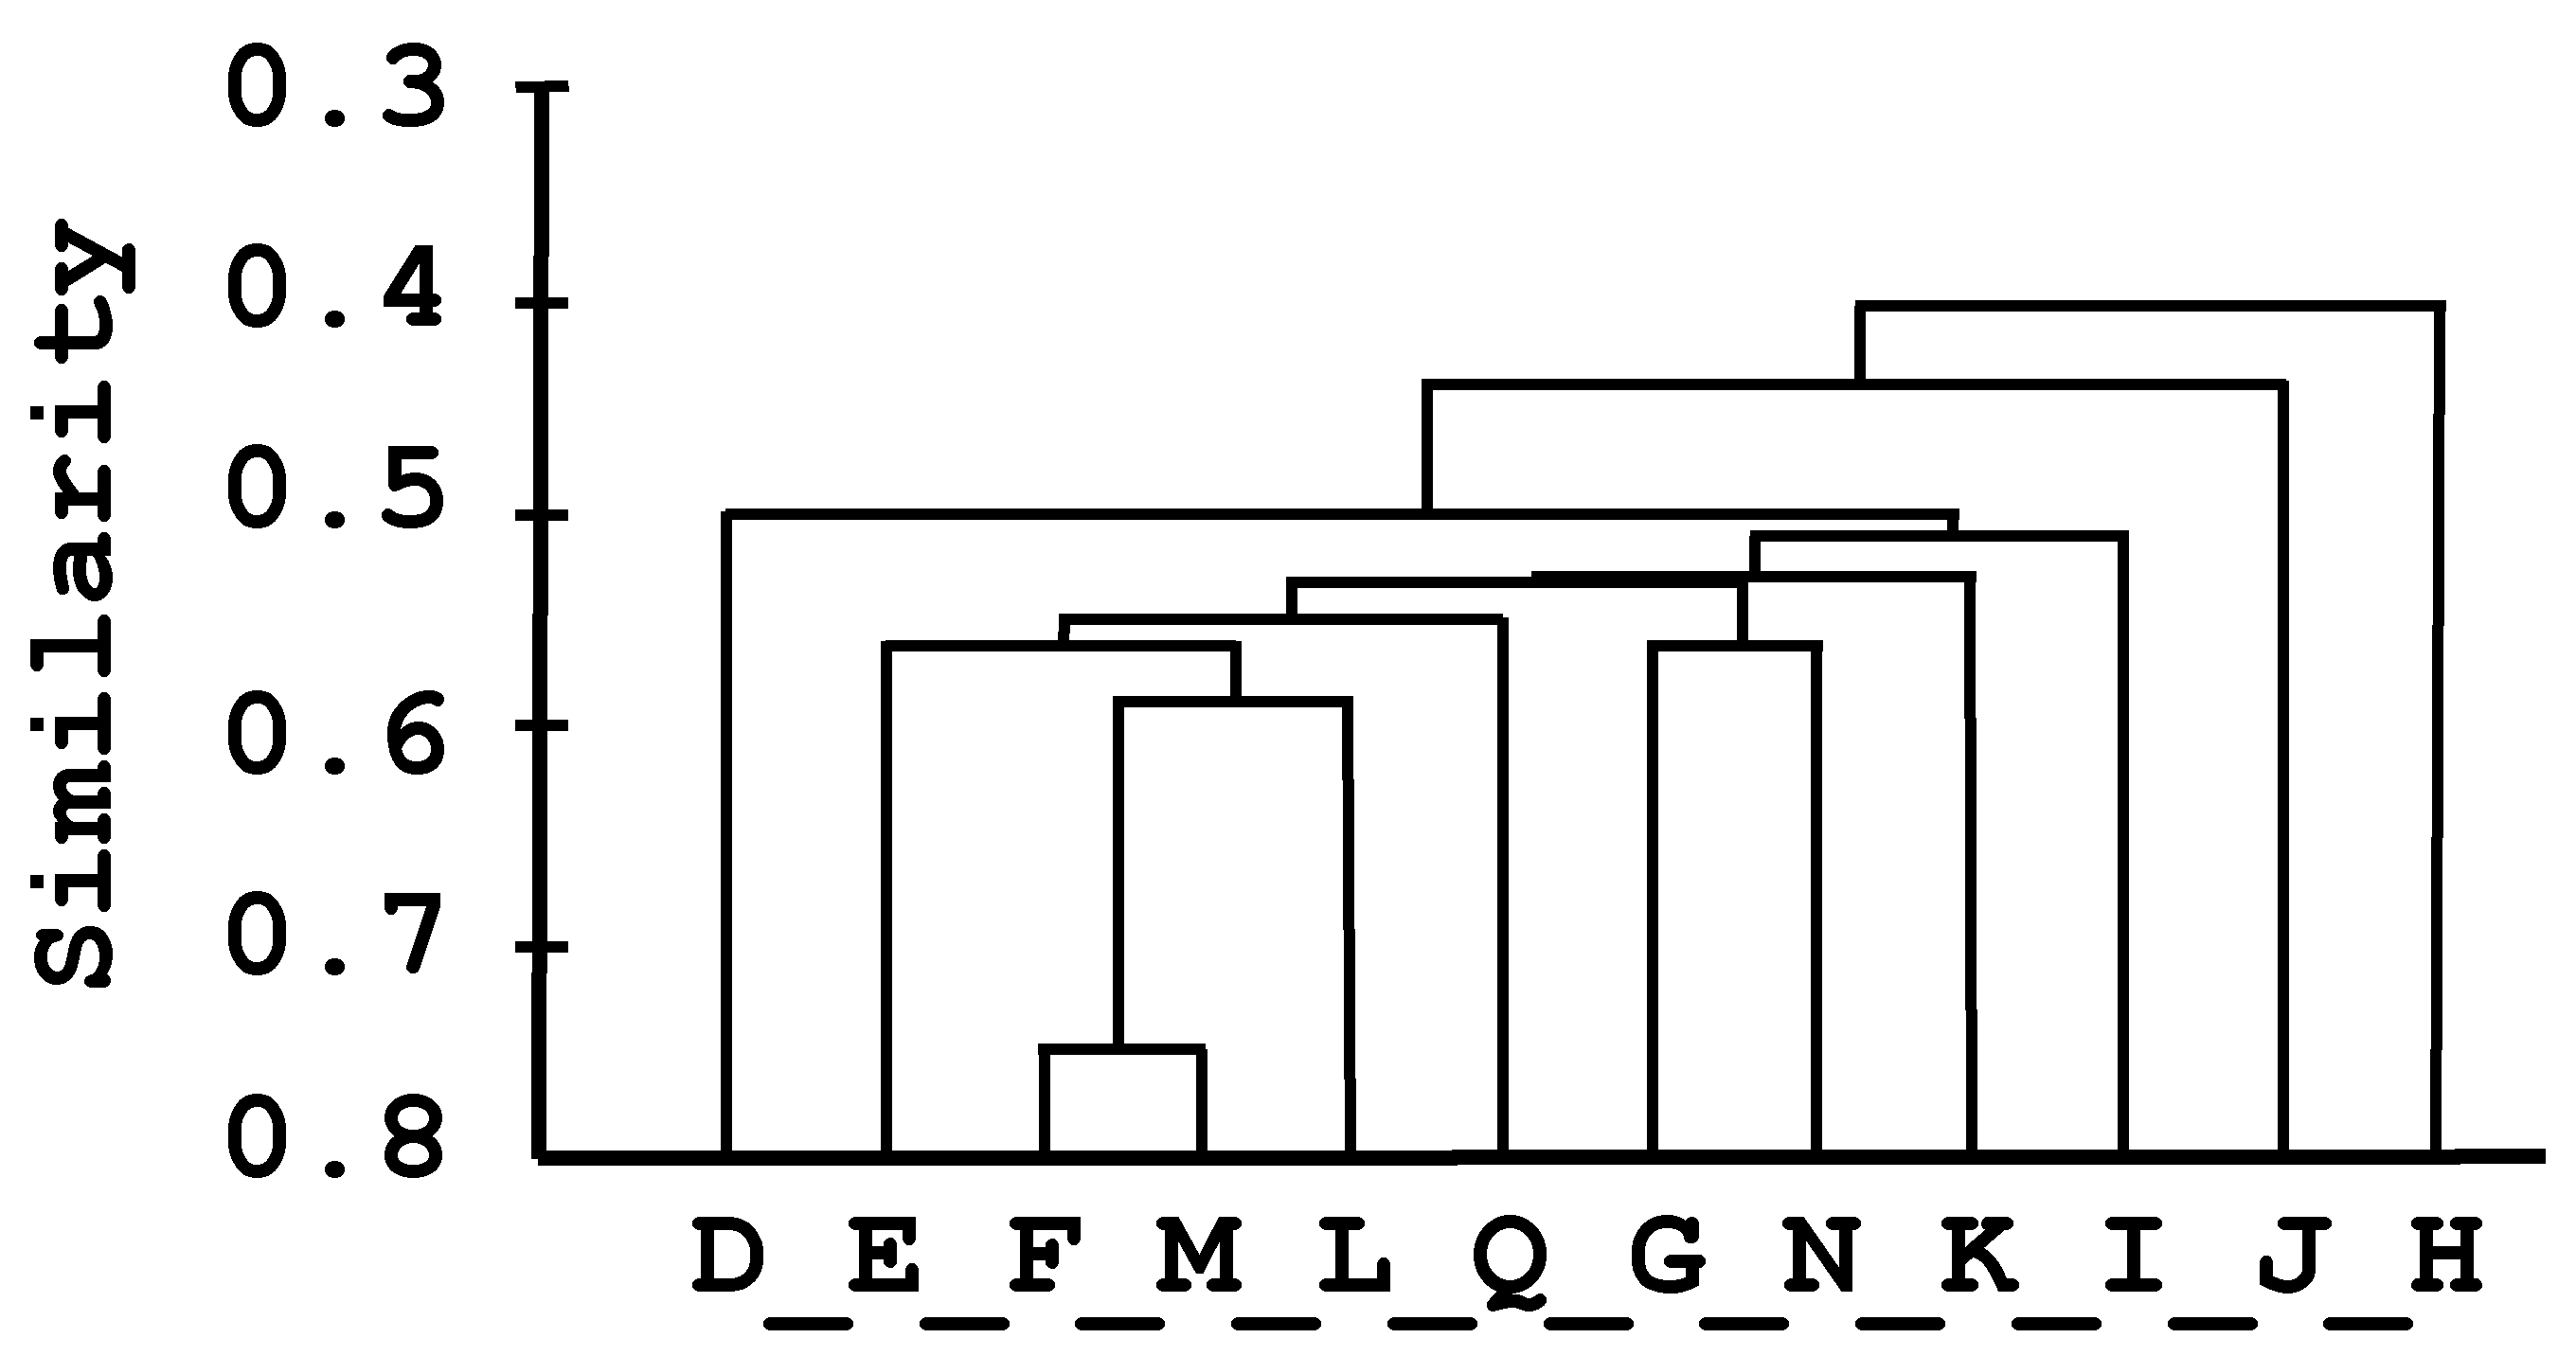
3.2. Dendrograms
3.2.1. Precision Agriculture: Technique 1
3.2.2. Forest with Integrated Livestock: Technique 2
3.2.3. Payment for Ecosystem Services: Technique 3
3.2.4. Traditional Agriculture-Livestock Farming—Criollo: Technique 4
3.2.5. Traditional Forest Management—Wichi: Technique 5
3.3. Discrete MCDA Results
4. Discussion
5. Conclusions
Supplementary Materials
Author Contributions
Funding
Institutional Review Board Statement
Informed Consent Statement
Data Availability Statement
Conflicts of Interest
Appendix A
- Q1
- Land tenure security
- Q2
- Purchase, sale, rental, and loan of land for housing; commercial production; or large-scale agricultural production
- Q3
- Provision of potable and irrigation water, enough for both activities
- Q4
- Availability of drainage to prevent flooding
- Q5
- Access to energy (electricity and gas) and connection to telecommunications and internet services
- Q6
- Availability of product storage services and fuel supply
- Q7
- Availability of machinery, spare parts, repairs, and supplies for agricultural production
- Q8
- Access to transport services at affordable prices for products
- Q9
- Food sovereignty
- Q10
- Food security
- Q11
- Generation of sources of employment, income, livelihoods
- Q12
- Capacity for savings, financing, insurance, reinvestment in housing, and production
- Q13
- Tolerance and acceptance between different social groups
- Q14
- Agropecuary landscape
- Q15
- Conservation of protected areas
- Q16
- Air quality (increase or decrease in air pollution)
- Q17
- Soil quality and productive capacity
- Q18
- Land use efficiency
- Q19
- Surface and groundwater quality
- Q20
- Efficient management and use of water
- Q21
- Renewable and non-renewable energy sources
- Q22
- Ecosystems and their regulatory capacity
- Q23
- Ecosystem resilience
- Q24
- Natural flora and fauna
- Q25
- Surplus value or prices of the land destined for agricultural production or another production system
- Q26
- Agricultural production
- Q27
- Livestock production
- Q28
- Forestry production
- Q29
- Tourism production
- Q30
- Quality of life or good living conditions of the people
- Q31
- Cultural/spiritual values.
Appendix B

| ELECTRE | ||||||||||||||||
| Equal | +Sustainable | +Economical | +Ecologic | |||||||||||||
| V-AC | V-AD | V-BC | V-BD | V-AC | V-AD | V-BC | V-BD | V-AC | V-AD | V-BC | V-BD | V-AC | V-AD | V-BC | V-BD | |
| 1st | T2 | T3 | T2 | T3 | T2 | T3 | T2 | T3 | T2 | T3 | T2 | T3 | T2 | T3 | T2 | T3 |
| 2nd | T3 | T2 | T3 | T2 | T3 | T2 | T3 | T2 | T3 | T2 | T3 | T2 | T3 | T2 | T3 | T2 |
| 3th | T1 | T1 | T4 | T4 | T1 | T1 | T4 | T4 | T1 | T1 | T1 | T1 | T1 | T1 | T4 | T4 |
| 4th | T4 | T4 | T1 | T1 | T4 | T4 | T1 | T1 | T4 | T4 | T4 | T4 | T4 | T4 | T1 | T1 |
| 5th | T5 | T5 | T5 | T5 | T5 | T5 | T5 | T5 | T5 | T5 | T5 | T5 | T5 | T5 | T5 | T5 |
| AHP | ||||||||||||||||
| Equal | +Sustainable | +Economical | +Ecologic | |||||||||||||
| V-AC | V-AD | V-BC | V-BD | V-AC | V-AD | V-BC | V-BD | V-AC | V-AD | V-BC | V-BD | V-AC | V-AD | V-BC | V-BD | |
| 1st | T2 | T3 | T2 | T3 | T2 | T3 | T2 | T3 | T2 | T3 | T2 | T3 | T3 | T3 | T3 | T3 |
| 2nd | T3 | T1 | T3 | T2 | T3 | T2 | T3 | T2 | T3 | T2 | T3 | T2 | T2 | T1 | T2 | T2 |
| 3th | T1 | T2 | T4 | T4 | T1 | T1 | T4 | T4 | T1 | T1 | T4 | T4 | T1 | T2 | T4 | T4 |
| 4th | T4 | T4 | T1 | T1 | T4 | T4 | T1 | T1 | T4 | T4 | T1 | T1 | T4 | T4 | T1 | T1 |
| 5th | T5 | T5 | T5 | T5 | T5 | T5 | T5 | T5 | T5 | T5 | T5 | T5 | T5 | T5 | T5 | T5 |
References
- Wackernagel, M.; Yount, J.D. The ecological footprint: An indicator of progress toward regional sustainability. Environ. Monit. Assess. 1998, 51, 511–529. [Google Scholar] [CrossRef]
- Vasileiou, K.; Morris, J. The sustainability of the supply chain for fresh potatoes in Britain. Supply Chain Manag. Int. J. 2006, 11, 317–327. [Google Scholar] [CrossRef]
- Paolasso, P.; Krapovickas, J.; Gasparri, N.I. Deforestación, expansión agropecuaria y dinámica demográfica en el Chaco Seco Argentino durante la década de los noventa. Lat. Am. Res. Rev. 2012, 47, 35–63. [Google Scholar] [CrossRef]
- Quintero-Angel, M.; González-Acevedo, A. Tendencies and challenges for the assessment of agricultural sustainability. Agric. Ecosyst. Environ. 2018, 254, 273–281. [Google Scholar] [CrossRef]
- Guzmán, E.S. Sobre los Orígenes de la Agroecología en el Pensamiento Marxista y Libertario; Centre for Development and Environment: La Paz, Bolivia, 2011; ISBN 9995413477. [Google Scholar]
- Paul, M.; Negahban-Azar, M.; Shirmohammadi, A.; Montas, H. Assessment of agricultural land suitability for irrigation with reclaimed water using geospatial multi-criteria decision analysis. Agric. Water Manag. 2020, 231, 105987. [Google Scholar] [CrossRef]
- Pérez, J.C.; Carrillo, M.H.; Montoya-Torres, J.R. Multi-criteria approaches for urban passenger transport systems: A literature review. Ann. Oper. Res. 2015, 226, 69–87. [Google Scholar] [CrossRef]
- Diaz-Balteiro, L.; González-Pachón, J.; Romero, C. Measuring systems sustainability with multi-criteria methods: A critical review. Eur. J. Oper. Res. 2017, 258, 607–616. [Google Scholar] [CrossRef]
- Wang, J.-J.; Jing, Y.-Y.; Zhang, C.-F.; Zhao, J.-H. Review on multi-criteria decision analysis aid in sustainable energy decision-making. Renew. Sustain. Energy Rev. 2009, 13, 2263–2278. [Google Scholar] [CrossRef]
- Arondel, C.; Girardin, P. Sorting cropping systems on the basis of their impact on groundwater quality. Eur. J. Oper. Res. 2000, 127, 467–482. [Google Scholar] [CrossRef]
- Halog, A.; Manik, Y. Advancing integrated systems modelling framework for life cycle sustainability assessment. Sustainability 2011, 3, 469–499. [Google Scholar] [CrossRef] [Green Version]
- Deytieux, V.; Munier-Jolain, N.; Caneill, J. Assessing the sustainability of cropping systems in single-and multi-site studies. A review of methods. Eur. J. Agron. 2016, 72, 107–126. [Google Scholar] [CrossRef]
- Antón, J.M.; Grau, J.B.; Cisneros, J.M.; Tarquis, A.M.; Laguna, F.V.; Cantero, J.J.; Andina, D.; Sánchez, E. Discrete multi-criteria methods for lands use and conservation planning on La Colacha in Arroyos Menores (Río Cuarto, Province of Córdoba, Argentina). Ann. Oper. Res. 2016, 245, 315–336. [Google Scholar] [CrossRef] [Green Version]
- Grau, J.B.; Antón, J.M.; Tarquis, A.M.; Colombo, F.; de los Ríos, L.; Cisneros, J.M. An application of mathematical models to select the optimal alternative for an integral plan to desertification and erosion control (Chaco Area–Salta Province–Argentina). Biogeosciences 2010, 7, 3421–3433. [Google Scholar] [CrossRef] [Green Version]
- Kuhnert, P.M.; Martin, T.G.; Griffiths, S.P. A guide to eliciting and using expert knowledge in Bayesian ecological models. Ecol. Lett. 2010, 13, 900–914. [Google Scholar] [CrossRef]
- Van Calker, K.J.; Berentsen, P.B.M.; Giesen, G.W.J.; Huirne, R.B.M. Identifying and ranking attributes that determine sustainability in Dutch dairy farming. Agric. Hum. Values 2005, 22, 53–63. [Google Scholar] [CrossRef]
- Craheix, D.; Angevin, F.; Doré, T.; De Tourdonnet, S. Using a multicriteria assessment model to evaluate the sustainability of conservation agriculture at the cropping system level in France. Eur. J. Agron. 2016, 76, 75–86. [Google Scholar] [CrossRef]
- Yousuf, M.I. Using expertsopinions through Delphi technique. Pract. Assess. Res. Eval. 2007, 12, 4. [Google Scholar]
- Wentholt, M.T.A.; Rowe, G.; König, A.; Marvin, H.J.P.; Frewer, L.J. The views of key stakeholders on an evolving food risk governance framework: Results from a Delphi study. Food Policy 2009, 34, 539–548. [Google Scholar] [CrossRef]
- Frewer, L.J.; Fischer, A.R.H.; Wentholt, M.T.A.; Marvin, H.J.P.; Ooms, B.W.; Coles, D.; Rowe, G. The use of Delphi methodology in agrifood policy development: Some lessons learned. Technol. Forecast. Soc. Change 2011, 78, 1514–1525. [Google Scholar] [CrossRef]
- Wolfe, W.S.; Frongillo, E.A. Building household food-security measurement tools from the ground up. Food Nutr. Bull. 2001, 22, 5–12. [Google Scholar] [CrossRef]
- Jellason, N.P.; Baines, R.N.; Conway, J.S. A Delphi Approach to the Selection of Good Agricultural Practices (GAPs) for Resilience Enhancement for Dry Land Farmers in North-Western Nigeria. J. Food Sci. Eng. 2017, 7, 383–395. [Google Scholar] [CrossRef] [Green Version]
- Kendall, H.; Kaptan, G.; Stewart, G.; Grainger, M.; Kuznesof, S.; Naughton, P.; Clark, B.; Hubbard, C.; Raley, M.; Marvin, H.J.P. Drivers of existing and emerging food safety risks: Expert opinion regarding multiple impacts. Food Control 2018, 90, 440–458. [Google Scholar] [CrossRef]
- Moragues-Faus, A.; Sonnino, R.; Marsden, T. Exploring European food system vulnerabilities: Towards integrated food security governance. Environ. Sci. Policy 2017, 75, 184–215. [Google Scholar] [CrossRef]
- Etxeberria, I.A.; Garayar, A.; Sánchez, J.A.C. Development of sustainability reports for farming operations in the Basque Country using the Delphi method. Rev. Contab. 2015, 18, 44–54. [Google Scholar] [CrossRef] [Green Version]
- Mokarram, M.; Mokarram, M.J.; Gitizadeh, M.; Niknam, T.; Aghaei, J. A novel optimal placing of solar farms utilizing multi-criteria decision-making (MCDA) and feature selection. J. Clean. Prod. 2020, 261, 121098. [Google Scholar] [CrossRef]
- Alemdar, K.D.; Kaya, Ö.; Çodur, M.Y. A GIS and microsimulation-based MCDA approach for evaluation of pedestrian crossings. Accid. Anal. Prev. 2020, 148, 105771. [Google Scholar] [CrossRef] [PubMed]
- Chen, L.; van Westen, C.J.; Hussin, H.; Ciurean, R.L.; Turkington, T.; Chavarro-Rincon, D.; Shrestha, D.P. Integrating expert opinion with modelling for quantitative multi-hazard risk assessment in the Eastern Italian Alps. Geomorphology 2016, 273, 150–167. [Google Scholar] [CrossRef]
- Kamali, F.P.; Borges, J.A.R.; Meuwissen, M.P.M.; de Boer, I.J.M.; Lansink, A.G.J.M.O. Sustainability assessment of agricultural systems: The validity of expert opinion and robustness of a multi-criteria analysis. Agric. Syst. 2017, 157, 118–128. [Google Scholar] [CrossRef]
- Mardani, A.; Zavadskas, E.K.; Khalifah, Z.; Zakuan, N.; Jusoh, A.; Nor, K.M.; Khoshnoudi, M. A review of multi-criteria decision-making applications to solve energy management problems: Two decades from 1995 to 2015. Renew. Sustain. Energy Rev. 2017, 71, 216–256. [Google Scholar] [CrossRef]
- Wang, Z.; Ren, J.; Goodsite, M.E.; Xu, G. Waste-to-energy, municipal solid waste treatment, and best available technology: Comprehensive evaluation by an interval-valued fuzzy multi-criteria decision making method. J. Clean. Prod. 2018, 172, 887–899. [Google Scholar] [CrossRef]
- Gobierno de la Provincia de Salta. Anuario Estadistico. Año 2016; Gobierno de la Provincia de Salta, Ed.: Salta, Argentina, 2017; ISBN 978-987-46491-1-9.
- Álvarez Leguizamón, S. Geopolítica nacional, estructura social y racismo. In Estudios Sobre la Estructural Social en la Argentina Contemporánea; Álvarez Leguizamón, S., Arias, A.J., Terra Muñiz, L., Eds.; CLACSO: Buenos Aires, Argentina, 2016; pp. 333–389. ISBN 978-987-722-222-7. [Google Scholar]
- Leake, A.; López, O.; Leake, M.C. La Deforestación del Chaco Salteño 2004–2015; SMA Ediciones: Salta, Argentina, 2016. [Google Scholar]
- Ravina, N.M. Evaluación del Impacto Económico de Tecnologías Apropiadas para Pequeños Productores Ganaderos del Chaco Semiárido Salteño; Universidad de Buenos Aires: Buenos Aires, Argentina, 2006. [Google Scholar]
- García, E.; Flego, F. Agricultura de precisión. Rev. Cienc. y Tecnol. Recuper. 2008. Available online: https://www.palermo.edu/ingenieria/downloads/pdfwebc&T8/8CyT12.pdf (accessed on 11 June 2021).
- Pathak, H.S.; Brown, P.; Best, T. A systematic literature review of the factors affecting the precision agriculture adoption process. Precis. Agric. 2019, 20, 1292–1316. [Google Scholar] [CrossRef]
- Alaggia, F.G.; Cabello, M.J.; Carranza, C.; Cavallero, L.; Daniele, G.; Erro Velazquez, M.; Ledesma, M.; Lopez, D.R.; Mussat, E.; Navall, J.M. Manual de Indicadores para Monitoreo de Planes Prediales para el Manejo de Bosques con Ganadería Integrada (MBGI) Región Parque Chaqueño; INTA: Buenos Aires, Argentina, 2019. Available online: https://repositorio.inta.gob.ar/xmlui/handle/20.500.12123/9046 (accessed on 11 June 2021).
- Sarmiento, M.; Rios, N.A. Factibilidad de implementación de un esquema de pagos por servicios ambientales en la cuenca Los Pericos-Manantiales, Jujuy, Argentina. Quebracho-Rev. Cienc. For. 2009, 17, 64–76. [Google Scholar]
- Núñez-Regueiro, M.M.; Hiller, J.; Branch, L.C.; Godoy, C.N.; Siddiqui, S.; Volante, J.; Soto, J.R. Policy lessons from spatiotemporal enrollment patterns of payment for ecosystem service programs in Argentina. Land Use Policy 2020, 95, 104596. [Google Scholar] [CrossRef]
- Córdoba, G.S.; Camardelli, M.C. Transformación del paisaje cultural en la región del Chaco semiárido de la provincia de Salta en el siglo XXI. 2017. Available online: https://ri.conicet.gov.ar/handle/11336/66716 (accessed on 11 June 2021).
- Montani, R. La etnicidad de las cosas entre los wichís del Gran Chaco (provincia de Salta, Argentina). Indiana 2008, 25, 117–142. [Google Scholar]
- Gualotuña-Parra, J.A. La Aplicación de la Agricultura de Precisión Como Herramienta Económica para el Desarrollo Sostenible en el Territorio del Chaco Salteño. Master’s Thesis, Universidad Católica de Salta, Salta, Argentina, 2015. [Google Scholar]
- Allen, I.E.; Seaman, C.A. Likert scales and data analyses. Qual. Prog. 2007, 40, 64–65. [Google Scholar]
- Scheele, D.S. Reality Construction as a Product of Delphi Interaction. In The Delphi Method: Techniques and Applications; Linstone, H., Turoff, M., Eds.; Addison-Wesley: Boston, MA, USA, 2002; pp. 35–67. [Google Scholar]
- Makkonen, M.; Hujala, T.; Uusivuori, J. Policy experts’ propensity to change their opinion along Delphi rounds. Technol. Forecast. Soc. Change 2016, 109, 61–68. [Google Scholar] [CrossRef]
- Siegel, S. Castellan. Nonparametric Statistics for the Social Sciences; McGraw-Hill: New York, NY, USA, 1988. [Google Scholar]
- Knight, W.R. A computer method for calculating Kendall’s tau with ungrouped data. J. Am. Stat. Assoc. 1966, 61, 436–439. [Google Scholar] [CrossRef]
- Hartigan, J.A. Clustering Algorithms; John Wiley & Sons, Inc.: Hoboken, NJ, USA, 1975; ISBN 047135645X. [Google Scholar]
- Wang, C.; Hao, C.; Guan, X. Hierarchical and overlapping social circle identification in ego networks based on link clustering. Neurocomputing 2020, 381, 322–335. [Google Scholar] [CrossRef]
- Degen, B.; Blanc-Jolivet, C.; Stierand, K.; Gillet, E. A nearest neighbour approach by genetic distance to the assignment of individual trees to geographic origin. Forensic Sci. Int. Genet. 2017, 27, 132–141. [Google Scholar] [CrossRef]
- Diaz-Balteiro, L.; González-Pachón, J.; Romero, C. Sustainability as a multi-criteria concept: New developments and applications. Sustainability 2020, 12, 7527. [Google Scholar] [CrossRef]
- Roy, B. Classement et choix en présence de points de vue multiples. Rev. Française D’Informatique Rech. Opérationnelle 1968, 2, 57–75. [Google Scholar] [CrossRef]
- Romero, C. Teoría de la Decisión Multicriterio: Conceptos, Técnicas y Aplicaciones; Alianza: Madrid, España, 1993; ISBN 842068144X. [Google Scholar]
- Grau, J.B.; Anton, J.M.; Tarquis, A.M.; Andina, D. Election of water resources management entity using a multi-criteria decision (MCD) method in Salta province (Argentine). J. Syst. Cybern. Informatics 2009, 7, 1–7. [Google Scholar]
- Derak, M.; Cortina, J. Multi-criteria participative evaluation of Pinus halepensis plantations in a semiarid area of southeast Spain. Ecol. Indic. 2014, 43, 56–68. [Google Scholar] [CrossRef]
- Adem Esmail, B.; Geneletti, D. Multi-criteria decision analysis for nature conservation: A review of 20 years of applications. Methods Ecol. Evol. 2018, 9, 42–53. [Google Scholar] [CrossRef] [Green Version]
- Gong, Q.; Yang, H. Balance of opinions in expert panels. Econ. Lett. 2018, 170, 151–154. [Google Scholar] [CrossRef]
- Dicks, L.V.; Wright, H.L.; Ashpole, J.E.; Hutchison, J.; McCormack, C.G.; Livoreil, B.; Zulka, K.P.; Sutherland, W.J. What works in conservation? Using expert assessment of summarised evidence to identify practices that enhance natural pest control in agriculture. Biodivers. Conserv. 2016, 25, 1383–1399. [Google Scholar] [CrossRef] [PubMed] [Green Version]
- Hegelund, L.; Sørensen, J.T. Developing a HACCP-like system for improving animal health and welfare in organic egg production–based on an expert panel analysis. Animal 2007, 1, 1018–1025. [Google Scholar] [CrossRef] [Green Version]
- Hagerhall, C.M. Consensus in landscape preference judgements. J. Environ. Psychol. 2001, 21, 83–92. [Google Scholar] [CrossRef]
- Haara, A.; Store, R.; Leskinen, P. Analyzing uncertainties and estimating priorities of landscape sensitivity based on expert opinions. Landsc. Urban Plan. 2017, 163, 56–66. [Google Scholar] [CrossRef]
- Mashizi, A.K.; Escobedo, F.J. Socio-ecological assessment of threats to semi-arid rangeland habitat in Iran using spatial models and actor group opinions. J. Arid Environ. 2020, 177, 104136. [Google Scholar] [CrossRef]
- Ortiz-Urbina, E.; González-Pachón, J.; Diaz-Balteiro, L. Decision-making in forestry: A review of the hybridisation of multiple criteria and group decision-making methods. Forests 2019, 10, 375. [Google Scholar] [CrossRef] [Green Version]


| Techniques | Advantages | Disadvantages |
|---|---|---|
| Precision agriculture [36,37] |
|
|
| Integrated agroforestry [38] |
|
|
| Payment for ecosystem services [39,40] |
|
|
| Traditional agriculture-livestock farming—criollo [41] |
|
|
| Traditional forest management—wichi [42] |
|
|
| Bad Impact | Non | Good Impact | |||||||||
|---|---|---|---|---|---|---|---|---|---|---|---|
| Scale | 1 | 2 | 3 | 4 | 5 | 6 | 7 | 8 | 9 | 10 | 11 |
| Score | 5 | 4 | 3 | 2 | 1 | 0 | 1 | 2 | 3 | 4 | 5 |
| Code | The Institution They Belong to | Type |
|---|---|---|
| A | Catholic University of Salta (UCASAL)—Environmental law—Professor. | University |
| B | Prograno Association. | Producer Association |
| C | Association. Social Integration of the Agricultural and Forestry Sector in the Chaco region of Salta (ISFACSA). | NGO |
| D | Institute of Environmental Law and Sustainability—(IDEAS, UCASAL)—Staff. | University |
| E | Secretariat of Environment and Sustainable Development of the Nation, Argentina. | Government—Environmental |
| F | Sustainable use of biodiversity project UNDP ARG15/G53 (Livestock)—Staff. | International organization—Environmental |
| G | TEPEYAC, a non-profit civil association, is part of the Diocese’s aboriginal pastoral of the New Oran. | NGO (aboriginal) |
| H | Catholic University of Salta (UCASAL), Law—Professor. | University |
| I | National Institute of Agricultural Technology (INTA)—Staff. | Research (government) |
| J | Eco-enterprises. | Producer Association (ecology) |
| K | Independent Producer. | Producer (independent) |
| L | National Institute of Agricultural Technology (INTA). Animal health, ecophysiology. | Research (government) |
| M | Secretariat of Family Agriculture. | Government—Family agriculture |
| N | Catholic University of Salta (UCASAL)—Professor | University |
| O | National Institute of Agricultural Technology (INTA). | Research (government) |
| P | Sustainable use of biodiversity project UNDP ARG15/G53 (Livestock)—Technician. | International organization—Environmental |
| Q | Fundapaz—Staff. | NGO (aboriginal and family) |
| S | National Institute of Agricultural Technology (INTA)—Natural Resources and Environment | Research (government) |
| CRIT | CG1 | CG2 | CG3 | CG4 | CG5 | |
|---|---|---|---|---|---|---|
| TÉC | ||||||
| T1 | 6.706 | 6.239 | 5.884 | 6.388 | 6.407 | |
| T1-A | 6.848 | 6.853 | 7.667 | 6.767 | 7.917 | |
| T1-B | 6.509 | 5.382 | 4.029 | 6.094 | 5.077 | |
| T2 | 7.560 | 7.871 | 7.199 | 7.730 | 7.450 | |
| T2-C | 7.813 | 8.317 | 8.400 | 8.214 | 8.353 | |
| T2-D | 7.571 | 6.929 | 4.667 | 7.462 | 5.500 | |
| T3 | 7.578 | 7.966 | 8.992 | 7.508 | 9.174 | |
| T4 | 6.245 | 7.150 | 4.087 | 5.407 | 7.000 | |
| T5 | 5.411 | 5.419 | 3.548 | 4.086 | 4.375 | |
| V-AC | V-AD | V-BC | V-BD | V | |
|---|---|---|---|---|---|
| 1st | T2 | T3 | T2 | T3 | T3 |
| 2nd | T3 | T2 | T3 | T2 | T2 |
| 3th | T1 | T1 | T4 | T4 | T1 |
| 4th | T4 | T4 | T1 | T1 | T4 |
| 5th | T5 | T5 | T5 | T5 | T5 |
Publisher’s Note: MDPI stays neutral with regard to jurisdictional claims in published maps and institutional affiliations. |
© 2021 by the authors. Licensee MDPI, Basel, Switzerland. This article is an open access article distributed under the terms and conditions of the Creative Commons Attribution (CC BY) license (https://creativecommons.org/licenses/by/4.0/).
Share and Cite
Gualotuña Parra, J.A.; Tarquis, A.M.; Grau Olivé, J.B.; Colombo Speroni, F.; Saa-Requejo, A. An Analytical Approach to Assess the Influence of Expert Panel Answer on Decision Making: The Case of Sustainable Land Use in Ribadavia Banda Norte, Salta (Argentina). Sustainability 2021, 13, 6705. https://doi.org/10.3390/su13126705
Gualotuña Parra JA, Tarquis AM, Grau Olivé JB, Colombo Speroni F, Saa-Requejo A. An Analytical Approach to Assess the Influence of Expert Panel Answer on Decision Making: The Case of Sustainable Land Use in Ribadavia Banda Norte, Salta (Argentina). Sustainability. 2021; 13(12):6705. https://doi.org/10.3390/su13126705
Chicago/Turabian StyleGualotuña Parra, José Alex, Ana M. Tarquis, Juan B. Grau Olivé, Federico Colombo Speroni, and Antonio Saa-Requejo. 2021. "An Analytical Approach to Assess the Influence of Expert Panel Answer on Decision Making: The Case of Sustainable Land Use in Ribadavia Banda Norte, Salta (Argentina)" Sustainability 13, no. 12: 6705. https://doi.org/10.3390/su13126705