Article

The Effect of Blue-Green Infrastructure on Habitat Connectivity and Biodiversity: A Case Study in the Ōtākaro/Avon River Catchment in Christchurch, New Zealand

1
Department of Civil and Natural Resources Engineering, University of Canterbury, Christchurch 8041, New Zealand
2
Manaaki Whenua—Landcare Research, Lincoln 7640, New Zealand
3
School of Earth and Environment, University of Canterbury, Christchurch 8041, New Zealand
4
BEEA Limited, Wellington 6012, New Zealand
5
School of Geography, Environment and Earth Sciences, Victoria University of Wellington, Wellington 6012, New Zealand
*
Author to whom correspondence should be addressed.
Sustainability 2021, 13(12), 6732; https://doi.org/10.3390/su13126732
Submission received: 27 April 2021 / Revised: 10 June 2021 / Accepted: 11 June 2021 / Published: 14 June 2021
(This article belongs to the Section Sustainable Engineering and Science)

Abstract

:
The natural capital components in cities (“blue-green infrastructure” BGI) are designed to address long-term sustainability and create multi-benefits for society, culture, business, and ecology. We investigated the added value of BGI through the research question “Can the implementation of blue-green infrastructure lead to an improvement of habitat connectivity and biodiversity in urban environments?” To answer this, the Biological and Environmental Evaluation Tools for Landscape Ecology (BEETLE) within the Land Utilisation and Capability Indicator (LUCI) framework was adopted and applied in Christchurch, New Zealand, for the first time. Three ecologically representative species were selected. The parameterisation was based on ecological theory and expert judgment. By implementation of BGI, the percentages of habitats of interest for kereru and paradise shelduck increased by 3.3% and 2.5%, respectively. This leads to improved habitat connectivity. We suggest several opportunities for regenerating more native patches around the catchment to achieve the recommended minimum 10% target of indigenous cover. However, BGI alone cannot return a full suite of threatened wildlife to the city without predator-fenced breeding sanctuaries and wider pest control across the matrix. The socio-eco-spatial connectivity analysed in this study was formalised in terms of four interacting dimensions.

1. Introduction

Currently, more than half of the world’s population lives in urban areas and this proportion is growing [1]. As a result, more large areas of natural habitat, globally, will be converted to human land uses [2]. Urbanisation is causing habitat loss and fragmentation of complex ecosystems typical of human settlements at the junction of hills, harbours, plains, rivers, and estuaries resulting in biodiversity decline [3,4,5,6,7]. Key biological processes such as breeding, dispersal, and resource utilisation are disrupted [8].
A species-based approach is necessary to examine the functional impacts of landscape change [9] because of differential responses to spatial patterns, patch composition in landscapes, and transformation of cultural landscapes [9,10], such as, for example, in the UK [11], China [12], and Mexico [13]. Increasingly, the importance of urban environments for wildlife and their interactions with people is recognised [14].
Nature-based solutions for urban environmental issues are now widely employed to generate multiple economic, social, and ecological benefits [15]. Blue-green infrastructure (BGI) is a planning framework designed to provide an integrative transition to inclusive, resilient, and sustainable urban environments [16,17]. BGI is a means of managing urban flood risk through interconnected networks of natural and designed landscape components [18,19]. BGI benefits include urban cooling, water storage and management, recreation, eco-culturally sensitive art and landscaping, and habitat creation for urban wildlife [20,21,22,23,24]. For example, apart from recreational and protected green space, backyards, rain gardens along roadsides, and playing field perimeters offer general wildlife habitats at a large to fine scale [19]. Green roofs and living walls have provided habitats for lizards in cities if niche modifications are applied to make them more lizard friendly and predator protected [25,26,27]. Water birds are attracted to constructed urban wetlands, including basins and floodway lawns, designed for flood control, public amenity, and other environmental benefits [28].
A major land use change along the 602 hectare Ōtākaro/Avon River Corridor (OARC) resulted from the 2010/2011 Canterbury Earthquakes. The area was ”red-zoned” after 5180 homes were damaged and subsequently demolished [29]. For Christchurch, it has become an opportunity to create a new “state of the art” city, while avoiding future retrofitting and incremental renewal [30]. The OARC Regeneration Plan was approved on 23 August 2019 by the Government under Section 38 of the Greater Christchurch Regeneration Act 2016 to support the short-, medium-, and long-term future land uses and opportunities of the OARC (gazetted on 23 August 2019, https://gazette.govt.nz/notice/id/2019-vr3901, last accessed on 1 May 2020). This Plan supports working with nature by establishing and regenerating native ecosystems to protect Christchurch residents from floods, enhance mahinga kai (traditional food gathering areas), and improve stormwater quality. It is anticipated that much of the OARC will be restored to native floodplain forest to enhance urban biodiversity [31,32]. There is continued debate about the Plan and its implementation. Local individuals and community groups who have invested a large amount of time and energy into formulation of the Plan are maintaining pressure on the authorities to deliver the outcomes. This translates into a desire for finer details and modifications to the Plan and a more expeditious process.
To optimise BGI interventions, it is necessary to develop tools that predict scenario benefits, thus, helping to prioritise and target conservation efforts [33]. Habitat connectivity has been quantified by tracking the migration of animals or using dispersal models to simulate the success of different ecological network designs [34], but local expert knowledge, data, and analytical effort are required to adapt generic approaches to specific (insular) landscape contexts and species. Habitat connectivity has been analysed in two Christchurch (New Zealand) studies [31,35]. The first study calculated habitat connectivity for a theoretical Christchurch City using the landscape development intensity index to measure human disturbance to ecosystems and quantify the relative costs of land use/landcover types. The study used the maximum seed dispersal distance of Kahikatea (Dacrycarpus dacrydioides), now only found naturally in one Christchurch location. In a second study, the integral index of connectivity was used by [31] to assess the importance of patches in the Christchurch urban area and test path designs for the OARC. The importance of building and managing small forest patches as stepping-stones between large patches was identified. These studies only considered animal movement indirectly as part of effective seed dispersal.
Least-cost models have been employed to determine preferred wildlife movement for optimising routes and conservation of meta-populations in wild environments [36,37,38]. Here, the habitat connectivity approach BEETLE (Biological and Environmental Evaluation Tools for Landscape Ecology), first developed by Forest Research (UK), is utilised. The characteristics and requirements of a variety of ecologically representative focal species are captured in a spatially differentiated manner in a geographic information system (GIS) [33]. An automated algorithmic representation of the BEETLE workflow has been embedded in the Land Utilisation and Capability Indicator (LUCI) framework. LUCI enables exploration of a landscape’s capability to provide a variety of ecosystem services such as flood mitigation, habitat connectivity, erosion, carbon stocks, water quality (nitrogen and phosphorus), and trade-offs using spatially explicit methods [39]. The habitat connectivity tool is intuitive and readily applicable to wildlife management problems with known habitat area requirements and dispersal characteristics. This tool has previously only been applied in the UK [40], and this first use in New Zealand (NZ) parameterises the contrasting habitat requirements and behaviour of representative endemic wildlife.
In the current study, the following research question is investigated: Can the implementation of blue-green infrastructure lead to an improvement of habitat connectivity and biodiversity in urban environments? To answer this question, potential areas of habitats of interest for selected species, as well as opportunities to expand existing areas and create new ones based on evaluating landscape scale land use changes proposed in the OARC Regeneration Plan and proposals of community groups in Christchurch (NZ) were investigated using the habitat connectivity tool in LUCI. Data from the Department of Conservation (DOC) and citizen science data (iNaturalist NZ, Mātaki Taiao) were used to detect the distribution of selected species in this study. Furthermore, whether proposed land use changes can support habitat connectivity for a range of focal species was tested, thereby, identifying network gaps for restoration in the area under investigation. The outcomes should assist decision makers and residents to better understand biodiversity needs, benefits, and actions within an ecologically functional and integrated OARC, leading to effective BGI implementation. Derivative methods and a conceptual framework may also be extrapolated to other cities seeking long-term resilience based on ecological principles.

2. Materials and Methods
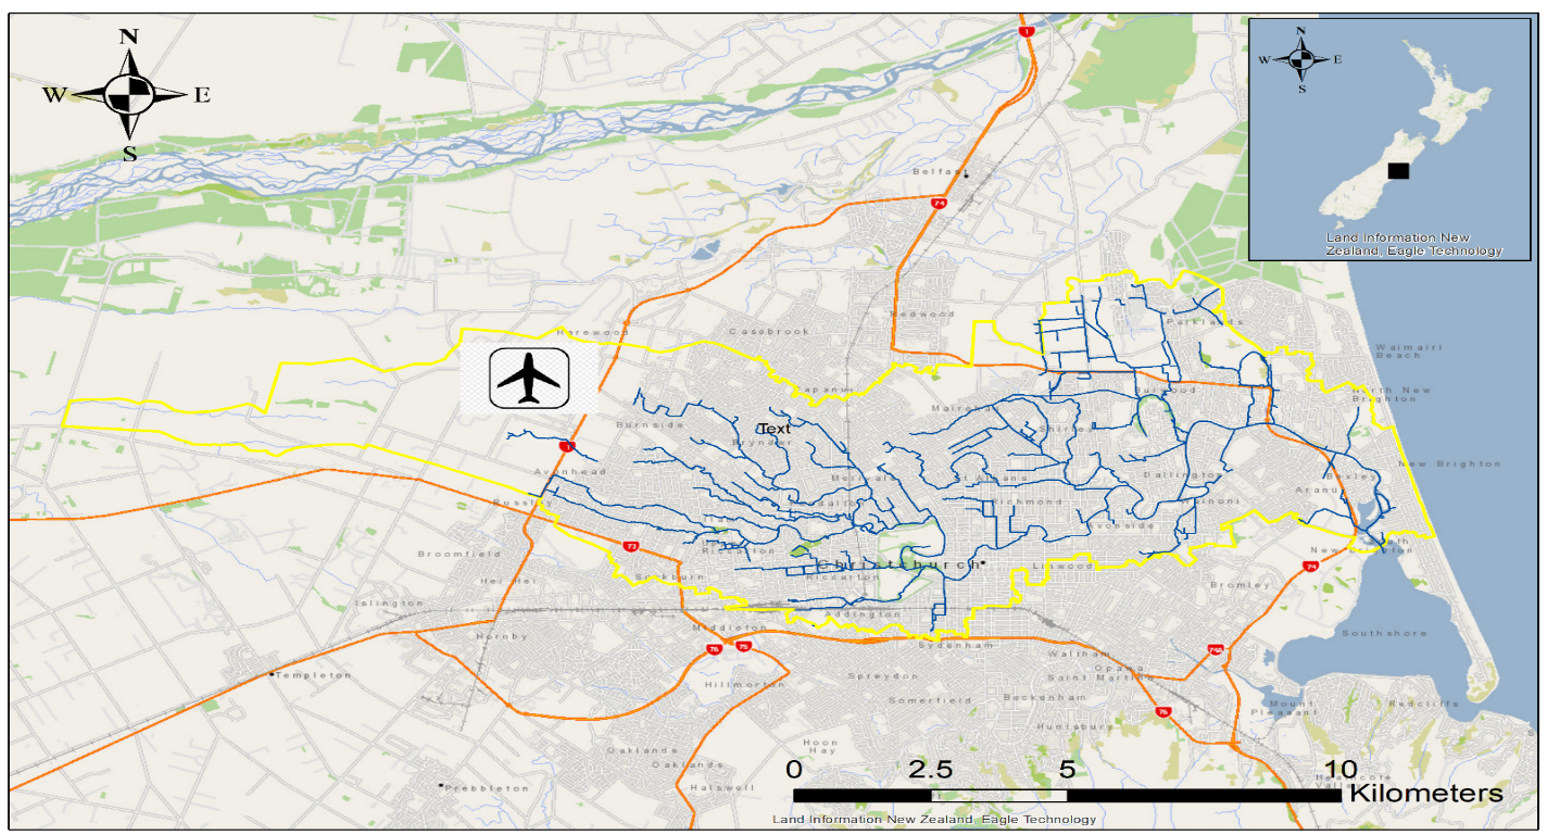
2.1. Study Area

The 89 km2 Ōtākaro/Avon River catchment is located in Christchurch, South Island, NZ. The climate is oceanic cool temperate with an average annual rainfall between 600 and 700 mm [41]. The spring-fed main stem of the Ōtākaro/Avon River originates in the northwest of Christchurch and flows 26 km to the Ōtākaro/Avon-Ōpāwaho/Heathcote Estuary (Figure 1). The 2010/2011 Canterbury earthquakes caused liquefaction and lateral spread near waterways, as well as land level changes, resulting in more frequent flooding in parts of Christchurch and impacts on ecology and biodiversity [42].
Over the past 30 years within NZ, a “green revolution” has taken place. Indigenous trees and shrubs have become increasingly preferred and more prevalent in both green field developments and home gardens through ecological restoration, urban planning, natural landscaping by community volunteers, and regeneration [43,44]. This holds true for Christchurch [45], where, in the first decade of restoration, more than one million indigenous trees have been propagated and planted as a result of peoples’ increasing conservation awareness and ethic [45]. For the ensuing century, the cityscape slowly matured into its present woodland character with a total tree canopy cover of 15.6% [46]. Nevertheless, planted patches are still small, isolated, and fragmented [31]. Sustaining indigenous wildlife against introduced mammals is especially challenging in NZ due to its long evolutionary isolation from continental biotic influences.

2.2. Data and Methods

In Figure 2 the workflow of the current study to assess the effect of BGI on habitat connectivity and biodiversity is shown. First, the spatially distributed input data digital elevation model (DEM) and land use/land cover were prepared and inputted into LUCI. Next, the model is parameterised, i.e., maximum dispersal distance, resistance values, and patch sizes for the selected species were entered. Two land use scenarios, the baseline year 2018 and the projected land use/land cover due to implementation of BGI were simulated. The impact on ecosystem services was analysed using BEETLE. This yielded potential areas of habitat expansion and potential areas of connected patches. Therefore, network gaps and the overall effect on biodiversity could be identified.

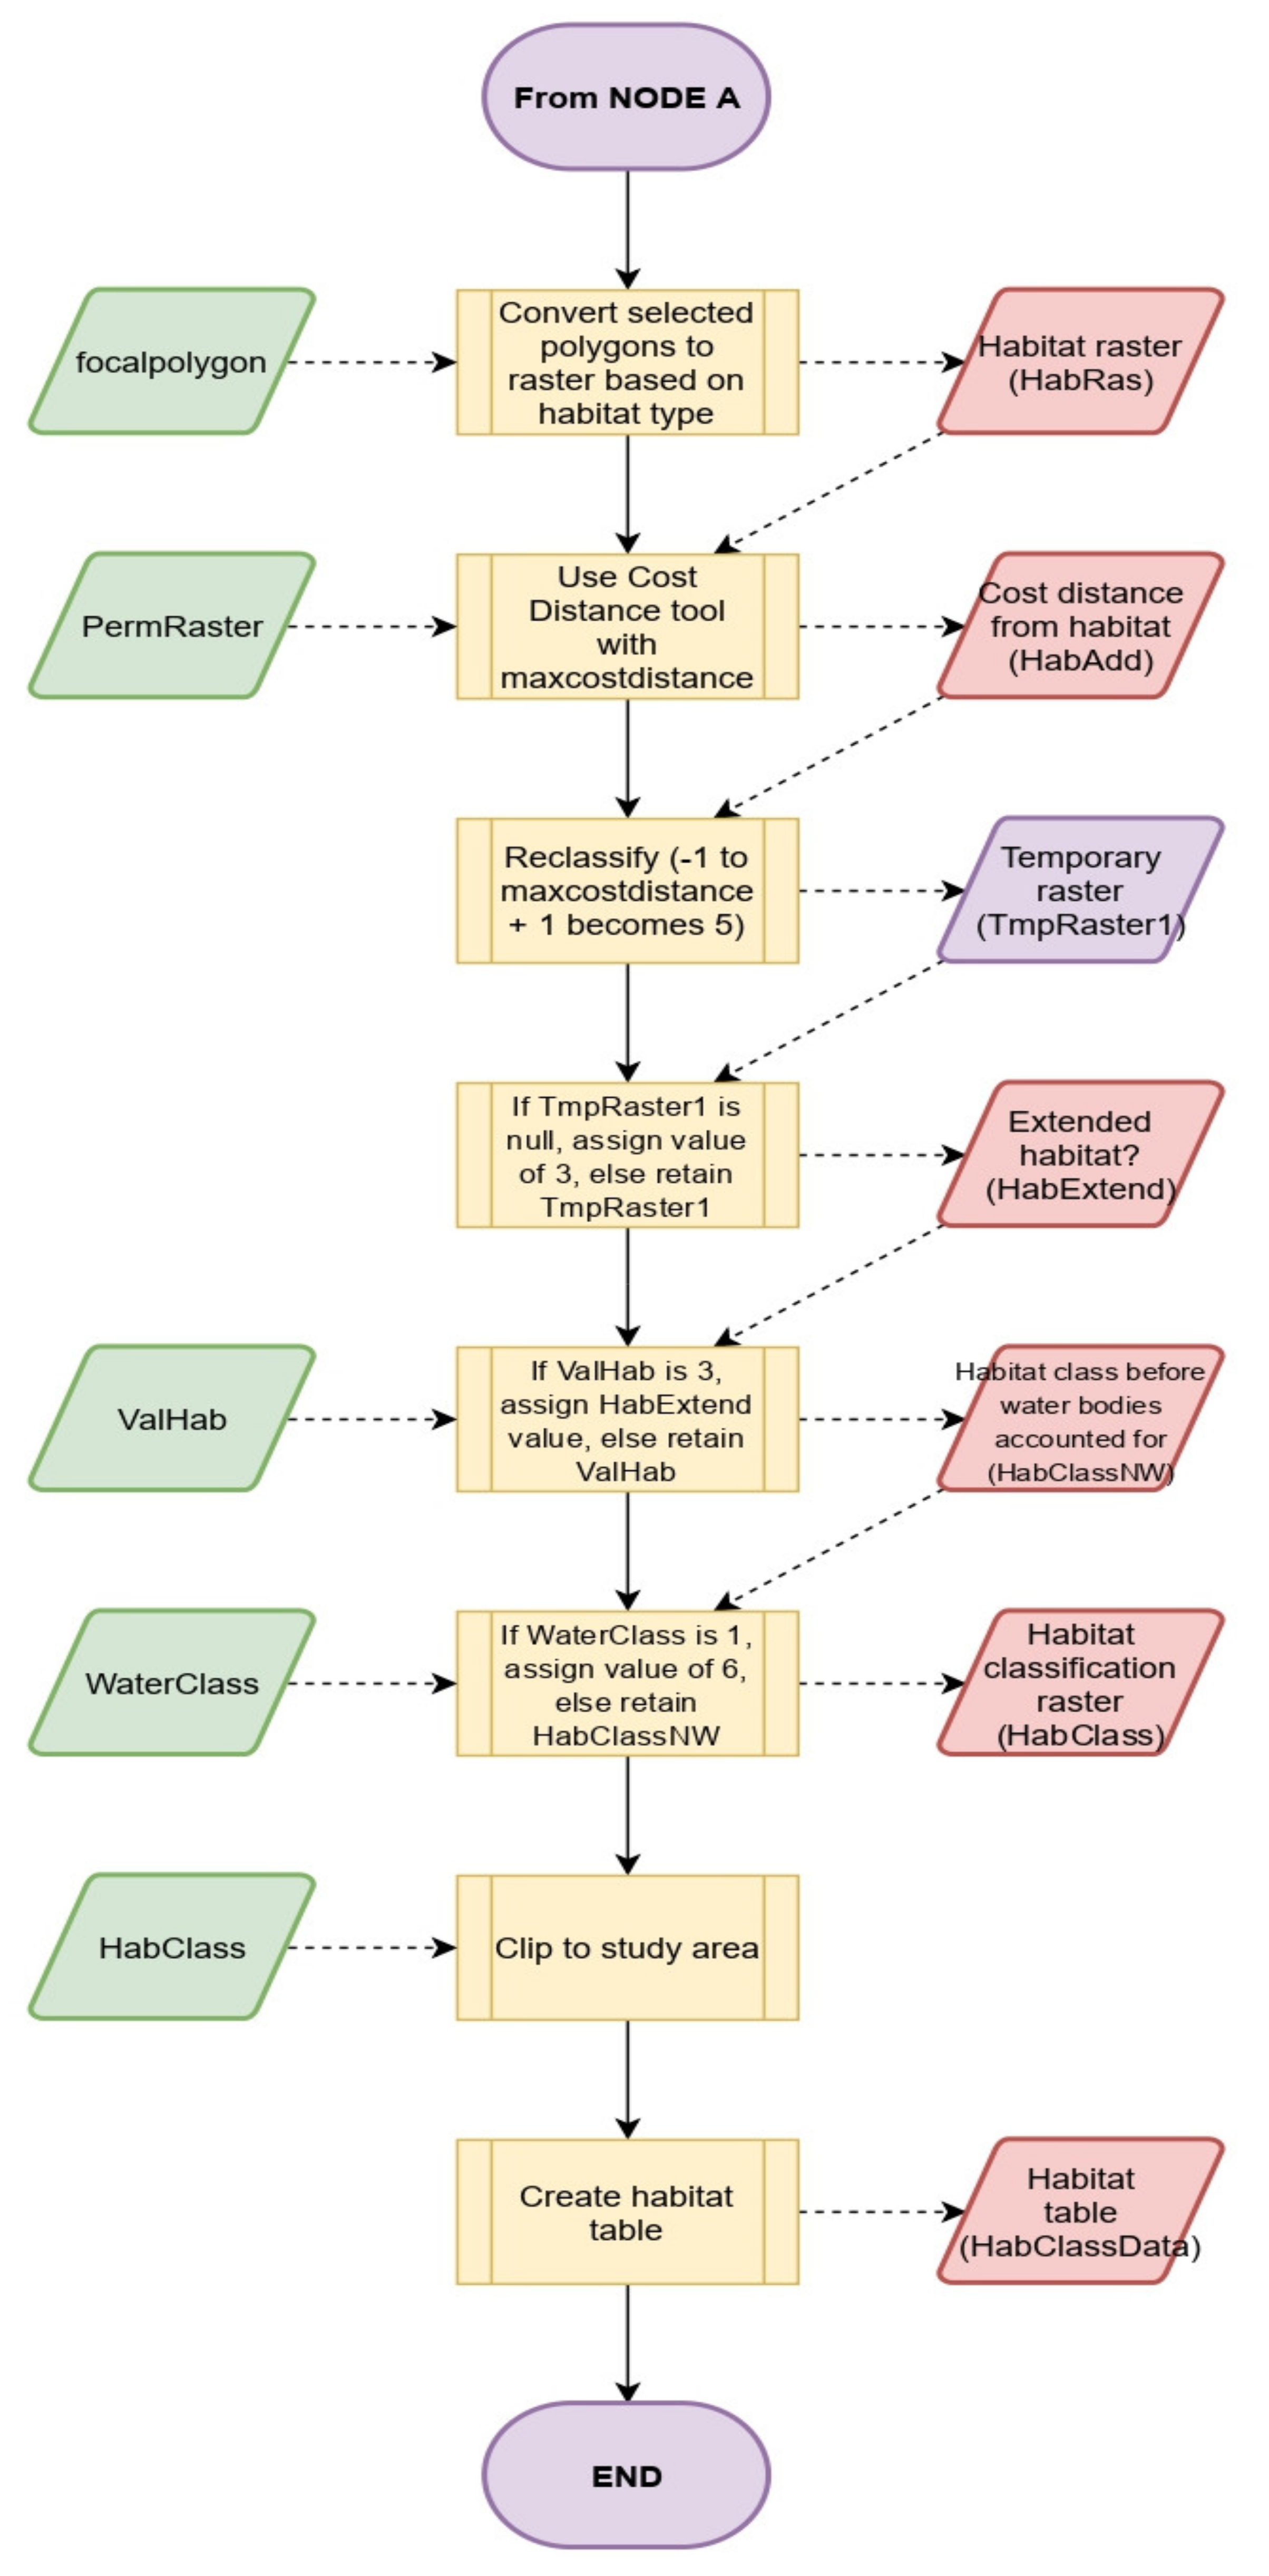
2.2.1. Input Data to Run LUCI Preprocessing

LUCI requires two essential data inputs: a digital elevation model (DEM) and land cover information. Table 1 describes the national and regional datasets used in this study.
The LCDB5.0 map does not cover small pockets of native trees, which are important food for forest birds and lizards. Aerial photos were employed to identify pockets of native trees before and after the field survey (data.linz.govt.nz, last accessed on 15 December 2020) and LCDB5.0 was updated. Critical BGI gaps were determined and the potential for filling these was identified. The building and road-bounded polygons were added to distinguish residential gardens from built-up areas and were named “urban parkland/open space”. The updated LCDB5.0 used for the scenario simulations is shown in Figure 3.

2.2.2. Parameterisation of the Selected Species

BEETLE was parameterised for selected NZ habitats and species. The following three key indigenous vertebrate species were chosen to represent contrasting wildlife niches: forest fruit/foliage eating birds, wetland/water/turf browsing bird, and omnivorous lizard.
Several factors affect optimal patch size and pattern. For example, the forest edge effect in the Auckland region of New Zealand has been measured as penetrating into a forest patch at least 50 m [44]. Therefore, the minimum necessary patch size for sustaining breeding populations of sensitive native forest-core species was 1–2 ha (Figure 4). Notably, a cultural (urban and rural) landscape with 5 ha patches at 5 km spacing amounts to only 0.3% of land cover and when smaller stepping-stone patches (ca. 1 ha every 1 km) were added, the total cover area still represented only 2% cover. Local government sets a target of ca. 10% of subdivision areas for reserve contribution [49]. Therefore, the minimum viable forest habitat for wildlife in a cultural landscape fits into these green space expectations given that the balance (8%) is still available for open space parkland and sports fields. Additional considerations were the interactive effects on edge effect of patch size and shape (Figure 4).
The variables were parameterised according to assumptions based on ecological theory and expert opinion. Specifically, the dispersal distances of 2.5 km and 5 km were derived from previous field studies. The maximum observed, effective dispersal distance of large seeds (matai), carried by the kereru, was 2.5 km, identified in the Canterbury region (Christchurch lies within Canterbury) case studies, which informed the landscape dynamics model [49]. Expanding on this work the optimal distance of 5 km between two source patches was proposed based on the knowledge that the case birds fly further than a 2.5 km space (where there are undisturbed ground conditions beneath a canopy) between such patches. This optimised patchwork model that informed our analysis is shown graphically in Figure 5.
All patch types, even a single tree, provide useable resources for bush birds and lizards, but the largest compact shapes, with dense infrastructure are most desired for undisturbed breeding. Such native tree patches (Figure A1 in Appendix A), in the case study area (0.05 ha minimum), that were visible and located in public land, were digitised from aerial imagery, ground-checked, and used to update the LCDB5.0 map. To verify potential utilisation of patches or land cover types for focal species, we investigated data from DOC, and the citizen science platform iNaturalist NZ (last accessed on 20 October 2020).
Because wildlife travel is not constrained by hydrological or catchment boundaries, the connectivity of target species must take into account the ecological conditions in adjacent catchments. Thus, we used the wider Christchurch City boundary (Figure 1) to more comprehensively understand how land use changes could affect existing habitat connectivity, and thereby made recommendations that enhanced ecological function in the case study area as well as across greater Christchurch. The following species were considered:
  • The kereru/NZ wood pigeon
The kereru/NZ wood pigeon (Hemiphaga novaeseelandiae) is a species of great biological and cultural significance (taonga or treasured species to Māori) within NZ. It is an important seed disperser of large fruits such as matai (Prumnopitys taxifolia (Podocarpaceae)) (seedlings observed 2.5 km from putative sources [49]) and is locally in critical decline [50].
The “home” habitat patches for kereru are based on the LCDB5.0 “indigenous forest” category. The landscape permeability scores for Christchurch are documented in full in Appendix A (Table A1 for forest birds) based on expert opinion. For practical purposes, we used 0.05 ha as the optimum patch sizes for bush birds. Therefore, this threshold provided a minimum measure of habitat connectivity for a focal species.
  • The putakitaki/paradise shelduck
The putakitaki/paradise shelduck (Tadorna variegata) is a large goose-like duck also endemic to NZ. Similar to other water birds, they disperse wetland and terrestrial plants. It has been inferred that they have carried propagules on their feet/feathers from Lake Ellesmere to Wigram Retention Basin (27 km distance) and Travis Wetland in Christchurch (Colin Meurk pers. obs.).
The “home” habitat patches for paradise shelduck are defined on the basis of the LCDB5.0 categories, i.e., “lake/pond”, “river”, “herbaceous freshwater vegetation”, and “herbaceous saline vegetation”. The landscape permeability scores for Christchurch are documented in full in Appendix A (Table A2 for water birds) based on expert opinion. We used the same optimum patch sizes for water birds, taking 0.05 ha as the minimum foraging habitat size for bush and water birds.
  • The NZ gecko (Haplodactylis)
These lizards eat nectar, invertebrates, and are effective dispersers of white/blue (as well as red) fruits from NZ divaricating shrubs. They can disperse seeds to 10 m and travel 20 m [51]. Thus, a generic gecko was chosen to represent omnivorous, ground-restricted wildlife. This focal species (with underpinning foraging ranges and effective seed dispersal distances) were tested against different patch sizes and densities.
The “home” habitat patches for a generic gecko, as defined based on the LCDB5.0 categories, are manuka and/or kanuka, broadleaved indigenous hardwoods, and matagouri or grey scrub. For a generic gecko there were no indigenous preferred patches identified in the Christchurch case study, but this overlooked that food resources are ubiquitous for omnivorous lizards, and predation by introduced mammals is their main limiting factor.
In the case study area, for the generic gecko, because there were no formal “preferred” habitat patches and because pockets of suitable native trees were only digitised on LCDB5.0 down to 0.05 ha, running the BEETLE model for the generic gecko produced a null connectivity result. Instead, we explored iNaturalist NZ data, supported by field inspection, to identify clusters of both native and exotic fruit trees/vines deemed to be favourable to generic gecko (Coprosma, Muehlenbeckia, Pseudopanax, Cordyline, Pittosporum, and exotic Hedera (ivy)) (extrapolated from [51]). A buffer of 20 m was utilised as the approximate maximum reported distance that a generic gecko could disperse seeds.

2.2.3. Land Use Scenarios

The OARC Regeneration Plan explicitly proposes that working with nature or building BGI in support of engineering solutions to reduce storm and flood damage will offer more sustainable and affordable options [32]. Managing stormwater in combination with naturalised plantings in detention ponds and wetlands, or along terraced river margins, will provide a buffer against floods and sea level rise, protect stopbanks from damage [32], provide wildlife stepping-stones and corridors, and native plant/animal sources.
Therefore, in this study, we explore ecosystem services derived from the proposed BGI in the Regeneration Plan and alternative strategies developed by community individuals and groups. This represents a first interpretation of possible outcomes from OARC land use changes. Two land use scenarios were modelled to determine the current state of habitat connectivity and how BGI could increase it in the Ōtākaro/Avon River catchment. Scenarios 1 and 2 are depicted in Figure 6a,b, respectively.

2.2.4. Habitat Connectivity Tool BEETLE

The habitat connectivity tool in LUCI identifies necessary and suitable areas for habitat protection and expansion. The tool follows a cost-distance approach for evaluating habitat connectivity. LUCI automates this; however, to date, it has only been parameterised and applied in the UK to selected habitats and species of interest. Expert opinion on landscape permeability, minimum patch size, and dispersal distance was gathered from 3 native species from the Ōtākaro/Avon River catchment through iterative consultation. It supported that the tool could be applicable in the NZ context. The permeability score of each land use type was used to define the effective or least-cost distance a species could potentially move through each land use and the scores ranged from 0 to 10. The dispersal ability of a focal species and its ease of movement through the surrounding landscape (permeability) are key inputs to modelling connectivity [36]. The maximum dispersal distances were 2.5 km and 5 km for kereru and paradise shelduck, respectively, and 20 m for generic gecko. The minimum habitat size for kereru and paradise shelduck was 0.05 ha; for generic gecko, a single fruit tree, which it prefers, was used.
The effective or least-cost distance that describes a species’ mobility through the matrix uses the relative permeability score of each matrix land cover type [36,49] derived from local ecological opinion (Christchurch City Council, Landcare Research staff, and wildlife consultants) and quantifies habitat connectivity for species of interest [11]. The tool is coded in Python and embedded as a toolbox in a GIS environment. The cost surface raster using permeability scores and habitat patch sizes and the cost-distance surface using the “cost-distance function” were generated to calculate the Euclidean distance from a habitat patch. The flowchart describing the steps undertaken in the habitat connectivity tool is given in Figure A2 (Appendix A).

2.2.5. Distinct Habitat Connectivity Model Output Areas

The habitat connectivity simulations show the areas of existing habitats of interest in dark green. Pale green shows other areas of habitats that are not designated “as of interest” but are still considered to be a priority to conserve. Orange areas show where habitat establishment is possible but exceeds the maximum cost-distance travelled, that is, habitats established here would not be connected to existing habitats of interest within usual wildlife energy budgets. Red areas are currently accessible to the species of interest, and therefore establishing a new habitat in this area would extend the available habitat. This does not mean that the entire red area needs to become a “habitat of interest” in order to achieve population viability; rather, it is showing the maximal extent within which a new habitat would be connected to the existing habitat. Establishing such a habitat would improve connectivity because the distance needed to be traversed across intervening “hostile” terrain between patches is within the maximum cost-distance threshold. Beyond this (red area), the distance of “hostile terrain” to be traversed exceeds the species threshold, and therefore makes no measurable improvement to landscape connectivity. Patches of existing habitats of interest which are below the minimum area for focal network are not considered large enough to be a priority to improve habitat connectivity.

3. Results

The following subsections describe existing and potential blue-green patch networks for each of the three ecologically representative wildlife. These future habitat opportunities are spatially defined, and the benefits of various scenarios are quantified in terms of connectivity, extent, and service provision.

3.1. Kereru

3.1.1. Existing Potential Networks in and near the Ōtākaro/Avon River Catchment

The model output (Figure 7) demonstrates contrasting degrees of connectivity and spatial occupancy for the kereru, which is representative of a native keystone frugivorous forest bird. These represent, in order, the current pattern of patches and corridors (putatively suitable for breeding and foraging, respectively) under existing levels of domestic predation, and secondly, occupancy with potential enlarged forest patches. Therefore, the model is able to identify critical gaps in continuity of habitat against the reasonable foraging/effective dispersal distances of the wildlife.
The existing habitats of interest (dark green) meet the 0.05 ha threshold, and the foraging range from those patches (red) fits effective propagule saturation/dispersal distances of 2.5 km and 5 km for the kereru. Furthermore, other priority habitats (pale green) are indicated, being conserved for other purposes, for example, herbaceous freshwater and saline vegetation. Habitat establishment is also possible elsewhere, but access to it exceeds the maximum cost-distance travelled (orange).
The 2.5 km dispersal distance scenario (Figure 7a) does not connect all existing habitats of interest (several red halo areas are disconnected) in the OARC from source to sea (west to east direction), nor in the Styx catchment to Port Hills, north-south direction. The 5 km dispersal setting (Figure 7b), however, does connect all largely riparian patches (continuous red areas), although extensive gaps remain beyond the permanent waterways (orange). There are no pockets of native trees upstream of the Avon River as the land is farmed and an airport is nearby (see Figure 1).

3.1.2. Future Scenario and Gap Fillers

As compared with Scenario 1, the Scenario 2 habitats of interest increase from 0.6% to 3.3% for the kereru. The proposed land-use enhancements help to connect potential areas of existing habitats of interest for the kereru from the west to the east within the catchment (primarily along the Avon River), but there is no change in connecting the potential areas of existing habitats of interest with other nearby catchments, unless clusters or individual trees in residential areas are brought into the mix.
Connectivity increases for longer dispersal distances between habitat patches (Figure 8). This is reasonable for larger (fruit/foliage/nectar feeding) bush birds who routinely fly longer distances and the 2.5 km dispersal distance still potentially saturates with seed all intervening spaces between habitat patches/foraging stepping-stones that are up to 5 km apart.

3.1.3. Changes in Habitat Patch Categories between Scenarios

The results shown in Figure 7 and Figure 8 are quantified in Figure 9, presenting the changes in percentage of habitat patch categories from Scenario 1 to Scenario 2. These results cover the changes for the Avon River catchment, not the whole of Christchurch. The built-up areas and the potential areas to establish new habitats decrease from 32.5% to 31.7% and from 52.8% to 46.1%, respectively, which help to increase the areas of habitat of interest for the kereru from 0.58% to 3.33% and the potential areas where an expansion to the preferred habitat for the kereru from 11.7% to 15.2% is observed. An increase in the red halo area also shows the potential of each habitat of interest area to be connected to each other with the maximum distance of 2.5 km (Figure 9a). With the change of maximum dispersal distance to 5 km, it is not advantageous to increase the percentage of habitats of interest, but rather increase the potential to expand existing habitats areas, and therefore increase the opportunity of connecting habitat. Figure 9b shows a change from 26.4% to 29.1% from Scenario 1 to Scenario 2.

3.1.4. Changes in Habitat Size

Then, the habitat connectivity tool was run with various sized potential areas of habitats of interest (Figure 10) using the 2018 baseline and constant dispersal distance of 2.5 km for the kereru. As expected, when a smaller minimum habitat size of 0.05 ha is used (Figure 10a), the patch number and total area of usable habitat is greater as compared with the results using larger minimum habitat sizes of 0.1 ha (Figure 10b), 1 ha (Figure 10c), and 2 ha (Figure 10d).

3.2. Paradise Shelduck

3.2.1. Existing Potential Networks in and near the Ōtākaro/Avon River Catchment

Water birds (shelducks) are associated with and graze wetlands and turfs, as well as well-watered lawns. The “urban forest” of most cites is an almost continuous mosaic of trees, shrubs, hedges, and lawns, with embedded larger definable patches and linking corridors, which is suitable grazing for shelducks. Similar to the kereru, water birds were tested with dispersal distances of 2.5 km and 5 km but more red halo areas are connected (Figure 11) as compared with those for the kereru (Figure 7). However, the Avon River headwaters, in the absence of preferred wetland bird habitat are disconnected with the rest of the catchment.

3.2.2. Planning Scenario and Gap Fillers

Compared to Scenario 1, the habitats of interest increased from 1.2% to 2.5% for the paradise shelduck in Scenario 2. More habitats of interest (green) are established in the east of the catchment, but there is no change in connecting the potential areas of existing habitats of interest with the upstream area of the Ōtākaro/Avon River catchment. Connectivity increases for longer dispersal distances between habitat patches (Figure 12). Most wetland birds who routinely fly longer distances (e.g., >15 km from Te Waihora/Lake Ellesmere to Christchurch and across Foveaux Strait) will take advantage of such additional connectivity.

3.2.3. Changes in Habitat Patch Categories between Scenarios

Figure 13 provides the changes in percentage of habitat patch categories for Scenarios 1 and 2, and for different maximum dispersal distances 2.5 km and 5 km, respectively. The proportion of habitats of interest for the paradise shelduck increased from 1.2% in Scenario 1 to 2.5% in Scenario 2. The red halo area reduction is insignificant when BGI is implemented in Scenario 2, from 30.3 to 26.9% for a maximum dispersal distance of 2.5 km (Figure 13a) and from 46.2% to 43.0% (Figure 13b) for a dispersal distance of 5 km. These changes are more pronounced for a change in maximum dispersal distance from 2.5 km to 5 km for a given scenario, with an increase from 30.3% to 46.2% for scenario 1 and from 26.9 to 43.0 for Scenario 2.

3.3. Geckos

Because there were no formally “preferred” habitat patches for the generic geckos in the case study area, the locations of single favourable fruit trees/shrubs, usually within native bush clusters/groves, and their potential to travel 20 m to get fruits with a high chance of dispersing seeds between individual trees were used instead (Figure 14). These single trees/shrubs are recorded in public and residential lands, with higher density near rivers. The three clusters (yellow circles) more closely examined show that even on the basis of undirected iNaturalist data, there is strong urban connectivity for geckos. Field inspections in residential areas with limited iNaturalist recorded fruit species, showed that, on average, suitable habitats (densely structured, with fruit plants, as well as nectar and insects) did exist in half of ca. 20 m wide properties. This fits our assumption that, even under existing vegetation conditions and in the absence of mammalian predators, generic geckos can potentially forage widely across urban Christchurch and find connected, protected breeding habitats. Although they have not been recorded recently in the case study area, there are unpublished reports of geckos in residential properties with, for example, rock walls providing refuge from mammalian predators.

4. Discussion

To demonstrate and quantify benefits for wildlife in the Ōtākaro/Avon River catchment and the OARC through changes in land use/type proposed in the OARC Regeneration Plan, the habitat connectivity tool in LUCI was upgraded and applied for the first time in NZ. This enabled current and potential habitat connectivity for focal species to be explored, compared, and evaluated. The study identified (from aerial imagery and in the field), and digitised, pockets of native trees which were visible and located in the public land within the OARC, down to a minimum size of 0.05 ha for the kereru and the paradise shelduck and 0.002 ha for the generic gecko. The LCDB5.0 is a regional-scale database with a 1 ha minimum mapping unit, thus, pockets of native trees (<0.5 ha) at a local scale are not recognised. Accordingly, local knowledge and field surveys were required to incorporate a finer scale habitat database.
The 2012 “threatened environment classification” [52] for the Lowland Plains environment, including the OARC retains much less than 10% of their land area under some form of indigenous cover. Meanwhile, [53] suggested a minimum target of 10% indigenous (forest) cover in urban, peri-urban, and other highly modified environments of all of NZ’s main urban centres to maintain ecological integrity and representative biodiversity. The current work shows that the Regeneration Plan, if implemented, would help to increase this percentage of indigenous cover, up to 3.3% for the whole Ōtākaro/Avon River catchment. The suggested expanded “red colour” patch locations in Figure 7 and Figure 8 increase the “opportunity for native plant regeneration” up to 29.1%. There is a need to consider where the existing indigenous forest can be expanded in practice based on the model outputs. Furthermore, an increasing degree of indigenous planting, at a finer scale, in private residential properties and in community riparian and park restoration projects, including succession planting and regeneration under existing exotic canopies, should be adopted in order to achieve the minimum indigenous cover target. Opportunities also exist along the catchment border, linking habitats in adjacent watersheds. The upstream part of the catchment is dry, but can support a woodland of totara, kanuka, cabbage tree, kowhai, and houhere. However, proximity to the Christchurch International airport prohibits creation of habitats attractive to especially large birds that pose a risk to aircraft. While there is no “standard” requirement of wetland target in cities, this study proves that the OARC Plan helps to provide a “preferred” habitat for water birds in the city, with an increase of 1.3% habitats of interest).
Studies of the kereru have indicated a >2 ha home range [49,54]. When the model for kereru is run with a threshold of 2 ha (Figure 10), habitat connectivity for the catchment reduces to zero. While it is challenging to convert urban land uses (residential or industrial areas) into such large habitats of interest, there is potential to expand some existing habitats for kereru breeding and nearby foraging (halo). The residential matrix could be enriched for foraging, and core habitat could be expanded in Hagley Park (165 ha) and other Council land including the now significant potentials in the OARC. In particular, the proposed Waitākiri Sanctuary would provide a predator-fenced, ecologically restored enclosure connecting Travis Wetland and the west Burwood residential red zone, making a total of 180 ha of both forest and wetland (avonotakaronetwork.co.nz, last accessed on 5 January 2021). The Sanctuary would allow reintroduction of viable populations of charismatic, endangered, and locally extinct wildlife within the sanctuary or in the surrounding halo. This would complement the proposed Banks Peninsula sanctuaries and a tui (endemic nectivorous bird) corridor feeding into the residential city from its opposite side. Together, these sources would provide overlapping haloes or waves of wildlife foraging, propagule dispersal, and human interaction spreading across the city from their respective sanctuaries.
Although the home range of generic geckos is smaller than 20 m radius [55], potentially allowing them to exploit many small patches in cities, mammalian predators, including domestic pets, decimate lizards in NZ urban environments, and almost exterminate the more vulnerable geckos from residential parts of the city. There have been five observations of geckos in the Ōtākaro/Avon River catchment extracted confidentially from DOC’s database. Two geckos have been recorded in the New Brighton suburb of Christchurch (observed in 1940 and 1955); three geckos have been recorded in the Riccarton suburb, Riccarton Bush, and Riccarton Road (observed in 1980 and 2006). There are no potential areas of existing habitats (formally designated as gecko habitats of interest) in the study area, so the model on this basis cannot identify connectivity for the generic gecko. Nevertheless, most urban residential environments would be suitable in the absence of introduced mammals. Consistent with this, [56] found, for six NZ cities including Christchurch, that 38.5% of NZ lizard species were likely to have occurred in current urban core areas prior to human settlement. However, no lizards have been recorded in more than half of them in the last 20 years and have likely been eliminated. Huge potential exists to provide safe habitats for lizard in urban areas if ecosystem restoration and predator proofing is encouraged [56]. For example, the successful reintroduction of geckos in a 7 ha primary podocarp forest at Riccarton Bush, in 2016, was enabled by a surrounding predator-proof fence [57]. Predator-free offshore islands around NZ are Tiritiri Matangi in Hauraki Gulf and Ulva Island off Stewart Island, and mainland fenced islands occur at Maungatautari near Hamilton, Zealandia in Wellington, Brook Waimārama Sanctuary in Nelson, and Orokonui near Dunedin (Sanctuaries.nz.org, last accessed on 10 January 2021); however, predator-protected roof gardens are an obvious micro-opportunity in any urban environment [19].
The results from Figure 9 and Figure 13 show an increase in habitat connectivity among the “potential habitat of interest” areas. There are more improvements of connected habitats if the maximum dispersal distance of 5 km is applied as compared with a maximum dispersal distance of 2.5 km. Therefore, for a maximum dispersal distance of 5 km, there is currently adequate patch density to achieve landscape connectivity (foraging range with sufficient food supply in native trees or wetland) for both forest and wetland birds in urban areas where there is limited space to accommodate further native habitats. Nevertheless, connectivity can be facilitated (and probably accelerated) with smaller stepping-stone patches in intermediate positions in the landscape between the larger patches. There were a few smaller patches in the Styx and Heathcote River catchments identified in LCDB5.0, and a field search for native tree pockets was not carried out there, as they were outside the boundary of this case study. Therefore, the full potential connectivity across the catchment boundary is likely underestimated.
Our study demonstrates how BGI (applied in the OARC), provides “preferred habitat patch” configurations for forest birds (kereru), wetland birds (paradise shelduck), and less clearly for “generic gecko”, without additional protective infrastructure, as well as increasing habitat connectivity among existing and future “habitats of interest”. The model outputs show the generalised potential of BGI, but practical implementation will require site-specific ground checking and community engagement. Nevertheless, the halo effect (safe foraging distance beyond breeding sanctuaries with consequent citizen interaction) is reinforced by controlling invasive (exotic) predators throughout the matrix as well as within the protected area [58]. This facilitates direct human-wildlife attachment and a conservation ethic among citizens who are motivated to seek more conservation measures as observed in Wellington and Dunedin (predator-free city movement, Sanctuaries.nz.org, last accessed on 10 January 2021).
This is the first time the habitat connectivity BEETLE tool in LUCI has been parameterised and applied in New Zealand. The tool outputs and insights from our scenario testing should support planners within the Christchurch context. Further testing of parameters in different case studies would calibrate and validate the model for more accurate predictions and wider applications. Whereas model outputs so far have focused on improving biophysical ecosystem services, changing the provision and type of BGI would have consequences for landscape integrity and functionality, and socio-cultural patterns, interactions, and well-being.
The parameterisation for selected species is based on ecological theory and expert judgment developed through an iterative process with local ecologists. Fieldwork of observing and monitoring seed dispersal distance and habitat patches for feeding and breeding of selected species was not within the scope of this first modelling study. In future work, the species data should be refined and extended to additional species through long-term field campaigns.
This study focused on wildlife mobility/habitat requirements and consequent plant propagule dispersal (dependent on selected species’ carriers and receptive nursery habitat), and we were cognizant of ecosystem service provision and ultimately ecosystem interactions with humanity. Thus, we recognised the interacting dimensions of connectivity (Figure 15) that control ecosystem functioning through space (landscape patterning/quality), time (growth/succession/dynamics), and the socio-noosphere (cultural/economic value and purpose, ecological literacy). Integration of the fourth dimension of socio-noosphere could be further explored in a follow-up study.
We formalised this socio-eco-spatial connectivity in terms of four interacting dimensions or conceptual nodes. Patch size, quality, density, accessibility, and safety are perceived differently by wildlife and people according to their species-specific mobility, food/resource requirements, and vulnerability and psycho-social conditioning. Perceived value will depend on the visibility, aesthetics, accessibility, resource provision, identity, and physiological/microbiome connectivity between focal species and the patch pattern. For example, the perception of interpatch distance/resistance varies according to each unique species-niche perspective. Thus, patch connectivity looks different to a bird and a plant, being dispersed by a bird. In general, birds fly further than they disperse seed (to a hospitable or receptive environment), since the probability of the latter is an additional multiplier. Predator-fenced sanctuaries would further differentially enhance the experience of this landscape for different species and citizens. Our connectivity framework, therefore, conceptually describes these interactions (Figure 15) based on the following assumptions:
  • Wildlife movement (both transportive and digestive) and plant dispersal adaptations are fundamental to ecosystem integrity that generates a series of spatially determined feedback loops.
  • These are all “chickens and eggs”, i.e., there is no beginning (animal?) or end (plant?) so long as the connectivity is maintained.
  • Plant dispersal capability (especially in NZ) depends on wildlife (and to lesser extent air/water) movement, which in turn feed into evolving landscape patch growth and patterning, and in turn influence wildlife movement, foraging, and migration.
  • Vegetation patterns across the landscape, reacting to hydro-topographic gradients, create physicochemical filtration, as well as food and fibre ecosystem services.
  • Human culture is place based and interactive with local nature; local, regional, and planetary sustainability increasingly depends on a healthy understanding (ecological literacy) and relationship with (legible) nature.
All of the dimensions of the framework for landscape connectivity (Figure 15) influence human understanding, activity, and well-being and become embedded in survival, comfort, and culture. They are all subject to interaction with wildlife (through engagement, hunting, selective trapping/control for biosecurity, nature appreciation, and eco-tourism), vegetation/biodiversity (planting, weeding, guided regeneration, appreciation, forest-bathing, and landscape legibility), and constructed ecosystem services or BGI (retention/detention basins, filtration wetlands, green roofs, rain gardens, riparian/stream enhancement, erosion control, etc.).

5. Conclusions

The LUCI habitat connectivity (BEETLE) tool provides supporting information for future planning of BGI, shown here for the case of the OARC. The tool identified and quantified potential habitat of interest areas, opportunities to expand the existing habitats, and creating new habitats for selected species based on two investigated scenarios: baseline 2018 and land use changes in the OARC Regeneration Plan proposed by Regeneration Christchurch, individuals, and community groups. We demonstrated the added value of urban BGI in terms of habitat connectivity and biodiversity. The indigenous forest area, which is the habitat of interest for the kereru, can increase up to 3.3% and the wetlands or water bodies which are the habitats of interest for the paradise shelduck can increase up to 2.5%, if the regeneration plan is implemented. Furthermore, there is opportunity to increase habitat connectivity among existing and future “habitats of interest”. However, the results were less clear for the generic gecko. We recommend native tree planting in private and public land to achieve the minimum target of 10% indigenous (forest) cover in urban areas. The valued habitats would benefit the species selected here, and also attract other interdependent native species along with human-cultural relationships. It has to be emphasised, in the biogeographically idiosyncratic and challenged NZ context, that for many vulnerable wildlife provision of a habitat in itself is not enough, hence, the need for secure predator-fenced sanctuaries across the regional landscape and pest control throughout the interpatch/corridor matrix, at least until an aspirational “predator-free NZ” is achieved. This would enable wildlife to move out into the matrix in search of food and facilitate social interactions with indigenous wildlife. Urban restoration would help to reconnect city residents with nature, raising ecological literacy, reducing “nature deficit disorder”, and thereby supporting regional, national, and international biodiversity goals and broader ecological aspirations or imperatives.

Author Contributions

Conceptualization, T.T.N., C.M., R.B., B.J. and M.P.; Data curation, T.T.N.; Formal analysis, T.T.N. and C.M.; Investigation, T.T.N.; Methodology, T.T.N. and C.M.; Resources, C.M.; Software, R.B. and B.J.; Supervision, R.B., B.J. and M.P.; Validation, T.T.N.; Visualization, T.T.N.; Writing—original draft, T.T.N.; Writing—review and editing, C.M., R.B., B.J. and M.P. All authors have read and agreed to the published version of the manuscript.

Funding

Thuy Nguyen received scholarship support by a Department of Civil and Natural Resources Engineering Doctoral Scholarship, University of Canterbury.

Institutional Review Board Statement

Not applicable.

Informed Consent Statement

Not applicable.

Data Availability Statement

The data presented in this study are available on request from the corresponding author.

Acknowledgments

The authors wish to acknowledge Christchurch City Council, Landcare Research staff, and wildlife consultants for their contributions on model parameters, and the Department of Conservation for granting access to data. We greatly appreciate the comments provided by three anonymous reviewers and the editor, which have significantly contributed to improving the quality of the paper.

Conflicts of Interest

The authors declare no conflict of interest.

Appendix A

Figure A1. An example of a riparian pocket of native trees that reached the threshold of 0.05 ha and was thus digitised for the study. They comprise species favourable to forest birds, geckos and insects (totara, matai, kahikatea, cabbage tree-Cordyline australis, five finger-Pseudopanax arboreus, lancewood-Pseudopanax crassifolius, karamu-Coprosma robusta, manatu-Plagianthus regius, houhere-Hoheria angustifolia, kohuhu-Pittosporum tenuifolium, kowhai-Sophora microphylla).
Sustainability 13 06732 g0a1
Figure A2. Workflow depicting the expanded BEETLE, adopted in this research in LUCI.
Sustainability 13 06732 g0a2aSustainability 13 06732 g0a2b
Table A1. The landscape permeability score for forest birds based on different land cover types.
Matrix CharacteristicsLand Cover TypesMovement Cost-Low Cost Indicates High Permeability
High permeabilityTall forest dominated by indigenous conifer, broadleaved, or beech speciesIndigenous forestCost = 1
Medium permeabilityOpen, mainly grassed or sparsely treed, amenity, utility, and recreation areas
Gardens or pockets of trees from residential houses, golf resorts, hospitals and schools
Urban parkland/open spaceCost = 4
Low permeabilityArtificial surfaces associated with transport
Commercial, industrial and roads
Transport infrastructure
Built-up area
Cost = 10
Table A2. The landscape permeability score for water birds based on different land cover types.
Matrix CharacteristicsLand Cover TypesMovement Cost-Low Cost Indicates High Permeability
High permeabilityEssentially permanent, open, freshwater without emerging vegetation including artificial featuresLake or pondCost = 1
Flowing open freshwater, generally more than 30 m wide and without emerging vegetationRiver
Herbaceous wetland communities occurring in freshwater habitats where the water table is above or just below the substrate surface for most of the yearHerbaceous Freshwater vegetation
Herbaceous wetland communities occurring in saline habitats subject to tidal inundation or saltwater intrusionHerbaceous saline vegetation
Medium permeabilityExotic sward grassland and indigenous short tussock grassland of poor pastoral quality reflecting lower soil fertility and extensive grazing management or non-agricultural useLow producing grasslandCost = 3
Exotic sward grassland of good pastoral quality and vigour reflecting relatively high soil fertility and intensive grazing managementHigh producing exotic grassland
Low permeabilityArtificial surfaces associated with transportTransport infrastructureCost = 10
Commercial, industrial, and roadsBuilt-up area

References

  1. Norbert, N. Differences in the standards living in rural and urban areas. Annu. Univ. Oradea 2020, 29, 79. [Google Scholar]
  2. Foley, J.A.; Ramankutty, N.; Brauman, K.A.; Cassidy, E.S.; Gerber, J.S.; Johnston, M.; Mueller, N.D.; Connell, C.O.; Ray, D.K.; West, P.C.; et al. Solutions for a cultivated planet. Nature 2011, 478, 337–342. [Google Scholar] [CrossRef] [PubMed] [Green Version]
  3. Fahrig, L. Effects of habitat fragmentation on biodiversity. Annu. Rev. Ecol. Evol. Syst. 2003, 34, 487–515. [Google Scholar] [CrossRef] [Green Version]
  4. Given, D.R.; Meurk, C.D. Biodiversity of the urban environment: The importance of indigenous species and the role urban environments can play in their preservation. In Urban Biodiversity and Ecology as a Basis for Holistic Planning and Design, Proceedings of a Workshop held at the Lincoln University, Canterbury, New Zealand, 28–29 October 2000; Wickliffe Press: Dunedin, New Zealand, 2020. [Google Scholar]
  5. Mimet, A.; Kerbiriou, C.; Simon, L.; Julien, J.-F.; Raymond, R. Contribution of private gardens to habitat availability, connectivity and conservation of the common pipistrelle in Paris. Landsc. Urban Plan. 2020, 193, 103671. [Google Scholar] [CrossRef]
  6. Pellissier, V.; Mimet, A.; Fontaine, C.; Svenning, J.C.; Couvet, D. Relative importance of the land-use composition and intensity for the bird community composition in anthropogenic landscapes. Ecol. Evol. 2017, 7, 10513–10535. [Google Scholar] [CrossRef] [Green Version]
  7. Wu, J. Urban ecology and sustainability: The state-of-the-science and future directions. Landsc. Urban Plan. 2014, 125, 209–221. [Google Scholar] [CrossRef]
  8. Bregman, T.P.; Sekercioglu, C.H.; Tobias, J.A. Global patterns and predictors of bird species responses to forest fragmentation: Implications for ecosystem function and conservation. Biol. Conserv. 2014, 169, 372–383. [Google Scholar] [CrossRef]
  9. Fagan, W.F.; Calabrese, J.M. Quantifying connectivity: Balancing metric performance with data requirements. Connect. Conserv. 2006, 297–317. [Google Scholar] [CrossRef]
  10. Tischendorf, L.; Fahrig, L. On the usage and measurement of landscape connectivity. Oikos 2000, 90, 7–19. [Google Scholar] [CrossRef] [Green Version]
  11. Watts, K.; Eycott, A.E.; Handley, P.; Ray, D.; Humphrey, J.W.; Quine, C.P. Targeting and evaluating biodiversity conservation action within fragmented landscapes: An approach based on generic focal species and least-cost networks. Landsc. Ecol. 2010, 25, 1305–1318. [Google Scholar] [CrossRef]
  12. Xu, X.; Xie, Y.; Qi, K.; Luo, Z.; Wang, X. Detecting the response of bird communities and biodiversity to habitat loss and fragmentation due to urbanization. Sci. Total Environ. 2018, 624, 1561–1576. [Google Scholar] [CrossRef] [PubMed]
  13. Mayani-Parás, F.; Botello, F.; Castañeda, S.; Munguía-Carrara, M.; Sánchez-Cordero, V. Cumulative habitat loss increases conservation threats on endemic species of terrestrial vertebrates in Mexico. Biol. Conserv. 2021, 253, 108864. [Google Scholar] [CrossRef]
  14. Møller, A.P.; Diaz, M.; Flensted-Jensen, E.; Grim, T.; Ibáñez-Álamo, J.D.; Jokimäki, J.; Mänd, R.; Markó, G.; Tryjanowski, P. High urban population density of birds reflects their timing of urbanization. Oecologia 2012, 170, 867–875. [Google Scholar] [CrossRef] [PubMed]
  15. Steffen, W.; Richardson, K.; Rockström, J.; Cornell, S.E.; Fetzer, I.; Bennett, E.M.; Biggs, R.; Carpenter, S.R.; De Vries, W.; De Wit, C.A.; et al. Planetary boundaries: Guiding human development on a changing planet. Science 2015, 347. [Google Scholar] [CrossRef] [Green Version]
  16. O’Donnell, E.C.; Thorne, C.R.; Yeakley, J.A.; Chan, F.K.S. Sustainable flood risk and stormwater management in blue-green cities; an interdisciplinary case study in Portland, Oregon. JAWRA J. Am. Water Resour. Assoc. 2020, 56, 757–775. [Google Scholar] [CrossRef]
  17. Pauleit, S.; Ambrose-Oji, B.; Andersson, E.; Anton, B.; Buijs, A.; Haase, D.; Elands, B.; Elands, B.; Hansen, R.; Kronenberg, J.; et al. Advancing urban green infrastructure in Europe: Outcomes and reflections from the GREEN SURGE project. Urban For. Urban Green. 2019, 40, 4–16. [Google Scholar] [CrossRef]
  18. Ghofrani, Z.; Sposito, V.; Faggian, R. A comprehensive review of blue-green infrastructure concepts. Int. J. Environ. Sustain. 2017, 6. [Google Scholar] [CrossRef]
  19. Ignatieva, M.; Meurk, C.D.; Van Roon, M.; Simcock, R.; Stewart, G.H. How to Put Nature into Our Neighbourhoods: Application of Low Impact Urban Design and Development (LIUDD) Principles, with a Biodiversity Focus, for New Zealand Developers and Homeowners; Manaaki Whenua Press, Landcare Research: Lincoln, New Zealand, 2008. [Google Scholar]
  20. Cohen-Shacham, E.; Walters, G.; Janzen, C.; Maginnis, S. Nature-Based Solutions to Address Global Societal Challenges; LUCN: Gland, Switzerland, 2016; p. 97. [Google Scholar] [CrossRef] [Green Version]
  21. Colls, A.; Ash, N.; Ikkala, N. Ecosystem-Based Adaptation: A Natural Response to Climate Change; IUCN: Gland, Switzerland, 2009; Volume 21. [Google Scholar]
  22. Federal Emergency Management Agency. Building Community Resilience with Nature-Based Solutions: A Guide for Local Communities; Federal Emergency Management Agency: Washington, DC, USA, 2020. [Google Scholar]
  23. Stefanakis, A.I. The role of constructed wetlands as green infrastructure for sustainable urban water management. Sustainability 2019, 11, 6981. [Google Scholar] [CrossRef] [Green Version]
  24. Washington Department of Ecology. Floodplains by Design: Report to the Legislature; Publication No. 19-06-004; Washington Department of Ecology: Washington, DC, USA, 2019. [Google Scholar]
  25. Davies, R. Landscapes for Life (Stage 2)—An Investigation of Opportunities for Aesthetic Improvement and Biodiversity Enhancement for Living Roofs in New Zealand; Unitec Institute of Technology: Auckland, New Zealand, 2012. [Google Scholar]
  26. Francis, R.A. Wall ecology: A frontier for urban biodiversity and ecological engineering. Prog. Phys. Geogr. 2011, 35, 43–63. [Google Scholar] [CrossRef]
  27. Francis, R.A.; Lorimer, J. Urban reconciliation ecology: The potential of living roofs and walls. J. Environ. Manag. 2011, 92, 1429–1437. [Google Scholar] [CrossRef]
  28. Murray, C.G.; Kasel, S.; Loyn, R.H.; Hepworth, G.; Hamilton, A.J. Waterbird use of artificial wetlands in an Australian urban landscape. Hydrobiologia 2013, 716, 131–146. [Google Scholar] [CrossRef]
  29. Christchurch City Council. Ōtākaro/Avon River Stormwater Management Plan; Christchurch City Council: Christchurch, New Zealand, 2015. [Google Scholar]
  30. Dymond, J.R. Ecosystem Services in New Zealand: Conditions and Trends; Manaaki Whenua Press, Landcare Research: Lincoln, New Zealand, 2013. [Google Scholar]
  31. Wei, Q. Vegetation Change and Native Forest Restoration in Urban Environments: Management Options for Post-Earthquake Christchurch. Ph.D. Thesis, Lincoln University, Canterbury, New Zealand, 2020. [Google Scholar]
  32. Regenerate Christchurch. The Ōtākaro/Avon River Corridor Regeneration Plan; Regenerate Christchurch: Christchurch, New Zealand, 2019. [Google Scholar]
  33. Watts, K.; Humphrey, J.W.; Griffiths, M.; Quine, C.; Ray, D. Evaluating biodiversity in fragmented landscapes: Principles. Inf. Note For. Comm. 2005, 73, 8. [Google Scholar]
  34. Ranius, T.; Johansson, V.; Fahrig, L. A comparison of patch connectivity measures using data on invertebrates in hollow oaks. Ecography 2010, 33, 971–978. [Google Scholar] [CrossRef]
  35. Chen, C.; Meurk, C.D.; Ignatieva, M.; Stewart, G.H.; Wu, S. Identifying and evaluating functional connectivity for building urban ecological networks. Acta Ecol. Sin. 2015, 35, 18–35. [Google Scholar] [CrossRef] [Green Version]
  36. Adriaensen, F.; Chardon, J.; De Blust, G.; Swinnen, E.; Villalba, S.; Gulinck, H.; Matthysen, E. The application of ‘least-cost’ modelling as a functional landscape model. Landsc. Urban Plan. 2003, 64, 233–247. [Google Scholar] [CrossRef]
  37. Balbi, M.; Petit, E.J.; Croci, S.; Nabucet, J.; Georges, R.; Madec, L.; Ernoult, A. Ecological relevance of least cost path analysis: An easy implementation method for landscape urban planning. J. Environ. Manag. 2019, 244, 61–68. [Google Scholar] [CrossRef]
  38. Piemontese, M.; Onal, M.; Xiong, J.; Wang, Y.; Almeida, M.; Thostenson, J.D.; Weinstein, R.S.; Manolagas, S.C.; O’Brien, C.A. Suppression of autophagy in osteocytes does not modify the adverse effects of glucocorticoids on cortical bone. Bone 2015, 75, 18–26. [Google Scholar] [CrossRef] [PubMed] [Green Version]
  39. Jackson, B.; Pagella, T.; Sinclair, F.; Orellana, B.; Henshaw, A.; Reynolds, B.; Mcintyre, N.; Wheater, H.; Eycott, A. Polyscape: A GIS mapping framework providing efficient and spatially explicit landscape-scale valuation of multiple ecosystem services. Landsc. Urban Plan. 2013, 112, 74–88. [Google Scholar] [CrossRef]
  40. Emmett, B.E.; The GMEP Team. Glastir Monitoring & Evaluation Programme; Final Report to Welsh Government—Executive Summary (Contract Reference: C147/2010/11); NERC/Centre for Ecology & Hydrology (CEH Projects: NEC04780/NEC05371/NEC05782): Wallingford, UK, 2017. [Google Scholar]
  41. McGann, R. The Climate of Christchurch; Ministry of Transport, New Zealand Meteorological Service: Wellington, New Zealand, 1983; Volume 167.
  42. Potter, S.H.; Becker, J.S.; Johnston, D.M.; Rossiter, K.P. An overview of the impacts of the 2010–2011 Canterbury earthquakes. Int. J. Disaster Risk Reduct. 2015, 14, 6–14. [Google Scholar] [CrossRef] [Green Version]
  43. Clarkson, B.; Bryan, C.; Clarkson, F. Reconstructing hamilton’s indigenous ecosystems: The waiwhakareke natural heritage park. City Green 2012, 4, 60–67. [Google Scholar] [CrossRef]
  44. Sullivan, J.J.; Meurk, C.; Whaley, K.J.; Simcock, R. Restoring native ecosystems in urban Auckland: Urban soils, isolation, and weeds as impediments to forest establishment. N. Z. J. Ecol. 2009, 33, 60–71. [Google Scholar]
  45. Stewart, G.H.; Ignatieva, M.E.; Meurk, C.D.; Earl, R.D. The re-emergence of indigenous forest in an urban environment, Christchurch, New Zealand. Urban For. Urban Green. 2004, 2, 149–158. [Google Scholar] [CrossRef]
  46. Morgenroth, J.A. Tree Canopy Cover in Christchurch, New Zealand; Report prepared for the Christchurch City Council; Christchurch City Council: Christchurch, New Zealand, 2017. [Google Scholar]
  47. Land Information New Zealand. Canterbury—Christchurch and Ashley River LiDAR 1m DEM (2018–2019). 2020. Available online: https://data.linz.govt.nz/layer/104497-canterbury-christchurch-and-ashley-river-lidar-1m-dem-2018-2019/ (accessed on 20 December 2020).
  48. Landcare Research New Zealand. LCDB v5.0—Land Cover Database Version 5.0, Mainland New Zealand. 2020. Available online: https://lris.scinfo.org.nz/layer/104400-lcdb-v50-land-cover-database-version-50-mainland-new-zealand/ (accessed on 15 February 2021).
  49. Meurk, C.D.; Hall, G.M. Options for enhancing forest biodiversity across New Zealand’s managed landscapes based on ecosystem modelling and spatial design. N. Z. J. Ecol. 2006, 30, 131–146. [Google Scholar]
  50. Daglish, L. City Pigeons: Kererū (Hemiphaga novaeseelandiae) in the Urban Dunedin Environment: Abundance, Habitat Selection and Rehabilitation Outcomes. Ph.D. Thesis, University of Otago, Dunedin, New Zealand, 2005. [Google Scholar]
  51. Wotton, D.M.; Drake, D.R.; Powlesland, R.G.; Ladley, J.J. The role of lizards as seed dispersers in New Zealand. J. R. Soc. N. Z. 2016, 46, 40–65. [Google Scholar] [CrossRef]
  52. Walker, S.; Cieraad, E.; Barringer, J. The Threatened Environment Classification for New Zealand 2012: A Guide for Users; Report LC2184; Landcare Research: Dunedin, New Zealand, 2015. [Google Scholar]
  53. Clarkson, B.; Kirby, C.; Wallace, K. Restoration Targets for Biodiversity Depleted Environments in New Zealand; Environmental Research Institute Te Pūtahi Rangahau Taiao, The University of Waikato: Hamilton, New Zealand, 2018. [Google Scholar]
  54. Schotborgh, H.M. An Analysis of Home Ranges, Movements, Foods, and Breeding of Kereru (Hemiphaga novaeseelandiae) in a Rural-Urban Landscape on Banks Peninsula, New Zealand; Lincoln University: Canterbury, New Zealand, 2005. [Google Scholar]
  55. Wilson, D.J.; Mulvey, R.L.; Clarke, D.A.; Reardon, J.T. Assessing and comparing population densities and indices of skinks under three predator management regimes. N. Z. J. Ecol. 2017, 41, 84–97. [Google Scholar] [CrossRef] [Green Version]
  56. Woolley, C.K.; Hartley, S.; Hitchmough, R.A.; Innes, J.G.; Van Heezik, Y.; Wilson, D.J.; Nelson, N.J. Reviewing the past, present and potential lizard faunas of New Zealand cities. Landsc. Urban Plan. 2019, 192, 103647. [Google Scholar] [CrossRef]
  57. Riccarton Bush TRUST. Annual Report 2016. Available online: https://riccartonhouse.co.nz/wp-content/uploads/2017/04/Riccarton-Bush-Trust-RBT-Annual-Report-2016-Signed-with-Audit-Report.pdf (accessed on 3 March 2021).
  58. Meurk, C.D. Evergreen Broadleaved Forests of New Zealand and Their Bioclimatic Definition; Box, E.O., Peet, R.K., Masuzawa, T., Yamada, I., Eds.; Landcare Research New Zealand Inc.: Lincoln, New Zealand, 1995; pp. 151–197. [Google Scholar]
Figure 1. The Ōtākaro/Avon River catchment (yellow line) and its location in Christchurch, on the South Island of New Zealand (inset). The adjacent Styx River catchment to the north and Heathcote River catchment to the south of the Avon River and bounded by the Port Hills are also considered in this study.
Sustainability 13 06732 g001
Figure 2. The workflow applied in the current study.
Sustainability 13 06732 g002
Figure 3. The updated land use map LCDB5.0 with digitised pockets of native trees (dark green colour) in the Ōtākaro/Avon River catchment.
Sustainability 13 06732 g003
Figure 4. Comparative forest patch size/shape patterns (dimensions rounded) used in scenario modelling (after [49]); a narrower buffer (in 1 ha patch) is achieved through denser edge, hedge planting; groves may comprise ca. 9–25 large native trees with subcanopy trees between.
Sustainability 13 06732 g004
Figure 5. The optimised patchwork model, configurations, and networks integrating people, nature, and landscape [19].
Sustainability 13 06732 g005
Figure 6. Two land use scenarios are used initially in the case study. (a) Scenario 1 for existing land use in 2018 modified from LCDB5.0 with updated roads; (b) Scenario 2 with proposed land cover for the OARC derived from the Regeneration Plan.
Sustainability 13 06732 g006
Figure 7. Scenario 1 for the whole residential city with the minimum forest patch size of 0.05 ha and different effective dispersal distances by the kereru for large native fruit. (a) Dispersal distance of 2.5 km; (b) dispersal distance of 5 km.
Sustainability 13 06732 g007
Figure 8. Scenario 2, projected haloes with minimum patch size of 0.05 ha and different dispersal distances for the kereru. (a) Dispersal distance of 2.5 km; (b) dispersal distance of 5 km.
Sustainability 13 06732 g008
Figure 9. Comparison of the changes in the proportion of habitat patch categories with different dispersal distances for the kereru. (a) Dispersal distance of 2.5 km; (b) dispersal distance of 5 km for the two investigated scenarios.
Sustainability 13 06732 g009
Figure 10. Scenario 1 with different habitat sizes applied for the dispersal distance of 2.5 km for the kereru. (a) Minimum habitat size 0.05 ha; (b) minimum habitat size 0.1 ha; (c) minimum habitat size 1 ha; (d) minimum habitat size 2 ha.
Sustainability 13 06732 g010
Figure 11. Scenario 1 with the minimum wetland patch of 0.05 ha and different dispersal distances for the paradise shelduck. (a) Dispersal distance of 2.5 km; (b) dispersal distance of 5 km.
Sustainability 13 06732 g011
Figure 12. Scenario 2, projected haloes with the minimum wetland/riparian patch size of 0.05 ha and different dispersal distances for the paradise shelduck. (a) Dispersal distance of 2.5 km; (b) dispersal distance of 5 km.
Sustainability 13 06732 g012
Figure 13. Comparison of the changes in the proportion of habitat patch categories with different dispersal distances for the paradise shelduck. (a) Dispersal distance of 2.5 km; (b) dispersal distance of 5 km for the two investigated scenarios.
Sustainability 13 06732 g013
Figure 14. The potential locations where the generic geckos may live, assuming they can feed and breed in single fruit trees/shrubs (see Figure A1 in Appendix A) and move to others within a 20 m radius, providing they have refuge from predators.
Sustainability 13 06732 g014
Figure 15. A four-dimensional framework for landscape connectivity based on plant needs, wildlife needs, human needs, and the physical environment. Kaitiakitanga is the customary or culturally embedded notion of guardianship or stewardship of the environment exercised by NZ indigenous Maori people or tangata whenua (literally people of the land).
Sustainability 13 06732 g015
Table 1. Input data for LUCI preprocessing.
Input DataDescriptionSource
Digital elevation modelDEM derived from LIDAR (1 m resolution)
sourced from Land Information NZ
[47]
Land coverLand Cover Database v5.0 (LCDB5.0)
sourced from Landcare Research NZ
[48]
Publisher’s Note: MDPI stays neutral with regard to jurisdictional claims in published maps and institutional affiliations.

