The theme of e-commerce has become crucial in the pandemic period, as the fear of infection, the lockdown and the closure of many commercial activities has led consumers to choose this channel of purchase. In this section, the main results obtained from the analyses that focused on both the MCDA and the Likert scale are offered.
3.1. A Comparison among European Countries
A cross-country comparison has the advantage of highlighting certain critical points and characteristics. However, comparing each individual criterion has the limitation of focusing just on a single aspect and the criteria may also conflict with each other. To this end, it is important to adopt a methodology capable of synthesis, as MCDA. The development of these indicators is by no means simple. Aggregating values and weights based on both Eurostat and Google data yields a single indicator, based on the contribution of the six reference categories (
Table 5) considering the DW scenario.
The results obtained show how the distribution of weights determines that the category of financial activities over the Internet (item III as showed in
Table 5) has a considerable influence on comparisons between the various performances of European countries. In fact, it appears that its weight is equal to around 59.80% of the total value, followed by the category Internet purchases—goods or services, with 15.20% (item IV), and the category Internet purchases—origin of sellers, with 11.40% (item V). The other three categories have a weight that varies between 4.00% and 5.40%.
An analysis of the performance of individual countries shows that Denmark leads the way in items VI, V and VI, Hungary in item II and Luxembourg in item I. As far as item III is concerned, it is Latvia that comes first, with 0.539, equal to about 80% of the total value. As mentioned above, it is this item that determines the final results. It follows that the first six countries in the ranking (
Table 6) occupy the first six positions for the item Financial activities over the Internet. It should also be noted that the countries that follow Latvia in the ranking show a significant percentage weight that tends to decrease. This is an expected result, but it is significant to look at the differences that are equal to 27% of the total computation. In fact, we have Estonia with 0.521 (73% of the total), Finland with 0.509 (70%), Sweden with 0.465 (62%), The Netherlands with 0.453 (58%) and Denmark with 0.379 (53%). The same is not verified for Ireland, which is the seventh in this category, with 0.359, but has a weight on the total of 61%.
This analysis at the category level should be conducted at the level of each individual criterion to understand which criteria primarily determine these final values. To this end, item III is composed of four criteria which, as shown in the data, have different weights. The criterion Online purchases (3 months): at least one of the financial activities (I_BFIN_SH1, I_BFIN_IN1, I_BFIN_CR1) has a local weight of 0.727 and a global weight of 0.435. The countries present an order that mirrors that which was presented for the category in general.
However, an alternative method (HEW scenario) could be to consider a weight in which the local weight was always calculated using the same approach as before, while it was assumed that the weights of the six categories were the same (
Table 6). These analyses are useful for evaluating the trends to understand how much impact the weights have on the final indicator. For example, the criterion Online purchases (3 months): at least one of the financial activities (I_BFIN_SH1, I_BFIN_IN1, I_BFIN_CR1) has always a local weight of 0.727, while the global weight is now 0.121 (since the weight of category III is 0.167).
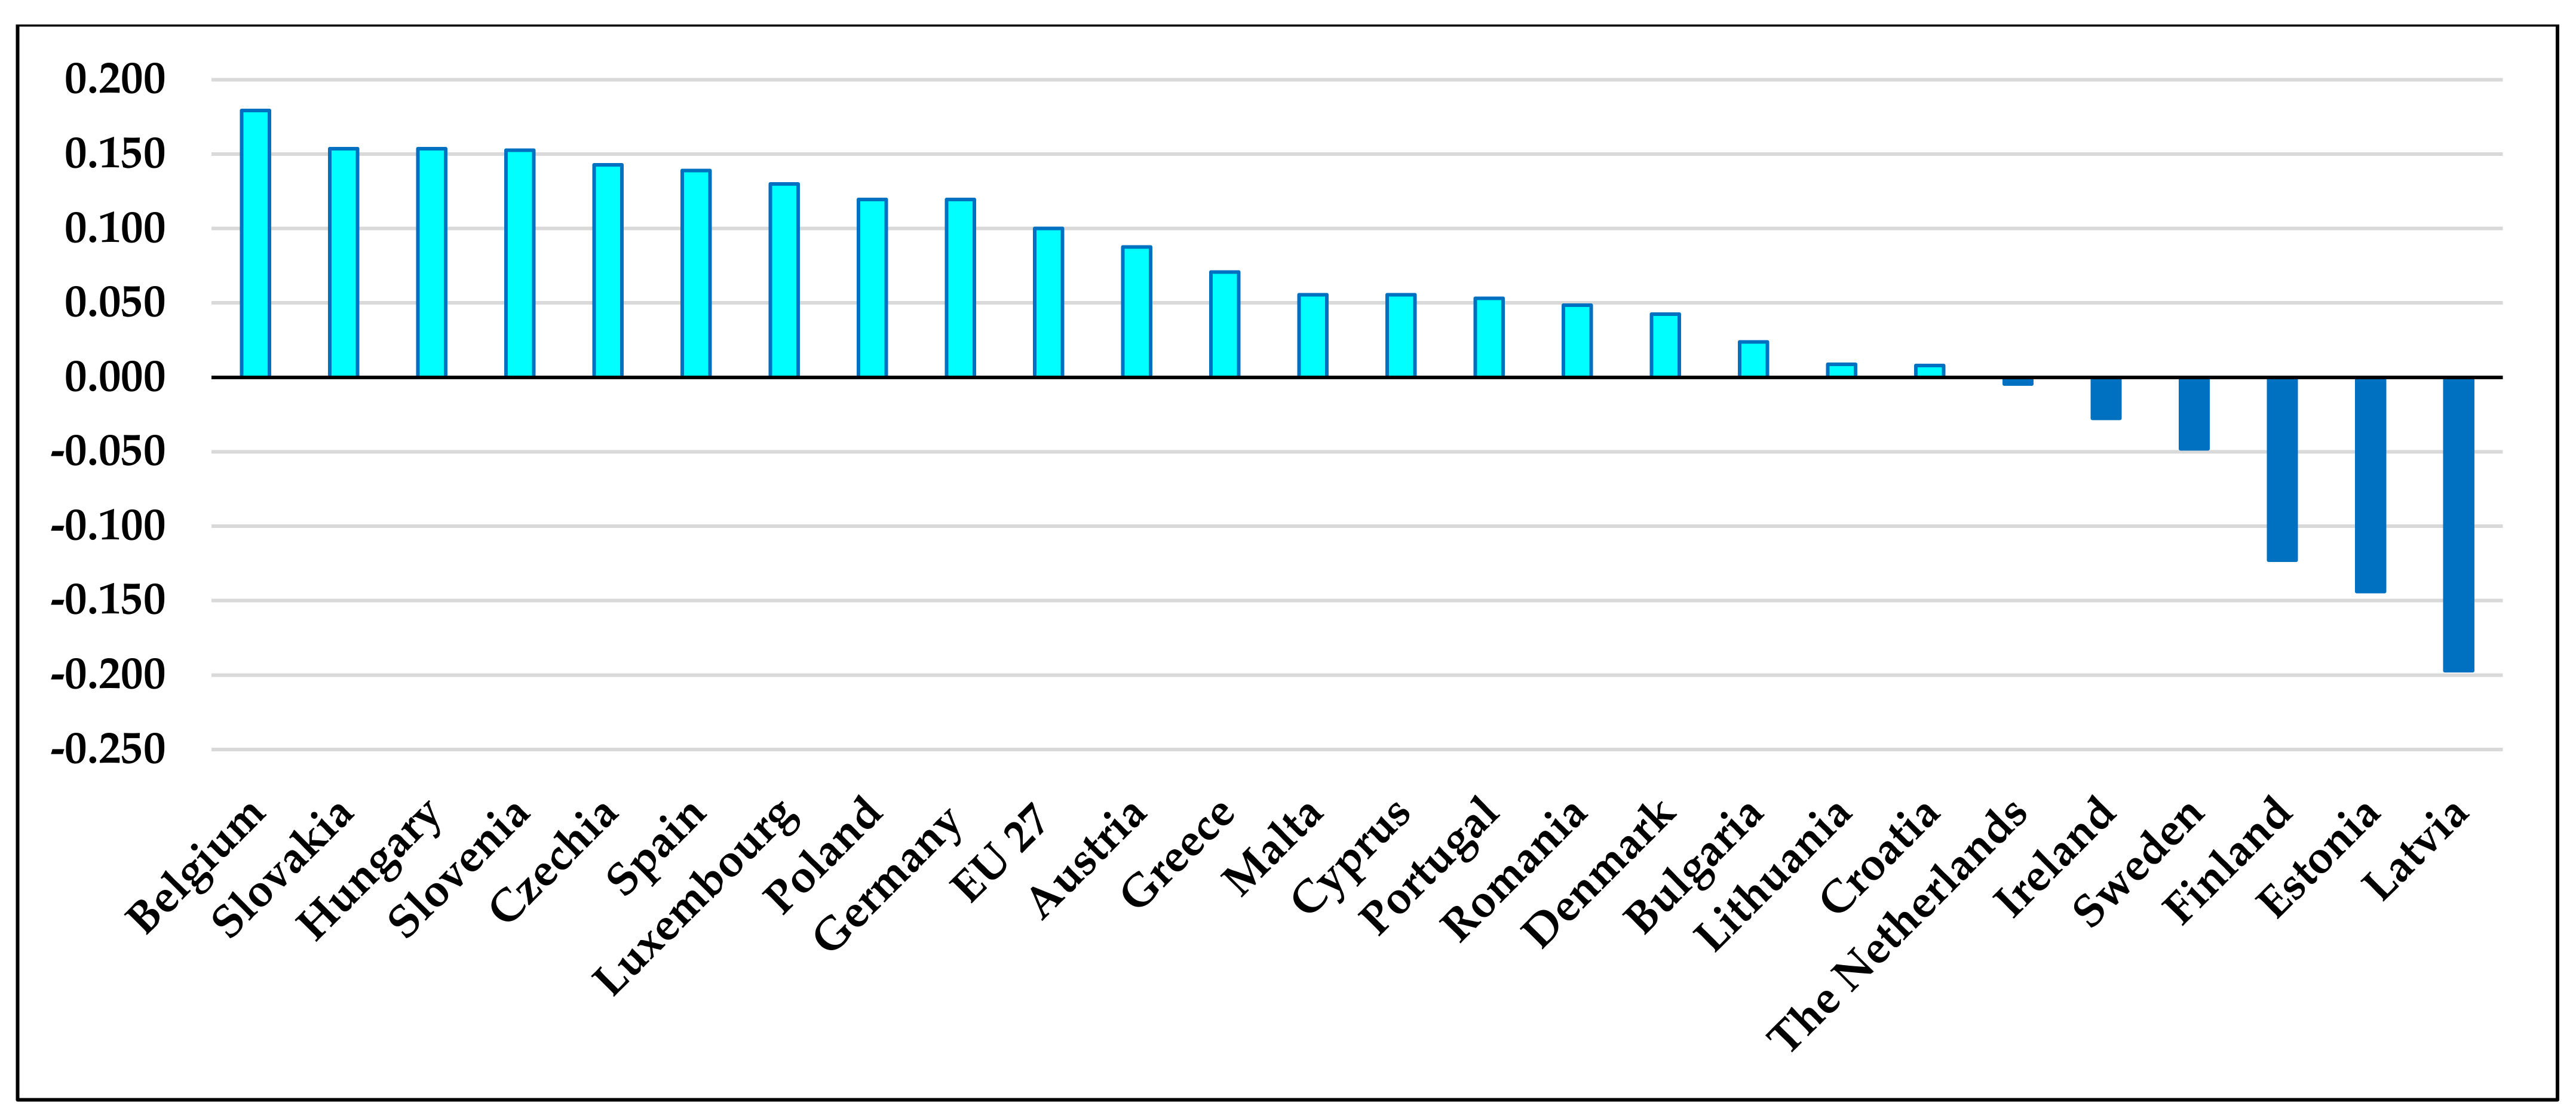
Figure 2 shows the difference between two different (DW and HEW) scenarios.
The results are influenced by the value of the weights, that brings the EU 27 from a total value of 0.413 in the DW scenario to 0.513 in the HEW scenario, recording an increase (HEW-DW scenario) of 0.100. The advantages of the alternative scenarios are to provide results depending on the proposed point of view. In fact, this research had chosen the number of views as the reference method, considering it strategic to evaluate the perspectives of a greater number of stakeholders. Similarly, a panel of experts from specific stakeholder categories could provide valuable information, but the simpler method of equal weights also provided important insights. The HEW model represents an intermediate point between a DW and an EW scenario.
In the DW scenario, the top seven countries are those identified by the most relevant criterion, Online purchases (3 months): at least one of the financial activities (I_BFIN_SH1, I_BFIN_IN1, I_BFIN_CR1), but the order of the ranking changes. This means that this category is relevant but not decisive. In particular, The Netherlands leads with 0.784, followed by Sweden (0.753) and Finland (0.727). At the same time, it is also logical that these seven countries are the ones that present the greatest deviation when considering the HEW scenario, where it is Latvia that has a reduction of 0.197.
The latter is the only country that, when passing from the DW scenario to the HEW scenario, no longer has a value higher than the European average, while Belgium and Spain move in the opposite direction and acquire a value higher than the European average. More precisely, Belgium increases its indicator by 0.179. The Netherlands remains in first place in the alternative scenario, with 0.780, followed by Denmark (0.755) and Sweden (0.705). On the other hand, it can be seen that the lowest ranking is held by Greece, Cyprus, Bulgaria and Romania in both scenarios.
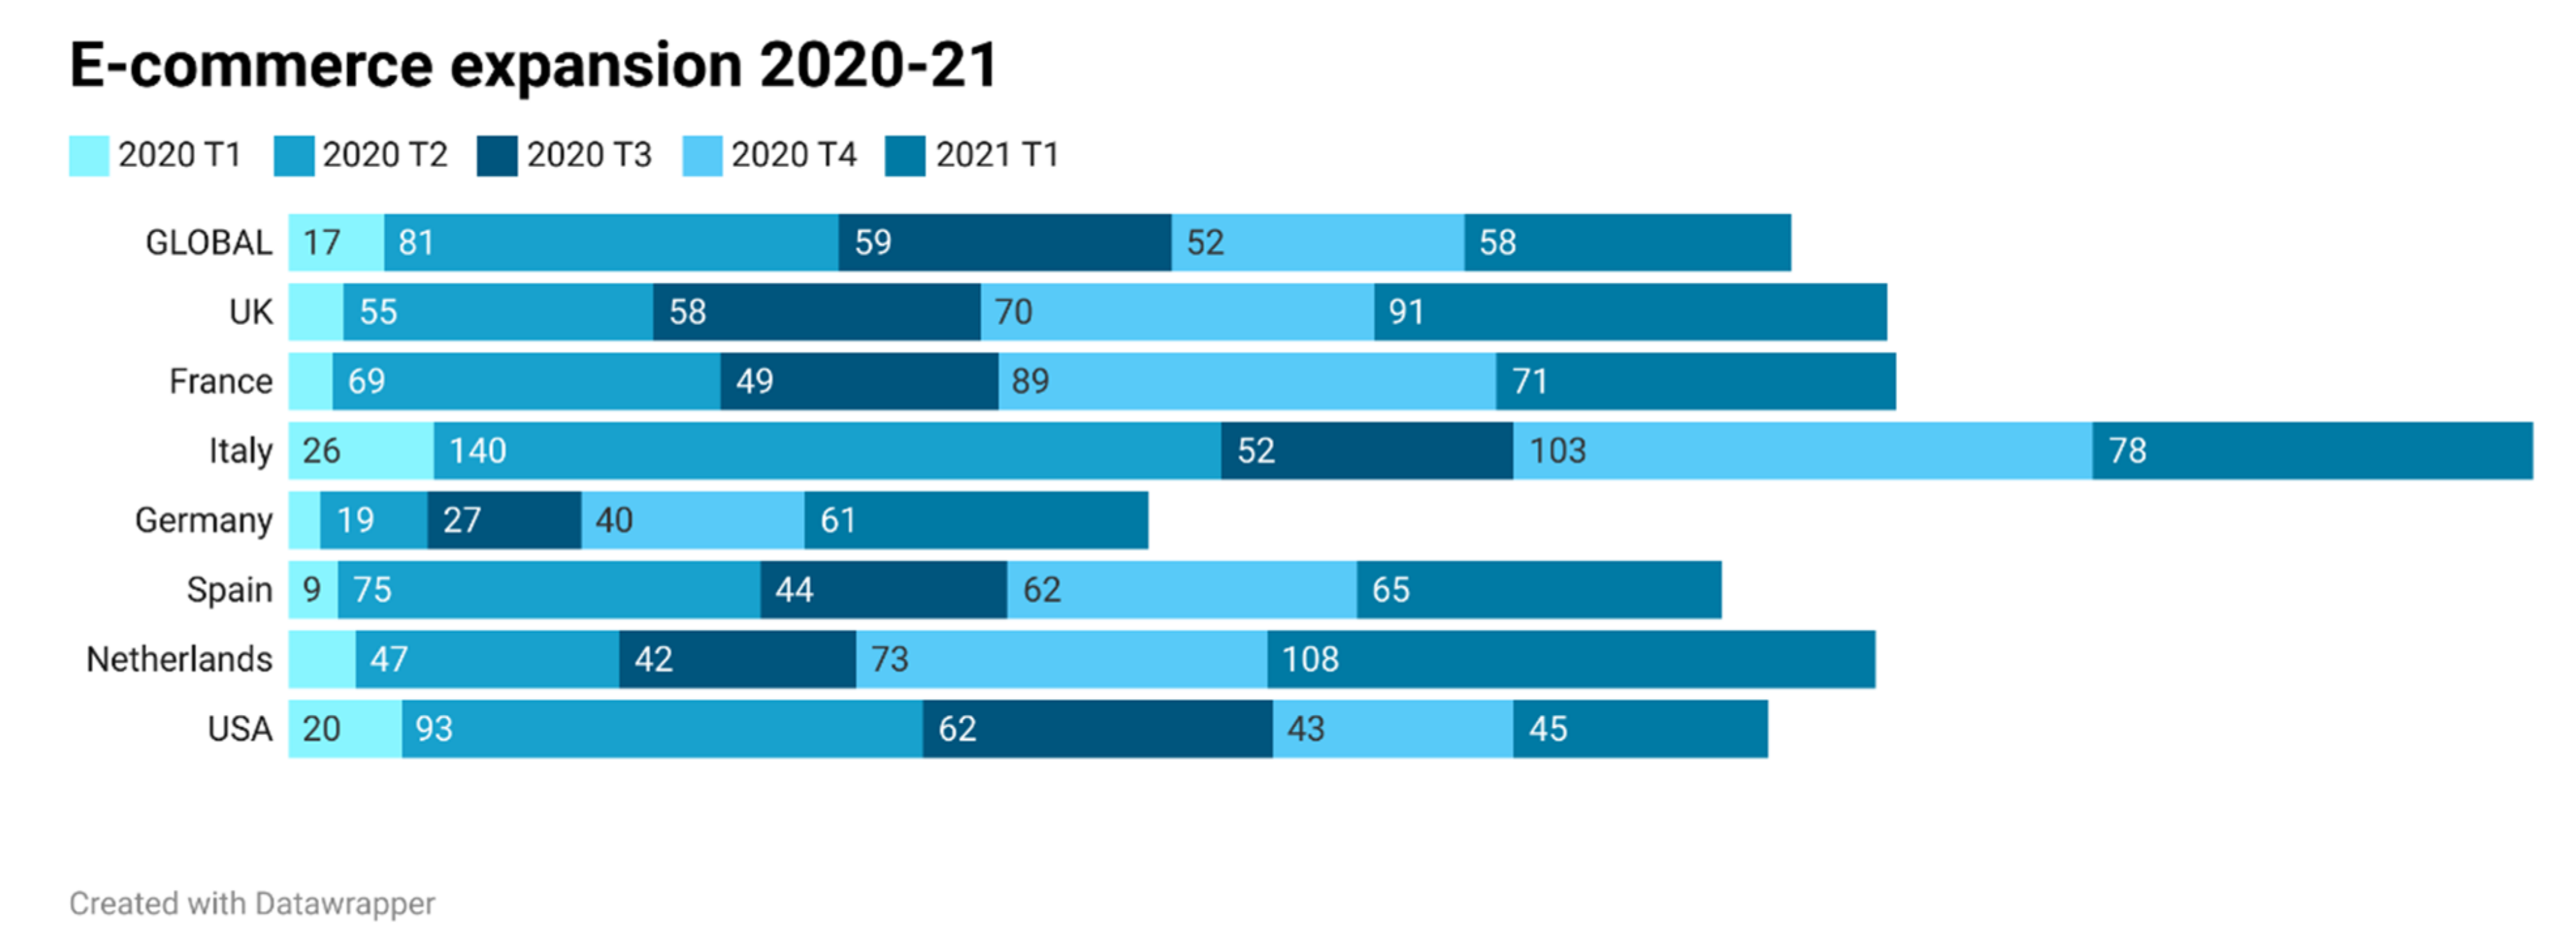
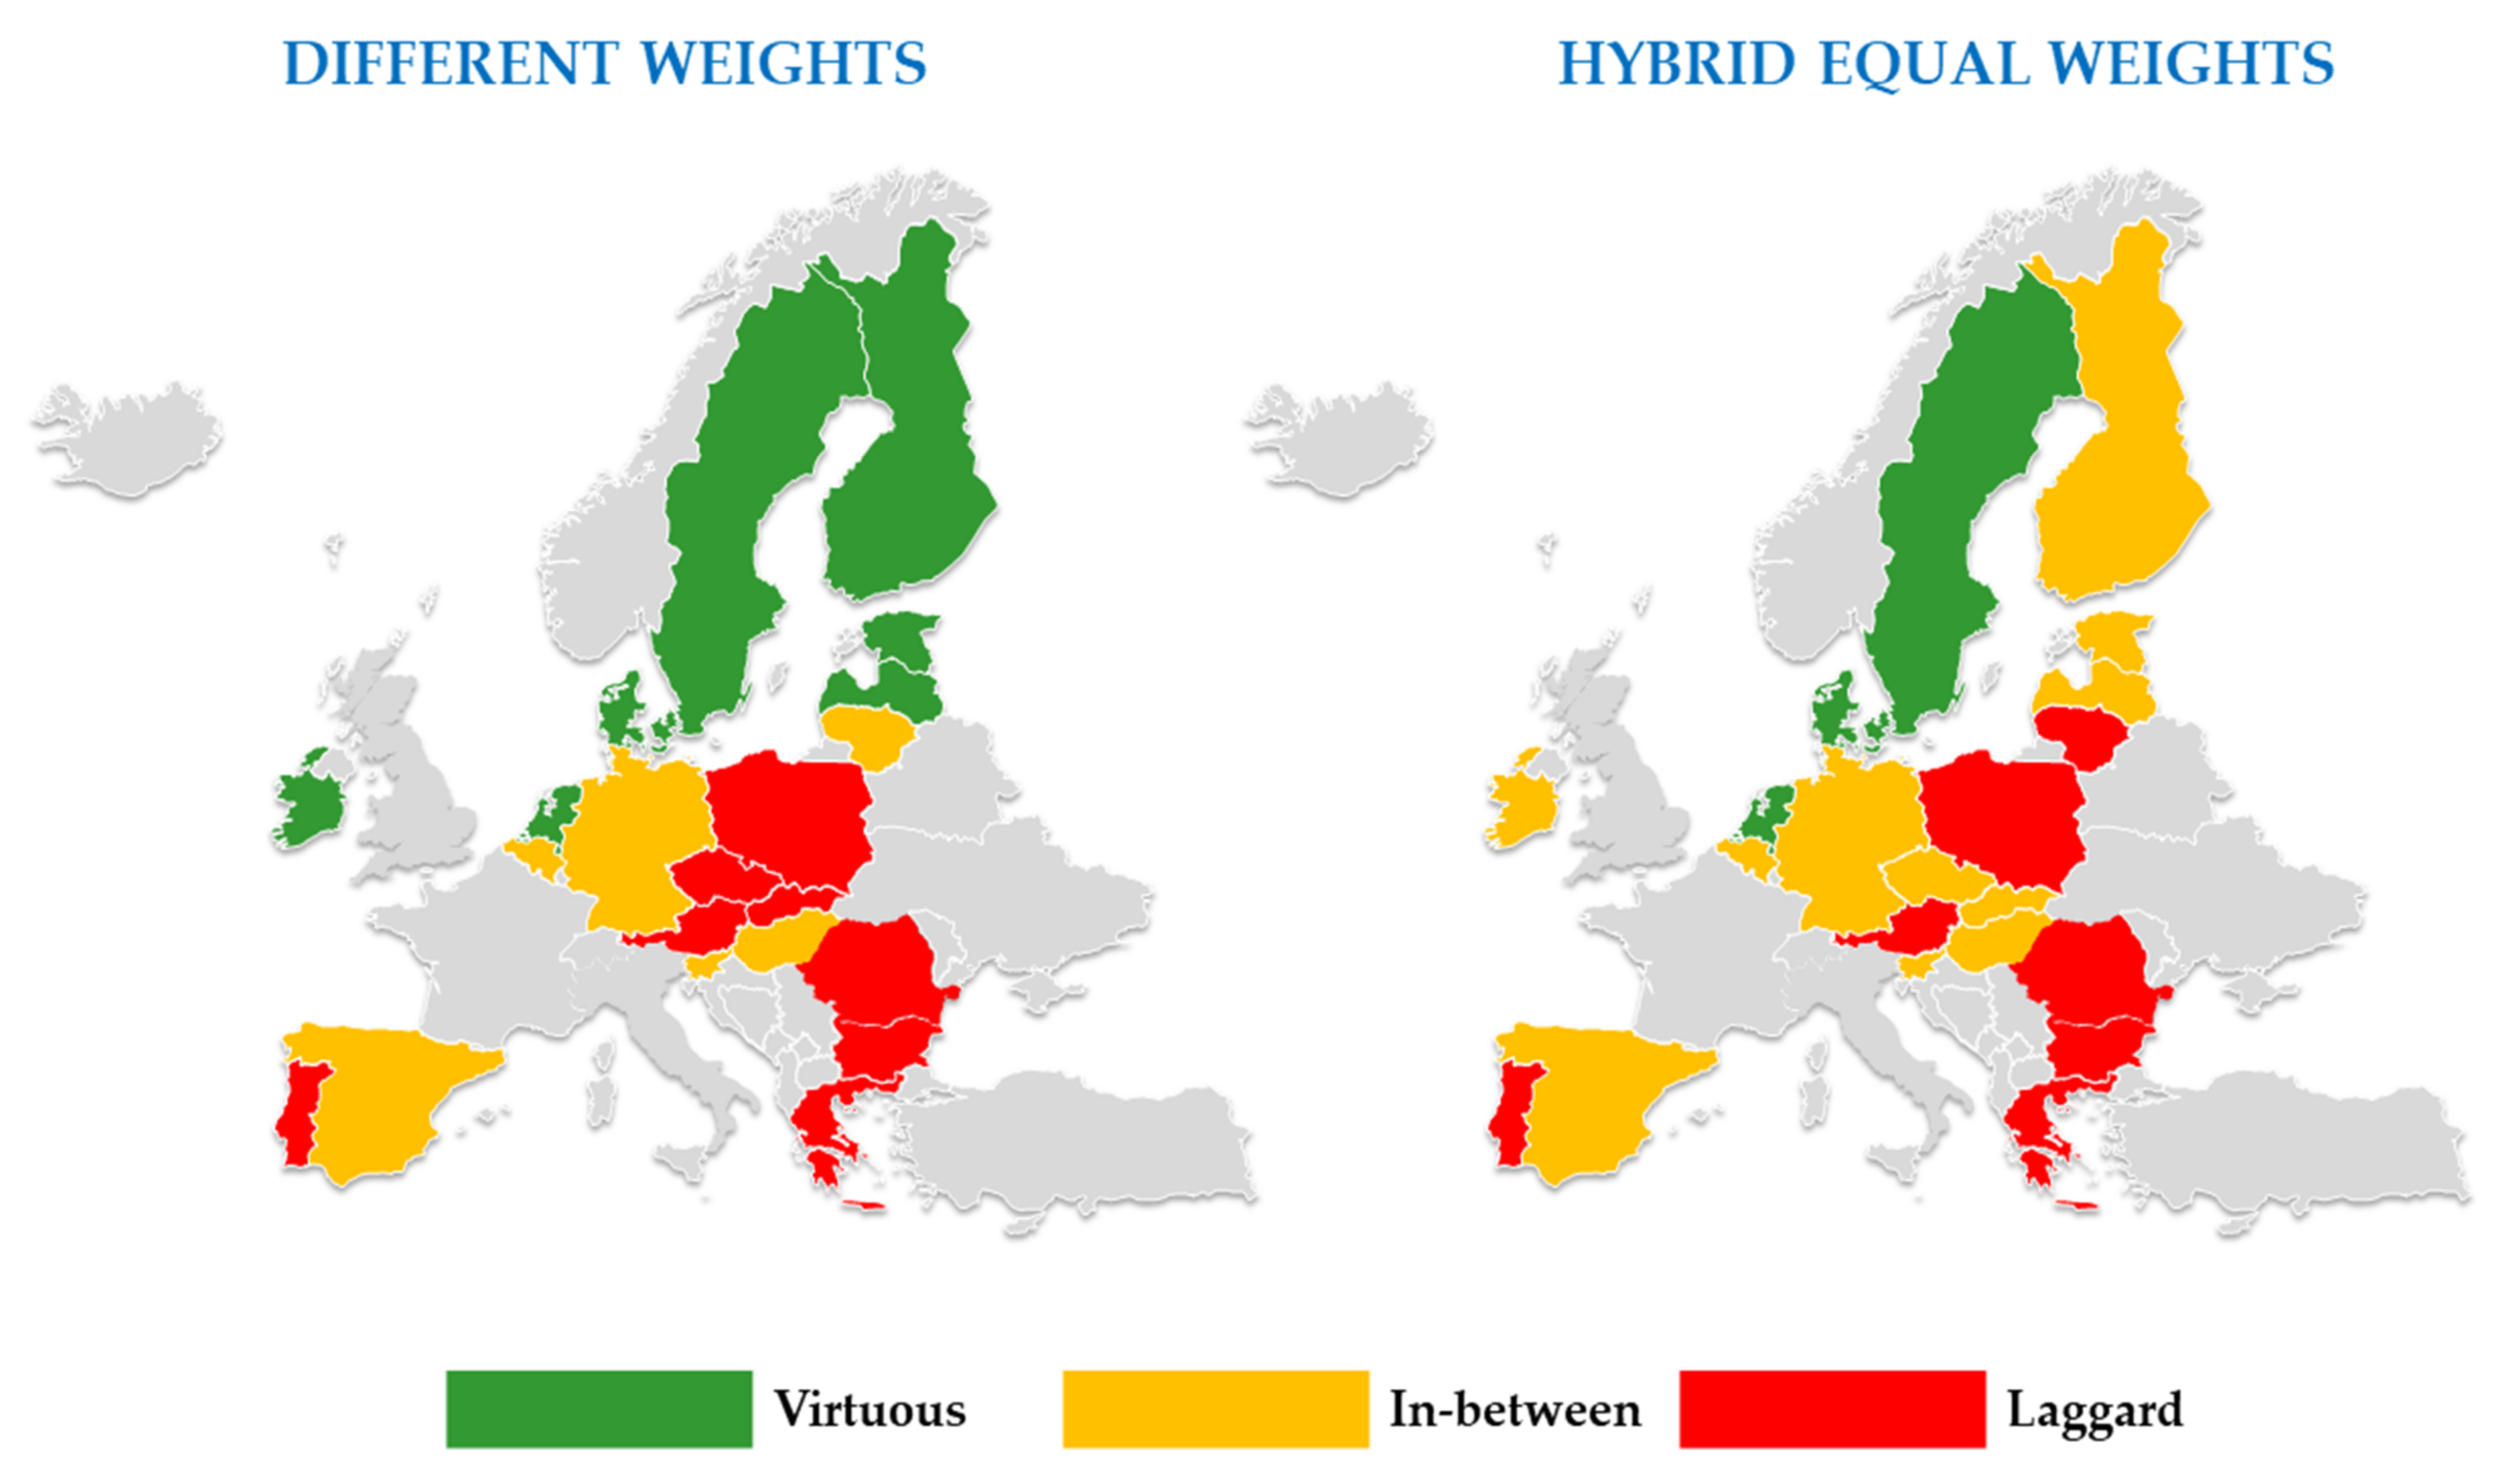
These data should be monitored over time, perhaps integrating them with the specific results of Italy and France to evaluate temporal trends that are always suitable for understanding how a topic evolves. However, compared to a simple subdivision of the European countries above or below the European average, it is possible to use a range to distinguish those countries that have a significantly higher/lower value compared to those that have a more limited value (
Figure 3). The delta considered always depends on the case study being analyzed, and in this case a percentage weight of 20% was chosen. Consequently, those countries that have a value greater than 0.496 in the DW scenario and/or 0.616 in the HEW scenario will be virtuous. On the other hand, those countries that have a value of less than 0.330 in the DW scenario and/or 0.410 in the HEW scenario will be defined as laggard. Finally, other countries will be defined as in-between.
The results show that there are only three countries (The Netherlands, Sweden and Denmark) that are virtuous and seven countries (Austria, Poland, Portugal, Greece, Cyprus, Bulgaria and Romania) that are laggards in both scenarios. These values indicate that, regardless of the weights considered, the target values proposed by Eurostat make it possible to rank the European countries and then to classify them into groups. This summary analysis is necessary in a context where the multiplicity of data is significant, and methodologies are proposed for assigning weights that vary according to the specificity of the topic under analysis.
3.2. Expert Assessment
The panel of experts could be seen as subjective because only certain categories of stakeholders are involved in the analysis and because the individual respondents may not have a global view. However, the Likert scale is an established method in the literature, and the previous section demonstrates precisely that its use, as an evaluation system in surveys, is a generally accepted method. Experts provide their judgment by looking not at a personal perspective but at the overall perspective that has been formed over time through years of experience.
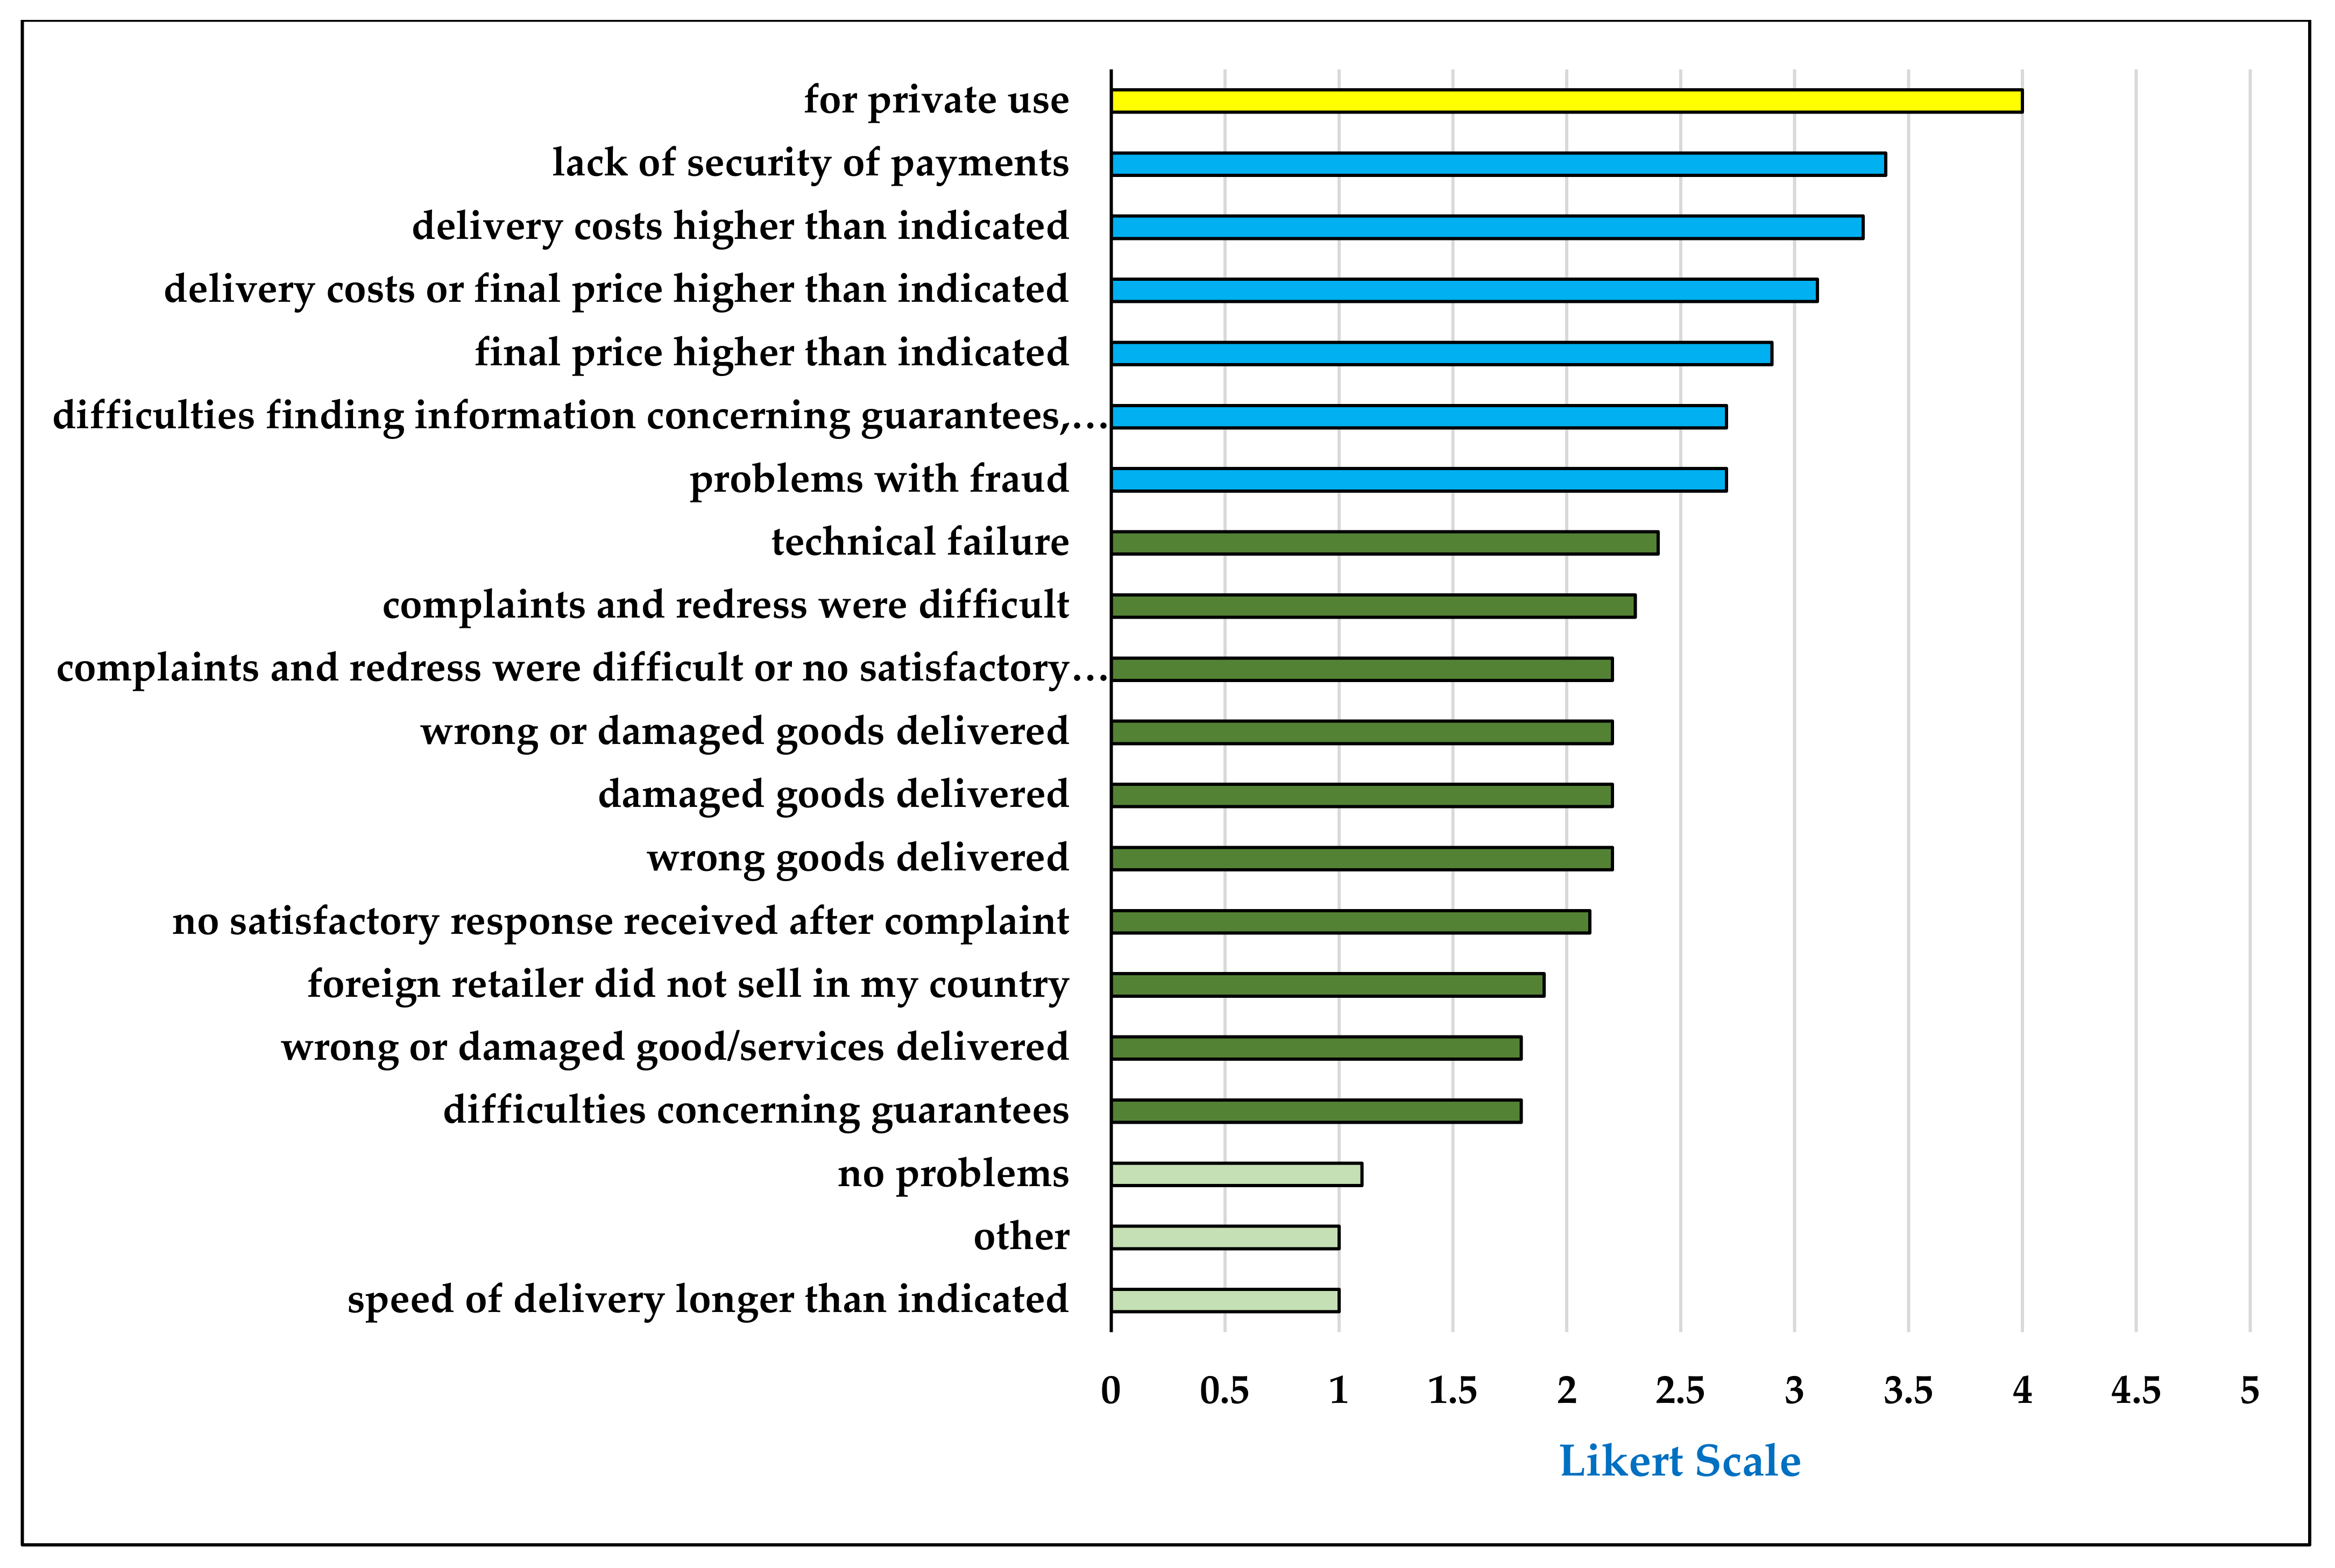
Figure 4 proposes the ranking related to problems encountered during the purchasing phases, while
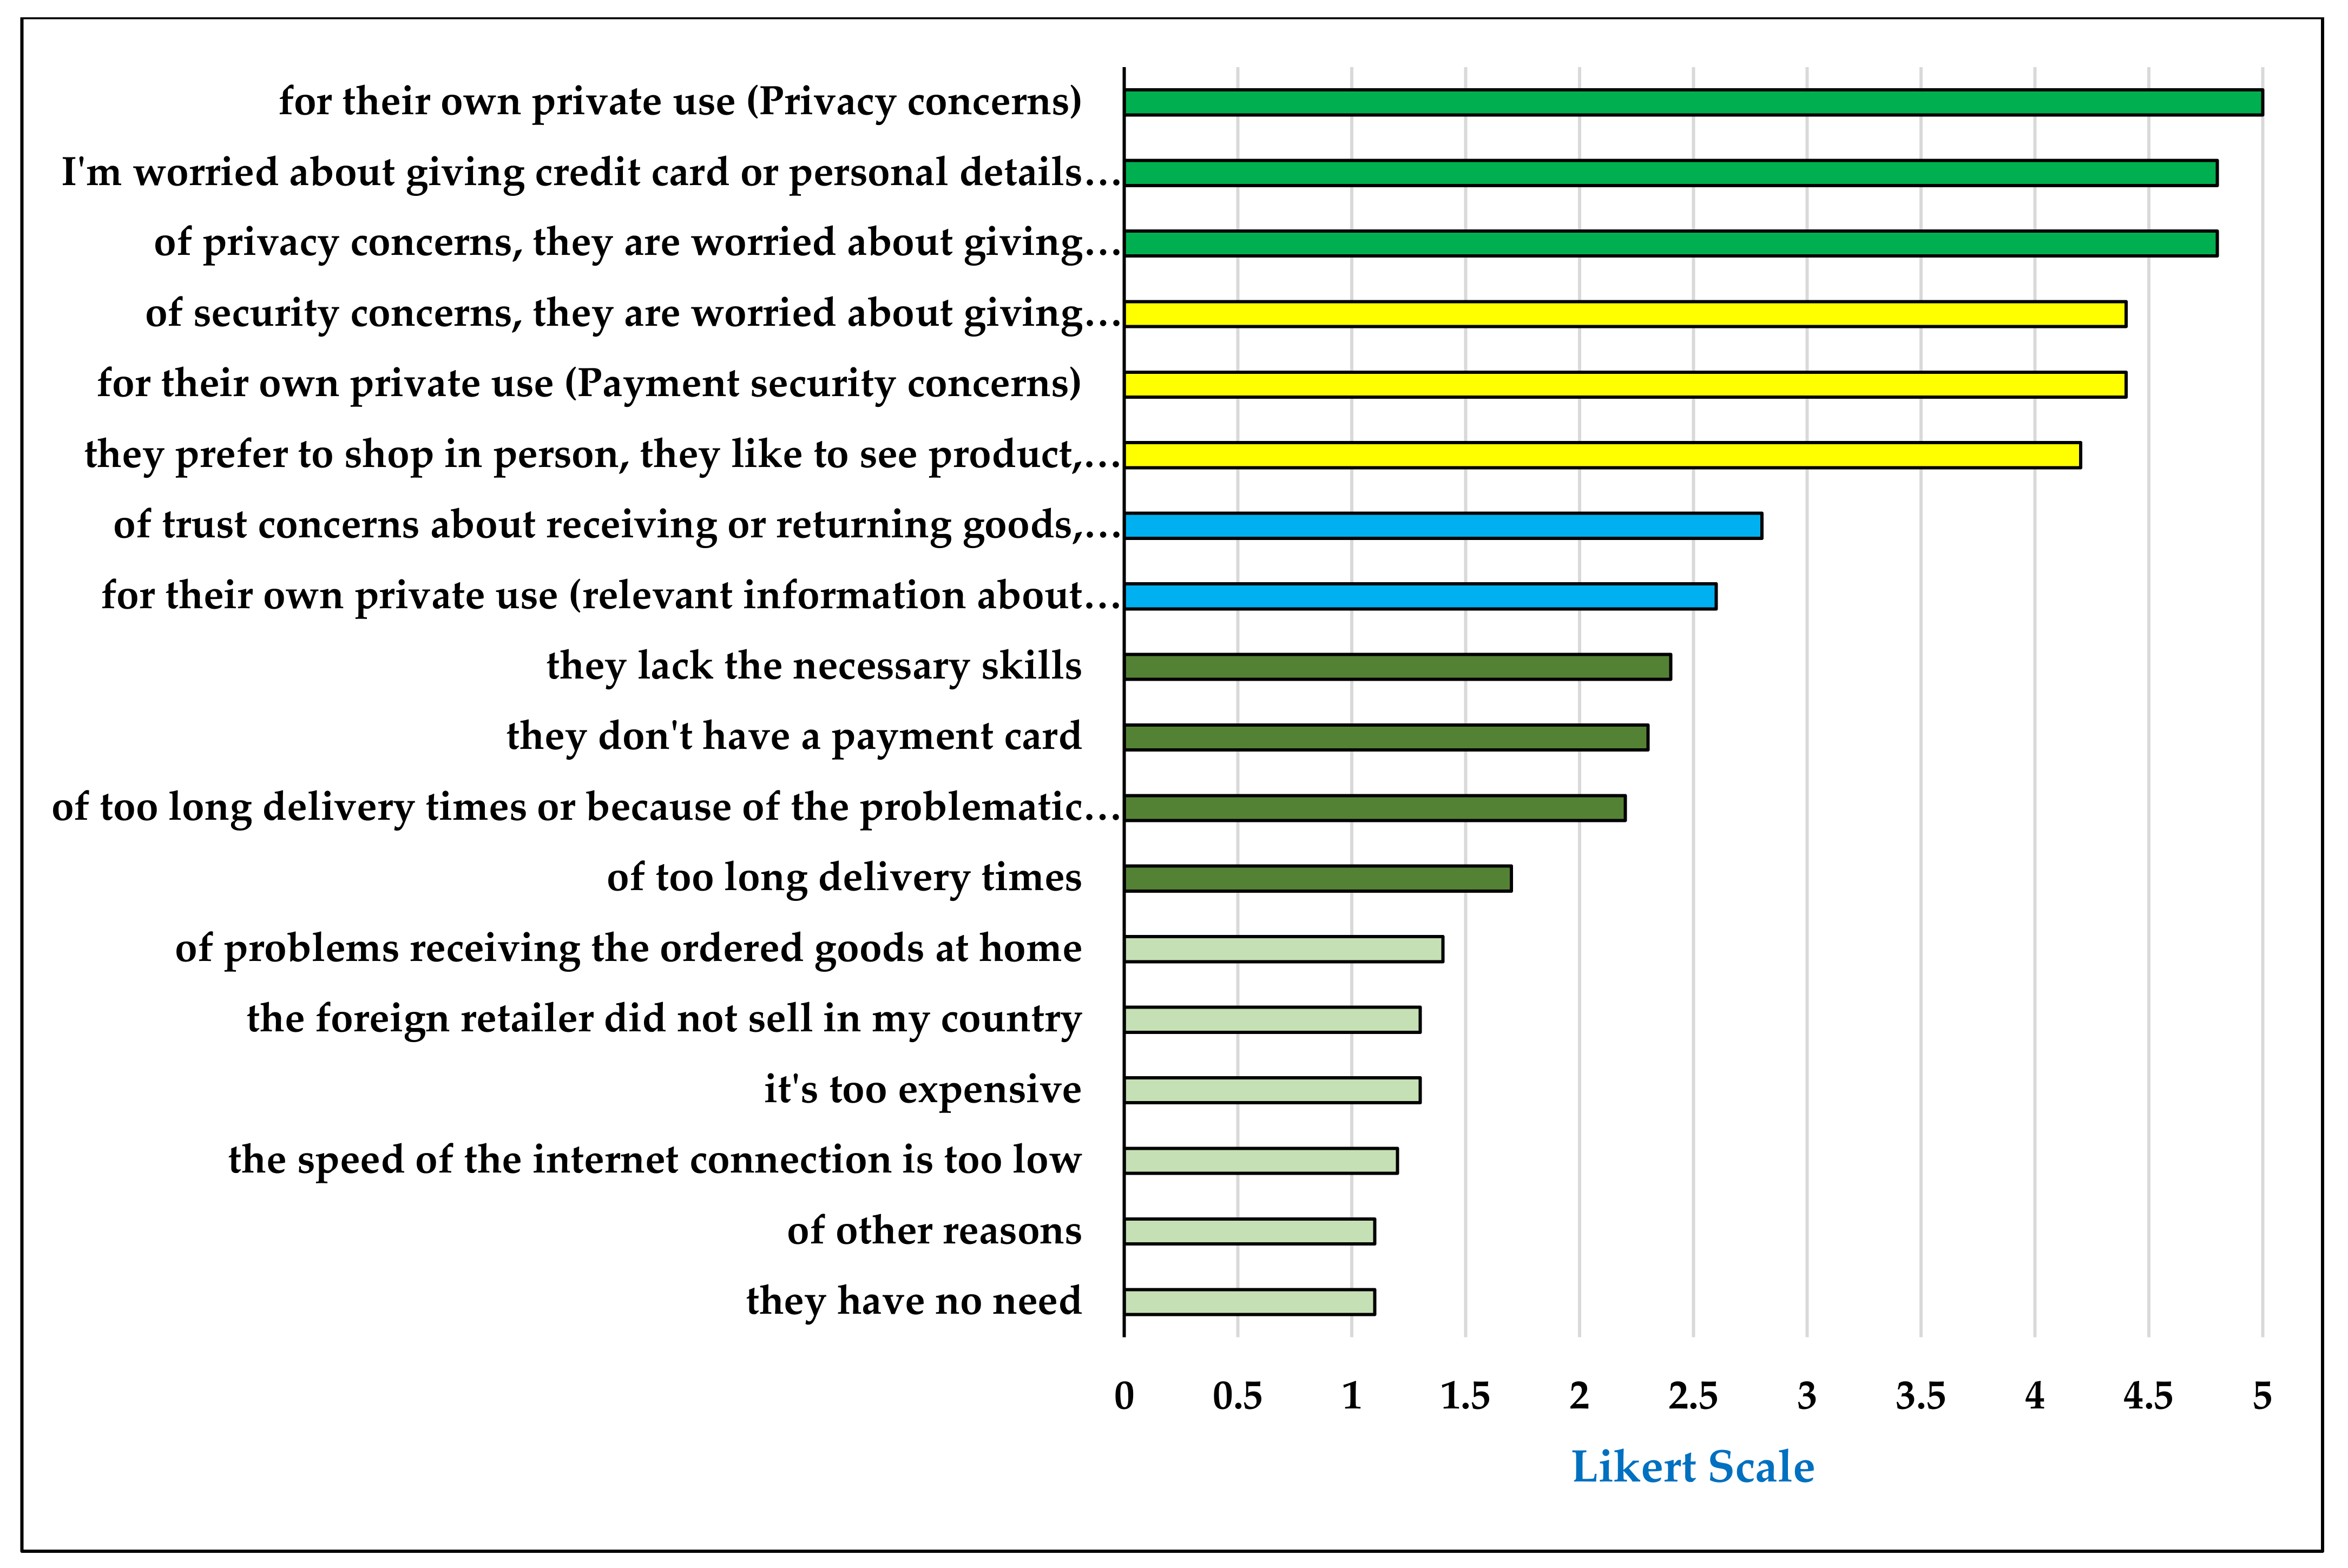
Figure 5 illustrates the ranking related to perceived barriers.
The results show that the problems encountered by individuals when buying/ordering over the Internet are not considered relevant by the expert panel. No item received a significant relevance, while the item related to private use always collected a value of 4 and is the only one that presents a moderate relevance. Next in the ranking appears the fear associated with the security of payment (average value of 3.4). It emerges, therefore, that e-commerce is no longer seen as an alternative to face-to-face shopping but has now entered the habits of citizens. The pandemic period has widened this phenomenon. Moreover, this consideration emerges not only from the assignment of Likert Scale values, but is a concept reiterated by all respondents. Those who buy through this channel have a clear idea of what they want to buy. Indeed, more than problems they see opportunities, and can compare the price they have seen in a store with the price they can quickly see on a cell phone or a tablet. At the same time, delivery costs are slightly more critical than the selling price (3.3 vs. 2.9). Protection in terms of privacy and fraud is considered neither relevant nor irrelevant (average value 2.7).
The situation changes when the experts are asked to identify potential barriers. In fact, it emerges that there are three items that are considered very relevant and, in particular, all the experts have assigned a value of 5 to private use (confirming the previous figure). However, the privacy concerns component is given the highest value, while payment security concerns are given a value of 4.4. Privacy concerns are also considered very relevant when talking specifically about concerns about personal details (average value of 4.8). Similarly, when we talk specifically about security concerns in terms of credit cards, the value of 4.4 is confirmed. Finally, the preference to purchase in person is also moderately significant (4.2).


 ,
, 


