Article

Spirulina platensis Protein as Sustainable Ingredient for Nutritional Food Products Development

by
Milena M. Ramírez-Rodrigues
,
Carolina Estrada-Beristain
,
Jorge Metri-Ojeda
,
Alexa Pérez-Alva
and
Diana K. Baigts-Allende
*
Department of Chemical, Food and Environmental Engineering, Universidad de las Américas Puebla, San Andrés Cholula, Puebla 72810, Mexico
*
Author to whom correspondence should be addressed.
Sustainability 2021, 13(12), 6849; https://doi.org/10.3390/su13126849
Submission received: 16 April 2021 / Revised: 7 June 2021 / Accepted: 9 June 2021 / Published: 17 June 2021

Abstract

:
Spirulina platensis, microalgae, is emerging as a sustainable source for highly nutritional food ingredient production to cover the food demands of the global population. This study aimed to characterize food prototypes supplemented with microalgae protein isolate to develop health-promoting food products. The nutritional composition (proximate composition, fatty acids, and mineral content) of the spirulina biomass, the structural characterization of spirulina platensis protein (SPP) isolates, and the physicochemical properties of SPP- developed food products were evaluated. High protein (47%), ϒ-Linolenic acid (24.45 g/100 g of fat), iron (16.27 mg/100 g), calcium (207 mg/100 g), and potassium (1675 mg/100 g) content in the spirulina biomass was found. SPP (76% of purity) with sodium alginate produced stable emulsions (>90%) during storage (14 days). Amaranth + SPP pasta resulted in good appearance, texture, color, and high nutritional value in protein (above 30%) and minerals, mainly iron (9–10 mg/100 g) and magnesium (300 mg/100 g), meeting the daily intake recommendations. In addition, the amino acid profile of the pasta was in line with the amino acid pattern requirements for adults. SPP can be considered as potential additive for emulsions stability and provided nutritional and physicochemical desired in the elaborated pasta.

1. Introduction

According to the Food and Agriculture Organization’s (FAO) definition, sustainable diets have “low environmental impacts which contribute to food and nutrition security and to healthy life for present and future generations. Sustainable diets are protective and respectful of biodiversity and ecosystems, culturally acceptable, accessible, economically fair and affordable; nutritionally adequate, safe and healthy; while optimizing natural and human resources” [1].
Unfortunately, food consumption and production have become more complex over time as food undergoes intricate processes, as well as longer and further transportation. These unsustainable patterns have led to the deterioration of the environment, accelerating climate change, and increasing natural resource degradation, compromising human health [2,3,4]. Current food systems generate adverse outcomes in water and soil, biodiversity loss, and excessive greenhouse gas emissions [5]. Other food production problems are the decrease in arable land and overfishing in the ocean [6]. The FAO has reported that the percentage of fish stocks within a biologically sustainable level has progressively declined from 90% in 1990 to 65.8% in 2017 [7].
The current food system has failed to protect the environment and has not assured access to sufficient and nutritionally adequate food for everyone. Despite world biodiversity and increase in food production and availability, there are still millions of people suffering from undernourishment, food insecurity, and hunger. At the same time, more than one billion are overweight or obese [3,5]. With the exponential global population growth, there is a general concern about achieving adequate nutrition; it is estimated that by 2030, the worldwide population will reach 8.5 billion, with 1.4 billion being over 60 years old [1,8]. The food production system will face serious challenges to meet the needs of both an aging and expanding population, mainly to cover the protein requirements [1].
Protein plays a critical role in preventing protein-energy malnutrition and promotes healthy muscle aging, but animal-derived protein causes significant environmental damage, as most of it is produced inefficiently [1,4,9]. Animal-derived protein requires large areas of dedicated land, water, nitrogen, and fossil energy for production and transportation, resulting in the emission of large amounts of greenhouse gases. Therefore, exploring alternative protein sources and transitioning towards more sustainable diets has been a recent research priority [1]. As part of this quest, the nutritional and environmental profiles of alternative protein sources such as plant-based foods, insects, single-cell protein (mycoprotein or microalgae), and in vitro meat have been investigated [10].
A sustainable and relatively novel food source of nutritional compounds are microalgae. These organisms can produce large amounts of high biological value proteins, long-chain polyunsaturated fatty acids, carotenoids, vitamins, minerals, and phenolic compounds, among others [11,12,13]. Microalgae do not compete for arable land as other food sources do and, depending on their purpose, can even be grown using non-potable water, wastewater, or even salty water. Another advantage they present is their high biomass yield per unit area [6,13]. Microalgae include microscopic algae, eukaryotic, and photosynthetic bacteria, also known as prokaryotic cyanobacteria [8]. Cyanobacteria, or blue-green algae, are considered part of this group due to their physiology similarities and their ability to perform photosynthesis. One of the most important genera of blue-green algae is Arthrospira sp., with the most important species being Spirulina platensis and Spirulina maxima [14,15].
Spirulina platensis, or spirulina, is a planktonic, filamentous cyanobacterium found in tropical and subtropical alkaline warm lakes with high pH values and salt concentrations [14,15,16]. One morphological feature of spirulina is the spiral shape of its multicellular cylindrical filaments in an open helix with lengths from 0.3 to 1.0 mm [17].
These microalgae are extensively cultivated as they can have several applications in food, feed, nutraceuticals, pharmaceuticals, and cosmeceuticals [18]. It is used in human nutrition not only because of its high protein content (up to 70% w/w) but also because of its desirable amino acid (AA) profile regarding the amount of essential AA and good digestibility, making it a potential alternative protein source [19,20,21]. Additionally, microalgae proteins also have promising techno-functional properties, used as foaming, gelling, and emulsifying agents [19,20]. Some studies have shown that microalgal proteins can be competitive with some commercial proteins used as emulsifiers like sodium caseinate, whey protein, and soy protein [19,22].
Microalgae are also an essential source of minerals, principally Fe, Zn, Mn, and Cu [23], as well as hydrosoluble vitamins (B complex and C) and vitamin E [24]. S. platensis is rich in vitamin B12, as it has been reported that it can contain between 1.6 and 3.2 μg of this vitamin per gram of dried mass, which can cover between 25 and 133% of the daily intake recommendations [25]. In the last few years, microalgae biomass has been successfully applied as an additive for food products, giving innovative and healthy alternatives such as vegetarian cookies, pasta, biscuits, mayonnaise, sausages, and gelled desserts [12,26,27]. Some results have shown that the addition of S. platensis at different levels improved some physicochemical and sensorial attributes in wheat pasta such as water absorption capacity, texture, color, as well as antioxidant capacity [28]. Meanwhile, subjecting S. platensis to pre-treatments with lactic acid fermentation has shown to enhance the aromatic characteristics and decrease off-flavors to extend its applications in food products [29].
Therefore, this study aimed to characterize food prototypes (pasta and mayonnaise) added with Spirulina platensis protein (SPP) for developing highly nutritional products for specific population requirements.

2. Materials and Methods

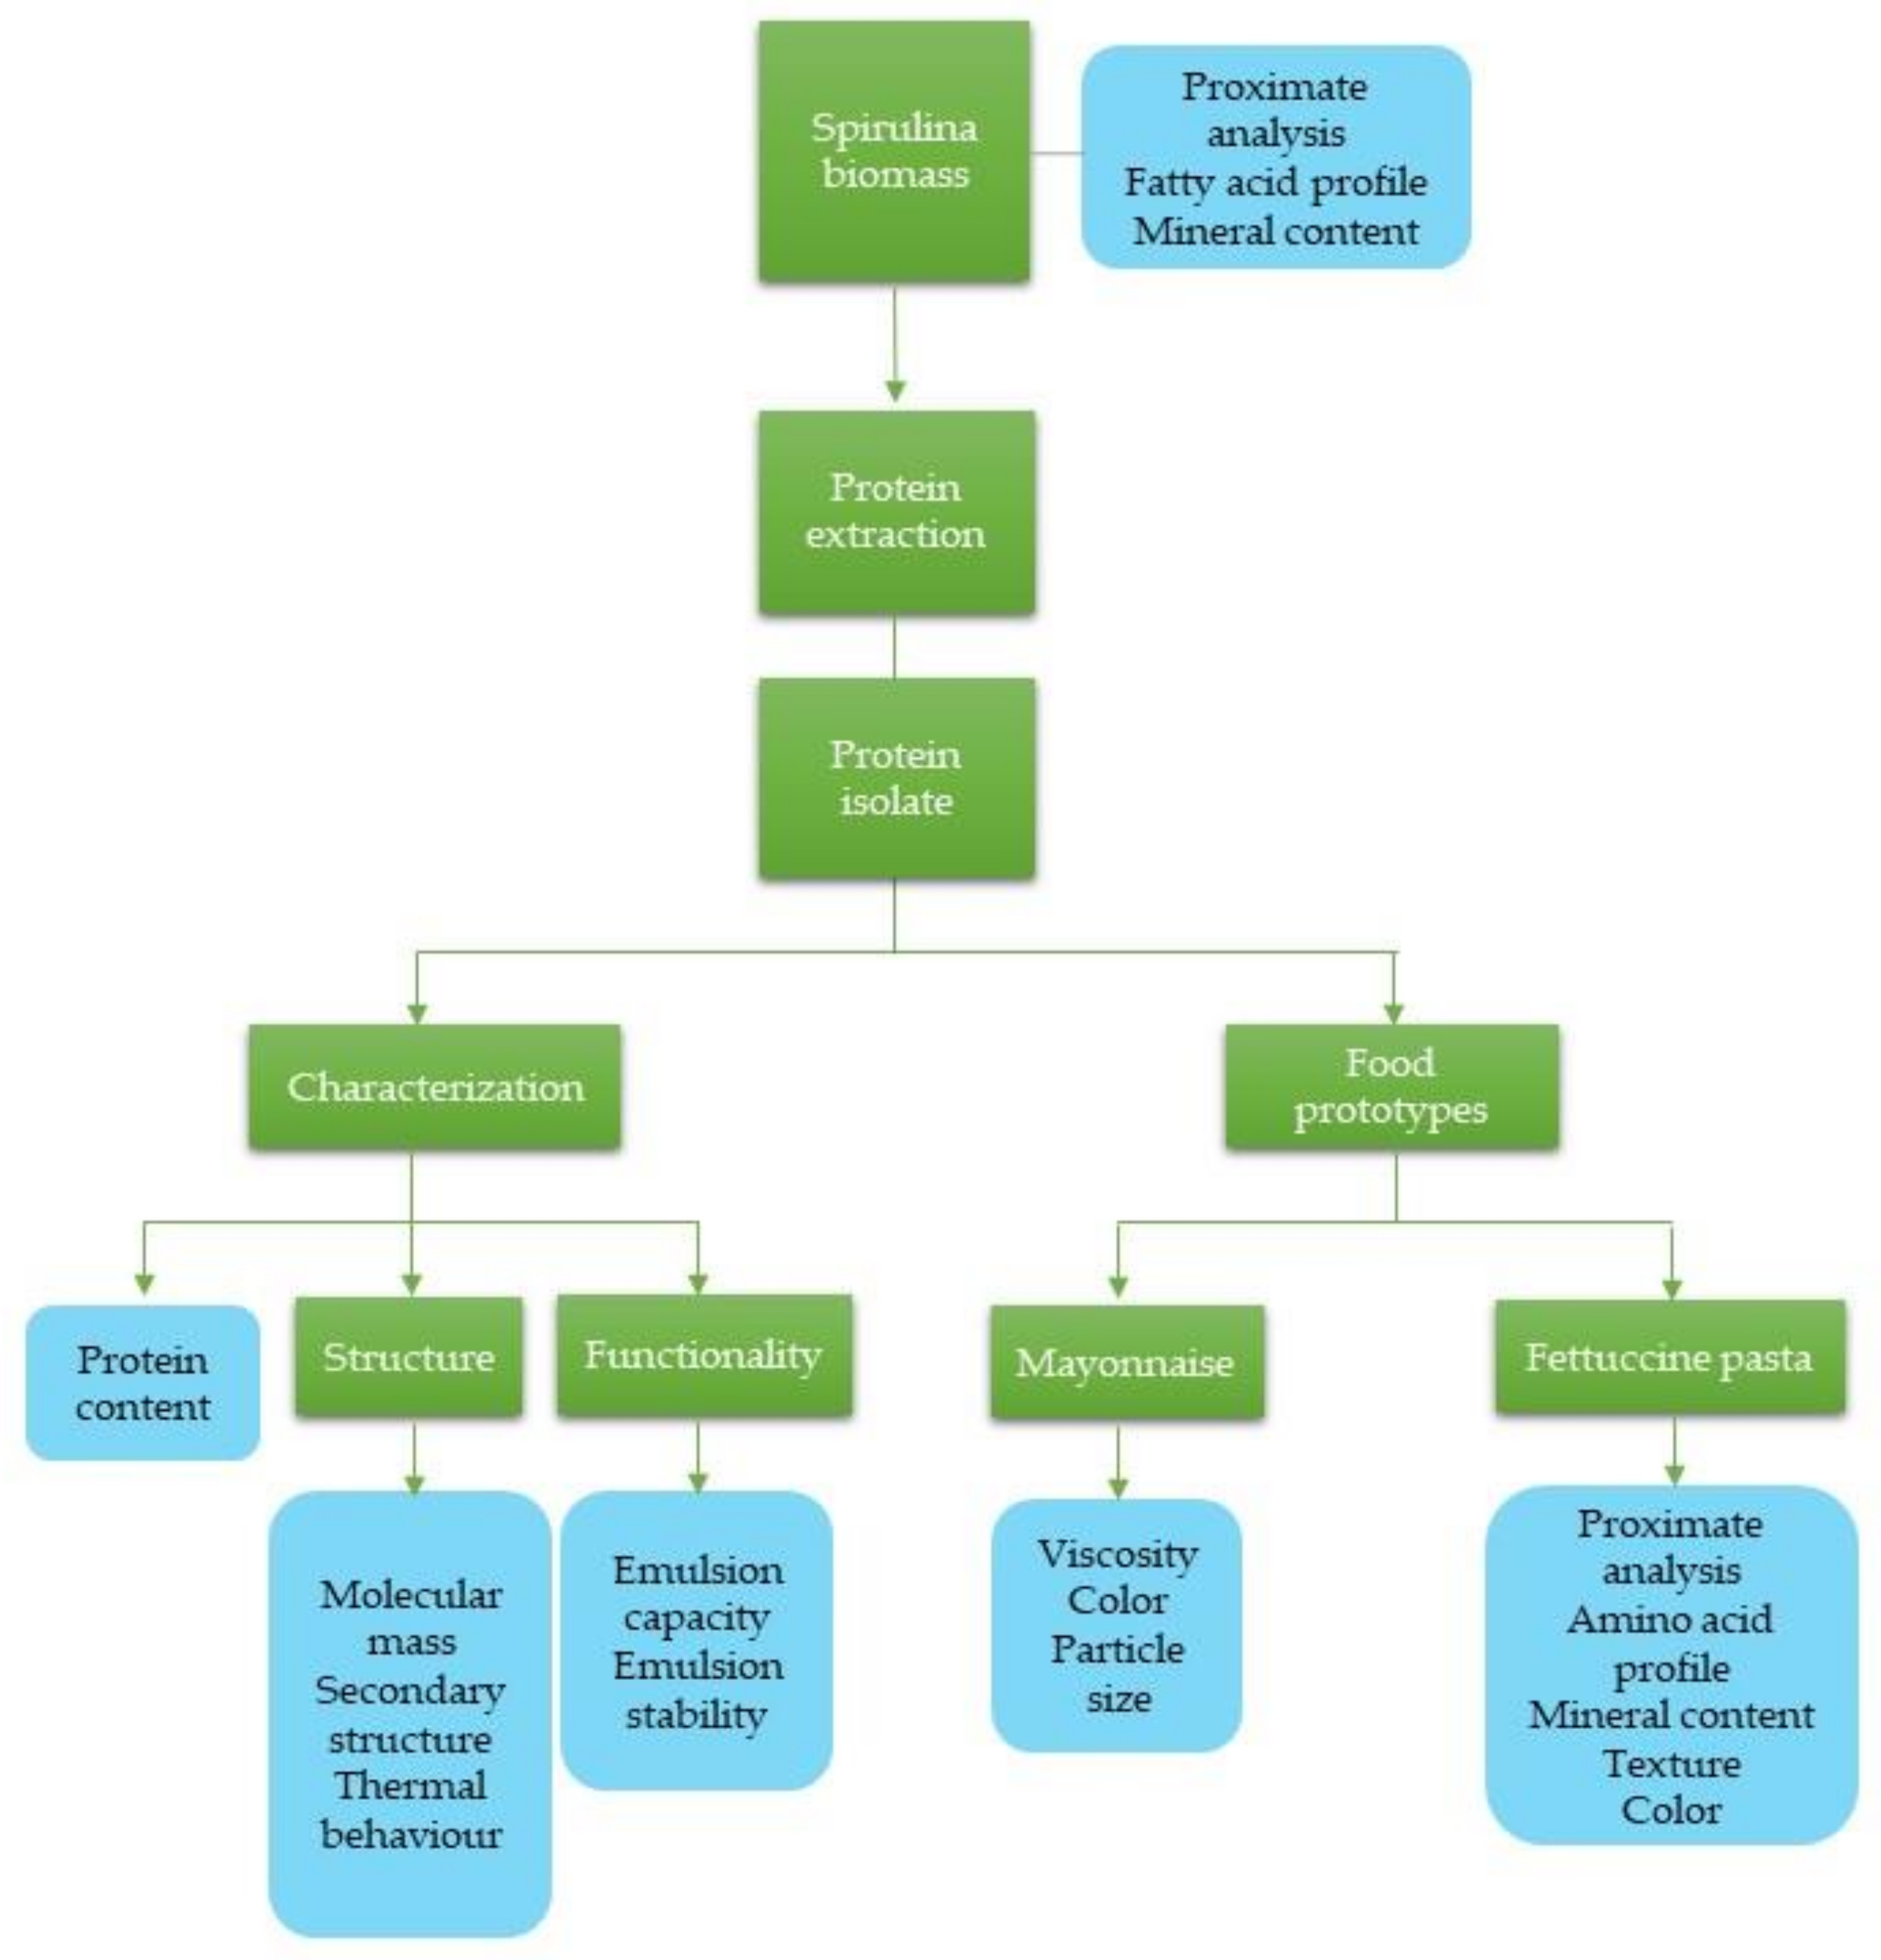
First, the proximate composition, fatty acid profile, and mineral content of the Spirulina platensis biomass were determined. Next, protein from S. platensis was isolated, characterized, and studied for its use as a food additive in two food product prototypes (pasta and mayonnaise). Additionally, the developed products were characterized. Spirulina platensis biomass (frozen) was purchased from “Galtec Algae Technologies, Guadalupe, Mexico”, amaranth seeds (Amaranthus cruentus) were obtained from “Mesoamérica para el Mundo S.C. de R.L,” the brown algae (Macrocystis pyrifera) were purchased from “Algas Pacific, Ensenada, Mexico”, and chia seeds (Salvia hispanica) were supplied by “El Shaddai, Oaxaca, Mexico”. Soybean (SB) oil and wheat flour were purchased in local supermarkets. Sigma-Aldrich Co. (Saint Louis, MO, USA), Bio-rad (Hercules, CA, USA), and Merck (Darmstadt, Germany) were suppliers of soybean protein (SBP), sodium alginate, amino acid standard mix, and all reagents. A summary of the methodology followed in this study is shown in Figure 1.

2.1. Proximate Analysis

The proximate composition of the raw materials and pasta was determined following the AOAC procedures [30]. Nitrogen was determined by the Kjeldahl method (954.01), approximately 1 g of sample was hydrolyzed mixing 15 mL of sulfuric acid and copper tablets (as catalyzer) at 420 °C for 2 h; then, the samples were neutralized and titrated for calculating the protein content using a 6.25 value as nitrogen conversion factor.
The fat content was determined by Soxhlet extraction (920.39) using n-hexane as the solvent. The solvent was heated up until boiling and refluxed to extract the fat. After the full extraction, the fat content was calculated by weight difference.
The ash content (923.03) was determined gravimetrically after incineration at 600 °C for 2 h. For the crude fiber determination (962.09), the samples were digested with sulfuric acid (1.25% v/v) and rinsed with distilled water for neutralization, followed by alkaline digestion with NaOH (1.25% w/v). After neutralization, the sample was dried in a convection oven (135 °C) and incinerated at 600 °C. The fiber content was calculated by weight difference. The moisture content was determined gravimetrically by drying in a convection oven at 135 °C until constant weight (925.09). Finally, the carbohydrate content was estimated by difference.

2.2. Fatty Acid Profile

The fatty acid profile was determined by gas chromatography coupled with a flame ionization detector (GC-FID/capillary column, Thermo Scientific Trace 1310; Waltham, MA, USA). A split/splitless injector and a Phenomenex Zebron ZB-FAME column (30 m × 0.25 mm, 0.2 µm; Torrance, CA, USA) were used. The methodology followed was the AOAC 996.06 procedure and the fatty acids identification was carried out by comparing the relative retention times of the fatty acid methyl esters (FAME) peaks from samples with commercial standards and quantified with an internal standard. The results were analyzed using the software Chromeleon v7.2.1 (Thermo Scientific, Waltham, MA, USA) and expressed in relative percentages. The commercial standard for the fatty acid profile was Supelco 37 FAME Mix (CRM47885, Sigma-Aldrich), and undecanoic acid (Sigma-Aldrich) was used as an internal standard.

2.3. Protein Extraction

Spirulina platensis protein (SPP) was extracted using an alkaline solution, followed by isoelectric precipitation. Defatted microalga powder was dispersed in a NaOH solution (0.05 M) adjusted to pH 9 using HCl (0.1 M) in a ratio of 1:10. The dispersion was pre-treated with mechanical lysis using an ultrasound device (EW-04711–70 Cole-Parmer, Vernon Hills, IL, USA) at 70% of amplitude and 100 μm of wavelength and two intervals of 2.5 min. Then, the microalgae dispersion was stirred and heated in a water bath (Cimarec™ Series, Thermo Fisher, Waltham, MA, USA) at 60 °C for 60 min. The mixture was centrifuged at 6000 rpm for 25 min at 4 °C and the supernatant was acidified to pH 3 using HCl (1 M). The precipitated protein was neutralized, dialyzed (Spectra/Por MWCO: 12–14 kDa, Fisher Scientific, Waltham, MA) against distilled water for 24 h and freeze-dried [31].

2.4. Characterization of Spirulina Platensis Protein (SPP)

2.4.1. Protein Content Determination

The protein content was determined using the Peterson modification of Lowry’s method [32]. Protein solutions were prepared at a concentration of 1 mg/mL using a solution of NaOH (0.05 N, pH 13) and stirred until fully dissolved. An aliquot of 500 µL of protein solution was used and it was mixed with 50 µL of deoxycholate solution (0.15%) and allowed to stand for 10 min. Next, each sample was mixed with 50 µL of trichloroacetic acid (72%) for 10 min. Afterwards, the samples were centrifuged at 5000 rpm at room temperature for 5 min. The supernatant was eliminated, and the precipitated protein was dissolved in a solution made of the Lowry reagent and distilled water (1:1). The Lowry reagent was prepared by mixing sodium carbonate (2% w/v), cupric sulfate (1% w/v), and sodium potassium tartrate (2% w/v) solutions (100:1:1 ratio) [33].
After the addition of the Lowry reagent/water solution, the samples were allowed to stand for 20 min at room temperature. Next, 250 µL of Folin–Ciocalteu reagent was added and allowed to stand for 30 min at room temperature in the dark. After the reaction took place, the samples were homogenized using a vortex and 250 µL of the samples were transferred into a 96 wells microplate. The absorbance was measured using a UV-Vis spectrophotometer model Multiskan Sky Microplate (Thermo Fischer Scientific, Waltham, MA, USA) at 720 nm. A calibration curve was prepared using Bovine Serum Albumin (0–1000 µg/mL) to calculate the protein content in the samples. The protein content was calculated using Equation (1) and expressed as a percentage (%).
Protein content (%) = Ps/Sw × 100
where Ps is the protein solubilized in the sample (μg) and Sw is the weight of the sample (μg).

2.4.2. Molecular Mass (SDS-PAGE) and Secondary Structure (FTIR) of Spirulina Platensis Protein (SPP)

Sodium Dodecyl-Sulphate Polyacrylamide Gel Electrophoresis (SDS-PAGE) was used to determine the molecular structure of SPP. Protein bands separation was carried out under reducing conditions using a double cell Mini-Protean II system (Bio-Rad Laboratories, Hercules, CA, USA). First, a polyacrylamide gel using 4.5% (stacking) and 12.5% (separation) of polyacrylamide mixed with ammonium persulfate at 10% w/v (20 and 50 µL for stacking and separation gels, respectively) and TEMED (2 µL) until its polymerization. Protein solutions (4 mg/mL of protein concentration) using distilled water were mixed in a ratio of 1:1 with Laemmli buffer (5% glycerol, 20% SDS, 0.1% bromophenol blue, and 2% β-mercaptoethanol), heated at 95 °C for 5 min and centrifuged at 2000 rpm for 5 min (room temperature). Afterwards, 5 μL of molecular marker Biorad Pretrained Precision Plus Protein Dual Xtra (2–250 kDa) and 15 μL of the sample were loaded into the gel wells running at 90 V for 100 min [34]. The gels were stained using ethanol: acetic acid: water solution (70:5:20) with 0.1% of Coomassie Blue G-205 for 45 min and destained with an ethanol: acetic acid: water solution (70:5:20) until no further color was released from the gel.

2.4.3. Secondary Structure Determination of SPP

The secondary structure of the protein was observed by Fourier Transform Infrared spectroscopy (FTIR). Spectra at a 400–4000 cm−1 wavelength range were measured using a spectrophotometer Agilent Cary 630 coupled to an ATR ZNSe. The results were analyzed with Microlab PC (Agilent Technologies Inc., Santa Clara, CA, USA) software [35]. The enthalpy and denaturation temperatures were studied by Differential Scanning Calorimeter (DSC) analysis. Approximately 10 mg of protein isolate were placed in hermetically sealed aluminum pans. The analysis was carried out between 25 and 40 °C with a heating rate of 10 °C/min, using a TA Instruments Q2000 V24.11 (TA Instruments Inc., New Castle, DE, USA) calorimeter, and the data were analyzed using a Universal Analysis 2000 software (TA Instruments Inc., New Castle, DE, USA). An empty, hermetically sealed aluminum pan was used as a reference [36].

2.4.4. Emulsifying Capacity (EC) and Emulsion Stability (ES)

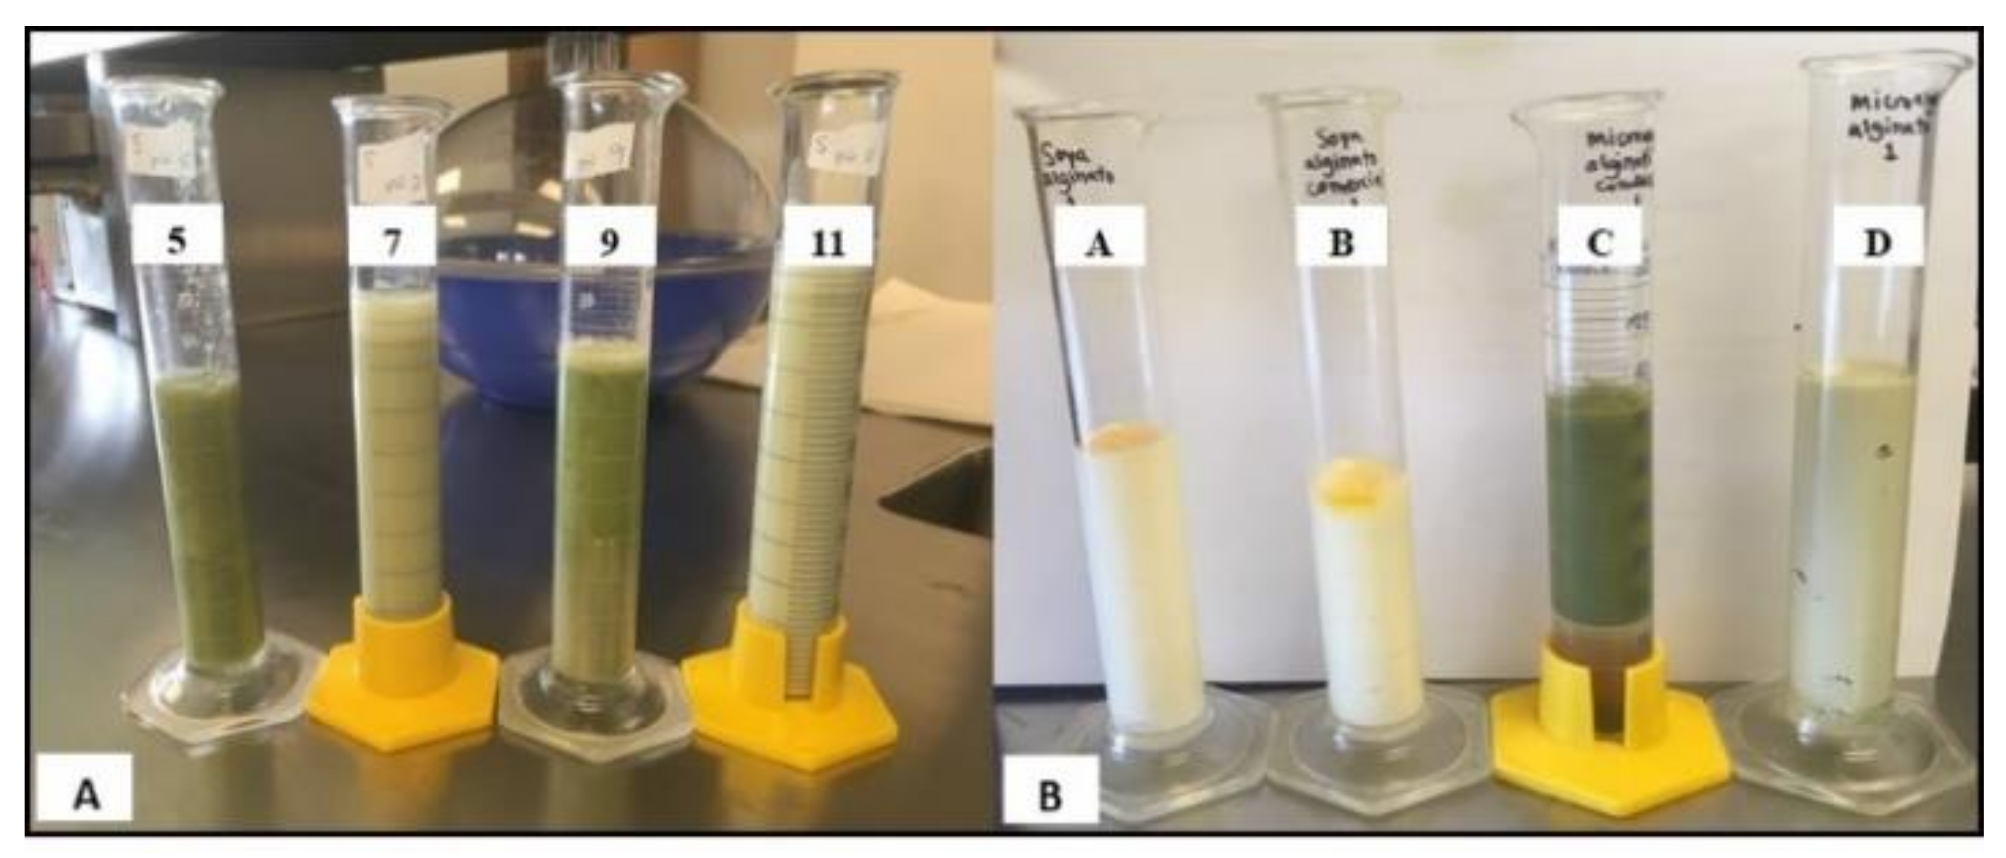
The emulsifying capacity (EC) and emulsion stability (ES) of the protein-emulsions were determined according to the method described by Wang et al. [37]. Oil-in-water (o/w) emulsions were prepared by the homogenization of SBP and SPP protein solutions (0.5% w/v) at different pH values (5, 7, 9, and 11) at room temperature. Next, chia seed oil was slowly incorporated (1:1 v/v) to the aqueous phase (protein solution) under constant stirring. An Oster Immersion blender (model FPSTHB Sunbeam Products, Inc, Boca Raton, FL, USA) at the maximum speed for 1 min was used as a homogenizer. The EC was calculated using Equation (2). The physical ES was calculated with Equation (3) by measuring the phase separation after 1 and 14 days of storage at room temperature (25 °C):
EC (%) = Eh/Hs × 100
ES (%) = (Eh)/Hi × 100
where Eh is the height of the emulsified liquid in cm, Hs is the total height of the system in cm, and Hi the height of the initial emulsion in cm.

2.5. Food Prototypes Elaboration

Microalgae emulsions were prepared by the homogenization of 0.5% SPP solutions, chia oil (mechanically extracted with a press), and 0.5% sodium alginate as a stabilizer. Protein solutions and sodium alginate (neutral pH 7) were stirred for approximately 2 h until solubilization. Then, the oily phase was slowly added in a ratio of 1:1 (v/v) and mixed with an Oster Immersion blender (model FPSTHB, Sunbeam Products, Inc, Boca Raton, FL, USA) at full speed for 1 min. Additionally, commercial SBP was used as a control emulsion.
Fettuccine dough was made with commercial wheat flour (control) and a blend of 50:50 wheat flour: amaranth flour (AWP) and eggs. Three different AWP pastas were enriched with 6, 8, and 10% of SPP (Table 1). First, the amaranth seeds were ground in a coffee grinder for flour obtention; then, it was blended in equal proportions with wheat flour and the adequate proportion of SPP, then the blend was sieved (270–300 μm). Afterwards, both the battered eggs and the pre-heated water (40 °C) were gradually added to the mixture. The blend was manually kneaded until a homogeneous dough was obtained [38]. The pasta dough was pressed and cut using a household pasta maker Metaltex model 8002522517402 (Metaltex Co., Genestrerio, Switzerland) and dried for 48 h at room temperature. The final pasta (fettuccine) dimensions were 1.5 mm thick × 6 mm width × 30 ± 5 cm in length.

2.6. Viscosity, Particle Size, and Color of Mayonnaise (Emulsions)

The sample preparation for the following measurements is shown in Table 2. The viscosity of the emulsions was determined using a Brookfield Viscometer DV II (AMETEK Inc., Berwyn, PA, USA) equipped with an RV-4 spindle at 100 rpm for 45 s at a temperature of 25 °C. The particle size distribution was measured using dynamic light scattering with a particle size analyzer, Bluewave Nanotrac Wave II (Microtrac Inc., Montgomeryville, PA USA), with a refractive index of 1.47 for oil droplets and 1.33 for water. The results are given as the mean of the particle size distribution [39,40]. Konica Minolta model CR-400 colorimeter (Konica Minolta Holdings, Inc., Tokio, Japan) was used for color determination and expressed in CIELab system coordinates (L*, a*, b*). Additionally, chroma (C) and hue angle (H) were calculated using Equation (4) and Equation (5), respectively [41]:
C = a * 2 + b * 2
H =   tan 1   b * a *
where a* and b* are CIELab system parameters (“*” in a* and b* are part of the variable).

2.7. Texture, Color, and Nutritional Composition of Pasta

The texture of dried pasta was measured using a Texturometer Shimadzu EZ-SX Texture Analyzer (Shimadzu Co., Kioto, Japan) equipped with a load cell adjusted to 50 kg and coupled to an aluminum probe. The break force test was performed at a compression speed rate of 3 mm/s (at room temperature) [38]. The software used for data analysis was Trapezium X (Shimadzu Co., Kioto, Japan). The pasta color parameters were determined with a colorimeter previously described in Section 2.6. (mayonnaise color measurements).
Proximate analyses were performed by AOAC methods [30]. The mineral content (Ca, Fe, Mg, Mn, and P) was determined using an Agilent 5110 ICP-OES based on AOAC Method 2011.4. Briefly, samples (2 mL) were digested on a CEM Mars 6 microwave system (Charlotte, NC, USA) with concentrated nitric acid. Afterwards, samples were filtered and diluted. The spectra reading was carried out at specific wavelengths for each mineral. For the amino acid profile, first, the samples (0.3 g) were acid hydrolyzed for 24 h at 110 °C in a nitrogen atmosphere using 30 mL of HCl solution (6 M) containing 0.02% of phenol and diluted 25 mL using distilled water. The samples were then stored at 4 °C, filtered with 0.45 μm filter, and analyzed using the Agilent amino acid analysis protocol in an Agilent 1290 Infinity II (Agilent Technologies Inc., USA) HPLC coupled to a diode array detector (DAD) with a ZORBAX Eclipse Plus C18 column (Agilent Technologies Inc., Santa Clara, CA, USA). Mobile phase A and B consisted in 10 mM of Na2HPO4:10 mM Na2B4O7 (pH 8.4) buffer and an acetonitrile: methanol: water (45:45:10) solution, respectively. Primary amino acids derivatization was carried out with o-phthalaldehyde (OPA) and the secondary amino acids were derivatized using 9-fluorenylmethyl chloroformate (FMOC). Amino acid detection was performed at 263 and 338 nm. The quantification was done using norvaline as an internal standard [42].

3. Statistical Analysis

All the analyses were done in triplicate (n = 3) and the results obtained were expressed as mean with standard deviation (SD). To determine statistical differences, the results were analyzed with one-way ANOVA and Tukey’s multiple comparisons test (p < 0.05) using Minitab 19 (LLC, State College, PA, USA).

4. Results and Discussion

4.1. Nutritional Composition of Spirulina

The proximate analysis of freeze-dried spirulina biomass is shown in Table 3. The main constituent found in spirulina samples were proteins (47%) followed by lipids (36%). Protein content was similar to those reported by Volkmann et al. [43] (48%) but was slightly lower than the amounts found in spirulina strains (50–70%) obtained from different regions [44]. The same authors reported lower lipids content compared to our results. However, in spirulina biomass subjected to different salinity mediums and incubation treatments, the lipid content increased to 25% [45]. Ash content reported for several spirulina strains was between 8 and 18%, comparable with our results (7.68%).
Table 4 shows the mineral content and fatty acid profile of the spirulina biomass. The content of potassium (1675 mg/100 g), phosphorus (728 mg/100 g), and magnesium (486 mg/100 g) were in agreement with the reported values in the literature for the same strain (1400 mg/100 g, 600 mg/100 g, and 400 mg/100 g, respectively) [46]. Spirulina is considered an important source of minerals, mainly calcium (207 mg/100 g), potassium (1675 mg/100 g), and iron (16 mg/100 g), which are higher compared to some animal and plant sources such as milk (100, 135, and 0.03 mg/100 g) and spinach (99, 558, and 2.71 mg/100 g respectively). Iron content (16 mg/100 g) was higher than rice (0.2–6 mg/100 g), similar to wheat (1.6–16 mg/100 g), and common bean (3.14–12 mg/100 g) and was lower than soy (6–20 mg/100 g). In some trace minerals (Mn, Zn, and Se), the amounts were lower compared to the three sources previously mentioned [47]. The variation in microalgae biomass composition often results from different culture conditions such as the stress parameters (temperature and light intensity, among others) used for its cultivation [48]. Some studies have compared several environmental factors (nitrogen concentrations, pH, CO2, etc.) and their effect on biomass composition [49]. An increase in phenolic compounds, lipids, and protein content has been found when higher temperatures are used [50].
The lipid analysis showed that the long-chain fatty acids were the predominant compounds, mainly palmitic acid (37%) and gamma-linoleic acid (GLA, 24%). Previously reported values for spirulina were higher in palmitic (45–55%) and much lower in gamma-linoleic acid (GLA, 4%) [51]. In another study with a similar microalgae variety and cultivation conditions, higher contents of palmitic (46%), oleic (8%), and linoleic (12%) acids were reported; nevertheless, lower amounts of GLA (20%) and stearic acid (1%) were found [46]. One of the most significant polyunsaturated fatty acids is GLA, which has been related to human health benefits, especially for treating chronic diseases, mainly in the immune system’s inflammatory response [52].

4.2. Spirulina Platensis Protein (SPP) Characterization

The protein isolated from S. platensis showed 76.15% ± 1.49 of purity, slightly higher than the previously reported values 69.50 and 70.24% [53,54]. The secondary structure of spirulina platensis protein (SPP) observed by FTIR showed a typical protein footprint similar to data reported by Bataller & Capareda [55] (Figure 2A). In the spectra, the most intense polypeptide bonds band were found at 1600–1700 cm−1 (Amide I) given by C=O stretching, followed by Amide II (1550 cm−1) by N–H bending. During heating, the protein denaturation in the thermogram was observed by one sharp and narrow peak and a small and width peak (Figure 2B) at 89 and 173 °C. Although a similar behavior is reported for the same protein type, the denaturation temperatures were lower (67 and 109 °C) than in our study [56]. The denaturation temperature in SPP (173 °C) was similar to protein isolated from two marine protist strains (Thraustochytrid) (167 and 174 °C) [57], and higher than some plant proteins (55–65 °C) such as rice, pea, and potato [58]. The enthalpy denaturation of protein (area under the endothermic peak) represents the amount of native protein present in the samples (145 J/g). These values are not reported for protein isolated from spirulina; however, they were similar to another non-animal derived protein isolated from the palm heart vegetable (143 J/g) [59]. In the case of other photosynthetic proteins (leaves) from amaranth and spinach, the denaturation temperatures were lower (60 °C). The protein denaturation generated by heat depends on the structural changes induced in the molecule. The differences in denaturation temperature could be attributed to the structural features of the protein due to extraction processing parameters and protein purity [60]. The resistance of protein to unfolding during heating is a relevant attribute in the food industry; when the protein structure changes, the solubility could decrease due to the formation of aggregates, negatively affecting the food product quality.
The molecular weight (Mw) distribution of SPP was between 100 and 12 kDa (Figure 3). Similar to our results, the protein molecular bands at 10 and 55 kDa have been reported for the same protein source (SPP). The protein subunits observed at 100 kDa probably correspond to the microalgae protein-membrane [61], and the 50 kDa and 12 kDa bands could be representing the large (L) and small (S) subunits of RuBisCO protein present in autotroph microorganisms [62]. However, bands between 17 and 21 kDa have been related to α and β subunits of C-phycocyanin and allophycocyanin biliproteins [21]. Similar profile bands (100, 50, 20, and 15 kDa) have been previously noted in spirulina protein extracts [63].

4.3. Food Prototypes Characterization

4.3.1. Mayonnaise

Before prototype elaboration, both the SPP emulsifying capacity (EC) (Figure 4A) and the sodium alginate (0.5%) viscosity at different pH values (5, 7, 9, and 11) were determined. Higher values (70%) of EC were found at pH 7 and 11. These results were higher than reported values for the same microalgae species (52%) but similar for Chlorella vulgaris (72%) [31]. Sodium alginate solutions showed no differences in viscosity (7.5 cP) at all pH ranges. Based on these results, a neutral pH (7) was selected for the “mayonnaise prototypes” preparation.
The formulated mayonnaises (Figure 4B) showed significantly higher viscosities using SBP (with both SB and chia seed oil) compared to SPP (Table 4). Even though a higher viscosity could prevent the oil droplets’ movement and thus coalescence in SBP emulsions [64], the smaller particle size in SPP was probably more of a determinant for its stability. However, no significant differences in the stability of the emulsions between types of oil were found. The emulsions selected for deeper characterization were with chia seed oil, for nutritional reasons (polyunsaturated fatty acids) and local product promotion.
The particle size distribution of both the SBP and SPP emulsions showed a monomodal behavior. Moreover, smaller particle size was found for the SPP emulsions (9.0 ± 0.02 µm) compared to SBP emulsions (17 ± 0.08 µm). Despite the differences in particle size, the stability of the emulsions after 14 days was similar (91%). The phase separation in emulsions can be influenced by many factors, such as the distance between droplets, the viscosity of the medium, and the attraction forces. Even though the SBP emulsions had a larger droplet size, the stability did not change, probably due to a higher density of the system that avoided the oil droplet’s movement and, thus, enabled coalescence [65]. Proteins have been used as active surface additives mainly in the food industry; however, the possible existence of a cooperative association with the charged polysaccharide (sodium alginate) could enhance the stability of the matrices [66]. Table 5 presents the color of the emulsions. Overall, SPP showed a higher color saturation (chroma: 16.4 ± 0.47) and a more greenish tone (hue, 104.2 ± 0.02) in comparison to the soy protein emulsions (11.3 ± 0.08 and 98.9 ± 0.42 for chroma and hue, respectively) due to the initial color of each protein isolate.

4.3.2. Fettuccine Pasta

The proximate composition and mineral content of pasta elaborated with different formulations are shown in Table 6. The incorporation of amaranth flour in the pasta (AWP) improved the nutritional profile (principally in protein, dietary fiber, and minerals) compared to the control samples (wheat flour). The AWP enriched with SPP at different levels increased the protein content from 15.26% (control) to 23.34 to 24.43%. This content of protein in the AWP was similar to pasta prepared with 80:20 amaranth and pea protein flour (25%); however, the fiber and fat content were lower (3.6 and 6% respectively) than in this study [67]. The addition of SPP significantly increased ash and reduced the carbohydrate content when compared to the control and the AWP. Even though there are no studies of pasta enriched with protein isolated from spirulina, pasta elaborated using spirulina biomass (10%) has shown lower protein values, fiber, and carbohydrates (14, 7.8, and 56%, respectively) and a higher content of fat (17%) than AWP-SPP (10%) [68]. Protein content reported for crostini bread prepared with 10% of spirulina was 16.7%, lower than the presented values in this study [69]. In addition to the protein compounds, one of the principal nutritional contributions of both amaranth flour and SPP in pasta was the mineral content denoted by the ash component (Table 6).
AWP contains comparable amounts of calcium as milk (125 mg/100 g) and beans (113 mg/100 g), which represents 10% of the RDA for adults (1000–1200 mg/day). AWP showed higher K (700 mg/100 g) than other food products recognized as rich in K (banana, fish, and potato with 358, 300, and 544 mg/100 g respectively), representing 20% of the RDA. This fact can be an important nutritional contribution of the product, as potassium intake has been related to health benefits such as decreasing the risk of suffering cardiovascular diseases and regulating blood pressure. Additionally, according to the RDA (3500 mg/day), it is an under-consumed mineral. Regarding iron, AWP (9–10 mg/100 g) covered the RDA (8 mg/day) and its content was higher than high-iron content products such as spinach (2.7 mg/100 g), and some animal sources such as chicken or beef (3.27 and 2.6 mg/100 g, respectively). However, it is well known that the hemo-iron present in animal sources has fewer interactions with phytochemicals or other minerals and is easily absorbed at the intestinal level [70]. Similarly to iron, magnesium reached the total RDA (300–420 mg/100 g), showing higher content than high Mg content foods such as almonds and beans, and comparable amounts to sesame and chia seeds (50 mg/100 g). Reports of wheat–amaranth pasta using similar proportions than in the present work (50:50) showed a lower content of both protein (16%) and K, Mg, and Fe (287, 265, and 5.3 mg/100 g, respectively) than AWP [71]. However, biscuits prepared with sorghum and spirulina biomass showed a lower protein content (13.7%) but similar contents of Ca (48 mg/100 g), Fe (4 mg/100 g), K (267 mg/100 g), and Mg (86 mg/100 g) minerals [72]. Both the substitution of wheat flour by amaranth and the addition of SPP improved the amino acid profile in the pasta samples (Table 7). The control pasta showed deficiencies in Val, Ile, and Leu amino acids compared to the essential amino acids (EAA) requirements for adults [73]. On the contrary, the AWP and AWP-SPP meet the daily recommendations.
The EAA enhancement using SPP in pasta was not significant for Val, Phe + Tyr, and Lys amino acids compared to the AWP samples. However, the highest amount of total EAA was observed when SPP was added to the mixture (AWP SPP-P10; 531 mg/g protein). These results were also higher than the protein-enriched pasta using 40% of pea protein (480 mg/g protein) and noodles made with 10% of fish protein flour (379 mg/g protein). However, Ile (46 mg/g protein), Leu (76 mg/g protein), Lys (45 mg/g protein), and aromatic amino acids (83 mg/g protein) contents were similar [74,75].
Although the texture of the AWP significantly decreased in hardness (0.28 N) compared to the control sample (1.5 N), the addition of SPP contributed to increasing it, mainly at 10% (0.38 N). The control pasta texture was in agreement with reported values for wheat flour pasta (1.48–1.86 N) [76] (Table 8). It is well known that gluten (present in wheat flour) is responsible for forming a dense network in the pasta dough that develops a structured network around the starch [77]. The replacement of wheat flour with gluten-free amaranth flour probably was the cause of hardness reduction. Despite the shape (fettuccini) of pasta being perfectly formed, other present elements such as the protein and soluble fiber in the materials probably provided the matrix consistency in our product. The changes in texture by protein increment in pasta have been related to protein–protein interactions, which, similarly to a protein–gluten complex, can form compact structures [78].
The color of the samples was also affected by the composition of the pasta dough. The lightness (L*) significantly decreased (p < 0.05) for both the AWP and the AWP-SPP at all concentrations compared to the control (Table 8). The same decreasing behavior occurred for the parameters a* and b*. The SPP enriched pasta showed negative a* values, representing a predominant green color, probably due to chlorophyll pigments or protein-pigments (C-phycocyanin) in the material [79]. The chroma (saturation) also decreased in the AWP, mainly with the addition of the spirulina protein. The hue (tone) of the AWP and the control showed similar values in the range of 80 ° and 90 °. The hue was increased above 100 ° in the SPP-enriched pasta; this hue tone indicates a greater green tonality for these samples. These behaviors have been previously reported in pasta and crostini bread fortified with spirulina biomass as a protein source. In the pasta, the L* value reduced from 62.83 to 30.72, while a* and b* values ranged from 1.14–16.40 to −8.55–6.00, respectively [80]. Similar findings for crostini are reported, L* (69 to 26) a* (0.7–0.3), b* (16–1.2), and chroma (16–1.2) values decreased, and the hue (°) values were found in a range of 77–87 [69]. The hue angle for control and AWP were lower than 100 ° (79–85) compared to all SPP enriched pasta (≥100), indicating red-yellow color and higher saturation (chroma value). Even though some of the sensorial characteristics (color, texture, viscosity, etc.) of the developed products were desired, it is the product´s taste and acceptability of the consumer are also important; therefore, sensory evaluation should also be applied.

5. Conclusions

This study’s outcomes have shown the potential use of Spirulina platensis biomass as a sustainable source of protein for developing, in combination with other plant-based materials, highly nutritional food product prototypes.
Spirulina platensis protein (SPP) resulted as a desired emulsifier and stabilizer agent for emulsion-type systems comparable to the most commercially used protein in food products as a technofunctional additive. Both of the developed AWP and AWP-SPP10 pastas showed higher nutritional values compared to the control pasta. Even though the incorporation of SPP at the lowest levels (6 and 8%) was not significant in EAA and minerals, its presence improved the textural features of the pasta, and in the case of AWP-SPP10, the total EAA amino acids content and most of the minerals enhanced the overall quality of the product. The nutritional profile of the formulated pasta according to its protein and minerals content could contribute to meet the requirements for the most vulnerable populations such as pregnant and breastfeeding women, the elderly, children, and especially in low-income regions.

Author Contributions

Analytical methods development, data analysis, and the writing of the manuscript, M.M.R.-R.; preformation and analysis of the pasta prototypes, C.E.-B.; experimental work related to protein extraction characterization, J.M.-O.; data analysis and writing collaboration of the manuscript, A.P.-A.; design of the study related to biomass material, protein extraction, characterization, food prototypes, draft of the manuscript, and discussion and interpretation of the results, D.K.B.-A. All authors have read and agreed to the published version of the manuscript.

Funding

The Mexican National Council of Science and Technology (CONACYT) funded this research, under project grant FOINS 4950.

Institutional Review Board Statement

Not applicable.

Informed Consent Statement

Not applicable.

Data Availability Statement

Not applicable.

Acknowledgments

Formal analysis, C.E.-B.; Funding acquisition, D.K.B.-A.; Investigation, D.K.B.-A.; Methodology, J.M.-O. and A.P.-A.; Validation, M.M.R.-R.; Writing–original draft, J.M.-O. and A.P.-A.; Writing–review and editing, M.M.R.-R. and D.K.B.-A. All authors have read and agreed to the published version of the manuscript. The authors would like to acknowledge Roberta Fonseca-Toussaint for her collaboration in the experimental work; we also acknowledge Fundación Universidad de las Américas Puebla for the infrastructure and equipment provided and the Food Analysis Laboratory, Intema S.A. de C.V. for their contribution in S. platensis amino acid and fatty acid profiles quantification.

Conflicts of Interest

The authors declare no conflict of interest in the present publication.

References

  1. Lonnie, M.; Hooker, E.; Brunstrom, J.M.; Corfe, B.M.; Green, M.A.; Watson, A.W.; Williams, E.A.; Stevenson, E.J.; Penson, S.; Johnstone, A.M. Protein for Life: Review of Optimal Protein Intake, Sustainable Dietary Sources and the Effect on Appetite in Ageing Adults. Nutrients 2018, 10, 360. [Google Scholar] [CrossRef] [Green Version]
  2. Ibañez, E.; Cifuentes, A. Benefits of using algae as natural sources of functional ingredients. J. Sci. Food. Agric. 2013, 93, 703–709. [Google Scholar] [CrossRef] [PubMed] [Green Version]
  3. Premanandh, J. Factors affecting food security and contribution of modern technologies in food sustainability. J. Sci. Food. Agric. 2011, 91, 2707–2714. [Google Scholar] [CrossRef] [PubMed]
  4. Zhu, X.; van Wesenbeeck, L.; van Ierland, E.C. Impacts of Novel Protein Foods on Sustainable Food Production and Consumption: Lifestyle Change and Environmental Policy. Environ. Resour. Econ. 2006, 35, 59–87. [Google Scholar] [CrossRef]
  5. Bilali, H.E.; Callenius, C.; Strassner, C.; Probst, L. Food and nutrition security and sustainability transitions in food systems. Food. Energy. Secur. 2019, 8, e00154. [Google Scholar] [CrossRef] [Green Version]
  6. Torres-Tiji, Y.; Fields, F.J.; Mayfield, S.P. Microalgae as a future food source. Biotechnol. Adv. 2020, 41, 107536. [Google Scholar] [CrossRef]
  7. FAO. The State of World Fisheries and Aquaculture 2020. Sustain. Action 2020. [Google Scholar] [CrossRef]
  8. Van der Spiegel, M.; Noordam, M.; van der Fels-Klerx, H. Safety of Novel Protein Sources (Insects, Microalgae, Seaweed, Duckweed, and Rapeseed) and Legislative Aspects for Their Application in Food and Feed Production. Compr. Rev. Food Sci. Food Saf. 2013, 12, 662–678. [Google Scholar] [CrossRef]
  9. Grasso, A.C.; Hung, Y.; Olthof, M.R.; Verbeke, W.; Brouwer, I.A. Older Consumers’ Readiness to Accept Alternative, More Sustainable Protein Sources in the European Union. Nutrients 2019, 11, 1904. [Google Scholar] [CrossRef] [Green Version]
  10. Amorim, M.L.; Soares, J.; Coimbra, J.S.D.R.; Leite, M.D.O.; Albino, L.F.T.; Martins, M.A. Microalgae proteins: Production, separation, isolation, quantification, and application in food and feed. Crit. Rev. Food Sci. Nutr. 2020, 1–27. [Google Scholar] [CrossRef]
  11. Batista, A.P.; Niccolai, A.; Fradinho, P.; Fragoso, S.; Bursic, I.; Rodolfi, L.; Biondi, N.; Tredici, M.R.; Sousa, I.; Raymundo, A. Microalgae biomass as an alternative ingredient in cookies: Sensory, physical and chemical properties, antioxidant activity and in vitro digestibility. Algal. Res. 2017, 26, 161–171. [Google Scholar] [CrossRef]
  12. Liber, J.A.; Bryson, A.E.; Bonito, G.; Du, Z. Harvesting Microalgae for Food and Energy Products. Small Methods 2020, 2000349. [Google Scholar] [CrossRef]
  13. García, J.L.; de Vicente, M.; Galán, B. Microalgae, old sustainable food and fashion nutraceuticals. Microb. Biotechnol. 2017, 10, 1017–1024. [Google Scholar] [CrossRef] [Green Version]
  14. De Marco Castro, E.; Shannon, E.; Abu-Ghannam, N. Effect of Fermentation on Enhancing the Nutraceutical Properties of Arthrospira platensis (Spirulina). Fermentation 2019, 5, 28. [Google Scholar] [CrossRef] [Green Version]
  15. Nicoletti, M. Microalgae Nutraceuticals. Foods 2016, 5, 54. [Google Scholar] [CrossRef]
  16. Papalia, T.; Sidari, R.; Panuccio, M.R. Impact of Different Storage Methods on Bioactive Compounds in Arthrospira platensis Biomass. Molecules 2019, 24, 2810. [Google Scholar] [CrossRef] [PubMed] [Green Version]
  17. Ljubic, A.; Safafar, H.; Holdt, S.L.; Jacobsen, C. Biomass composition of Arthrospira platensis during cultivation on industrial process water and harvesting. J. Appl. Phycol. 2018, 30, 943–954. [Google Scholar] [CrossRef] [Green Version]
  18. Nethravathy, M.U.; Mehar, J.G.; Mudliar, S.N.; Shekh, A.Y. Recent Advances in Microalgal Bioactives for Food, Feed, and Healthcare Products: Commercial Potential, Market Space, and Sustainability. Compr. Rev. Food Sci. Food Saf. 2019, 18, 1882–1897. [Google Scholar] [CrossRef] [Green Version]
  19. Bernaerts, T.M.M.; Gheysen, L.; Foubert, I.; Hendrickx, M.E.; van Loey, A.M. The potential of microalgae and their biopolymers as structuring ingredients in food: A review. Biotechnol. Adv. 2019, 37, 107419. [Google Scholar] [CrossRef]
  20. Hamed, I.; Özogul, F.; Özogul, Y.; Regenstein, J.M. Marine Bioactive Compounds and Their Health Benefits: A Review. Compr Rev. Food Sci. Food Saf. 2015, 14, 446–465. [Google Scholar] [CrossRef]
  21. Michalak, I.; Chojnacka, K. Algae as production systems of bioactive compounds. Eng. Life Sci. 2015, 15, 160–176. [Google Scholar] [CrossRef]
  22. Teuling, E.; Schrama, J.W.; Gruppen, H.; Wierenga, P.A. Characterizing emulsion properties of microalgal and cyanobacterial protein isolates. Algal. Res. 2019, 39, 101471. [Google Scholar] [CrossRef]
  23. Christaki, E.; Bonos, E.; Giannenas, I.; Florou-Paneri, P. Functional properties of carotenoids originating from algae. J. Sci. Food Agric. 2013, 93, 5–11. [Google Scholar] [CrossRef] [PubMed]
  24. Madeira, M.S.; Cardoso, C.; Lopes, P.A.; Coelho, D.; Afonso, C.; Bandarra, N.M.; Prates, J.A.M. Microalgae as feed ingredients for livestock production and meat quality: A review. Livest. Sci. 2017, 205, 111–121. [Google Scholar] [CrossRef]
  25. Edelmann, M.; Aalto, S.; Chamlagain, B.; Kariluoto, S.; Piironen, V. Riboflavin, niacin, folate and vitamin B12 in commercial microalgae powders. J. Food Compos. Anal. 2019, 82, 103226. [Google Scholar] [CrossRef]
  26. Fradique, M.; Batista, A.P.; Nunes, M.C.; Gouveia, L.; Bandarra, N.M.; Raymundo, A. Incorporation of Chlorella vulgaris and Spirulina maxima biomass in pasta products. Part 1: Preparation and evaluation. J. Sci. Food Agric. 2010, 90, 1656–1664. [Google Scholar] [CrossRef]
  27. Thirumdas, R.; Brnčić, M.; Brnčić, S.R.; Barba, F.J.; Gálvez, F.; Zamuz, S.; Lacomba, R.; Lorenzo, J.M. Evaluating the impact of vegetal and microalgae protein sources on proximate composition, amino acid profile, and physicochemical properties of fermented Spanish “chorizo” sausages. J. Food Process. Preserv. 2018, 42, e13817. [Google Scholar] [CrossRef]
  28. Hussein, A.; Ibrahim, G.; Kamil, M.; El-Shamarka, M.; Mostafa, S.; Mohamed, D. Spirulina-Enriched Pasta as Functional Food Rich in Protein and Antioxidant. Biointerface Res. Appl. Chem. 2021, 11, 14736–14750. [Google Scholar] [CrossRef]
  29. Martelli, F.; Cirlini, M.; Lazzi, C.; Neviani, E.; Bernini, V. Solid-State Fermentation of Arthrospira platensis to Implement New Food Products: Evaluation of Stabilization Treatments and Bacterial Growth on the Volatile Fraction. Foods 2021, 10, 67. [Google Scholar] [CrossRef]
  30. AOAC. Official Methods of Analysis; Association of Official Analytical Chemists: Washington, DC, USA, 1977. [Google Scholar]
  31. Benelhadj, S.; Gharsallaoui, A.; Degraeve, P.; Attia, H.; Ghorbel, D. Effect of pH on the functional properties of Arthrospira (Spirulina) platensis protein isolate. Food Chem. 2016, 194, 1056–1063. [Google Scholar] [CrossRef]
  32. Peterson, G.L. A simplification of the protein assay method of Lowry et al. which is more generally applicable. Anal. Biochem. 1977, 83, 346–356. [Google Scholar] [CrossRef]
  33. Waterborg, J.H.; Matthews, H.R. The lowry method for protein quantitation. Methods Mol. Biol 1984, 1, 1–3. [Google Scholar]
  34. Wang, X.; Ma, J.; Bai, X.; Yan, H.; Qin, C.; Ren, D. Antioxidant properties of astaxanthin produced by cofermentation between Spirulina platensis and recombinant Saccharomyces cerevisiae against mouse macrophage RAW 264.7 damaged by H2O2. Food Bioprod. Process 2019, 118, 318–325. [Google Scholar] [CrossRef]
  35. Yin, S.W.; Tang, C.H.; Wen, Q.B.; Yang, X.Q.; Yuan, D.B. The relationships between physicochemical properties and conformational features of succinylated and acetylated kidney bean (Phaseolus vulgaris L.) protein isolates. Food Res. Int. 2010, 43, 730–738. [Google Scholar] [CrossRef]
  36. Kaptso, K.G.; Njintang, Y.N.; Nguemtchouin, M.M.G.; Scher, J.; Hounhouigan, J.; Mbofung, C.M. Physicochemical and micro-structural properties of flours, starch and proteins from two varieties of legumes: Bambara groundnut (Vigna subterranea). J. Food Sci. Technol. 2015, 52, 4915–4924. [Google Scholar] [CrossRef] [Green Version]
  37. Wang, T.; Jonsdottir, R.; Olafsdottir, G.; Kristinsson, H.G. Antioxidant properties of marine macroalgae. In Antioxidants and Functional Components in Aquatic Foods; Kristinsson, H.G., Ed.; John Wiley & Sons, Ltd.: Chichester, UK, 2014; pp. 283–317. [Google Scholar] [CrossRef]
  38. Arribas, C.; Cabellos, B.; Cuadrado, C.; Guillamón, E.; Pedrosa, M.M. Cooking Effect on the Bioactive Compounds, Texture, and Color Properties of Cold-Extruded Rice/Bean-Based Pasta Supplemented with Whole Carob Fruit. Foods 2020, 9, 415. [Google Scholar] [CrossRef] [Green Version]
  39. Hernández-Nava, R.; López-Malo, A.; Palou, E.; Ramírez-Corona, N.; Jiménez-Munguía, M.T. Encapsulation of oregano essential oil (Origanum vulgare) by complex coacervation between gelatin and chia mucilage and its properties after spray drying. Food Hydrocoll. 2020, 109, 106077. [Google Scholar] [CrossRef]
  40. Vélez-Erazo, E.M.; Bosqui, K.; Rabelo, R.S.; Kurozawa, L.E.; Hubinger, M.D. High internal phase emulsions (HIPE) using pea protein and different polysaccharides as stabilizers. Food Hydrocoll. 2020, 105, 105775. [Google Scholar] [CrossRef]
  41. Pathare, P.B.; Opara, U.L.; Al-Said, F.A.J. Colour Measurement and Analysis in Fresh and Processed Foods: A Review. Food Bioprocess. Technol. 2013, 6, 36–60. [Google Scholar] [CrossRef]
  42. Matsushita, K. Automatic precolumn derivatization of amino acids and analysis by fast LC using the Agilent 1290 Infinity LC system. Agil. Technol. 2010, 5990, 1–4. [Google Scholar]
  43. Volkmann, H.; Imianovsky, U.; Oliveira, J.L.B.; Sant’Anna, E.S. Cultivation of Arthrospira (spirulina) platensis in desalinator wastewater and salinated synthetic medium: Protein content and amino-acid profile. Braz. J. Microbiol. 2008, 39, 98–101. [Google Scholar] [CrossRef] [Green Version]
  44. Aouir, A.; Amiali, M.; Bitam, A.; Benchabane, A.; Raghavan, V.G. Comparison of the biochemical composition of different Arthrospira platensis strains from Algeria, Chad and the USA. J. Food Meas. Charact. 2017, 11, 913–923. [Google Scholar] [CrossRef]
  45. Bhakar, R.; Kumar, R.; Pabbi, S. Total Lipids and Fatty Acid Profile of Different Spirulina Strains as Affected By Salinity and Incubation Time. Vegetos Int. J. Plant. Res. 2013, 26, 148. [Google Scholar] [CrossRef]
  46. Jung, F.; Krüger-Genge, A.; Waldeck, P.; Küpper, J.-H. Spirulina platensis, a super food? J. Cell Biotechnol. 2019, 5, 43–54. [Google Scholar] [CrossRef]
  47. Marles, R.J. Mineral nutrient composition of vegetables, fruits and grains: The context of reports of apparent historical declines. J. Food Compos. Anal. 2017, 56, 93–103. [Google Scholar] [CrossRef]
  48. Delrue, F.; Alaux, E.; Moudjaoui, L.; Gaignard, C.; Fleury, G.; Perilhou, A.; Richaud, P.; Petitjean, M.; Sassi, J.-F. Optimization of Arthrospira platensis (Spirulina) Growth: From Laboratory Scale to Pilot Scale. Fermentation 2017, 3, 59. [Google Scholar] [CrossRef] [Green Version]
  49. Lupatini, A.L.; Colla, L.M.; Canan, C.; Colla, E. Potential application of microalga Spirulina platensis as a protein source. J. Sci Food Agric. 2017, 97, 724–732. [Google Scholar] [CrossRef]
  50. Colla, L.M.; Oliveira Reinehr, C.; Reichert, C.; Costa, J.A.V. Production of biomass and nutraceutical compounds by Spirulina platensis under different temperature and nitrogen regimes. Bioresour. Technol. 2007, 98, 1489–1493. [Google Scholar] [CrossRef]
  51. Diraman, H.; Koru, E.; Dibeklioglu, H. Fatty Acid Profile of Spirulina platensis Used as a Food Supplement. Isr. J. Aquac. Bamidgeh. 2009, 61, 134–142. [Google Scholar]
  52. Choopani, A.; Poorsoltan, M.; Fazilati, M.; Latifi, A.M.; Salavati, H. Spirulina: A Source of Gamma-linoleic Acid and Its Applications. J. Appl Biotechnol. Rep. 2016, 3, 483–488. [Google Scholar]
  53. Oliveira, M.A.C.L.d.; Monteiro, M.P.C.; Robbs, P.G.; Leite, S.G.F. Growth and Chemical Composition of Spirulina Maxima and Spirulina Platensis Biomass at Different Temperatures. Aquac. Int. 1999, 7, 261–275. [Google Scholar] [CrossRef]
  54. Safi, C.; Ursu, A.V.; Laroche, C.; Zebib, B.; Merah, O.; Pontalier, P.-Y.; Vaca-Garcia, C. Aqueous extraction of proteins from microalgae: Effect of different cell disruption methods. Algal. Res. 2014, 3, 61–65. [Google Scholar] [CrossRef] [Green Version]
  55. Bataller, B.G.; Capareda, S.C. A rapid and non-destructive method for quantifying biomolecules in Spirulina platensis via Fourier transform infrared—Attenuated total reflectance spectroscopy. Algal. Res. 2018, 32, 341–352. [Google Scholar] [CrossRef]
  56. Chronakis, I. Gelation of Edible Blue-Green Algae Protein Isolate (Spirulina platensis Strain Pacifica): Thermal Transitions, Rheological Properties, and Molecular Forces Involved. J. Agric. Food Chem. 2001, 49, 888–898. [Google Scholar] [CrossRef]
  57. Nham Tran, T.L.; Miranda, A.F.; Mouradov, A.; Adhikari, B. Physicochemical Characteristics of Protein Isolated from Thraustochytrid Oilcake. Foods 2020, 9, 779. [Google Scholar] [CrossRef]
  58. Mota da Silva, A.M.; Souza Almeida, F.; Kawazoe Sato, A.C. Functional characterization of commercial plant proteins and their application on stabilization of emulsions. J. Food Eng. 2021, 292, 110277. [Google Scholar] [CrossRef]
  59. Hematian Sourki, A.; Rahmanian, M. Kinetic studies on palm heart protein solubility and investigation of physicochemical, functional and thermal properties of palm heart protein isolate. J. Food Sci Technol. 2019, 56, 1820–1828. [Google Scholar] [CrossRef]
  60. Li, S.; Wei, Y.; Fang, Y.; Zhang, W.; Zhang, B. DSC study on the thermal properties of soybean protein isolates/corn starch mixture. J. Therm. Anal. Calorim. 2014, 115, 1633–1638. [Google Scholar] [CrossRef]
  61. Rajakumar, M.S.; Muthukumar, K. Influence of pre-soaking conditions on ultrasonic extraction of Spirulina platensis proteins and its recovery using aqueous biphasic system. Sep. Sci. Technol. 2018, 53, 2034–2043. [Google Scholar] [CrossRef]
  62. Demirevska, K.; Zasheva, D.; Dimitrov, R.; Simova-Stoilova, L.; Stamenova, M.; Feller, U. Drought stress effects on Rubisco in wheat: Changes in the Rubisco large subunit. Acta Physiol Plant. 2009, 31, 1129. [Google Scholar] [CrossRef]
  63. Barka, A.; Amira, A.B.; Francis, F.; Blecker, C. Physicochemical characterization of colored soluble protein fractions extracted from Spirulina (Spirulina platensis). Food Sci Technol Int. 2018, 24, 651–663. [Google Scholar] [CrossRef]
  64. Sriprablom, J.; Luangpituksa, P.; Wongkongkatep, J.; Pongtharangkul, T.; Suphantharika, M. Influence of pH and ionic strength on the physical and rheological properties and stability of whey protein stabilized o/w emulsions containing xanthan gum. J. Food Eng. 2019, 242, 141–152. [Google Scholar] [CrossRef]
  65. Freitas, M.L.F.; Albano, K.M.; Telis, V.R.N. Characterization of biopolymers and soy protein isolate-high-methoxyl pectin complex. Polímeros 2017, 27, 62–67. [Google Scholar] [CrossRef]
  66. Albano, K.M.; Cavallieri, Â.L.F.; Nicoletti, V.R. Electrostatic interaction between proteins and polysaccharides: Physicochemical aspects and applications in emulsion stabilization. Food Rev. Int. 2019, 35, 54–89. [Google Scholar] [CrossRef]
  67. Gupta, S.; Abu-Ghannam, N.; Scannell, A.G.M. Growth and kinetics of Lactobacillus plantarum in the fermentation of edible Irish brown seaweeds. Food Bioprod. Process. 2011, 89, 346–355. [Google Scholar] [CrossRef] [Green Version]
  68. Lemes, A.C.; Takeuchi, K.P.; Carvalho, J.C.M.D.; Danesi, E.D.G. Fresh pasta production enriched with Spirulina platensis biomass. Braz. Arch. Biol. Technol. 2012, 55, 741–750. [Google Scholar] [CrossRef]
  69. Niccolai, A.; Venturi, M.; Galli, V.; Pini, N.; Rodolfi, L.; Biondi, N.; D’Ottavio, M.; Batista, A.P.; Raymundo, A.; Granchi, L.; et al. Development of new microalgae-based sourdough “crostini”: Functional effects of Arthrospira platensis (spirulina) addition. Sci Rep. 2019, 9, 19433. [Google Scholar] [CrossRef]
  70. Shubham, K.; Anukiruthika, T.; Dutta, S.; Kashyap, A.V.; Moses, J.A.; Anandharamakrishnan, C. Iron deficiency anemia: A comprehensive review on iron absorption, bioavailability and emerging food fortification approaches. Trends Food Sci. Technol. 2020, 99, 58–75. [Google Scholar] [CrossRef]
  71. Cárdenas-Hernández, A.; Beta, T.; Loarca-Piña, G.; Castaño-Tostado, E.; Nieto-Barrera, J.O.; Mendoza, S. Improved functional properties of pasta: Enrichment with amaranth seed flour and dried amaranth leaves. J. Cereal. Sci. 2016, 72, 84–90. [Google Scholar] [CrossRef]
  72. Singh, P.; Singh, R.; Jha, A.; Rasane, P.; Gautam, A.K. Optimization of a process for high fibre and high protein biscuit. J. Food Sci. Technol. 2015, 52, 1394–1403. [Google Scholar] [CrossRef] [PubMed] [Green Version]
  73. FAO Expert Consultation. Dietary protein quality evaluation in human nutrition. FAO Food Nutr. Pap. 2013, 92, 1–66. [Google Scholar]
  74. Mahmud, A.; Girmatsion, M.; Abraha, B.; Mohammed, J.K.; Yang, F.; Xia, W. Fatty acid and amino acid profiles and digestible indispensable amino acid score of grass carp (Ctenopharyngodon idella) protein concentrate supplemented noodles. Food Meas. 2020, 14, 2370–2379. [Google Scholar] [CrossRef]
  75. Filip, S.; Vidrih, R. Amino Acid Composition of Protein-Enriched Dried Pasta: Is It Suitable for a Low-Carbohydrate Diet? Food Technol. Biotechnol. 2015, 53, 298–306. [Google Scholar] [CrossRef] [PubMed]
  76. Aranibar, C.; Pedrotti, F.; Archilla, M.; Vázquez, C.; Borneo, R.; Aguirre, A. Storage and preservation of dry pasta into biodegradable packaging made from triticale flour. J. Food Sci. Technol. 2020, 57, 693–701. [Google Scholar] [CrossRef] [PubMed]
  77. Tazrart, K.; Zaidi, F.; Salvador, A.; Haros, C.M. Effect of broad bean (Vicia faba) addition on starch properties and texture of dry and fresh pasta. Food Chem. 2019, 278, 476–481. [Google Scholar] [CrossRef] [PubMed] [Green Version]
  78. Rachman, A.; Brennan, M.; Morton, J.; Brennan, C. Gluten-free pasta production from banana and cassava flours with egg white protein and soy protein addition. Int. J. Food Sci. Technol. 2020, 55. [Google Scholar] [CrossRef]
  79. Martelli, F.; Favari, C.; Mena, P.; Guazzetti, S.; Ricci, A.; del Rio, D.; Lazzi, C.; Neviani, E.; Bernini, V. Antimicrobial and Fermentation Potential of Himanthalia elongata in Food Applications. Microorganisms 2020, 8, 248. [Google Scholar] [CrossRef] [Green Version]
  80. Zen, C.K.; Tiepo, C.B.V.; da Silva, R.V.; Reinehr, C.O.; Gutkoski, L.C.; Oro, T.; Colla, L.M. Development of functional pasta with microencapsulated Spirulina: Technological and sensorial effects. J. Sci. Food Agric. 2020, 100, 2018–2026. [Google Scholar] [CrossRef]
Figure 1. Experimental diagram of the methodology carried out on raw material (Spirulina biomass), protein isolates, and food systems. Green boxes represent the material and systems used and blue color boxes the characterization analyses.
Sustainability 13 06849 g001
Figure 2. Fourier Transform Infrared Spectroscopy (FTIR) spectra (A) and (B) thermal stability by Differential Scanning Calorimetry (DSC) of Spirulina platensis protein (SPP).
Sustainability 13 06849 g002
Figure 3. Protein molecular bands of Spirulina platensis protein (SPP) by SDS Polyacrylamide Gel Electrophoresis (SDS-PAGE). MW: molecular weight standard.
Sustainability 13 06849 g003
Figure 4. SPP-emulsions at different pH values (A) and mayonnaises (B) formulated with: SBP-chia oil (A), SBP-SB oil (B), SP-SB oil (C), and SPP-chia oil (D).
Sustainability 13 06849 g004
Table 1. Ingredients and proportions used for producing fettuccine pasta with amaranth flour (AWP) and spirulina platensis protein (SPP).
SampleWheat Flour (%)Amaranth Flour (%)Egg (%)Water (%)SPP (%)
Control700246-
AWP3535246-
AWP-SPP638381266
AWP-SPP837371268
AWP-SPP10363612610
Table 2. Emulsion formulations for viscosity and color analyses.
Protein TypeProtein Concentration
(%)
Sodium Alginate (%)Oil TypepH
SBP (A)0.50.5Chia7
SBP (B)0.50.5SB7
SPP (C)0.50.5Chia7
SPP (D)0.50.5SB7
SBP: soybean protein. SPP: Spirulina platensis protein. SB: soybean oil. Protein and sodium alginate concentrations are expressed as percentages (w/v).
Table 3. Spirulina platensis biomass composition.
Component%
Moisture7.16 ± 0.25
Ash7.68 ± 0.04
Protein47.04 ± 0.15
Lipids36.39 ± 0.00
Carbohydrates1.73 ± 0.36
Results are expressed as mean (n =3) and standard deviation (SD = ±).
Table 4. Fatty acid and mineral profiles of Spirulina platensis biomass.
ComponentContent
Fatty Acid Profileg/100 g *
Saturated fatty acids (SFA)--
PalmiticC16:037.09 ± 1.28
StearicC18:05.50 ± 0.14
ArachidicC20:06.24 ± 0.28
Total SFA-48.83
Monounsaturated fatty acids (MUFA)--
ElaidicC18:1 trans92.80 ± 0.11
OleicC18:1 cis92.34 ± 0.11
Total MUFA-5.14
Polyunsaturated fatty acids (PUFA)--
LinoleicC18:2 cis9,123.33 ± 0.14
α-LinolenicC18:3 cis9,12,154.28 ± 0.18
ϒ-LinolenicC18:3 cis6,9,1224.45 ± 1.20
EicosatetraenoicC20:4 cis5,8,11,1413.96 ± 0.67
Total PUFA-46.02
Mineral profile-mg/100 g
Sodium-2033.33 ± 35.36
Potasium-1675.00 ± 28.65
Phosphorus-728.22 ± 21.37
Magnesium-486.41 ± 20.51
Calcium-207.51 ± 3.54
Iron-16.27 ± 0.64
Manganese-1.09 ± 0.05
Zinc-0.19 ± 0.00
Selenium-0.08 ± 0.00
* The results of the fatty acid profile are expressed as g of fatty acid/100 g of total fat. The mineral profile results are given in mg of mineral/100 g of sample. Results are expressed as mean (n = 3) and standard deviation (SD = ±).
Table 5. Color analysis (L*, a*, b*, Hue, Chroma) of emulsions elaborated with different type of protein and oil.
SampleViscosity (cP)L*a*b*HueChroma
A1118 ± 40 a83.1 ± 0.3 a−2.58 ± 0.03 a11.1 ± 0.5 a103.13 ± 0.4 a11.4 ± 0.5 a
B978 ± 39 b84.55 ± 0.11 a−1.77 ± 0.07 b11.25 ± 0.09 a99.0 ± 0.4 b11.39 ± 0.08 a
C252 ± 11 c76.12 ± 0.15 b−4.05 ± 0.11 c15.6 ± 0.5 b104.3 ± 0.02 a16.5 ± 0.5 b
D245 ± 8 c43.8 ± 0.5 c−7.19 ± 0.03 d17.01 ± 0.07 c112.91 ± 0.14 c18.46 ± 0.05 c
Different superscript letters (a, b, c, d) in the same column represents significant differences (p < 0.05). Results are expressed as mean (n =3) and standard deviation (SD = ±).
Table 6. Proximate composition and mineral content of different pasta formulations.
ComponentControlAWPAWP-SPP6SPP-P 8%SPP-P 10%
Moisture (%)7.67 ± 0.01 a8.0 ± 0.9 a7.3 ± 0.3 a7.3 ± 0.3 a7.4 ± 0.5 a
Ash (%)0.91 ± 0.02 a2.66 ± 0.007 b2.87 ± 0.01 c2.96 ± 0.09 cd3.07 ± 0.08 d
Protein (%)15.26 ± 0.02 a20.8 ± 0.4 b23.34 ± 0.15 c24.4 ± 0.7 c24.6 ± 0.7 c
Fat (%)4.05 ± 0.16 a8.1 ± 0.4 b7.8 ± 0.2 b8.3 ± 0.6 b8.6 ± 0.6 b
Carbohydrates (%)72.1 ± 0.5 a60.5 ± 0.9 b58.69 ± 0.14 c57.0 ± 1.0 c 56.4 ± 1.9 c
Dietary Fibre (%)5.0 ± 0.8 a8.3 ± 1.0 b9.4 ± 0.5 b10.0± 1.4 b9.3 ± 0.8 b
Minerals (mg/100 g of sample)
Na73.5 ± 2.6 a102 ± 12 b111 ± 3 b138 ± 6 c125 ± 20 bc
K317.1 ± 20.4 a602 ± 93 b705 ± 47 b727 ± 53 b731 ± 73 b
Ca35.1 ± 0.5 a98 ± 8. b99.0 ± 0.6 b105 ± 4 b102.9 ± 1.0 b
Fe7.39 ± 0.09 a8.5 ± 0.2 b8.7 ± 0.5 b9.4 ± 0.4 bc10.3 ± 0.6 c
Mg63 ± 2 a367 ± 4 b382 ± 13 bc388 ± 5 c403 ± 6 d
P421.3 ± 15.6 a428 ± 27 a424 ± 15 a444 ± 6 a452 ± 17 a
Different superscript letters (a, b, c, d) in the same row represents significant differences (p < 0.05). Results are expressed as mean (n = 3) and standard deviation (SD = ±).
Table 7. Amino acid composition (mg/g crude protein) of different pasta formulation.
Amino acidControlAWPAWP-SPP6AWP-SPP8AWP-SPP10EAA* RDA (Adults)
Essential------
His37.5 ± 1.0 a29.86 ± 0.05 b23.8 ± 0.3 c22.0 ± 0.4 b49 ± 3 d15
Thr15.9 ± 0.3 a25.8 ± 1.7 b62.2 ± 3.6 c70 ± 3.0 d83 ± 4 e23
Val28.0 ± 0.4 a38 ± 4 b35.7 ± 1.2 b36.0 ± 1.1 b39.3 ± 1.5 b39
Met + Cys90.4 ± 0.6 a77.0 ± 0.7 b79.8 ± 0.6 b70.7 ± 0.9 c115 ± 3 b22
Phe + Tyr66.3 ± 0.8 a83 ± 2 b59 ± 3.0 c74 ± 2 d83 ± 2 b38
Ile16.9 ± 0.6 a32.8 ± 1.8 b23.8 ± 1.4 c39.4 ± 1.7 d41.4 ± 1.2 d30
Leu54.4 ± 1.0 a59 ± 2 ab64 ± 2 b65 ± 3 b76 ± 3 c59
Lys40.8 ± 0.8 a48 ± 3 b41.2 ± 1.3 a39 ± 2 a46 ± 2 b45
∑EAA 350.07 392.49 389.88 416.06 531.70 271
Non-essential------
Asp37.3 ± 1.7 a78.7 ± 0.9 b71 ± 4 c69.2 ± 0.7 c66.0 ± 1.6 c-
Glu212 ± 3.0 a202.7 ± 1.4 a180 ± 10 b186.6 ± 1.3 b207.4 ± 1.5 a-
Ser66 ± 1.6 ab60.5 ± 1.5 b68 ± 5 a70.6 ± 0.9 a71.9 ± 1.6 a-
Gln8.0 ± 0.2 a14.4 ± 1.9 b9.1 ± 1.0 a20.2 ± 1.3 d28 ± 3 e-
Gly70 ± 3.a81.1 ± 0.5 b88 ± 4 b81.7 ± 1.3 b156 ± 3 c-
Arg34.4 ± 0.6 a99. ± 4 b103 ± 6 b102 ± 2 b123.4 ± 1.7 c-
Ala20.0 ± 0.8 a59.1 ± 0.2 b54 ± 4 b55.3 ± 1.5 b66 ± 3 c-
Tyr18.2 ± 0.5 a35 ± 3 b25 ± 2 c29.5 ± 1.3 c34.6 ± 1.5 b-
Pro31.6 ± 1.0 a34.2 ± 1.4 b34.8 ± 0.6 b32.86 ± 0.04 ab37.55 ± 0.08 c-
Results are expressed as mg of amino acid per g of protein (mg/g). EEA = Essential amino acid requirements for adults. * RDA = Recommended Dietary Allowances [73]. Different superscript letters (a, b, c, d, e) in the same row are significantly different (p < 0.05). Results are expressed as mean (n = q3) and standard deviation (SD = ±).
Table 8. Color and texture of different pasta formulation.
SampleHardness (N)L*a*b*ChromaHue (°)
Control1.3 ± 0.2 a64.8 ± 1.6 a2.51 ± 0.11 a26 ± 2 a26 ± 2 a86.0 ± 0.5 a
AWP0.25 ± 0.02 b56.1 ± 0.8 b1.8 ± 0.3 b20 ± 2 b20 ± 2 b82.8 ± 1.2 a
AWP-SPP-P60.35 ± 0.04 c43.4 ± 0.4 c−1.7 ± 0.3 c5.9 ± 0.2 c6.2 ± 0.2 c106 ± 3 b
AWP-SPP-P80.35 ± 0.08 c35.4 ± 0.6 d−2.3 ± 0.3 d6.0 ± 1.0 c6.1 ± 0.9 c112 ± 5 b
AWP-SPP-P100.41 ± 0.08 c42.9 ± 0.9 c−2.19 ± 0.04 cd3.5 ± 0.4 c4.10 ± 0.06 c122 ± 3 c
Different superscript letters (a, b, c, d) in the same column represents significant difference (p < 0.05). Results are expressed as mean (n = 3) and standard deviation (SD = ±).
Publisher’s Note: MDPI stays neutral with regard to jurisdictional claims in published maps and institutional affiliations.

