Article

Characterization of Ionic Exchange and Macroporous Resins for Their Application on the Separation and Recovery of Chlorogenic Acid from the Wastewater of Artichoke Blanching

by
Antonio D. Rodriguez-Lopez
1,*,
Milagro Reig
2,
Luis Mayor
3,
Mireia Ortiz-Climent
2 and
Esperanza M. Garcia-Castello
2,*
1
Research Institute for Industrial, Radiophysical and Environmental Safety (ISIRYM), Universitat Politècnica de València, Camino de Vera, s/n, CP 46022 Valencia, Spain
2
Institute of Food Engineering for Development (IIAD), Universitat Politècnica de València, Camino de Vera, s/n, CP 46022 Valencia, Spain
3
ISEKI-Food Association, Muthgasse, 18, A-1190 Vienna, Austria
*
Authors to whom correspondence should be addressed.
Sustainability 2021, 13(16), 8928; https://doi.org/10.3390/su13168928
Submission received: 29 June 2021 / Revised: 22 July 2021 / Accepted: 4 August 2021 / Published: 10 August 2021

Abstract

:
Food wastes have traditionally been considered as dead-end materials; however, recent international, national, and regional policies strongly promote the use of these wastes as potential resources. This change of perception considers the need for sustainable exploitation of natural resources. In this context, artichoke processing produces high amounts of wastewaters, and specifically, wastewaters from the artichoke blanching step present a high content of valuable biocomponents such as carbohydrates and phenolic compounds (e.g., chlorogenic acid, 1700 ppm). In this work, the recovery of chlorogenic acid by applying sorption processes was studied. Five resins were tested, and it was found that the resin XAD 7 HP presented the best total adsorption-desorption yield (72.8%) at 20 °C. It was also found that there was a strong variation of the adsorption ratio depending on solution pH (3–7). Four models of isotherms were applied to the adsorption processes, and the Langmuir isotherm better explained the adsorption behavior. The kinetic study showed that the adsorption and desorption of chlorogenic acid followed a pseudo-second order model where the kinetic constant depended on the adsorbate concentration. In addition, it was found that the sorption process was controlled by more than just the intraparticle diffusion mechanism.

1. Introduction

The agri-food sector produces large amounts of liquid and solid wastes that contain different substances with high added value [1]. Due to their organic composition, these wastes provoke serious environmental issues in their disposal, such as eutrophication [2] and greenhouse gas emissions [3]. Therefore, one of the main goals of the United Nations is to achieve a more sustainable world by 2030 by reducing food waste production and disposal [4]. The first step is to change the lineal production system to a closed-loop and more sustainable production, and for that, it is necessary to consider wastes as a source of raw materials and keep in mind the use of wastes as by-products to obtain valuable compounds for the food industry or even for other sectors such as polymer production or pharmaceuticals [5].
Artichoke (Cynara scolymus L.) cultivars are widely present in the Mediterranean area; Italy, Egypt and Spain are the main producers and manufacturers, with 52% of world production in 2019 [6]. During the artichoke processing, large amounts of solid residues (leaves, external bracts, stems, etc.) and wastewater as blanching effluents are generated [7]. The valorization of these residues is commonly targeted to animal feedstuff, ensilage, fiber, and energy production.
There are several studies that confirm that artichoke wastes are rich in bioactive compounds such as inulin, phenolic compounds, and sugars [8]. Conidi et al. (2014) proposed an integrated process based on membrane technology for the recovery of phenolic compounds and sugars. This process consisted of an ultrafiltration (UF) step and a later nanofiltration (NF) step [9]. They found that chlorogenic acid (CA) and apigenin 7-O-glucoside (AOG) were by far, the most abundant phenolic compounds in the retentate of the NF process; specifically, CA concentration was six folds higher than AOG concentration. Conidi et al. (2015) obtained promising results in their study on the application of adsorption resins to fractionate, purify, and concentrate both CA and AOG polyphenols [10].
The present work aimed to the study the performance of five adsorbent resins for the recovery of CA based on the operation conditions leading to the best adsorption-desorption results. In addition, the pH effect on the adsorption step was evaluated. Finally, CA adsorption isotherms and kinetics studies (adsorption and desorption processes) were carried out.

2. Materials and Methods

2.1. Feed Solution

For the resin performance and pH effect studies, a synthetic feed solution was prepared according the composition of polyphenols in the retentate obtained from nanofiltration of artichoke wastewater [10]. This feed solution was obtained by dissolving chlorogenic acid (VWR Prolabo, Fontenay-sous-Bois, France) with distilled water to reach a solution of CA of 1.5 mg/mL. For the other assays (isotherms and kinetic studies), different CA concentrations were prepared (1.3, 2.0, 2.5, 4.0, 6.0, and 8.0 mg/mL).

2.2. Adsorbents

For the resins performance study, five resins were tested: S 2328, S6328 A, S7968, XAD 7HP, and XAD 16HP N. These resins were selected based on previous studies on the recovery of different bioactive compounds present in foods and their wastes [10,11,12,13,14,15,16,17,18].
Lewatit S 6328 A, S 2328, and S 7968 resins were kindly provided by Lanxess (Leverkusen, Germany) and are based on crosslinked polystyrene. Amberlite XAD 7HP, kindly supplied by Rohm and Haas (Dow Chemical, Midland, Michigan, USA), is based on a non-ionic aliphatic acrylic polymer with a matrix consisting of a macroreticular aliphatic crosslinked polymer. Amberlite XAD 16HP N, also provided by Rohm and Haas, is a polymeric non-ionic, hydrophobic resin with a macroporous crosslinked polystyrene copolymer matrix. Table 1 lists the main characteristics of the used adsorption resin.
Before starting up the resins, they were all washed with distilled water. A chromatographic column, 20 mm diameter × 30 cm height, was prepared. For the conditioning of the clean resin, 15 g (wet basis, w.b.) of the resin was charged in the chromatographic column, and then it was contacted with the conditioning solutions indicated in Table 1 according to the procedure given by the suppliers. Prepared solutions for each resin were passed through the resin in the column and when two solutions were needed (S 6328A, S 7968, XAD 7HP, and XAD 16HP N), a rinsing with distilled water was completed in between.
After the conditioning step, distilled water was passed through the resins until reaching an eluent with a pH close to distilled water. Afterwards, resins were dried at room temperature for 48 h and then dried in a vacuum oven (Vaciotem-T, J.P. Selecta, Abrera, Barcelona, Spain) at 60 °C until a constant weight was achieved. Dried resins were stored in hermetic containers until their use in further experiments.

2.3. Resin Performance

First, 1 g of started-up, dried resin was soaked with 24 mL of 95% ethanol for 12 h and then was strongly rinsed with distilled water. Then, the resin and 20 mL of the feed solution (1.5 mg/mL CA) were introduced into a flask that was stirred in a reciprocating manner (HS 501 digital, IKA, Staufen, Germany) at 120 rpm and room temperature (20 ± 2 °C) for 24 h (adsorption equilibrium time). Aliquots of the solution in contact with the resin were taken out to determine the concentration of the non-adsorbed CA. These aliquots were stored at −18°C for a later analysis by HPLC.
The adsorption progress was determined in terms of two parameters: the adsorption ratio, AR (%) (Equation (1); and the adsorption capacity, Qt.a (mg CA/g resin dried basis (d.b.)) (Equation (2)) that represents the amount of adsorbed CA per weight of resin on a dried basis [20,21,22,23].
A R   ( % ) = C o C t . a C o · 100
Q t . a = ( C o C t . a ) · V o W
where Co and Ct.a (mg/mL) are the initial CA concentration (t = 0 h) and the CA concentration at any time (t = t h) in the feed solution, respectively; Vo (mL) is the volume of the feed solution, and W is the resin weight expressed on a dried basis (g (d.b.)).
After the adsorption process, resins were separated from the remaining feed solution and rinsed with distilled water. For the desorption process, resin was introduced into a flask with 20 mL of 96° ethanol. The mixture was stirred under the same conditions as those for the adsorption process (120 rpm and 20 °C) but for a desorption equilibrium time of 4 h. Aliquots in contact with resin were taken out from the solution and then stored at −18 °C until a later analysis by HPLC. Desorption ratio, DR (%), and desorption capacity, Qt.d (mg CA/g resin (d.b.), (mg/g)), were calculated according to Equations (3) and (4) [20,21,22,23].
D R   ( % ) = C t . d · V d ( C o C e . a ) · V o · 100
Q t . d = C t . d · V d W
where Ct.d (mg/mL) is the CA concentration in the desorption solution at any time and Vd (mL) is the volume of the desorption solution.
After the analysis of CA concentration of adsorption and desorption aliquots, AR, DR, adsorption capacity (Qe.a = Qt.a (24 h)), and desorption capacity (Qe.d = Qt.d (4 h)) parameters were calculated for the five resins studied. On the basis of Equations (1)–(4), the resin giving the best performance for the adsorption and desorption processes was selected and used for a most extensive characterization: effect of pH, adsorption isotherms, and kinetics of adsorption and desorption.

2.4. Effect of the pH on the Adsorption Process

Different feed solutions with the same CA concentration (1.5 mg/mL) at different pH values (3–7) were prepared by using HCl 0.01 N and 10% NaOH. Then, 1 g of the selected and dried resin was put in contact with 20 mL of a feed solution at a certain pH and stirred for 24 h at room temperature and 120 rpm. Then, feed solutions were stored at −18 °C for a later analysis. The pH leading to the best adsorption ratio was used in the adsorption isotherms and adsorption/desorption kinetics studies.

2.5. Adsorption Isotherms

Six feed solutions at different CA concentrations (1.3, 2.0, 2.5, 4.0, 6.0, and 8.0 mg/mL) were prepared. Then, 1 g of the selected dried resin was put in contact with 24 mL of each one of the feed solutions previously prepared. Mixtures were stirred at 120 rpm and at room temperature (20 ± 2 °C) for 24 h. Samples of all mixtures were taken to determine the equilibrium concentration (Ce.a), the adsorption ratio (AR, Equation (1)), and adsorption capacity (Qe.a, Equation (2)) in each case.
Four models of adsorption isotherms were considered relating Qe.a and Ce.a: Langmuir, Freundlich, Sips, and Redlich–Peterson (R-P). Langmuir and Freundlich models are widely used due to their simplicity: The Langmuir model describes an ideal situation that assumes that the adsorbent presents a homogenous surface, and that the adsorbate occupies a monolayer on it [24,25]; the Freundlich model is used in processes of multilayer adsorption [20,21] and when a non-ideal adsorption on heterogeneous surfaces occurs [21]. Finally, both the Sips and Redlich–Peterson models are combinations of the basic Langmuir and Freundlich ones [24].
All models are defined by different parameters that appear in their characteristic equations (Table 2). Since these equations are non-linear, they were linearized [24,26]. The SOLVER tool of the MS Excel program was used to carry out the regressions of the experimental data. The goodness of fit of the models to the experimental data was assessed by using the linear regression coefficient (r2) and the average percentage error (APE), Equation (5) [27].
A P E   ( % ) = I = 1 N | Q e . a . e x p Q e . a . c a l   Q e . a . e x p | N · 100
where Qe.a.exp and Qe.a.cal are the experimental and calculated adsorption capacities at equilibrium, respectively, and N is the number of measurements.

2.6. Adsorption and Desorption Kinetics

For the adsorption kinetic study, 1 g of the selected dried resin was put in contact with 20 mL of the CA solutions with different concentrations (1.3, 2.0, 2.5, 4.0, 6.0, and 8.0 mg/mL) at the selected pH. The mixtures were stirred for 120 min at 120 rpm and room temperature (20 ± 2 °C). To follow the adsorption process with time (0, 5, 10, 20, 60, and 1440 min), aliquots were taken out from the solutions in contact with the resin and were stored at −18 °C until a later CA analysis. In the study of the desorption kinetics, the resins used in the adsorption process were separated from feed solutions, rinsed with distilled water, and introduced into flasks with 24 mL of ethanol 96°. Desorption kinetics were carried out under the same conditions (stirring and temperature) as those for the adsorption kinetics study. During the desorption process, aliquots were taken out (0, 5, 10, 20, 60, and 240 min) and stored at −18 °C until a later CA concentration analysis.
The adsorption/desorption kinetics were evaluated considering pseudo-first order (Equation (10)) and pseudo-second order (Equation (12)) kinetics equations. In addition, the interparticle diffusion model was applied (Equation (14)) (Table 3) [22] to determine whether the CA diffusion controls the process.
From Table 3, Qt.i is the amount of CA adsorbed (or desorbed) at each time (mg/g (d.b.)); Qe.a and Qe.d are the equilibrium amount of CA adsorbed and desorbed, respectively (mg/g (d.b.)); k1.i, k2.i are the constant rates: subscripts 1 and 2 refer to pseudo-first (1/min) and pseudo-second order kinetics (mL/mg·min); kpi is the intraparticle diffusion rate constant (mg/(g (d.b.)· min0.5); and Ci is the intercept constant (mg/g (d.b.)).
Table 3 also shows the corresponding integrated equations for the pseudo-first and pseudo-second order kinetics, considering the boundary conditions: t = 0 h → Qt.i = 0 mg/g and t = t h → Qt.i = Qt.i mg/g. Goodness of fit to the experimental data was assessed with the regression coefficients obtained with the linearized Equations (11), (13), and (14), shown in Table 3.

2.7. Analytical Determinations

CA determination was performed by HPLC analysis using a Waters Alliance 2695 HPLC system (Milford, MA, USA) equipped with a vacuum degasser, a quaternary pump, an autosampler, a thermostatic column compartment, a model 2996 diode array detector (DAD), and Empower software (Waters Corporation, Milford, MD, USA) for data collection. The chromatographic separation was performed by using a Luna C 18 RP column (250 × 4.6 mm, 5 µm, Phenomenex, Torrance, CA, USA).
The mobile phase consisted of 0.1% formic acid in water (eluent A) and 0.1% formic acid in acetonitrile (eluent B). The following gradient system was used: 0 min, 90% A and 10% B; 30 min, 50% A and 50% B; 35 min, 0% A and 100% B. Analyses were finished at 50 min. The system was equilibrated between runs for 10 min using the start mobile phase composition. The flow was pumped at 1 mL/min and the injection volume was 10 µL. Diode array detection was set between 200 and 600 nm, and absorbance was recorded at 325 nm. The CA concentration was identified by matching the retention time and the spectral characteristics against those of the standards.

3. Results and Discussion

3.1. Resin Performance

Table 4 shows the results obtained in both chlorogenic acid adsorption and desorption processes for the five resins considered. The ideal resin should retain high amounts of CA from the feed solution and easily release the CA retained during the desorption procedure. To quantify both adsorption and desorption processes, a total adsorption-desorption yield (TADY) parameter was defined as the product of the adsorption and desorption ratios.
While resin S 6328 A showed the best performance in terms of CA adsorption (AR = 98.3% and Qe.a = 33.5 mg/mL), its results for CA desorption were the lowest (DR = 3.9% and Qe.d = 1.3 mg/mL), and as a consequence, the TADY parameter shown the worst value (TADY = 3.8%). Chlorogenic acid presents a polar nature [20] and had higher affinity for the anionic resin S 6328 A than for the ethanol used in the desorption.
In contrast, resin S 7968 gave by far the highest CA desorption ratios (96.8%), but since the CA adsorption ratio was very low (11.3%), this resin presented a low TADY value of 11.0%. Since S 7968 and XAD 16HP N are the resins with the lowest pore size, both showed by far the lowest AR.
Resin XAD 7HP showed the second highest CA adsorption rate (94.6%) very close to that reached by S 6328 A. Moreover, XAD 7HP resin showed a desorption rate of 76.9%, and reached by far the highest TADY (72.8%). According to its polarity, the XAD 7HP resin is able to adsorb both polar and non-polar substances and presents a high adsorption affinity for phenolic compounds [13]. On the other hand, the CA binding on XAD 7HP is less strong than that on S 6328 A, which causes a higher DR.
Therefore, among the five resins studied, XAD 7HP was selected as the resin showing the best performance for the recuperation and concentration of CA, and this resin was used in the further studies on pH effect, adsorption isotherms, and adsorption/desorption kinetics.

3.2. Effect of pH on the Chlorogenic Acid Adsorption

Figure 1 presents the effect of pH on the chlorogenic acid adsorption on XAD 7HP resin in terms of adsorption ratio (AR, %). There is a remarkably strong effect of this variable on the AR and a low pH facilitates the adsorption of the resin. Maximum values for AR are very similar (95.0% and 93.4%) and were obtained for the lowest pH studied (2.5 and 3.0, respectively). From this point, the adsorption rate drops sharply to 38.1% at pH = 7. Considering that the original pH of the feed solution (1.5 mg/mL) is 3.0, this value was the pH selected as the optimum for the chlorogenic acid adsorption with the XAD 7HP resin.

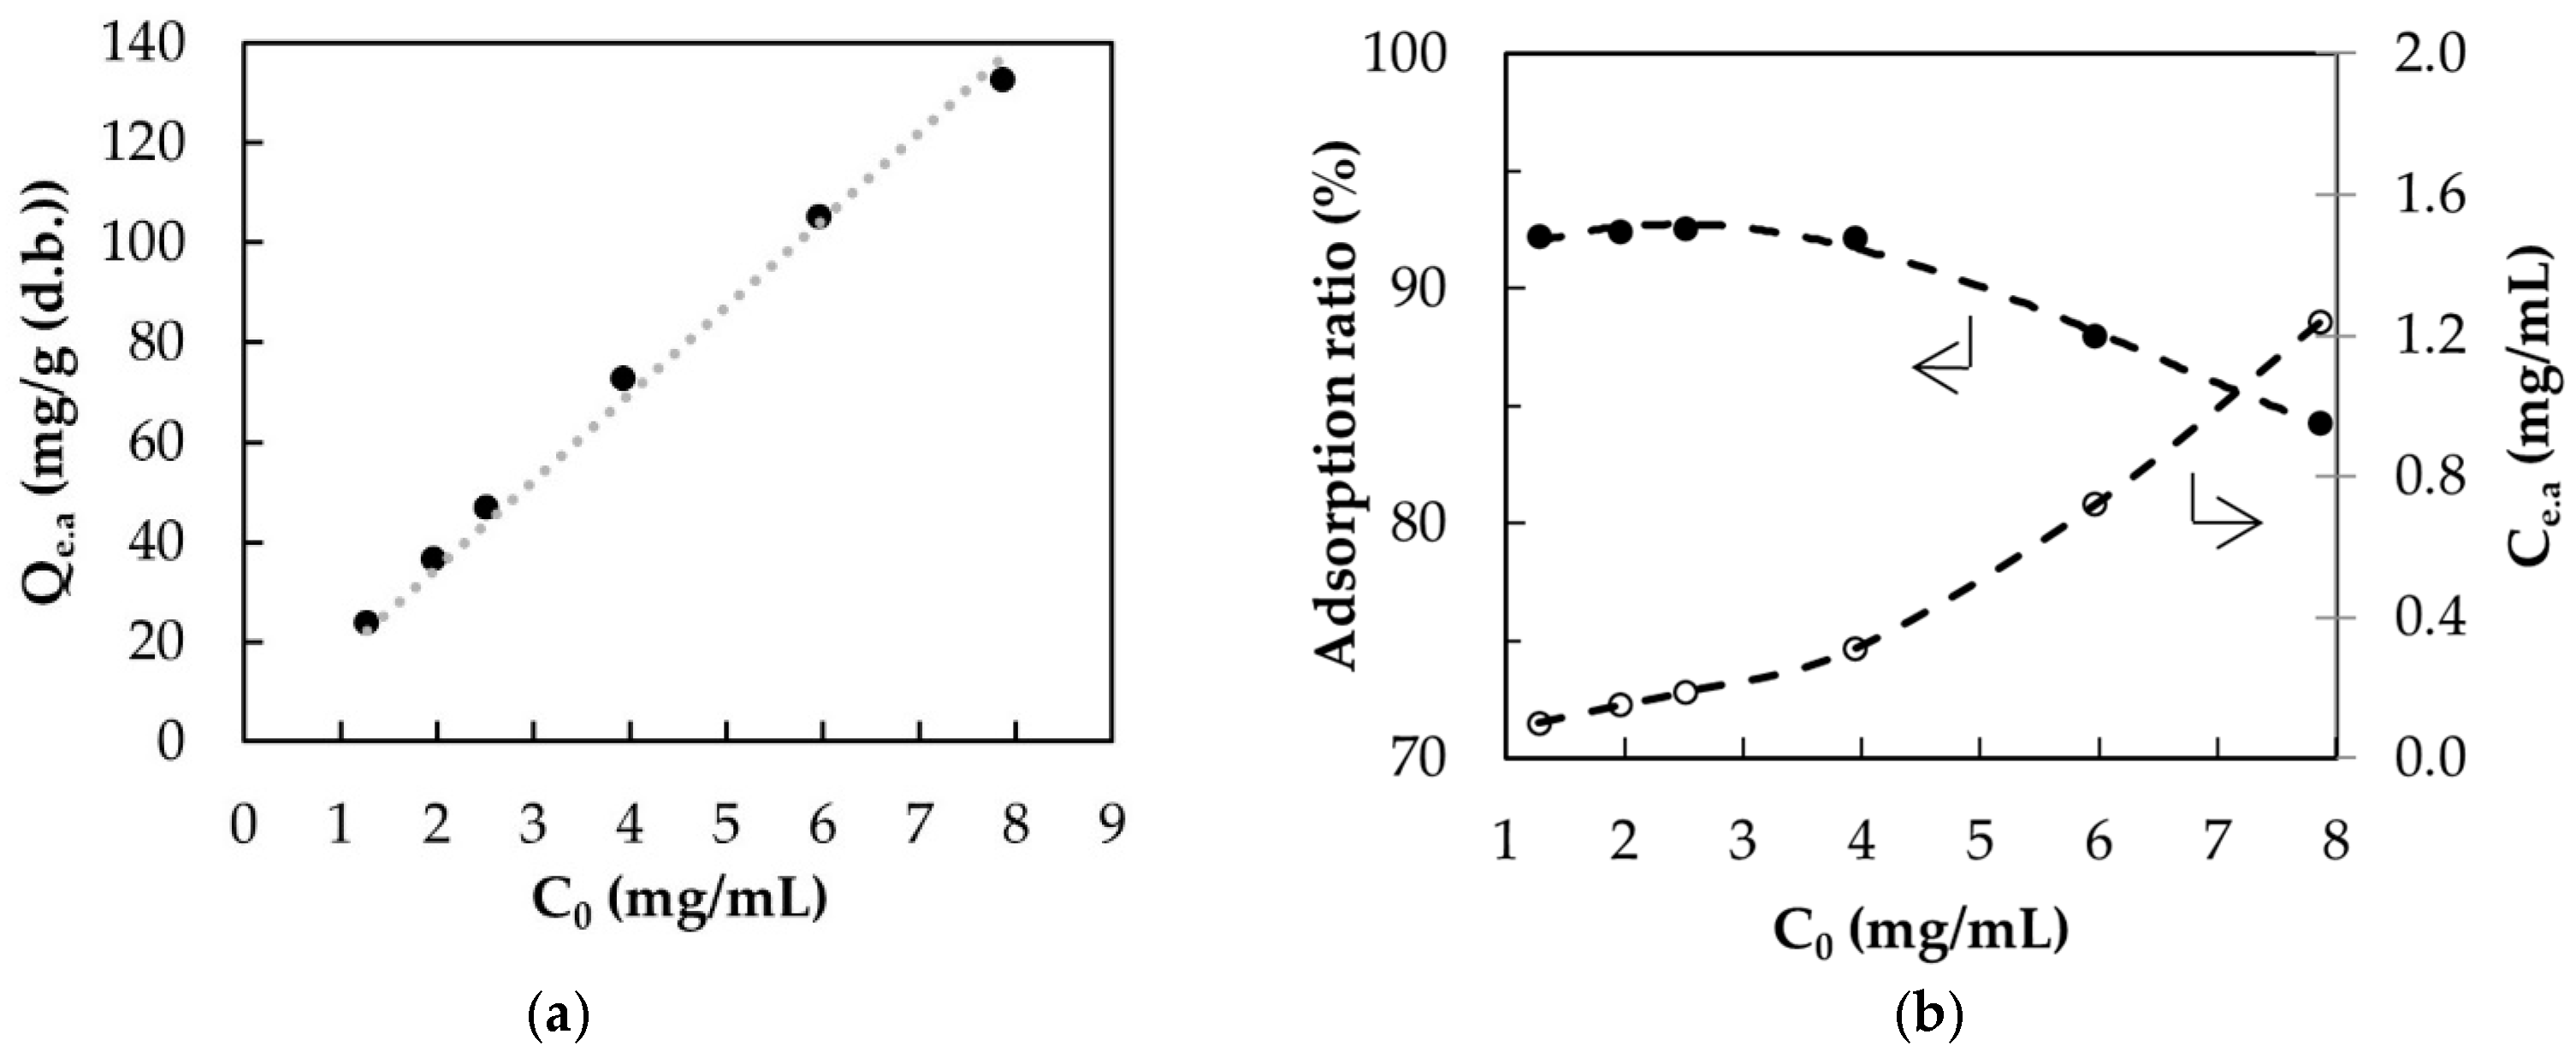
3.3. Adsorption Studies

Data collection from the adsorption process was completed by using the selected resin XAD 7HP and different CA feed solutions (1.3, 2.0, 2.5, 4.0, 6.0, and 8.0 mg/mL), and results are given in terms of Ce.a, Qe.a, and AR. To determine the interaction and dependence between those variables, several plots have been represented in Figure 2. It was found that there was a very good linear correlation (r2 = 0.999) between adsorption capacity with the initial CA concentration in the feed solution (Figure 2a). Regarding the effect of CA feed solution concentration, Co, on the CA concentration at the adsorption equilibrium, Ce.a, an increase in the Co led to a high Ce.a (Figure 2b, empty dots) as expected. The change of slopes at a certain point (Co = 4 mg CA/mL;) shows that from this feed solution concentration, resin CA adsorbing capacity started its stabilization, as also shown in Figure 2c, reaching a nearly asymptotic value of Qe.a of 132.60 mg CA/g(d.b.). The stabilization of Qe.a from Co = 4 mg CA/mL also had an effect on the adsorption rate (Figure 2b, black dots): Below Co, AR remained practically constant (values between 92.1–95.5%), while from this Co value on, the AR decreased to 84.2% for Co = 8.0 mg/mL.

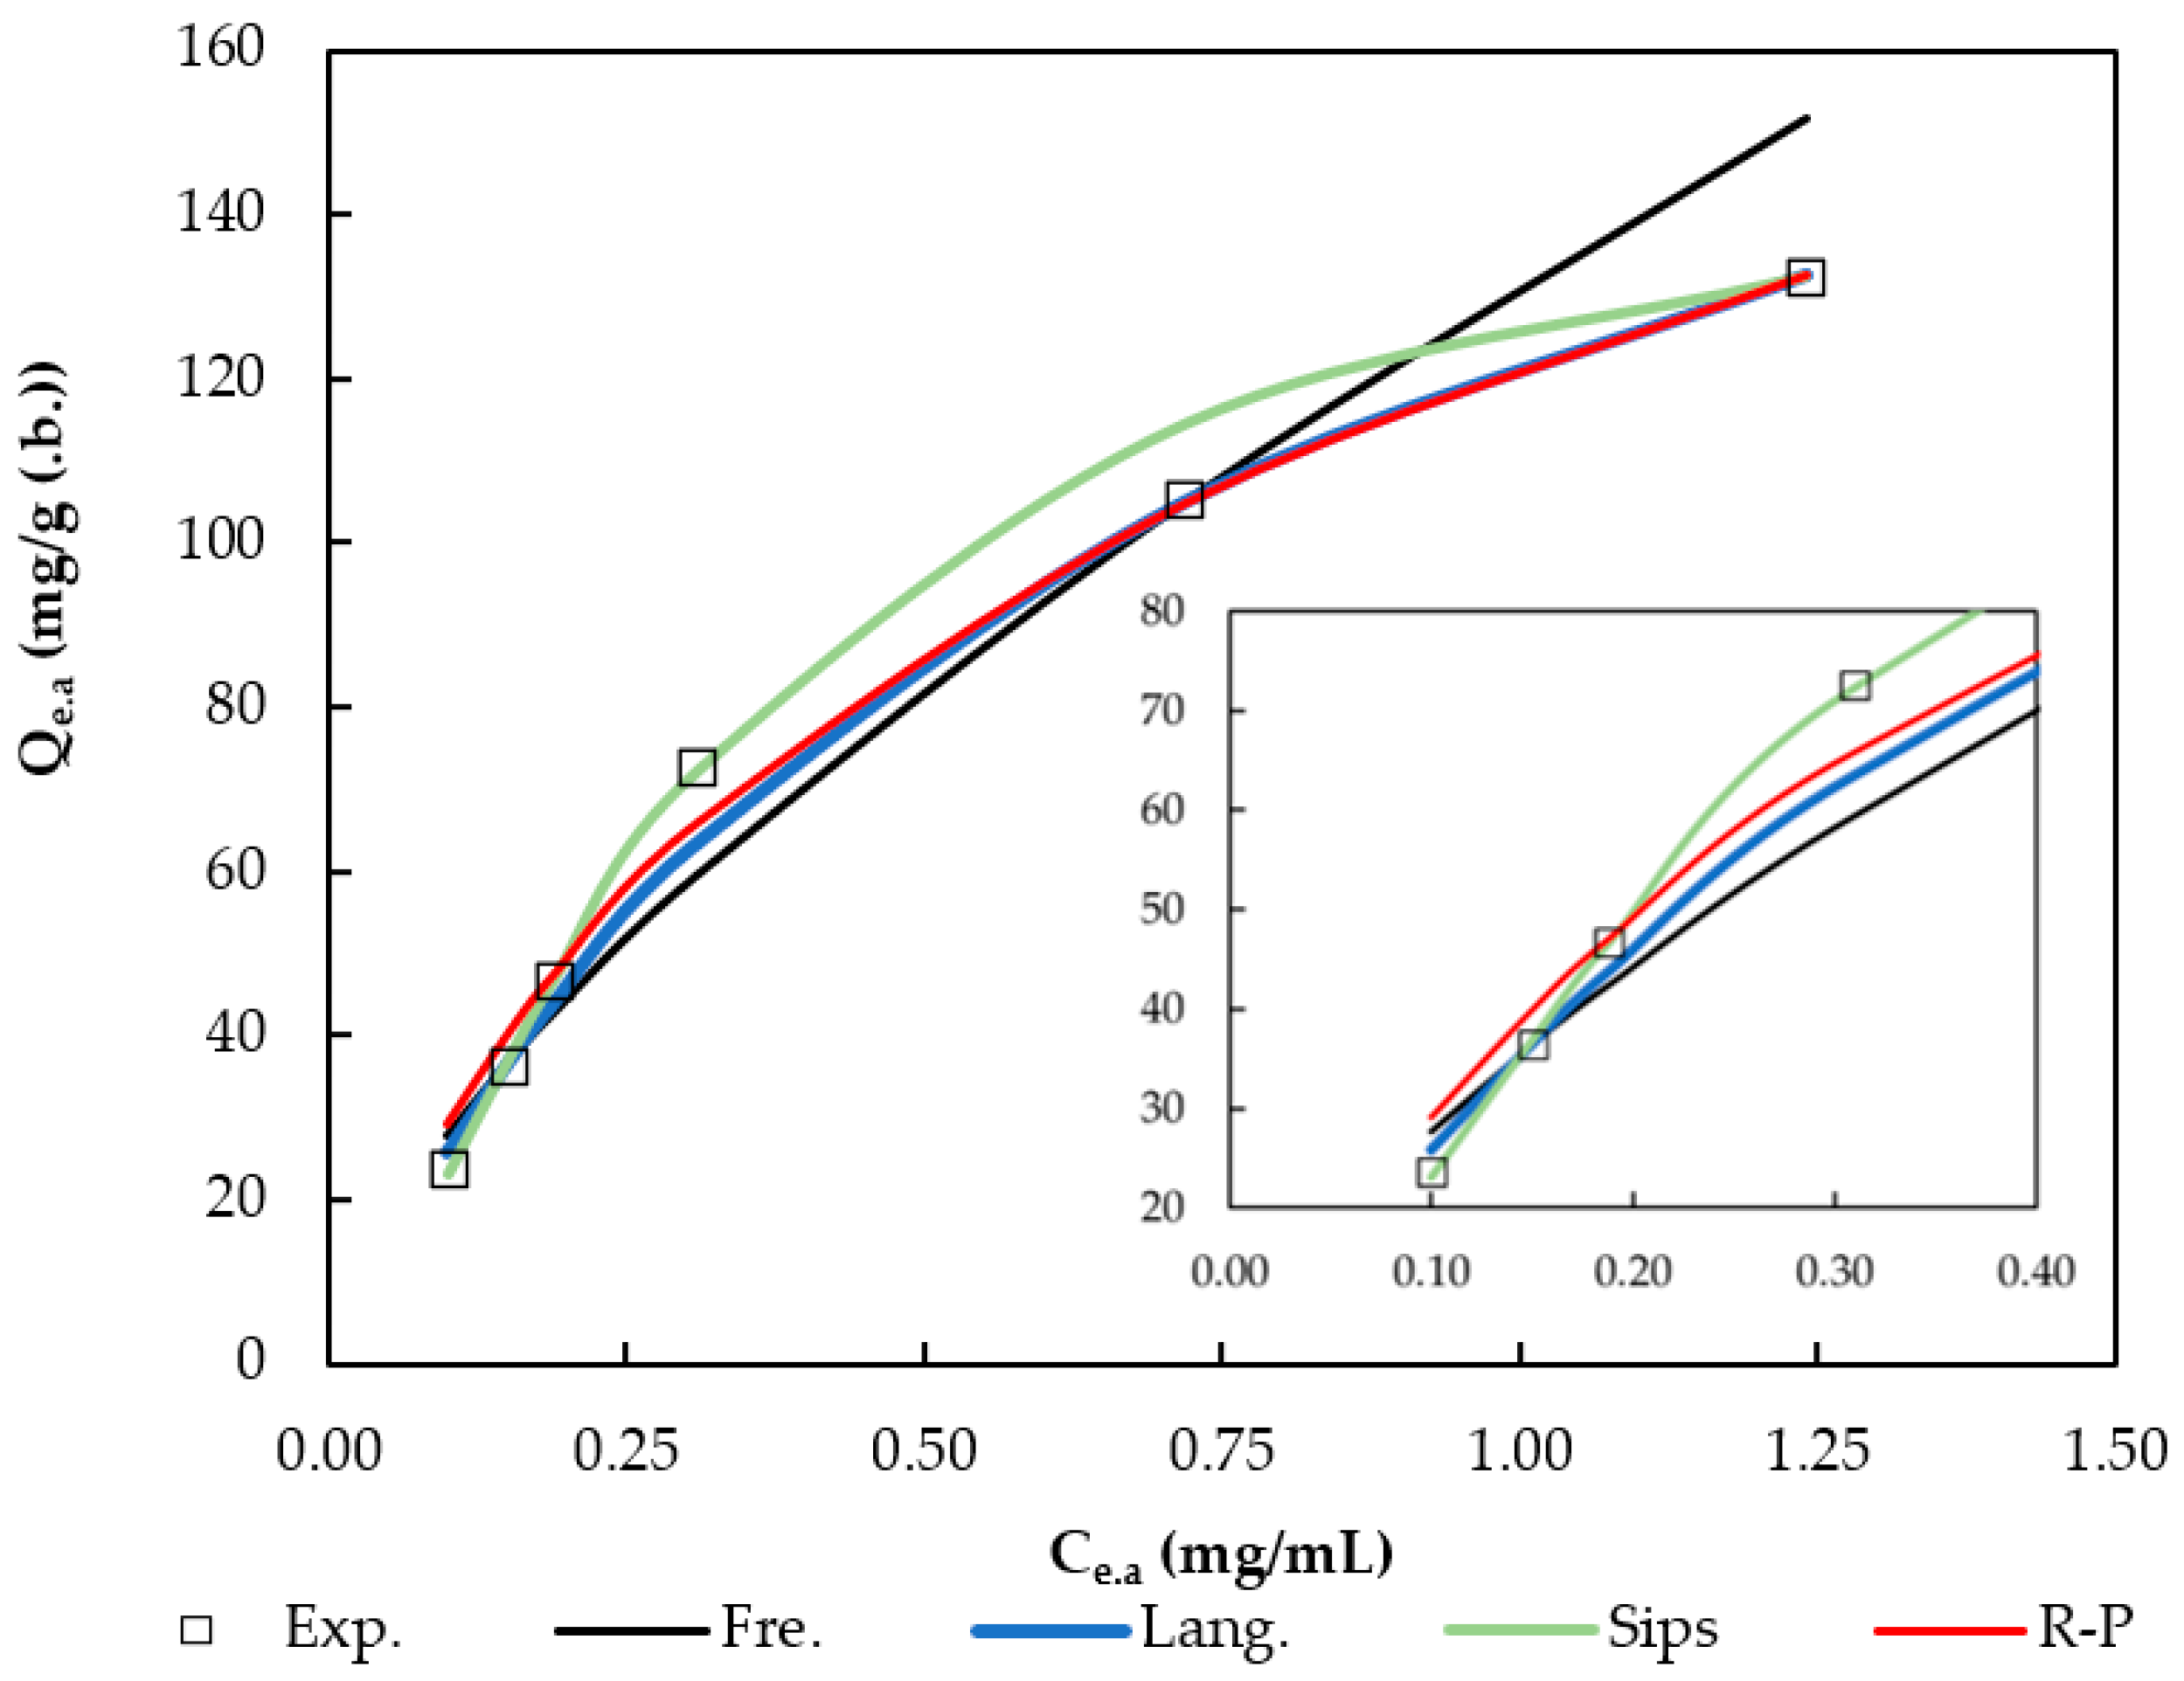
3.4. Adsorption Isotherms

Adsorption data were fitted to Langmuir, Freundlich, Sips, and Redlich–Peterson models. All the model constants and the fitting parameters are listed in Table 5.
According to the lineal regression coefficient r2, the Sips (0.996), Langmuir (0.994), and Freundlich (0.972) fits were excellent, and that of Redlich–Peterson was acceptable (0.836).
Considering the APE, Sips fit better than did Langmuir (2.71% and 4.73%, respectively) while the Freundlich model presented the worst fit. Figure 3 shows a plot of the predicted values by the models and experimental data, showing that the Freundlich model certainly is the model that most poorly fits the experimental values, since it does not even show the expected saturation trend. The low r2 value of the Redlich–Peterson model can be explained by the high deviations observed at low Ce.a values. On the other hand, the Sips and Langmuir models are close to the experimental values for all the Ce range and, consequently, their r2 and APE are better.
Some model parameters also provide information about the adsorption process. In the case of the Langmuir model, it is possible to determine whether the adsorption process is favorable using the RL parameter (Equation (15)) [23,28].
R L = 1 1 + K L · C 0
where C0′ is the highest initial concentration of CA. The interpretation of this adsorption process parameter is as follows: favorable (0 < RL < 1) and unfavorable (RL > 1) [24]. According to this parameter, the CA adsorption was clearly favorable since RL = 0.082, which is quite a bit lower than the unit.
Regarding the Sips model, which is a combination of the basic Langmuir and Freundlich isotherm models [24], the parameter α provides information on the surface heterogeneity. If α tends to 0, the adsorbent surface is heterogeneous and the Freundlich model is more appropriate; however, if α is closer to 1, the adsorbent surface is homogeneous, and the Langmuir model better describes the adsorption process [24]. Since α = 1.43, we can consider that for the CA adsorption process on the XAD 7HP resin, the adsorbent surface is homogeneous and the Langmuir and Sips models are more appropriate than is the Freundlich model.

3.5. Adsorption and Desorption Kinetics

Figure 4a shows the evolution of CA concentration with time in different feed solution media during the adsorption process. It was observed that regardless of the feed solution concentration, CA concentration decreased with time up to 20 min, and after that only a slight decrease was seen up to the end of the process (60 min); consequently, the adsorption capacity, Qt.a, varied with time until 20 min and from that time it remained practically constant (Figure 4b). As expected, the higher the CA concentration in the feed solution was, the higher was the equilibrium Qe obtained.
In the desorption step, in which a 96% ethanol solution was used as eluent, the stationary concentration of CA was reached between 10–20 min (Figure 4c) and the desorption capacity Qt.d was proportional to the CA concentration (Figure 4d).

3.5.1. Sorption Kinetics

Figure 5a,b, depict the linearized adsorption data according to Equations (11) and (13), and the pseudo-first and pseudo-second order kinetics plots, respectively. These figures show that the pseudo-second order kinetics model fits better to the experimental data. This is confirmed considering the percentage of relative deviation between the experimental and model Qe.a values that are shown in Table 6. Thus, the kinetics of the CA adsorption on the XAD 7HP resin follows the pseudo-second order model.
Regarding the adsorption kinetic constant for the pseudo-second order model, it was found that this parameter decreased with the increase of the initial concentration of CA (Table 6), and the trend is shown in Figure 6a. At low Co values, a sharp decrease of k2.a up to a Co of around 4 mg/mL was observed. This behavior was also found for the adsorption of sulforaphane on a microporous resin [29].
The adsorption/desorption kinetic plots in Figure 5c,d clearly show that the pseudo-second order kinetic model fits better to the experimental data. The relative deviation percentages also confirm this fact (Table 6). For the desorption kinetic constant k2.d, Figure 6b shows its decrease with the initial CA concentration, with a similar trend to that for the adsorption study. It is possible to distinguish two slopes in this trend with a Co inflection point at around 4 mg/mL for both the adsorption and desorption processes.

3.5.2. Sorption Control Mechanisms

Resin XAD 7HP is a macroporous matrix, so the effect of diffusion on the observed kinetics was analyzed on the basis of the intraparticle diffusion model (Equation (14)). This model, proposed by Weber and Morris, is usually applied when a porous material is used as adsorbent and when the diffusion of the adsorbate into the pores, with different sizes, is carried out through a physisorption mechanism [24]. Several authors have used this model in adsorption [20,21,29,30,31,32,33,34] and desorption processes [35] to describe the diffusional control. Figure 7 depicts the adsorption and desorption experimental data and values from Equation (14).
Wu, Tseng, and Juang (2009) [31] defined a parameter, Rp, to understand the behavior of the sorption process (Equation (16)). The interpretation of this Rp value can be completed according to following ranges: Rp = 1 means that there is not a rapid initial sorption; 0.9 < Rp < 1 means the initial sorption is weak; 0.5 < Rp < 0.9 means there is an intermediary strength of initial sorption; 0.1 < Rp < 0.5 means the initial sorption is strong; and Rp < 0.1 indicates that the sorption process is completed in a short time [30,31].
R p i = 1 C i Q e . i . r e f  
where i = a for adsorption and d for desorption processes, and Q.e.i.ref is the Q.e.i at the longest time.
In all depicted series (Figure 7) the trend is similar, and it is possible to distinguish two stages that are more evident at higher initial concentrations of CA. This occurs for both adsorption and desorption processes. Table 7 shows the fitting results for the intraparticle diffusion model, considering two alternatives: (i) no stages and (ii) two stages (the first stage (named 1) and the second stage (named 2)).
Looking at r2 values in Table 7, the convenience of using the two stages approach in the fit of experimental data is clear, leading to very good fitting results (r2 = 0.924–1.000 for adsorption data and r2 = 0.826–0.989 for desorption data). This two stages consideration was also successfully used by other authors [29,30,36].
In Equation (14), the intercept (Ci) provides information on the intraparticle diffusion control: Ci = 0 means that the intraparticle diffusion is the controlling step in the sorption process [30,37]; Ci < 0 implies that the liquid film thickness blocks the intraparticle diffusion process [30]; and Ci > 0 indicates that a quick sorption stage takes place in a short period at the beginning of the sorption process [30]. Since both Ca and Cd take non-zero positive values, it is reasonable to assume that the intraparticle diffusion is not the only controlling step and, moreover, the adsorption and desorption processes are controlled by film diffusion and other factors at the initial stage, even if intraparticle diffusions are still the main mechanism [28,29,30,31,32].
For the adsorption process, the calculated Rpa1 for plots at the first stage (Table 7) varied between 0.319 and 0.762, indicating processes with initial adsorption from strong to weak, whereas the Rpa2 values for the second stage ranged from 0.040 to 0.150.
Regarding the desorption process, the Rpd1 values at the first stage indicated strong initial desorption (0.223–0.434), whereas in the second stage, the Rpd2 values decrease (0.030–0.201), as in the second stage in the adsorption process.

4. Conclusions

The main objective of this research was to find a resin able to efficiently complete the adsorption-desorption process of chlorogenic acid for its recovery from food industry wastewater. Five resins were tested, and XAD 7HP gave the best performance with an adsorption rate of 94.6% and a desorption rate of 76.9%, resulting in a TADY of 72.8%. Low pH values (2.5–3) led to the best adsorption yields of the XAD 7HP resin. Four models of isotherms were applied to the adsorption process, and the Sips and Langmuir models provided better fits to the experimental data. Adsorption and desorption kinetics followed a pseudo-second order behavior, and also suggested that intraparticle diffusion is not the only mechanism controlling the sorption process.
Future studies should seek to find the best dynamic operative conditions for the recovery and concentration of chlorogenic acid from food processing wastewater with the XAD 7HP resin.

Author Contributions

Investigation, A.D.R.-L., M.R. and E.M.G.-C.; Methodology, A.D.R.-L., M.O.-C. and E.M.G.-C.; Writing—original draft, A.D.R.-L. and E.M.G.-C.; Writing—review and editing, L.M. All authors have read and agreed to the published version of the manuscript.

Funding

This research received no external funding.

Institutional Review Board Statement

Not applicable.

Informed Consent Statement

Not applicable.

Conflicts of Interest

The authors declare no conflict of interest.

References

  1. Zagklis, D.P.; Papageorgiou, C.S.; Paraskeva, C.A. Technoeconomic Analysis of the Recovery of Phenols from Olive Mill Wastewater through Membrane Filtration and Resin Adsorption_Desorption. Sustainability 2021, 13, 2376. [Google Scholar] [CrossRef]
  2. Garcia-Castello, E.M.; Rodriguez-Lopez, A.D.; Mayor, L.; Ballesteros, R.; Conidi, C.; Cassano, A. Optimization of conventional and ultrasound assisted extraction of flavonoids from grapefruit (Citrus paradisi L.) solid wastes. LWT Food Sci. Technol. 2015, 64, 1114–1122. [Google Scholar] [CrossRef]
  3. Scherhaufer, S.; Moates, G.; Hartikainen, H.; Waldron, K.; Obersteiner, G. Environmental impacts of food waste in Europe. Waste Manag. 2018, 77, 98–113. [Google Scholar] [CrossRef]
  4. Rodriguez-Lopez, A.D.; Melgar, B.; Conidi, C.; Barros, L.; Ferreira, I.C.F.R.; Cassano, A.; Garcia-Castello, E.M. Food industry by-products valorization and new ingredients: Cases of study. In Sustainability of the Food System; Noelia, B., Ester, B., Eds.; Academic Press: Cambridge, MA, USA, 2020; pp. 71–99. [Google Scholar] [CrossRef]
  5. Carciochi, R.A.; D’Alessandro, L.G.; Vauchel, P.; Rodriguez, M.M.; Nolasco, S.M.; Dimitrov, K. Valorization of agrifood by-products by extracting valuable bioactive compounds using green processes. In Ingredients Extraction by Physicochemical Methods in Food; Academic Press: Cambridge, MA, USA, 2017; pp. 191–228. [Google Scholar] [CrossRef]
  6. Food and Agriculture Organization of the United Nations (FAOSTAT). Available online: http://www.fao.org/faostat/en/#data/QC (accessed on 22 June 2021).
  7. Saavedra, M.I.; Doval Miñarro, M.; Angosto, J.M.; Fernández-López, J.A. Reuse potential of residues of artichoke (Cynara scolymus L.) from industrial canning processing as sorbent of heavy metals in multimetallic effluents. Ind. Crop. Prod. 2019, 141, 111751. [Google Scholar] [CrossRef]
  8. Mármol, I.; Quero, J.; Ibarz, R.; Ferreira-Santos, P.; Teixeira, J.A.; Rocha, C.M.R.; Pérez-Fernández, M.; García-Juiz, S.; Osada, J.; Martín-Belloso, O.; et al. Valorization of agro-food by-products and their potential therapeutic applications. Food Bioprod. Process. 2021. [Google Scholar] [CrossRef]
  9. Conidi, C.; Cassano, A.; Garcia-Castello, E. Valorization of artichoke wastewaters by integrated membrane process. Water Res. 2014, 48, 363–374. [Google Scholar] [CrossRef]
  10. Conidi, C.; Rodriguez-Lopez, A.D.; Garcia-Castello, E.M.; Cassano, A. Purification of artichoke polyphenols by using membrane filtration and polymeric resins. Sep. Purif. Technol. 2015, 144, 153–161. [Google Scholar] [CrossRef]
  11. Sandhu, A.K.; Gu, L. Adsorption/desorption characteristics and separation of anthocyanins from muscadine (Vitis rotundifolia) juice pomace by use of macroporous adsorbent resins. J. Agric. Food Chem. 2013, 61, 1441–1448. [Google Scholar] [CrossRef] [PubMed]
  12. Soto, M.L.; Moure, A.; Domínguez, H.; Parajó, J.C. Recovery, concentration and purification of phenolic compounds by adsorption: A review. J. Food Eng. 2011, 105, 1–27. [Google Scholar] [CrossRef]
  13. Buran, T.J.; Sandhu, A.K.; Li, Z.; Rock, C.R.; Yang, W.W.; Gu, L. Adsorption/desorption characteristics and separation of anthocyanins and polyphenols from blueberries using macroporous adsorbent resins. J. Food Eng. 2014, 128, 167–173. [Google Scholar] [CrossRef]
  14. De Araújo Padilha, C.E.; Da Costa Nogueira, C.; Oliveira Filho, M.A.; De Sousa Júnior, F.C.; De Assis, C.F.; De Santana Souza, D.F.; De Oliveira, J.A.; Dos Santos, E.S. Fractionation of green coconut fiber using sequential hydrothermal/alkaline pretreatments and Amberlite XAD-7HP resin. J. Environ. Chem. Eng. 2019, 7, 103474. [Google Scholar] [CrossRef]
  15. Kammerer, J.; Kammerer, D.R.; Carle, R. Impact of saccharides and amino acids on the interaction of apple polyphenols with ion exchange and adsorbent resins. J. Food Eng. 2010, 98, 230–239. [Google Scholar] [CrossRef]
  16. Kammerer, J.; Boschet, J.; Kammerer, D.R.; Carle, R. Enrichment and fractionation of major apple flavonoids, phenolic acids and dihydrochalcones using anion exchange resins. LWT Food Sci. Technol. 2011, 44, 1079–1087. [Google Scholar] [CrossRef]
  17. Silva, E.M.; Pompeu, D.R.; Larondelle, Y.; Rogez, H. Optimisation of the adsorption of polyphenols from Inga edulis leaves on macroporous resins using an experimental design methodology. Sep. Purif. Technol. 2007, 53, 274–280. [Google Scholar] [CrossRef]
  18. Šimko, I.; Roriz, E.; Gramblička, M.; Illeová, V.; Polakovič, M. Adsorption separation of 2-phenylethanol and L-phenylalanine on polymeric resins: Adsorbent screening, single-component and binary equilibria. Food Bioprod. Process. 2015, 95, 254–263. [Google Scholar] [CrossRef]
  19. Liang, L.; Bao, S.; Zhang, Y.; Tang, Y. Separation and recovery of V(IV) from sulfuric acid solutions containing Fe(III) and Al(III) using bis(2-ethylhexyl)phosphoric acid impregnated resin. Chem. Eng. Res. Des. 2016, 111, 109–116. [Google Scholar] [CrossRef]
  20. Zhang, B.; Yang, R.; Zhao, Y.; Liu, C.Z. Separation of chlorogenic acid from honeysuckle crude extracts by macroporous resins. J. Chromatogr. B Anal. Technol. Biomed. Life Sci. 2008, 867, 253–258. [Google Scholar] [CrossRef]
  21. Sun, P.C.; Liu, Y.; Yi, Y.T.; Li, H.J.; Fan, P.; Xia, C.H. Preliminary enrichment and separation of chlorogenic acid from Helianthus tuberosus L. leaves extract by macroporous resins. Food Chem. 2015, 168, 55–62. [Google Scholar] [CrossRef] [PubMed]
  22. Ahammad, N.A.; Zulkifli, M.A.; Ahmad, M.A.; Hameed, B.H.; Mohd Din, A.T. Desorption of chloramphenicol from ordered mesoporous carbon-alginate beads: Effects of operating parameters, and isotherm, kinetics, and regeneration studies. J. Environ. Chem. Eng. 2021, 9, 105015. [Google Scholar] [CrossRef]
  23. Shazeli, M.; Zain, C.; Lee, S.Y.; Teo, C.Y.; Shaari, K. Adsorption/Desorption Characteristics and Simultaneous Enrichment of Orientin, Isoorientin, Vitexin and Isovitexin from Hydrolyzed Oil Palm Leaf Extract Using Macroporous Resins. Processes 2021, 9, 659. [Google Scholar] [CrossRef]
  24. Ray, S.S.; Gusain, R.; Kumar, N. Adsorption equilibrium isotherms, kinetics and thermodynamics. In Carbon Nanomaterial-Based Adsorbents for Water Purification; Elsevier: Amsterdam, The Netherlands, 2020; pp. 101–118. [Google Scholar] [CrossRef]
  25. Bretag, J.; Kammerer, D.R.; Jensen, U.; Carle, R. Adsorption of rutin onto a food-grade styrene-divinylbenzene copolymer in a model system. Food Chem. 2009, 114, 151–160. [Google Scholar] [CrossRef]
  26. Sahoo, T.R.; Prelot, B. Adsorption processes for the removal of contaminants from wastewater. In Nanomaterials for the Detection and Removal of Wastewater Pollutants; Elsevier: Amsterdam, The Netherlands, 2020; pp. 161–222. [Google Scholar] [CrossRef]
  27. Paredes-Laverde, M.; Salamanca, M.; Silva-Agredo, J.; Manrique-Losada, L.; Torres-Palma, R.A. Selective removal of acetaminophen in urine with activated carbons from rice (Oryza sativa) and coffee (Coffea arabica) husk: Effect of activating agent, activation temperature and analysis of physical-chemical interactions. J. Environ. Chem. Eng. 2019, 7, 103318. [Google Scholar] [CrossRef]
  28. Che Zain, M.S.; Lee, S.Y.; Teo, C.Y.; Shaari, K. Adsorption and Desorption Properties of Total Flavonoids from Oil Palm (Elaeis guineensis Jacq.) Mature Leaf on Macroporous Adsorption Resins. Molecules 2020, 25, 778. [Google Scholar] [CrossRef] [Green Version]
  29. Yuanfeng, W.; Lei, Z.; Jianwei, M.; Shiwang, L.; Jun, H.; Yuru, Y.; Lehe, M. Kinetic and thermodynamic studies of sulforaphane adsorption on macroporous resin. J. Chromatogr. B Anal. Technol. Biomed. Life Sci. 2016, 1028, 231–236. [Google Scholar] [CrossRef]
  30. Li, R.; Liang, N.; Ma, X.; Chen, B.; Huang, F. Study on the adsorption behavior of glycerin from fatty acid methyl esters by a tertiary amine-type anion exchange resin. J. Chromatogr. A 2019, 1586, 62–71. [Google Scholar] [CrossRef]
  31. Wu, F.C.; Tseng, R.L.; Juang, R.S. Initial behavior of intraparticle diffusion model used in the description of adsorption kinetics. Chem. Eng. J. 2009, 153, 1–8. [Google Scholar] [CrossRef]
  32. Lv, C.; Yang, J.; Liu, R.; Lu, Q.; Ding, Y.; Zhang, J.; Deng, J. A comparative study on the adsorption and desorption characteristics of flavonoids from honey by six resins. Food Chem. 2018, 268, 424–430. [Google Scholar] [CrossRef] [PubMed]
  33. Zhang, X.T.; Zhang, R.; Chen, S.S.; Wen, K.; Han, R.P. Adsorption of phosphate from solution by iron modified macroporous chelating resin. Desalination Water Treat. 2019, 170, 187–198. [Google Scholar] [CrossRef]
  34. Wen, Z.; Huang, K.; Niu, Y.; Yao, Y.; Wang, S.; Cao, Z.; Zhong, H. Kinetic study of ultrasonic-assisted uranium adsorption by anion exchange resin. Colloids Surf. A Physicochem. Eng. Asp. 2020, 585, 124021. [Google Scholar] [CrossRef]
  35. Sparks, D.L.; Zelazny, L.W.; Martens, D.C. Kinetics of Potassium Desorption in Soil using Miscible Displacement. Soil Sci. Soc. Am. J. 1980, 44, 1205–1208. [Google Scholar] [CrossRef] [Green Version]
  36. Paredes-Laverde, M.; Salamanca, M.; Diaz-Corrales, J.D.; Flórez, E.; Silva-Agredo, J.; Torres-Palma, R.A. Understanding the removal of an anionic dye in textile wastewaters by adsorption on ZnCl2 activated carbons from rice and coffee husk wastes: A combined experimental and theoretical study. J. Environ. Chem. Eng. 2021, 9, 105685. [Google Scholar] [CrossRef]
  37. Ho, Y.S.; Ng, J.C.Y.; McKay, G. Kinetics of pollutant sorption by biosorbents: Review. Sep. Purif. Methods 2000, 29, 189–232. [Google Scholar] [CrossRef]
Figure 1. Effect of pH on the chlorogenic acid adsorption ratio with the XAD 7HP resin. Experimental conditions: Feed solution = 1.5 mg CA/mL; t = 24 h.
Sustainability 13 08928 g001
Figure 2. (a) Relation between adsorption capacity and initial CA concentration in the feed solution; (b) Adsorption rate (black dots) and CA concentration in the feed solution at equilibrium, as a function of the initial CA concentration in the feed solution; (c) Adsorption isotherm. Experimental conditions: Resin = XAD 7HP; Temperature = 20 ± 2 °C; t = 24 h.
Sustainability 13 08928 g002aSustainability 13 08928 g002b
Figure 3. Experimental data and predicted values by the five sorption models considered. Experimental conditions: Resin = XAD 7HP; Temperature = 20 ± 2 °C; t = 24 h.
Sustainability 13 08928 g003
Figure 4. Adsorption kinetics: (a) CA concentration course with time; (b) Adsorption capacity course with time. Desorption kinetics: (c) CA concentration course with time; (d) Desorption capacity course with time.
Sustainability 13 08928 g004
Figure 5. Adsorption kinetics models and experimental data: (a) Pseudo-first order and (b) Pseudo-second order. Desorption kinetics models: (c) Pseudo-first order and (d) Pseudo-second order.
Sustainability 13 08928 g005
Figure 6. Variation of the pseudo-second order kinetic constant with the initial CA concentration: (a) Adsorption processes; (b) Desorption processes.
Sustainability 13 08928 g006
Figure 7. Kinetic intraparticle diffusion model and experimental data: (a) Adsorption processes; (b) Desorption processes.
Sustainability 13 08928 g007
Table 1. Characteristics of the sorption resins.
S 2328S 6328 AS 7968XAD 7HPXAD 16HP N
Functional groupSulphonic acidQuaternary ammineNoneNoneNone
Ionic form as shippedH+ClNeutralNeutralNeutral
Surface area (m2/g)--800380800
Particle size (mm)0.40–1.200.40–1.250.490.56–0.710.60–0.75
Pore diameter (nm)55505–105520 [19]
Maximum operating temperature (°C)1208512080–100150
Moisture content (%):
Manufacturer65–7558–6350–6061–6962–70
Measured67.348.761.369.367.3
pH range0–140–140–140–140–14
Conditioning solutions6% HCl aq. solution6% HCl and 4% NaOH aq. solutions6% HCl and 4% NaOH aq. solutions20 g/L of NaOH and 0.5% of HCl20 g/L of NaOH and 20 g/L of H2SO4
Table 2. Adsorption isotherm models.
General ModelEq.LinearizedEq.
Langmuir
Q e . a = Q m · K L · C e . a 1 + K L · C e . a (6) C e . a Q e . a = 1 K L · Q m + 1 Q m · C e . a (6′) [26]
Freundlich
Q e . a = K F · C e . a 1 n (7) ln ( Q e . a ) = ln ( K F ) + 1 n · ln ( C e . a ) (7′) [26]
Sips
Q e . a = Q S · K S · C e . a α 1 + K S · C e . a α (8) 1 Q e . a = 1 K S · Q S · ( 1 C e . a ) α + 1 Q S (8′) [24]
Redlich-Peterson
Q e = K R P · C e . a 1 + B R P · C e . a g (9) ln ( K R P · C e . a Q e . a 1 ) = ln ( B R P ) + β · ln ( C e . a ) (9′) adapted from [24]
Table 3. Equations used for the study of adsorption and desorption kinetics.
ModelGeneralEq.IntegratedEq.
Pseudo-first order d Q t . i d t = k 1 . i · ( Q e . i Q t . i ) (10) ln ( Q e . i Q t . i ) = ln ( Q e . i ) k 1 . i · t (11)
Pseudo-second order d Q t . i d t = k 2 . i · ( Q e . i Q t . i ) 2 (12) t Q t . i = 1 k 2 . i · Q e . i 2 + t Q e . i (13)
Intraparticle diffusion Q t . i = k p i · t 1 2 + C i (14)
i = a for adsorption and d for desorption.
Table 4. Adsorption and desorption results for different resins. Experimental conditions: feed solution concentration = 1.5 mg CA/mL; t(adsorption) = 24 h; t(desorption) = 4 h.
ResinAR
(%)
Qe.a
(mg/g (d.b.))
DR
(%)
Qe.d
(mg/g (d.b.))
TADY
(%)
S 232846.914.449.78.123.3
S 6328 A98.333.53.91.33.8
S 796811.32.096.81.911.0
XAD 7HP94.631.376.925.372.8
XAD 16HP N24.32.349.51.612.0
AR, adsorption ratio; Qe.a, adsorption capacity; DR, desorption ratio; Qe.d, desorption capacity; TADY, total adsorption-desorption yield.
Table 5. Fitting results for the CA adsorption data with the five proposed models. Resin XAD 7HP; Temperature = 20 ± 2 °C; t = 24 h.
FreundlichLangmuirSipsRedlich–Peterson
KF = 131.08 (mg/g)·(mL/mg)1/nKL = 1.42 mL/mgQS = 152.94 mg/gKRP = 377.06 (mL/mg)·(mg/g)
n = 1.48Qm = 208.09 mg/gKS = 4.79 mL/mgBRP = 2.10 (mL/mg)g
RL = 0.082α = 1.43β = 0.85
r2 = 0.972r2 = 0.994r2 = 0.996r2 = 0.836
APE = 9.8%APE = 4.7%APE = 2.2%APE = 7.2%
Table 6. Kinetic constant and equilibrium adsorption capacity of chlorogenic acid on resin XAD 7HP for pseudo-first and pseudo-second order models.
ExperimentalPseudo-First OrderPseudo-Second Order
Adsorption
CoQe.a exp.k1.aQe.aQe.a relative
deviation
k2.aQe.aQe.a relative
deviation
mg/mLmg/g1/minmg/g%mg/(mL·min)mg/g%
1.323.618.3413.8741.250.0321523.480.55
2.036.427.8622.0339.510.0251235.761.81
2.546.768.1331.0833.530.0118047.180.90
4.072.616.2659.7117.770.0067274.442.52
6.0105.057.9974.5929.000.00449107.101.95
8.0132.705.74133.990.970.00278136.182.62
Desorption
CoQe.dexp.k1.dQe.dQe.a relative
deviation
k2.dQe.dQe.a relative
deviation
mg/mLmg/g1/minmg/g%mg/(mL·min)mg/g%
1.320.640.177816.764.840.036820.760.58
2.030.240.139716.0247.020.029230.370.43
2.534.800.126421.3938.540.016935.020.63
4.059.040.119730.0749.070.008959.370.56
6.087.210.087246.8946.230.003388.060.97
8.0123.080.097768.6044.260.0042123.040.03
Table 7. Application of the intraparticle diffusion model for both adsorption and desorption processes.
Co (mg CA/mL)
1.32.02.54.06.08.0
Adsorption
No stages approach
r20.8400.7470.8600.6550.7680.627
kpa (mg/(g (d.b.)·min0.5)0.6730.9831.6833.4974.6517.972
Ca (mg/g (d.b.))18.128.233.747.970.675.9
Rpa0.2310.2250.2800.3400.3280.428
Two stages approach
1r120.9580.9520.9720.9190.9240.958
kpa1 (mg/(g (d.b.)·min0.5)1.3382.2863.2529.12310.22922.253
Ca1 (mg/g (d.b.))16.124.228.830.553.331.6
Rpa10.3190.3360.3840.5810.4930.762
2r22111111
kpa2 (mg/(g (d.b.)·min0.5)0.3260.2950.6640.6111.8310.278
Ca2 (mg/g (d.b.)).20.532.840.767.389.3127.4
Rpa20.1340.0990.1300.0740.1500.040
Desorption
No stages approach
r20.5200.6160.5790.8460.9380.794
kpd (mg/(g (d.b.)·min0.5)0.2830.2730.4580.5491.1641.672
Cd (mg/g (d.b.))17.026.628.650.969.0100.2
Rpd0.1760.1220.1770.1380.2090.186
Two stages approach
1r120.9740.8760.8260.9890.8250.921
kpd1 (mg/(g (d.b.)·min0.5)1.8591.4632.5722.1002.5664.422
Cd1 (mg/g (d.b.))11.722.621.545.964.889.9
Rpd10.4340.2540.3810.2230.2570.269
2r220.9480.9480.9490.9230.9610.754
kpd2 (mg/(g (d.b.)·min0.5)0.0410.1240.2050.3791.1061.015
Cd2 (mg/g (d.b.)).20.028.431.753.069.7108.50
Rpd20.0300.0620.0890.1030.2010.119
Publisher’s Note: MDPI stays neutral with regard to jurisdictional claims in published maps and institutional affiliations.

