Abstract
The problem of sustainable business excellence has been investigated according to different aspects in different fields. For a more detailed analysis, it is necessary to develop an integrative sustainable business excellence model, respecting the baseline model of business excellence according to the European Foundation of Quality Management, with the possibility of defining the relationships and levels of significance of different variables. The primary goal of this paper is to present a developed integrative model to simulate the effects of information and communication technologies, and quality and effects of leadership improvement, as independent variables, on sustainable business excellence in higher education institutions, as a dependent variable. The model was developed by applying dynamic system techniques and evaluated by using statistical methods. In the sample of 17 Serbian and 21 Russian universities, the authors analyzed the information and communication support, leadership and quality, and their impact on sustainable business excellence. According to the simulation analysis, it was concluded that the EFQM model of self-assessment could help produce a more customer-oriented culture in HEIs, through ICT support, leadership and quality criteria enhancements.
1. Introduction
Higher education has always been a driver of development for an entire society, as it influences the growth of the economy, culture and individual career development. Accordingly, higher education is an area that is constantly exposed to requests for the continuous improvement, competitiveness and sustainable development of all of the processes carried out in higher education institutions (HEIs) [1,2]. According to Temponi [3], continuous improvement and sustainable development in academic institutions means exploring the needs and expectations of the institutions’ stakeholder base—which may be students, staff, accreditation agencies, community members, governments and state institutions—re-evaluating the effectiveness of programs and total quality initiatives at large. Students live in an exceedingly changing world with depleting resources. Because HEIs have to equip students to achieve their fullest potential in such an environment, the HEIs themselves must be dynamic and flexible. The economic conditions have created more significant concern about economic well-being and career flexibility [4]. HEIs have to respond to this natural fear of career obsolescence and career inadequacy. Funding resources for education are diminishing at a rapid rate [5]. Thus, implementing and maintaining a continuous improvement initiative in an academic environment is a challenging but ever-increasing demand [6,7]. The expectations of the mentioned stakeholders towards educational priorities, costs, accessibility, programmes and relevancy make it imperative for HEIs to undergo continual assessment and improvement [8]. Having this in mind, sustainable business excellence (SBE) could be used [9,10,11].
SBE is based on a business excellence (BE) concept, meaning that the exceptional levels of performance that meet or go beyond the expectations of different groups of stakeholders are obtained and kept, with current resource usage, which will not compromise future generations’ ability to meet their resource utilisation [12,13,14,15]. SBE represents a concept with many influencing factors: participation, motivation, professional staff training, a focus on customers, strategic planning, a focus on innovation and continuous improvement, leadership, process management, and most crucially sustainable resource management [16]. As a result, SBE was the target of many researchers and professional organisations through many models, techniques and tools [17,18,19].
In order to benchmark SBE on a national and international level, different award models have been developed. The most popular and the best known are the MBA (Malcolm Baldrige Award) in the USA [20], the Edward Deming Award and European Foundation of Quality Management (EFQM) [21,22], and other national award models (Great Britain, Denmark, Australia, New Zeeland, Hungary, France, Serbia, Russia). The common characteristic of all of the award models is that they are based on a self-assessment approach, benchmarking, or an external assessment by the founders of the different models. Those models are not designed or appropriate for simulation purposes. The development of an appropriate SBE model for simulation focusing on HEIs is the primary goal of this paper.
For centuries, HEI professors have been giving lectures by traditional methods while trying to make them more interactive. In such circumstances, information and communication technologies (ICT) represent an adequate educational transformation technology because they provide applications and tools to help professors integrate the traditional teaching method into a state-of-the-art ICT-based effective education system [23]. HEI professors can access the recently published material in an intelligent ICT education system and break down the learning outline into activities and lessons in order to gain more content consolidation and rehearsal. The idea is that interactive lectures keep students motivated and satisfy their learning curiosity [24]. However, HEIs never took this combination of education and an intelligent ICT education system seriously. HEIs did not fully integrate the ICT into their education systems, which was concluded during the current world pandemic, COVID-19.
In recent years, humanity is facing a new challenge in the form of COVID-19. Most of the HEIs around the world are closed. This pandemic is forcing ICT into the limelight more than ever in order to adapt and help HEIs’ educational needs. ICT provides a medium by which HEI professors, students, and other education community members can interact and improve the education system from the class level to the level of the national education sector. Having this in mind, the purpose of this paper is to define an integrative model of SBE related to ICT support, quality and leadership, and their impact on SBE in a transition economy. Transition economies are characteristic of countries that are in the process of moving or have recently moved from a centrally planned economic system to a market-driven system [25], and involve concepts such as the knowledge economy, digital economy and sustainable economy. The term is predominantly related to China, Eastern European countries and the former Soviet countries [26].
In this paper, the authors apply EFQM as a base research model. Following their previous research [27] on quality, ICT, leadership, process maturity, resilience, supply chain management, competitiveness, sustainability, SBE, and other aspects, an integrative meta model with the appropriate set of methodologies, techniques and tools are used. In this paper, the authors show some results of the impact of ICT support, quality (of processes, products and services) and leadership on the SBE as the dependent variable.
In the referent literature, partial relationships among variables and each variable structure have been analysed differently. The impact of quality based on the results of people, processes, products and services is recognised in the EFQM model in order to primarily achieve stakeholders’ requirements.
Additional quality management principles related to leadership, management, partnership and resources [28,29] are included in the analysis. Therefore, it is necessary to consider all of those principles as variables in a newly proposed model.
The impact of ICT on HEIs’ business results has been investigated extensively in the last twenty years, especially because it enables social interaction through various channels [30,31], especially in COVID-19 pandemic conditions. However, it depends on many factors, including the business environment, innovation culture, knowledge and team engineering [30,32,33].
The impact of leadership on HEIs’ business results has been analysed on the executive level, middle management level, team level and student level [1,34]. However, this variable has not been investigated enough for transition economies, and it is an additional challenge for the research.
This paper is structured into five chapters. After the introduction, a review of different closely related works which are relevant to the aim of this paper and its hypotheses is presented in the second chapter. In the third part of the paper, an integrative model of the SBE, based on the EFQM model, is presented along with the definition of the structure, relations, regression functions and variables. The sample structure of the HEIs in Serbia and Russia, and the model verification results based on the significance of the proposed model’s relations are presented in the fourth chapter. In this chapter, the authors also analyse the gap between the benchmarked level of SBE and one scenario for its advancement through the improvement of ICT support, leadership, quality and strategy. At the end of the paper, the conclusions are presented relating to the level, relationships and the possibility of improving SBE in HEI organisations.
2. Background
2.1. EFQM Model for Bussiness Excellence in HEIs
Initially, only industrial organisations used excellence models to achieve business excellence and success, such that business excellence was associated only with these organisations. These excellence models were constructed by particular bodies that have also helped industrial organisations to implement them [35]. The most prevalent BE models were the EFQM model in Europe and the Malcolm Baldrige model in the United States [36]. More than 59% of BE models worldwide, and 80% in Europe, were based on the EFQM BE Model [37]. The EFQM BE model has nine initial criteria covering enablers and results. Enabler criteria represent what an organisation does and how it does it, while result criteria represent what an organisation achieves [13]. The five enabler criteria include:
- Leadership, focusing on the ways in which leadership is developed and what it delivers to the organisation’s future.
- Strategy expresses how the organisation accomplishes its mission and vision statements, and it includes stakeholders in strategy development.
- People demonstrate that organisations should be able to build an appropriate organisational culture that promotes the growth of the employees’ competencies and endorses justice and fairness.
- Partnerships and resources characterise the ways in which organisations should examine their ecological and social impact effectively.
- Processes, products and services indicate that prominent organisations plan, manage and develop their processes in order to add value for stakeholders.
- The four results criteria include customer, people, society and business results:
- Customer results: excellent organisations accomplish and maintain extraordinary outcomes that meet or outpace customers’ needs and expectations [38].
- People results: excellent organisations accomplish and maintain extraordinary outcomes that meet or outpace their employees’ needs and expectations.
- Society results: this criterion concentrates on contribution to society in general and corporate social responsibility (CSR) in particular. CSR tends to focus on the organisations’ attempts to attain environmental, economic and social sustainability [39].
- Business results: the conventional way to measure organisational performance is based on various criteria, such as the organisations’ profitability, quality of products and services, and efficiency and effectiveness. However, various performance characteristics may contribute to a more holistic view of the organisation, and may be measured at the organisation, core process, or departmental level. Business results are divided into financial and non-financial results. Organisations should consider both in different situations, depending on the nature of their business and their structure [40].
Studies have shown that there has been more significant interest in the BE and EFQM model implementation from various public sector organisations in the last few years. This resulted in the EFQM developing a version of the model for the public sector [40]. Thus, the implementation of the EFQM excellence model represents an appropriate mean for the creation of the SBE model and self-assessment in HEIs. Furthermore, the EFQM model brings diverse tools for self-assessment, such as a questionnaire which requires employees to score their organisation against some statements from the EFQM model. There are various versions available, which allows the collection of opinions from many HEI employees [41,42]. In this paper, the point value scoring system was defined based on the model presented in [43], with slight modifications made in the Center for Quality at the Faculty of Engineering, University of Kragujevac.
The research area related to this paper is SBE and HEIs’ overall performance. Some authors connected and based their research on the EFQM excellence model. The EFQM model, the 2013 version, was analysed [44] by describing the enablers (leadership, people, strategy, partnership and resources, as well as processes, products and services) and results (people results, customer results, society results and business results).
In the paper [45], the authors analysed HEI SBE initiatives, including research with a case study of the HEIs’ quality management framework based on an adapted EFQM excellence model emphasising strategic development in the context of sustainability. An aspect of the selection of the helpful management tools for EFQM by quality function deployment (QFD) is presented in [46].
The concept of balanced score cards versus quality award models as strategic frameworks was analysed in [47]. Some authors discussed the aspect of the implementation of Six Sigma in SBE [48], because Six Sigma represents a process improvement methodology based on the application of technical statistics tools systematically and methodically to improve quality [49]. Six Sigma consists of six steps, namely: (1) Define (D), i.e., the selection of appropriate projects and the development of project plans and relevant process identification; (2) Measure (M), i.e., the measurement of the process variables through data quality checks; (3) Analyse (A), i.e., the use of graphical techniques to analyse processes; (4) Improve (I), i.e., the improvement of the existing process through experimentation and simulation techniques; (5) Control (C), i.e., the development of a control plan for process improvement; and (6) Reporting (R), i.e., the reporting of the benefits of the re-engineered process [50]. The application of the Six Sigma methodology is expected to achieve process production with 99.99966% of cases free of defects.
The connections and relationships of the different variables in the SBE model have an essential role. Zwan et al. [51] investigated alternative arguments and directions for the analysis of HEIs’ performance measurement. They concluded that it is necessary to consider internal dimensions, situational factors, external innovations, dimensions and outcomes. Starting from the EFQM model as well as previous research, the authors of this paper aimed at the third group of goals that we need to prove, i.e., that partnership and resources have a positive impact on customer results and society results, and that people results, customer results and society results have a positive impact on HEIs’ business results.
2.2. ICT Support in HEIs
The first research area related to this paper is ICT support for SBE in HEI organisations. The connection between ICT resources and e-learning has been researched in many papers [52]. However, due to pressure from a range of the mentioned stakeholders for a more comprehensive and improved range of services from the higher education sector, related to a simultaneously increasing pressure on sustainable resource utilisation, HEIs are currently facing the challenges of reorienting their approaches to be more customer-focused and conducting their processes in a more business-like manner. While trying to meet the demands of stakeholders, HEIs applied self-assessment models with various questionnaires, matrix charts, workshops, pro-forma and award simulations, ultimately resulting in the achievement of a broad acceptance of the SBE concept through a range of different goals set. These goals include the achievement of the HEI’s mission and vision, benchmarks and internal measures, best practice, community engagement, cost-effectiveness, customer/stakeholder satisfaction, making optimal use of all resources—financial, human and asset resources, and the positive atmosphere in staff and student environments—integration in teaching and research, the quality of teaching and learning, and (relative to the starting point) achieving targets [53]. HEIs’ ICT resources and e-learning synergy within the teaching process is achieved by supporting an appropriate ICT infrastructure, implementing ICT strategy development, managing the relations connected with ICT implementation, and the ICT resource management process. The authors [54] presented the research results conducted on a sample of Serbian HEIs (the data sample of the examinees consisted of 38 HEIs), showing that there is a significant correlation between the selected variables, i.e., access to teaching, the degree of interactivity, school computerisation, school administration, teacher training, school reorganisation, and the quality of ICT implementation.
In contrast, the influence of ICT integration on a teaching process is significantly lower because the success of the ICT’s integration into the teaching process does not depend solely on the conditions created for its use. The professor requires additional teaching strategies and methods to achieve learning objectives in the ICT classroom [55]. In this paper, the model of the management of the ICT resources was included based on resource-based theories. The authors started from the strategy, only for it to be followed by the definition and purchase of the needed ICT solutions. After the delivery of the ICT solutions, their practical implementation was observed. Finally, the contribution of the ICT to the fulfilment of the strategy related to different roles, disciplines, skills, knowledge, experience, teaching skills, behaviour and attitudes was evaluated at the human resources level in practice. According to this model, the ICT strategy balances business changes with ICT support.
The literature resources indicate a high correlation between ICT support and EFQM business excellence result criteria [40,56]. ICT mainly influences customer [57] and employee containment [58]. According to [13], one aspect of achieving SBE is contributing to society and creating a sustainable future. Having this in mind, it can be stated that ICT adaptation can help organisations to manage and coordinate sustainability challenges [59]. The connection between ICT and performance in business is well-proven. Studies have shown the positive influence of ICT support on tourism [60] and agricultural [61] business outcomes, meaning that ICT use and performance is not limited to any specific application field.
Furthermore, personal computers and the internet significantly influence today’s HEI education systems, transforming and developing education when properly and adequately utilised. The internet, an essential part of ICT used to provide quality teaching, learning and research in an academic setup [62], has influenced education competently, thereby creating the conditions for e-teaching, e-learning, visual teaching/learning, e-training and innovative education. Through ICT support, innovative educational ideas and sustainable improvement are supported with a lower cost [63]. Thus, ICT presents a powerful tool that may provide economic value for HEIs [64]. The understanding and efficient use of ICTs are crucial causes of sustainable development and SBE.
ICT support has been added to the SBE integrative model, and it covers ICT-related leadership, people, strategy and partnership, and resources [65]. However, because the SBE integrative model, based on the EFQM, already encompasses leadership, people, strategy and partnership, and resources, it is difficult to determine the independent impact of ICT support. Thus, it is hard to recognise the role of ICT support because other factors also directly influence the leadership, people, strategy and partnership, and resources derived from the SBE model. Based on previous research, the authors stated several hypotheses (as well as the research goal in this paper) that need to be proved: ICT support is positively correlated to quality (processes and HEI services), partnership and resources, HEI strategy, professors and students.
On the other hand, ICT support could be observed as an aggregate variable composed of [34]:
- The quality of the ICT functioning, based on reliability, ease of use, possibility to access, usefulness, and flexibility.
- The satisfaction of ICT users (students and professors), based on the reliability of obtaining a needed service, the speed of receiving the correct answer, empathy, and competencies for the supplied information.
For the aggregation of the sub-variables, it is possible to use different approaches (weighted assessment, statistical techniques and fuzzy approaches). Regarding ICT support, the level of investment at the ICT level of the ICT strategy, the level of management quality, and the process quality level have significant impacts [33]. In this research, the authors observed ICT support in a broader sense than ICT equipment and support by people, similar to Tirto et al. [66], in which the term “ICT support” was used to present digital scientific infrastructure according to the priorities of Industry 4.0 and Education 4.0 concepts. Other similar assumptions were derived in Fonseca et al. [45], in which digital scientific infrastructure was characterised by the advanced digitalisation and integration of industrial manufacturing and logistics processes, and the use of the internet and “smart” objects (machines and products) which merge the physical and virtual worlds. Thus, as we are all deeply in the Industry 4.0 and Education 4.0 concept, ICT has to be extracted, improved and more widely covered in the literature. According to Tirto et al. [66], in terms of HEIs, ICT development is vital for the provision of open access to scientific data and knowledge, and the further commercialisation of research, innovation, products and services. Thus, we have further expanded the model presented in Calvo-Mora et al. [67].
According to the research [33,68], it could be concluded that the level of investment made in ICT, directly and indirectly (through ICT strategy), influences the quality of the implementation of ICT solutions in HEIs. In the listed research, it was on average proven through different case studies and theoretical analyses that, in HEIs, there is a positive influence between the level of investment in ICT and the quality of the ICT’s implementation, with a higher or lower regression coefficient. The conclusion is that investments are meaningful and, when they are supported by an ICT strategy as an element of corporate strategy, show a higher level of quality in the implementation of the ICT solutions.
2.3. Leadership in HEIs
The impact of leadership on HEI SBE has been analysed according to: (1) leadership on the executive level, (2) leadership on the middle management level, (3) the team leadership level, and (4) self-leadership. Leadership on the executive level could be transformational or transactional, inspirational, innovative, strategic, practical, ethical, or other types [69,70,71]. Leadership on the middle management level is dominantly transactional, effective, innovative and ICT leadership [72,73,74]. Organisational learning leadership frequently requires strategic leaders to perform roles involving transformational and transactional behaviours under different conditions [75]. Leadership on the student level [76,77,78] refers to team leaders and team members. Self-leadership [73,79,80] is a less-investigated approach, especially not in the area of HEIs SBE. In all of the referenced papers, leadership is an essential factor (variable) affecting some other variables influenced by SBE. Accordingly, leadership is based on the following assumptions: (1) a leader is an initiator of social changes which could fulfil the needs of their followers; (2) a leader must integrate future changes based on the experience of changes that happened in the past; (3) a leader must create a balance between short-term results and long-term vision; and (4) a successful transformation is a test of leadership skills, which is created by forming a coalition for changes and development of vision.
Consequently, in [81], the impact of higher education shared leadership on external stakeholders was that shared leadership enables HEIs to create meaningful and lasting changes in organisations that address external challenges. The authors approved the proposition that the shared leadership enhances teaching performance through its effect on the teaching process, and was based on cognitive, affective and motivational processes. Different authors researched leadership according to many different aspects: the relationship between transformational leadership and the dissemination of HEIs’ goals [82,83,84], hierarchical levels and their correlations [78,85,86], transformational leadership and its variables [87,88], the effect of self-leadership [76,79], change and continuity [89,90], aspects of authentic leadership, creativity and innovation [82], approaches to transformational vs. non-transformational leadership in non-Western countries’ HEIs [91], and leadership and job satisfaction [92]. Elrehail [82] analysed leadership styles (authentic and transformational) which influence the process and product innovation. They concluded with relatively high correlation (0.541–0.732) and regression coefficients (0.183–0.248). Transformational leadership has a higher impact on process and product innovation, while authentic leadership has a lower impact. Different authors aimed to define the connections and relationships between leadership and different concepts. In this research, the authors will attempt to prove that the leadership level is positively associated with strategy process outcome levels, partnership and resources, and ICT support in HEIs.
3. Methodology
The methodology of this study required the use of a quantitative self-assessment questionnaire applied research approach because it focuses on analysing and evaluating several variables and exploring their relationships. In addition, the quantitative approach allowed comparisons between the SBE of several HEIs.
The research questions were as follows: (1) To what extent is the EFQM model appropriate for HEIs? (2) Is it possible to extract ICT support from enablers in the EFQM model and find its impact on sustainable business excellence in HEIs? (3) Is it possible to use EFQM criteria for the assessment of the possibility of improving sustainable business excellence in HEIs? (4) Which factors in the extended EFQM model have the highest impact on sustainable business excellence in HEIs? (5) To what extent is the proposed model applicable in HEIs? The SBE influencing criteria of leadership, quality and ICT support were the independent variables in this research.
Statistical methods were used to review and analyse the results of the data from the questionnaires. This approach enabled greater focus on each SBE variable type in order to generate detailed and insightful conclusions.
The data was the data collected and entered into the databases. After defining the variables, the database data was imported into the statistical data processing program (IBM SPSS v.21). The following methods were used in the research during the preparation of this paper: a comparative analysis from domestic and foreign literature; quality engineering methods; and a descriptive analysis of the leadership, quality, and ICT support influencing SBE in the considered HEIs. In addition, statistical techniques and SPSS software for multi regression analysis were used for the data analysis.
The process of model development is defined according to the philosophy of science [93]. In this research, the authors started from the previous research related to the EFQM model criteria, and according to a new role in HEIs they added ICT support. For the research question analysis, the authors used the following steps: (1) a conceptual modelling method for the development of the base model [94,95]; (2) a method of modelling SBE based on the EFQM excellence model; (3) statistical methods (IBM SPSS v.2019); (4) an expert assessment method based on appropriate questionnaires; and (5) a simulation method of complex dynamic systems [96]. The literature sources in the previous 20 years were more concerned with some criteria of existing BE models without sustainability. Our crucial novelty is related to the separated impact of the ICT needed for future innovative HEIs, the simulation of the critical factors’ impacts and finding the optimal way to enhance SBE.
For the statistical analysis, the authors selected 32 HEIs in Serbia and 45 HEIs in Russia. Questionnaires were sent to the relevant people in charge of the management of the HEIs. As a response, 17 HEIs in Serbia and 21 HEIs in Russia filled out the questionnaires received. In this way, the sample covered 38 HEIs.
The HEIs in both of the considered countries are obligated to apply a process of accreditation and quality improvement. A base for this process is a report of self-assessment filed by students, staff, and other mentioned stakeholders. These self-assessment reports are defined and reported to the management in order to inform universities and the governmental commission of accreditation on the quality of the HEIs, funded by the Ministry of Education. According to [97], self-assessment is a suitable methodology because it leads to the staff themselves identifying improvement possibilities and improvement actions. Furthermore, Zink [98] and Karapetrovic and Willborn [99] agreed that self-assessment is a powerful management tool, and that it enables a direction for continuous improvement initiatives in key performance areas. According to the stated facts, the research is based on a self-assessment questionnaire based on the official EFQM questionnaire and ICT support grounds.
The EFQM business excellence model (Figure 1) has been defined as the development model (Figure 2) based on conceptual modelling techniques while respecting the models defined according to the hypotheses.
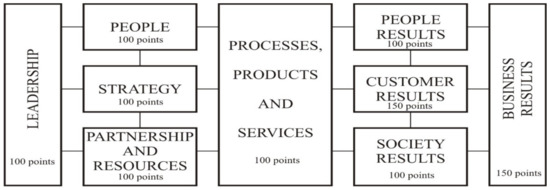
Figure 1.
EFQM as the model for the research [5].
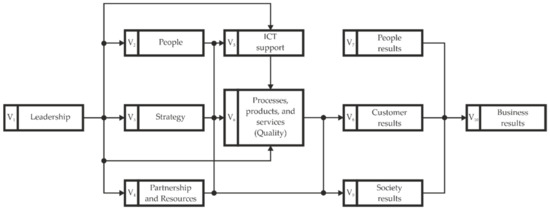
Figure 2.
The base research model of sustainable business excellence.
In this model, 23 relations associated with hypotheses were identified (Figure 3). Relation R1 is linked to the impact of general leadership on the effectiveness of the strategy, in which the executive and middle management play the dominant role. Other human resources will also affect the strategy, the level of partnership, and resources, and it affects the ICT leadership, but this is not included in the model. Relation R2 refers to the impact of leadership on human resources in companies (people). It is based on the Leader–Member Exchange (LMX) theory [70].
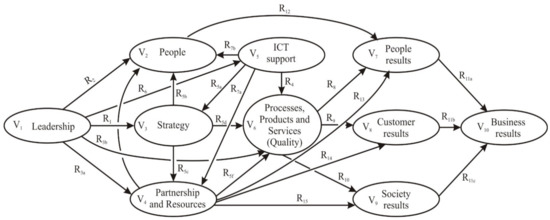
Figure 3.
The base model for sustainable business excellence simulation.
Relation R3a is related to the impact of leadership on partnership and resources, based on a critical leadership role to establish internal and external communication channels, and to direct employees to continuously create and perform an effective value chain [100]. Relation R3b is associated with the impact of leadership on quality (processes, products and services), while relation R4 is essential for the research. It is related to the impact of ICT support on the quality of processes, products and services. In this paper, this relationship is separately analysed because of the increasing importance of the application of ICT in the process of e-learning during the COVID 19 pandemic [101]. Relation R5a is defined to introduce ICT support’s impact on strategy. Relation R6 is related to the impact of leadership on ICT support, based on the Lean Six Sigma framework for quality excellence in HEIs concept [102], and HoshinKanry [103,104], in which all of the employees participate.
Processes, products and services have crucial roles in the EFQM model. These roles can be expressed in different ways. In this paper, the authors used the concept of quality. In this model, a variable is defined as the quality of processes, products and services. The value of this variable is defined as the arithmetic meaning of the process and service quality resulting from the processes in HEIs.
Relation R5b is conducted on the impact of strategy on people, and R5c is conducted on partnership and resources.
The previous analyses determined the impact of strategy on the development of partnerships and engagement resources. This impact is predominantly legitimate for HEIs in employability, flexible pedagogies, internationalisation, linking teaching and research, and retention and success [105].
The impact of teaching resources is expressed through competence, motivation, and other aspects of human resource involvement. This impact in the ISO 9000 series is expressed through awareness, competence and motivation [106,107].
Relation R5d is related to the impact of the strategy on the processes, products and services. On the other hand, strategy affects the strategy process and services strategy components.
Relation R5f refers to the impact of partnership and resources on the processes, products and services. Partnership affects the effectiveness of the process, oriented towards external stakeholders and the level of resource utilisation in relation to the process’s effectiveness, and thus the quality of the products and services as results of the processes.
Relationships R7a and R7b present the influence of ICT support on the people and partnerships, and resources criteria, respectively.
Relation R8 refers to the impact of V6 (process, production and services) on V7 (people results) and, in particular, on teaching staff satisfaction, motivation and loyalty. It is covered by international standards ISO 10,002 and ISO 18001, and other authors [108].
Relation R9 refers to the impact of V6 (process, production and services) on V8 (customer/students results). This impact is the most investigated research area related to quality as “a measure of satisfaction” [109].
Relation R10 shows the impact of the processes, products and services on society results. This impact is mainly described in the ISO 14000, ISO 26000, ISO 28,000 and ISO 50,000 standards, and according to the authors of [110], too.
Variables V7, V8, and V9 impact variable V10 (business results), and are represented through relations R11a, R11b and R11c.
The other considered relationships imply the impact of people criteria (R12) and partnership and resources (R13) on people results, and the impact of partnership and resources on customer (R14) and on society results (R15).
The directions of the introduced research data direction relations are derived according to input information from the literature and the EFQM BE model. In short, leadership is the engine, the driver and soul of all of the aspects of the quality system [67] (derived relations R1, R2, R3a, R3b, R6). In the centre of higher education, the overall vision may be demonstrated using clear goals shared by all: professors, students and managers. These goals must take shape in all of the activities of HEIs via the strategic planning process [111] (derived relations R5b, R5c, R5d). The appropriate personnel recruitment and selection policy, and a workforce trained, involved, and committed to quality and to the improvement of the organisation’s activities must affect the correct performance and improve the organisation’s critical processes. This leads to the achievement of better results (derived relations R8, R9, R10, R12). Despite this, HEIs, like any other organisation, must optimise the scarce resources they have and appropriately manage the suppliers of specific inputs, representing a high cost in budgetary terms [112]. This will lead to the better and more efficient management of their processes or critical activities and results. ICT transformation is revolutionising every sector, bringing significant performance improvement to the work of employees, strategy implementation, and relations with partners [56] (derived relations R5a, R7a, R7b). Finally, the underlying idea in the EFQM model is that customer satisfaction, employee satisfaction and society have a beneficial impact to produce excellent overall business results [113] (derived relations R11a, R11b, R11c).
Based on this model, the research methodology was developed and divided into four stages:
- Based on self-assessment, the analysis of the questionnaires to determine baseline variables V1–V10 and the regression coefficient relationships between them was performed.
- After eliminating the non-significant relationships in the base model, the final research model was determined and confirmed for the considered sample.
- After eliminating the non-significant relationships, the final model was determined, which became the basis for the simulation.
For simulation purposes in this model, positive impacts are assumed for any relationship of the simulation model, i.e., increasing the values of the cause will increase the values of the consequences. By applying statistical analysis, it is possible to determine the impact, the direction of the impact (positive or negative), and the correlation coefficients. Based on the literature recommendations, a thesis that the relationships are significant if the value of Pearson’s correlation coefficient is greater than 0.4 can be adopted.
During the simulation process, variables V1 (leadership), V5 (ICT support) and V6 (process, products and services) were increased, respectively, by 10%, 20% and 30% compared to the previously determined mean values of variables V1–V10. The simulations were used to perceive a possible increase in SBE according to the EFQM model equation:
ΔSBE = ΔV1 + ΔV2 + ΔV3 + ΔV4 + ΔV5 + ΔV6 + ΔV7 + ΔV8 + ΔV9 + ΔV10
4. Results
4.1. Higher Education Institutions in the Republic of Serbia and Russian Federation
The suggested model is applicable for HEIs in the Republic of Serbia and the Russian Federation. In this article, the authors showed the analysis of Serbian and Russian HEIs. The data of the universities is available on https://www.stat.gov.rs/en-US/oblasti/obrazovanje/visoko-obrazovanje (accessed on 8 March 2021) and on https://monitoring.miccedu.ru/websites (accessed on 9 March 2021), which include information of the following:
- Educational activities: the enrolment quality, the number of students, the number of academic competition winners, etc.
- Scientific research: the number of articles and citations, a great deal of research, the number of PhDs and Doctors of Science, etc.;
- Human resources: the total number of employees, the number of teaching staff with a doctorate, etc.
- International activities: the total number of international Bachelors students, Specialists and Master’s degree programs; the number of joint publications with foreign universities and authors, etc.
- Infrastructure: the gross floor area, the number of PCs, the share of PCs with internet access, the availability of a library, etc.
- Business performance: the total HIE revenue, the income share of the scientific research of the total revenue of the university, etc.
For the verification of the proposed models, a sample of 17 Serbian HEIs and 21 Russian HEIs was obtained, of which informative structures regarding the number of students are presented in Table 1 and Table 2. Additionally, the Russian Federation HEIs are on the list of the education development program of the Russian Federation (5-100-2020). The goal of the program is to break into the world rankings. The authors chose these universities because they are interested in developing leadership, strategy, ICT support and other essential components for the EFQM. The list of 5-100-2020 universities can be found on https://www.5top100.ru/universities (accessed on 8 March 2021).

Table 1.
Total number of students at Serbian HEIs.
Table 2.
Total number of students at Russian HEIs.
In the Republic of Serbia, smaller HEIs with a number of students lower than 10,000 had a dominant share of 65% in the sample, while the share of larger HEIs with a number of students higher than 10,000 was 35%.
However, in the Russian Federation, smaller HEIs with a number of students lower than 10,000 had a non-dominant share of 28% in the sample, while the share of larger HEIs with a number of students higher than 10,000 was 72%.
4.2. Determination of the Initial Values of the Variables and the Relationships between Them
In order to determine the initial values of the variables, the appropriate questionnaire, according to the self-assessment EFQM model, was developed [13]. The questionnaires were sent to the HEIs’ representatives. Each variable was appropriately described, with the clarification of its structure. For the aggregation, the weighting method was used based on expert assessment because there was not enough information about the interviewed enterprises.
For the HEI representatives’ statistical estimation, the authors considered the following indicators:
- Leadership (V1) can be assessed by analysing business performance, because the leadership helps to attract more financing by both state programs and private partnerships. Leadership (variable V1) is decomposed on V11 (executive leadership), V12 (middle-level leadership), V13 (team leadership) and V14 (self-leadership), and the overall value of V1 is calculated for each HEI as the arithmetic mean.
- People (V2) can be assessed by analysing the number of PhDs and Doctors of Science at the universities.
- Strategy (V3) can be assessed based on an integral estimation, available on www.monitoring.miccedu.ru (accessed on 30 June 2021) at E.8. It includes the analysis of 56 leading indicators of the development of a university.
- Partnership and resources (V4) can be assessed by analysing various international students and foreign partners.
- ICT support (V5) can be assessed by analysing the number of PCs per student, printers, server computers, internet package characteristics, video conferencing tools for online teaching and licenses for leading software tool applications, etc.
- Process, production and services (V6) can be assessed by analysing the level of applicants (exam grades and level of competition), as this data shows the quality of education and the competitiveness of a university.
- People results (V7) can be assessed by analysing the average salary of professors compared to the average salary in a region or country.
- Customer results (V8) can be assessed by analysing the revenue of a university or its tuition costs.
- Society results (V9) can be assessed by analysing publications, or the position of the university in the world rankings.
- Business results (V10) can be assessed using the proposition of the EFQM model by the self-assessment approach.
Exploratory factor analysis (EFA) was used with an Eigenvalue of more than 1 to parse out ICT. The related vital factors were: (ICT1) ICT leadership, (ICT2) ICT management, (ICT3) the level of ICT support for critical business processes, (ICT4) the level of introduced ICT, (ICT5) the level of ICT usage for business decisions, and (ICT6) the knowledge of employees related to ICT in their processes.
This analysis suggested one construct, and all of the variables were loaded under the related ICT construct. The loading values were above 0.5, and there were no cross-loading issues or low-loading values. The reliability of the research model was also good. The Cronbach’s α coefficient value was 0.924, noticeably exceeding the standard threshold value of 0.7 [114]. Table 3 shows the results for EFA. The total variance explained by six constructs is 72.886% (Table 4).
Table 3.
Exploratory factor analysis.
Table 4.
Reliability analysis.
The values in Table 5 and Table 6 were calculated according to the maximal value for the criteria, because EFQM criteria values are expressed in points. The values presented were calculated as the arithmetic means of points obtained through self-assessment by the members of the HEI management teams. A possible further step is that if the sum of the points is higher than the minimum EFQM accepted value, HEIs may undergo external evaluation.
Table 5.
Serbian HEIs’ analysis results.
Table 6.
Russian HEIs’ analysis results.
4.3. Analysis of the Research Results
IBM SPSS software was used to calculate the mean values and correlations between the variables (Table 7 and Table 8).
Table 7.
Descriptive statistics.
Table 8.
Overall assessment of the Pearson correlation coefficients for the Serbian and Russian HEIs.
The analysis of the descriptive statistics showed:
- the relatively lower values of the means for the variables on a scale from 1 to 100 and from 1 to 150, ranging from 63.27 to 80.49;
- the relatively low variance in the range of 15.65–26.65%.
The authors built the correlation matrix shown below for the overall sample, which included Serbian and Russian HEIs.
Based on the analysis of the Pearson’s correlation coefficient values, it was found that:
- the correlations are more significant than 0.4, meaning that it is possible to establish the necessary regression equations for the further modelling and simulation of the SBE values;
- because the HEI SBE model is based on the EFQM excellence model, it was observed in the same relation only in the base model with a significance above 0.4;
- based on the correlation coefficient values and the initial model presented in Figure 3, the following relationships between the variables were established using IBM SPSS (see Appendix A):
V2 = −0.028 + 0.160 × V1 + 0.390 × V3 − 0.086 × V4 + 0.492 × V5
V3 = 14.994 + 0.314 × V1 + 0.471 × V5
V4 = 16.999 + 0.200 × V1 + 0.269 × V3 + 0.252 × V5
V5 = 17.429 + 0.770 × V1
V6 = 2.081 + 0.332 × V1 + 0.227 × V3−0.005 × V4 + 0.384 × V5
V7 = 12.112 + 0.122 × V2 + 0.219 × V4 + 0.527 × V6
V8 = −6.005 + 0.659 × V4 + 0.637 × V6
V9 = 9.753 + 0.214 × V4 + 0.674 × V6
V10 = 11.817 − 0.262 × V7 + 0.556 × V8 + 0.657 × V9
The previously established relationships are the basis for the simulation of the impact of leadership (V1), ICT support (V5), and quality (of processes, production and services—V6) on SBE. The simulation was performed in order to determine, at a general level, whether a long-term investment in leadership development, ICT support and quality improvement can lead to SBE enhancement. This simulation was based on the initial assessment of the SBE EFQM model and the application of a mean value of each variable (VI mean):
SBE = V1 mean + V2 mean + V3 mean + V4 mean + V5 mean +
V6 mean + V7 mean + V8 mean + V9 mean + V10 mean
V6 mean + V7 mean + V8 mean + V9 mean + V10 mean
Consequently, if variables V1, V5 and V6′s impacts are simulated with the variation of the variables V1, V5 and V6 to +10, +20 and +30%, the expected increase in HEI SBE is obtained. From Figure 4 it can be seen that the increases of SBE are 8.27%, 8.04% and 13.38% for each iterative increase of the V1, V5 and V6 variable values, respectively. Accordingly, these results could be considered promising. According to [66], so called “soft” factors, including behavioural aspects of management, could be used to achieve such results, e.g., timework and communication, employee training, motivation, business process management, top management and leadership, etc. Their effective use can lead to continuous quality improvement [115], employees’ interactive skill enhancement [116], and overall SBE achievement.
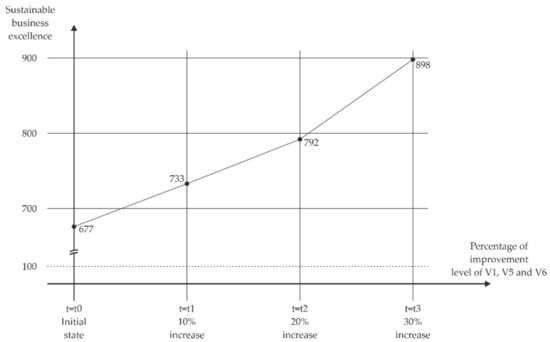
Figure 4.
The expected improvement of higher educational institutions’ sustainable business excellence.
This procedure is determined by the mean value of the company’s SBE in a sample (of 677 points). In this way, the base hypotheses H1, H2, and H3 were confirmed.
For more HEIs, SBE improvement is necessary to further analyse the effects of improvement projects, particularly from the perspective of improving business processes, energy efficiency and sustainability, etc.
5. Discussion
Table 9 shows the full hypothesis testing results, and most hypotheses were supported. Leadership, process, production, and services (quality) and ICT support had significant positive relationships with business results and other EFQM model criteria.
Table 9.
Summary of the hypothesis testing.
The results show a significant relationship between HEIs’ leadership, ICT support, quality and SBE. These results are consistent with the conclusion drawn by Tarı [41], that leadership commitment is essential to sustain HEIs’ excellent customer and business results. ICT support had significant effects on the partnership and resources, and people criteria, and through them significantly impacted people results and business results, which is consistent with the previous findings [40]. ICT support had a significant positive effect on the people and process, production, and services (quality) criteria.
6. Conclusions
This paper aimed to examine issues in implementing a modified EFQM excellence model for self-assessment within HEIs in Serbia and Russia in order to determine sustainable excellence, because achieving sustainable excellence has become a condition for survival in the global economy. It was perceived that the use of the EFQM excellence model’s self-assessment in the public sector, particularly the higher education field, has lagged behind that in the private sector. This was somewhat because of the lag in adapting the EFQM excellence model for public sector use, and due to the lack of pressure to respond to customers through continuous improvement in the public sector when compared with the private sector. However, in terms of constraints, especially financial resources, the solution should be in “soft” factors. In this paper, the authors tested the possible impact of ICT support, leadership and quality, and other influential factors of SBE.
The research has a theoretical and empirical character. Regarding the theoretical results presented, the integrative SBE model, based on the EFQM model, was developed using complex modelling and dynamic system techniques. The practical implication of the research is to determine the impact level of the ICT support, leadership, quality (of the process, the products and the services), and strategy variables on HEI SBE in a proposed model.
Consequently, the synergistic influence of the independent variables on SBE as a dependent variable was identified. This means that the authors of this paper needed to measure this synergic effect of ICT, quality and leadership, and their impact on HEI SBE’s net benefit.
A sample of 38 HEIs from Serbia and Russia was formed in order to confirm the possibility of SBE achievement in the higher education field through the influence of ICT support, leadership and quality variable components. The research performed in Serbian and Russian HEIs demonstrated the robustness of the model and the possibility of the improvement of the dependent variable, SBE, with a small amount of investment in undependable variables: ICT support, leadership and quality.
What was found based on the responses and from the statistical analysis performed using the SPSS software package, IBM, was:
- the average of the model variables (63.27–80.49) and their variance (15.65–26.65%) was satisfactory;
- there were correlations among the variables in the model range from 0.587 to 0.828;
- this was used as a starting point to form the basic model, including the relationship with a correlation of 0.4, which is essential for simulation in the overall model;
- based on the prior established mean value of BE of the company in the observed sample of 677 points, which was more than was expected for transition conditions in Serbia;
- through the variation of the variables leadership (V1), ICT support (V5), and quality (V6) by, respectively, 10, 20 and 30%, a new (expected) value of BE could be calculated. It can be increased up to 8.27%, 8.04% and 13.38% iteratively, which is an essential source of corporate competitiveness.
According to the analysis of the data, the questionnaire and the statistical analysis, it was shown that self-assessment allows HEIs to identify their strengths and the areas in which improvements can be made, and then to plan improvement actions. The results show that HEIs can use self-assessment as a tool for continuous improvement planning, as it is in the business sector. However, integrating the EFQM excellence model’s self-assessment into higher education presents challenges for those tasked with its incorporation. The early signs are that EFQM model self-assessment can help to produce a more customer-oriented culture in HEIs, through ICT support, leadership and quality criteria enhancement.
This HEI SBE model’s limitations have to be stressed. First of all, this is a descriptive study, and so the causal relationship interpretation between the methods described and the results obtained is restricted. Other limitations are associated with the referent modified EFQM model, the structure of the variables, and the sample size. It is difficult to extrapolate the lessons learnt from a particular HEI to other situations while avoiding over-generalisations. From the angle of the modified model limitation, this can be overcome by including the other variations of SBE models and their integration. The values of variables are defined as single values according to the EFQM model with the response to appropriate questions. In further research, the sample size will undoubtedly be increased in the coming period, considering the HEIs’ structures and a regional aspect. This regional aspect is also related to differences in sectors.
In future research, the emphasis will be on the prevailing constraints, extending the SBE model, comparative analyses of countries in a transition economy, impact analysis, and other variables affecting operational excellence, sustainability and enterprise competitiveness.
Author Contributions
Conceptualisation, S.A. and N.S.; methodology, S.A.; software, A.Đ.; validation, A.P., A.Đ. and Y.K.; formal analysis, A.Đ.; investigation, Y.K.; data curation, L.S.; visualisation, L.S.; supervision, S.A.; project administration, Y.K.; funding acquisition, Y.K. All authors have read and agreed to the published version of the manuscript.
Funding
This research was funded by Peter the Great St. Petersburg Polytechnic University.
Institutional Review Board Statement
Not applicable.
Informed Consent Statement
Not applicable.
Data Availability Statement
Not applicable.
Acknowledgments
The research was funded by Peter the Great St. Petersburg Polytechnic University, Ministry of Science and Higher Education of the Russian Federation.
Conflicts of Interest
The authors declare no conflict of interest.
Appendix A
Table A1.
Model summary for leadership, strategy, partnership and resources, and ICT support’s impacts on people.
Table A1.
Model summary for leadership, strategy, partnership and resources, and ICT support’s impacts on people.
| Model | R | R Square | Adjusted R Square | Std. Error of the Estimate | Change Statistics | ||||
|---|---|---|---|---|---|---|---|---|---|
| R Square Change | F Change | df1 | df2 | Sig. F Change | |||||
| 1 | 0.898 a | 0.807 | 0.783 | 7.89023 | 0.807 | 34.424 | 4 | 33 | 0.000 |
Predictors: (constant), V5, V1, V3, V4.
Table A2.
Coefficients for leadership, strategy, partnership and resources, and ICT support’s impacts on people.
Table A2.
Coefficients for leadership, strategy, partnership and resources, and ICT support’s impacts on people.
| Model | Unstandardised Coefficients | Standardised Coefficients | t | Sig. | Collinearity Statistics | |||
|---|---|---|---|---|---|---|---|---|
| B | Std. Error | Beta | Tolerance | VIF | ||||
| 1 | (Constant) | −0.028 | 6.740 | −0.004 | 0.997 | |||
| V1 | 0.160 | 0.135 | 0.165 | 1.190 | 0.243 | 0.304 | 3.287 | |
| V3 | 0.390 | 0.155 | 0.361 | 2.517 | 0.017 | 0.285 | 3.503 | |
| V4 | −0.086 | 0.205 | −0.065 | −0.419 | 0.678 | 0.244 | 4.101 | |
| V5 | 0.492 | 0.149 | 0.499 | 3.304 | 0.002 | 0.257 | 3.888 | |
Dependent variable: V2.
Table A3.
Model Summary for leadership and ICT support’s impacts on Strategy.
Table A3.
Model Summary for leadership and ICT support’s impacts on Strategy.
| Model | R | R Square | Adjusted R Square | Std. Error of the Estimate | Change Statistics | ||||
|---|---|---|---|---|---|---|---|---|---|
| R Square Change | F Change | df1 | df2 | Sig. F Change | |||||
| 1 | 0.820 a | 0.673 | 0.654 | 9.20085 | 0.673 | 36.037 | 2 | 35 | 0.000 |
Predictors: (Constant), V5, V1.
Table A4.
Coefficients for leadership and ICT support’s impacts on strategy.
Table A4.
Coefficients for leadership and ICT support’s impacts on strategy.
| Model | Unstandardised Coefficients | Standardised Coefficients | t | Sig. | Collinearity Statistics | |||
|---|---|---|---|---|---|---|---|---|
| B | Std. Error | Beta | Tolerance | VIF | ||||
| 1 | (Constant) | 14.994 | 6.227 | 2.408 | 0.021 | |||
| V1 | 0.314 | 0.140 | 0.351 | 2.248 | 0.031 | 0.384 | 2.603 | |
| V5 | 0.471 | 0.142 | 0.516 | 3.310 | 0.002 | 0.384 | 2.603 | |
Dependent Variable: V3.
Table A5.
Model summary for leadership, strategy and ICT support’s impacts on partnership and resources.
Table A5.
Model summary for leadership, strategy and ICT support’s impacts on partnership and resources.
| Model | R | R Square | Adjusted R Square | Std. Error of the Estimate | Change Statistics | ||||
|---|---|---|---|---|---|---|---|---|---|
| R Square Change | F Change | df1 | df2 | Sig. F Change | |||||
| 1 | 0.870 a | 0.756 | 0.735 | 6.58935 | 0.756 | 35.141 | 3 | 34 | 0.000 |
Predictors: (Constant), v5, v1, v3.
Table A6.
Coefficients for leadership, strategy and ICT support’s impacts on partnership and resources.
Table A6.
Coefficients for leadership, strategy and ICT support’s impacts on partnership and resources.
| Model | Unstandardised Coefficients | Standardised Coefficients | t | Sig. | Collinearity Statistics | |||
|---|---|---|---|---|---|---|---|---|
| B | Std. Error | Beta | Tolerance | VIF | ||||
| 1 | (Constant) | 16.999 | 4.815 | 3.531 | 0.001 | |||
| V1 | 0.200 | 0.107 | 0.274 | 1.874 | 0.070 | 0.336 | 2.979 | |
| V3 | 0.269 | 0.121 | 0.329 | 2.222 | 0.033 | 0.327 | 3.059 | |
| V5 | 0.252 | 0.117 | 0.339 | 2.163 | 0.038 | 0.293 | 3.418 | |
Dependent variable: V4.
Table A7.
Model summary for leadership’s impact on ICT support.
Table A7.
Model summary for leadership’s impact on ICT support.
| Model | R | R Square | Adjusted R Square | Std. Error of the Estimate | Change Statistics | ||||
|---|---|---|---|---|---|---|---|---|---|
| R Square Change | F Change | df1 | df2 | Sig. F Change | |||||
| 1 | 0.785 a | 0.616 | 0.605 | 10.78319 | 0.616 | 57.723 | 1 | 36 | 0.000 |
Predictors: (constant), V1.
Table A8.
Coefficients for leadership’s impact on ICT support.
Table A8.
Coefficients for leadership’s impact on ICT support.
| Model | Unstandardised Coefficients | Standardised Coefficients | t | Sig. | Collinearity Statistics | |||
|---|---|---|---|---|---|---|---|---|
| B | Std. Error | Beta | Tolerance | VIF | ||||
| 1 | (Constant) | 17.429 | 6.695 | 2.603 | 0.013 | |||
| V1 | 0.770 | 0.101 | 0.785 | 7.598 | 0.000 | 1.000 | 1.000 | |
Dependent variable: V5.
Table A9.
Model summary for leadership, strategy, partnership and resources, and ICT support’s impacts on processes, products and services.
Table A9.
Model summary for leadership, strategy, partnership and resources, and ICT support’s impacts on processes, products and services.
| Model | R | R Square | Adjusted R Square | Std. Error of the Estimate | Change Statistics | ||||
|---|---|---|---|---|---|---|---|---|---|
| R Square Change | F Change | df1 | df2 | Sig. F Change | |||||
| 1 | 0.841 a | 0.707 | 0.672 | 10.01507 | 0.707 | 19.926 | 4 | 33 | 0.000 |
Predictors: (constant), V5, V1, V3, V4.
Table A10.
Coefficients for leadership, strategy, partnership and resources, and ICT support’s impacts on processes, products and services.
Table A10.
Coefficients for leadership, strategy, partnership and resources, and ICT support’s impacts on processes, products and services.
| Model | Unstandardised Coefficients | Standardised Coefficients | t | Sig. | Collinearity Statistics | |||
|---|---|---|---|---|---|---|---|---|
| B | Std. Error | Beta | Tolerance | VIF | ||||
| 1 | (Constant) | 2.081 | 8.555 | 0.243 | 0.809 | |||
| V1 | 0.332 | 0.171 | 0.332 | 1.946 | 0.060 | 0.304 | 3.287 | |
| V3 | 0.227 | 0.197 | 0.203 | 1.152 | 0.258 | 0.285 | 3.503 | |
| V4 | −0.005 | 0.261 | −0.004 | −0.021 | 0.984 | 0.244 | 4.101 | |
| V5 | 0.384 | 0.189 | 0.377 | 2.027 | 0.051 | 0.257 | 3.888 | |
Dependent variable: V6.
Table A11.
Model summary for strategy, partnership and resources, and processes, products and services’ impacts on people results.
Table A11.
Model summary for strategy, partnership and resources, and processes, products and services’ impacts on people results.
| Model | R | R Square | Adjusted R Square | Std. Error of the Estimate | Change Statistics | ||||
|---|---|---|---|---|---|---|---|---|---|
| R Square Change | F Change | df1 | df2 | Sig. F Change | |||||
| 1 | 0.794 a | 0.630 | 0.598 | 10.42737 | 0.630 | 19.320 | 3 | 34 | 0.000 |
Predictors: (constant), V6, V2, V4.
Table A12.
Coefficients for strategy, partnership and resources, and processes, products and services’ impacts on people results.
Table A12.
Coefficients for strategy, partnership and resources, and processes, products and services’ impacts on people results.
| Model | Unstandardised Coefficients | Standardised Coefficients | t | Sig. | Collinearity Statistics | |||
|---|---|---|---|---|---|---|---|---|
| B | Std. Error | Beta | Tolerance | VIF | ||||
| 1 | (Constant) | 12.112 | 8.798 | 1.377 | 0.178 | |||
| V2 | 0.122 | 0.167 | 0.126 | 0.732 | 0.469 | 0.369 | 2.712 | |
| V4 | 0.219 | 0.227 | 0.171 | 0.968 | 0.340 | 0.350 | 2.856 | |
| V6 | 0.527 | 0.153 | 0.560 | 3.447 | 0.002 | 0.412 | 2.427 | |
Dependent variable: V7.
Table A13.
Model summary for strategy, partnership and resources, and processes, products and services’ impacts on customer results.
Table A13.
Model summary for strategy, partnership and resources, and processes, products and services’ impacts on customer results.
| Model | R | R Square | Adjusted R Square | Std. Error of the Estimate | Change Statistics | ||||
|---|---|---|---|---|---|---|---|---|---|
| R Square Change | F Change | df1 | df2 | Sig. F Change | |||||
| 1 | 0.683 a | 0.467 | 0.436 | 20.01382 | 0.467 | 15.322 | 2 | 35 | 0.000 |
Predictors: (constant), V6, V4.
Table A14.
Coefficients for strategy, partnership and resources, and processes, products and services’ impacts on customer results.
Table A14.
Coefficients for strategy, partnership and resources, and processes, products and services’ impacts on customer results.
| Model | Unstandardised Coefficients | Standardised Coefficients | t | Sig. | Collinearity Statistics | |||
|---|---|---|---|---|---|---|---|---|
| B | Std. Error | Beta | Tolerance | VIF | ||||
| 1 | (Constant) | −6.005 | 16.879 | −0.356 | 0.724 | |||
| V4 | 0.659 | 0.375 | 0.316 | 1.756 | 0.088 | 0.470 | 2.127 | |
| V6 | 0.637 | 0.275 | 0.418 | 2.322 | 0.026 | 0.470 | 2.127 | |
Dependentv: V8.
Table A15.
Model summary for strategy, partnership and resources, and processes, products and services’ impacts on society results.
Table A15.
Model summary for strategy, partnership and resources, and processes, products and services’ impacts on society results.
| Model | R | R Square | Adjusted R Square | Std. Error of the Estimate | Change Statistics | ||||
|---|---|---|---|---|---|---|---|---|---|
| R Square Change | F Change | df1 | df2 | Sig. F Change | |||||
| 1 | 0.873 a | 0.762 | 0.748 | 7.99224 | 0.762 | 56.057 | 2 | 35 | 0.000 |
Predictors: (constant), V6, V4.
Table A16.
Coefficients for strategy, partnership and resources, and processes, products and services’ impacts on society results.
Table A16.
Coefficients for strategy, partnership and resources, and processes, products and services’ impacts on society results.
| Model | Unstandardised Coefficients | Standardised Coefficients | t | Sig. | Collinearity Statistics | |||
|---|---|---|---|---|---|---|---|---|
| B | Std. Error | Beta | Tolerance | VIF | ||||
| 1 | (Constant) | 9.753 | 6.741 | 1.447 | 0.157 | |||
| V4 | 0.214 | 0.150 | 0.172 | 1.431 | 0.161 | 0.470 | 2.127 | |
| V6 | 0.674 | 0.110 | 0.740 | 6.153 | 0.000 | 0.470 | 2.127 | |
Dependent variable: V9.
Table A17.
Model summary for people results, customer results and society results on business results.
Table A17.
Model summary for people results, customer results and society results on business results.
| Model | R | R Square | Adjusted R Square | Std. Error of the Estimate | Change Statistics | ||||
|---|---|---|---|---|---|---|---|---|---|
| R Square Change | F Change | df1 | df2 | Sig. F Change | |||||
| 1 | 0.873 a | 0.761 | 0.740 | 11.32517 | 0.761 | 36.162 | 3 | 34 | 0.000 |
Predictors: (constant), V9, V8, V7.
Table A18.
Coefficients for people results, customer results and society results on business results.
Table A18.
Coefficients for people results, customer results and society results on business results.
| Model | Unstandardised Coefficients | Standardised Coefficients | t | Sig. | Collinearity Statistics | |||
|---|---|---|---|---|---|---|---|---|
| B | Std. Error | Beta | Tolerance | VIF | ||||
| 1 | (Constant) | 11.817 | 8.347 | 1.416 | 0.166 | |||
| V7 | −0.262 | 0.198 | −0.194 | −1.323 | 0.195 | 0.326 | 3.064 | |
| V8 | 0.556 | 0.094 | 0.667 | 5.946 | 0.000 | 0.558 | 1.793 | |
| V9 | 0.657 | 0.191 | 0.471 | 3.437 | 0.002 | 0.373 | 2.680 | |
Dependent variable: V10.
References
- Psomas, E.; Antony, J. Total quality management elements and results in higher education institutions. Qual. Assur. Educ. 2017, 25, 206–223. [Google Scholar] [CrossRef]
- Venkatraman, S.; de Souza-Daw, T.; Kaspi, S. Improving employment outcomes of career and technical education students. High. Educ. Ski. Work. Learn. 2018, 8, 469–483. [Google Scholar] [CrossRef]
- Temponi, C. Continuous improvement framework: Implications for academia. Qual. Assur. Educ. 2005, 13, 17–36. [Google Scholar] [CrossRef]
- Mehrdad, S. A New Framework Based on EFQM to Achieve Continuous Improvement in Higher Education Institutions (HEIs). Ph.D. Thesis, Doğu Akdeniz Üniversitesi, Famagusta, Turkey, 2015. [Google Scholar]
- Patel, D.S.G. TQM in higher education institutions (HEIs). Education 2013, 2, 1–5. [Google Scholar]
- Evans, J.; Lindsay, W.M. The Management and Control of Quality; South-Western Cengage Learning: Boston, MA, USA, 2001; pp. 60–190. [Google Scholar]
- Baldwin, G. The student as a customer: The discourse of quality. J. High. Educ. Manag. 1994, 9, 131–139. [Google Scholar]
- Padró, F.F.; Sankey, M. Benchmarking as an Instrument for Continuous Improvement in a Regulated Higher Education Quality Assurance Environment. In Advances in Logistics, Operations, and Management Science; IGI Global: Hershey, PA, USA, 2018; pp. 35–73. [Google Scholar]
- Aikens, C.H. Quality Inspired Management: The Key to Sustainability; Prentice Hall: Boston, MA, USA, 2011. [Google Scholar]
- Agrawal, N. A framework for Crosby’s quality principles using ISM and MICMAC approaches. TQM J. 2019, 32, 305–330. [Google Scholar] [CrossRef]
- Klochkov, Y.S.; Tveryakov, A.M. Approaches to the improvement of quality management methods. Int. J. Syst. Assur. Eng. Manag. 2020, 11, 163–172. [Google Scholar] [CrossRef]
- Van Kemenade, E.; Hardjono, T.W. Twenty-first century total quality management: The emergence paradigm. TQM J. 2019, 31, 150–166. [Google Scholar] [CrossRef]
- EFQM. EFQM Model Criteria. 2013. Available online: http://www.efqm.org/efqm-model/model-criteria (accessed on 9 June 2021).
- Imperatives, S. Report of the World Commission on Environment and Development: Our Common Future; Oxford University Press: Oxford, UK, 1987. [Google Scholar]
- Dervitsiotis, K. The pursuit of sustainable business excellence: Guiding transformation for effective organisational change. Total Qual. Manag. Bus. Excel. 2003, 14, 251–267. [Google Scholar] [CrossRef]
- Bolboli, S.A.; Reiche, M. A model for sustainable business excellence: Implementation and the roadmap. TQM J. 2013, 25, 331–346. [Google Scholar] [CrossRef]
- Metaxas, I.; Koulouriotis, D. A theoretical study of the relation between TQM, assessment and sustainable business excellence. Total Qual. Manag. Bus. Excel. 2014, 25, 494–510. [Google Scholar] [CrossRef]
- Marković, V.; Stajić, L.; Stević, Ž.; Mitrović, G.; Novarlić, B.; Radojičić, Z. A novel integrated subjective-objective MCDM model for alternative ranking in order to achieve business excellence and sustainability. Symmetry 2020, 12, 164. [Google Scholar] [CrossRef]
- Gan, G.C.; Chong, C.W.; Yuen, Y.Y.; Teoh, W.M.Y.; Rahman, M.S. Executive coaching effectiveness: Towards sustainable business excellence. Total Qual. Manag. Bus. Excel. 2020, 1, 1–19. [Google Scholar] [CrossRef]
- Aydın, S.; Kahraman, C. Evaluation of firms applying to malcolm baldrige national quality award: A modified fuzzy AHP method. Complex Intell. Syst. 2018, 5, 53–63. [Google Scholar] [CrossRef]
- Evans, J. Quality, Management, Organization and Strategy; South-Western Cengage Learning: Boston, MA, USA, 2011. [Google Scholar]
- Escrig-Tena, A.B.; Garcia-Juan, B.; Segarra-Ciprés, M. Drivers and internalisation of the EFQM excellence model. Int. J. Qual. Reliab. Manag. 2019, 36. [Google Scholar] [CrossRef]
- Ghavifekr, S.; Rosdy, W.A.W. Teaching and learning with technology: Effectiveness of ICT integration in schools. Int. J. Res. Educ. Sci. 2015, 1, 175. [Google Scholar] [CrossRef]
- Paudel, P. Online education: Benefits, challenges and strategies during and after COVID-19 in higher education. Int. J. Stud. Educ. 2020, 3, 70–85. [Google Scholar] [CrossRef]
- Roztocki, N.; Soja, P.; Weistroffer, H.R. Enterprise systems in transition economies: Research landscape and framework for socioeconomic development. Inf. Technol. Dev. 2020, 26, 1–37. [Google Scholar] [CrossRef]
- Stal, J.; Paliwoda-Pękosz, G. Fostering development of soft skills in ICT curricula: A case of a transition economy. Inf. Technol. Dev. 2019, 25, 250–274. [Google Scholar] [CrossRef]
- Arsovski, Z.; Arsovski, S.; Nikezić, S. Developement of quality management in enterprises of Serbia. J. Tech. Tehnol. Educ. Manag. 2012, 7, 944–949. [Google Scholar]
- Oukland, J. Oukland on Quality Management; Elsevier: Burlington, NJ, USA, 2004. [Google Scholar]
- Pambreni, Y.; Khatibi, A.; Azam, S.; Tham, J. The influence of total quality management toward organisation performance. Manag. Sci. Lett. 2019, 9, 1397–1406. [Google Scholar] [CrossRef]
- Almarghani, E.M.; Mijatovic, I. Factors affecting student engagement in HEIs—It is all about good teaching. Teach. High. Educ. 2017, 22, 940–956. [Google Scholar] [CrossRef]
- Dumpit, D.Z.; Fernandez, C.J. Analysis of the use of social media in higher education institutions (HEIs) using the technology acceptance model. Int. J. Educ. Technol. High. Educ. 2017, 14, 5. [Google Scholar] [CrossRef]
- Ricardo-Barreto, C.T.; Molinares, D.J.; Llinás, H.; Santodomíngo, J.M.P.; Acevedo, C.M.A.; Rodríguez, P.D.A.; Navarro, C.P.B.; Villa, S.M.V. Trends in using ICT resources by professors in HEIs (higher education institutions). J. Inf. Technol. Educ. Res. 2020, 19, 395–425. [Google Scholar] [CrossRef]
- Nazri, S.; Ashaari, M.A.; Iskandar, Y.H.P.; Bakri, H. The impact of business intelligence adoption on organizational performance among higher education institutions in Malaysia. In Proceedings of the First ASEAN Business, Environment, and Technology Symposium (ABEATS 2019), Bogor, Indonesia, 2–3 December 2019; pp. 48–51. [Google Scholar]
- Lu, J.; Laux, C.; Antony, J. Lean six sigma leadership in higher education institutions. Int. J. Prod. Perform. Manag. 2017, 66, 638–650. [Google Scholar] [CrossRef]
- Sinha, M.; Ringrose, D. Development of an organisational excellence framework. TQM J. 2013, 25, 441–452. [Google Scholar]
- Samuelsson, P.; Nilsson, L.E. Self-assessment practices in large organisations: Experiences from using the EFQM excellence model. Int. J. Qual. Reliab. Manag. 2002, 19, 10–23. [Google Scholar] [CrossRef]
- Boulter, L.; Bendell, T.; Abas, H.; Dahlgaard, J.; Singhal, V. Reports on EFQM and BQF Funded Study into the Impact of the Effective Implementation of Organisational Excellence Strategies on Key Performance Results; University of Leicester: Leicester, UK, 2005. [Google Scholar]
- Saunders, M.; Mann, R.; Grigg, N. Review processes for improving business excellence frameworks. Int. J. Qual. Reliab. Manag. 2008, 25, 928–942. [Google Scholar] [CrossRef]
- Jenkins, H. A ‘business opportunity’model of corporate social responsibility for small-and medium-sized enterprises. Bus. Ethics Eur. Rev. 2009, 18, 21–36. [Google Scholar] [CrossRef]
- Kassem, R.; Ajmal, M.; Gunasekaran, A.; Helo, P. Assessing the impact of organisational culture on achieving business excellence with a moderating role of ICT. Benchmark. Int. J. 2019, 26, 117–146. [Google Scholar] [CrossRef]
- Tarí, J.J. An EFQM model self-assessment exercise at a Spanish university. J. Educ. Adm. 2006, 44, 170–188. [Google Scholar] [CrossRef]
- Tarí, J.J.; Espinosa, S.A.D.J. EFQM model self-assessment using a questionnaire approach in university administrative services. TQM Mag. 2007, 19, 604–616. [Google Scholar] [CrossRef]
- Moeller, J. The EFQM excellence model. German experiences with the EFQM approach in health care. Int. J. Qual. Health Care 2001, 13, 45–49. [Google Scholar] [CrossRef] [PubMed][Green Version]
- Laurett, R.; Mendes, L. EFQM model’s application in the context of higher education. Int. J. Qual. Reliab. Manag. 2019, 36, 257–285. [Google Scholar] [CrossRef]
- Medne, A.; Lapina, I.; Zeps, A. Sustainability of a university’s quality system: Adaptation of the EFQM excellence model. Int. J. Qual. Serv. Sci. 2020, 12, 29–43. [Google Scholar] [CrossRef]
- Ghinea, V.M.; Dima, A.M.; Hadad, S. Excellence model for sustainable convergence in the EU higher education. Amfiteatru Econ. 2017, 19, 1107–1122. [Google Scholar]
- Al-Hosaini, F.F.; Sofian, S. A review of balanced scorecard framework in higher education institution (HEIs). Int. Rev. Manag. Mark. 2015, 5, 26. [Google Scholar]
- Maciel-Monteon, M.; Limon-Romero, J.; Gastelum-Acosta, C.; Tlapa, D.; Baez-Lopez, Y.; Solano-Lamphar, H.A. Measuring critical success factors for six sigma in higher education institutions: Development and validation of a surveying instrument. IEEE Access 2020, 8, 1813–1823. [Google Scholar] [CrossRef]
- Campatelli, G.; Citti, P.; Meneghin, A. Development of a simplified approach based on the EFQM model and six sigma for the implementation of TQM principles in a university administration. Total Qual. Manag. Bus. Excel. 2011, 22, 691–704. [Google Scholar] [CrossRef]
- Senapati, N.R. Six sigma: Myths and realities. Int. J. Qual. Reliab. Manag. 2004, 21, 683–690. [Google Scholar] [CrossRef]
- Zwain, A.A.A.; Lim, K.T.; Othman, S.N. TQM and academic performance in Iraqi HEIs: Associations and mediating effect of KM. TQM J. 2017, 29, 357–368. [Google Scholar] [CrossRef]
- El Mhouti, A.; Erradi, M.; Nasseh, A. Using cloud computing services in e-learning process: Benefits and challenges. Educ. Inf. Technol. 2017, 23, 893–909. [Google Scholar] [CrossRef]
- Hides, M.T.; Davies, J.; Jackson, S. Implementation of EFQM excellence model self-assessment in the UK higher education sector—Lessons learned from other sectors. TQM Mag. 2004, 16, 194–201. [Google Scholar] [CrossRef]
- Nikolić, V.; Petković, D.; Denić, N.; Milovančević, M.; Gavrilović, S. Appraisal and review of e-learning and ICT systems in teaching process. Physica A Stat. Mech. Appl. 2019, 513, 456–464. [Google Scholar] [CrossRef]
- Gerlič, I. Challenges of advanced technologies and school of the future. Organizacija 2010, 43, 49–54. [Google Scholar] [CrossRef]
- Fonseca, L.; Amaral, A.; Oliveira, J. Quality 4.0: The EFQM 2020 model and industry 4.0 relationships and implications. Sustainability 2021, 13, 3107. [Google Scholar] [CrossRef]
- Teryima, S.J.; Sunday, A. The role of information communication technology (ICT) in enhancing productivity in local government administration in Benue State, Nigeria. Int. J. Bus. Econ. Develop. 2015, 3, 110–124. [Google Scholar]
- Webster-Trotman, S.P. A Correlational Study of Telework Frequency, Information Communication Technology, and Job Satisfaction of Home-Based Teleworkers. Ph.D. Thesis, Walden University, Minneapolis, MN, USA, 2010. [Google Scholar]
- Prattipati, S.N. Sustainability and the rote of information and communications technologies. Bus. Renaiss. Q. 2010, 5, 23–40. [Google Scholar]
- Peña, A.P.; Jamilena, D.M.F.; Molina, M.A.R. Impact of market orientation and ICT on the performance of rural smaller service enterprises. J. Small Bus. Manag. 2011, 49, 331–360. [Google Scholar] [CrossRef]
- Prajanti, S.D.W.; Soesilowati, E. Evaluation on benefits and development of information and communication technology (ICT) to improve the performance of agricultural extension in Central Java. Int. J. Organ. Innov. 2013, 6, 243. [Google Scholar]
- Lytras, M.D.; Visvizi, A.; Daniela, L.; Sarirete, A.; De Pablos, P.O. Social networks research for sustainable smart education. Sustainability 2018, 10, 2974. [Google Scholar] [CrossRef]
- Boulos, M.N.K.; Wheeler, S. The emerging web 2.0 social software: An enabling suite of sociable technologies in health and health care education. Health Inf. Libr. J. 2007, 24, 2–23. [Google Scholar] [CrossRef]
- Sulisworo, D. Enabling ICT and knowledge management to enhance competitiveness of higher education institutions. Int. J. Educ. 2012, 4, 112. [Google Scholar] [CrossRef]
- Bandara, W.; Syed, R.; Ranathunga, B.; Kulathilaka, K.S. People-centric, ICT-enabled process innovations via community, public and private sector partnership, and e-leadership: The case of the dompe ehospital in Sri Lanka. In Business Process Management Cases; Springer: Berlin, Germany, 2018; pp. 125–148. [Google Scholar]
- Tirto, T.; Ossik, Y.; Omelyanenko, V. ICT support for industry 4.0 innovation networks: Education and technology transfer issues. In Recent Advances in Computational Mechanics and Simulations; Springer: Berlin, Germany, 2020; pp. 359–369. [Google Scholar]
- Calvo-Mora, A.; Leal, A.; Roldán, J.L. Relationships between the EFQM model criteria: A study in Spanish universities. Total Qual. Manag. Bus. Excel. 2005, 16, 741–770. [Google Scholar] [CrossRef]
- Toquero, C.M. Challenges and opportunities for higher education amid the COVID-19 Pandemic: The philippine context. Pedagog. Res. 2020, 5, em0063. [Google Scholar] [CrossRef]
- Siddique, M.; Nawaz, A. The mediation of transformational leadership between transactional leadership and group management skills of academicians in HEIS of KPK, Pakistan. Int. Trans. J. Eng., Manag. Appl. Sci. Technol. 2019, 10, 1041–1051. [Google Scholar]
- Bilal, A.R.; Fatima, T.; Imran, M.K. Does shared leadership fosters taking charge behaviors? A post-heroic leadership perspective in the public sector higher educational institutes. Int. J. Public Leadersh. 2019, 15, 137–154. [Google Scholar] [CrossRef]
- Ishak, A.K.; Kamil, B.A.M. Succession planning at Heis: Leadership style, career development and knowledge management practices as its predictors. Int. Rev. Manag. Mark. 2016, 6, 214–220. [Google Scholar]
- Hamlin, R.G.; Patel, T. Perceived managerial and leadership effectiveness within higher education in France. Stud. High. Educ. 2017, 42, 292–314. [Google Scholar] [CrossRef]
- Ehrenstorfer, B.; Sterrer, S.; Preymann, S.; Aichinger, R.; Gaisch, M. Multi-tasking talents? roles and competencies of middle-level manager-academics at two Austrian higher education institutions. In Diversity and Excellence in Higher Education; Springer: Berlin, Germany, 2015; pp. 175–200. [Google Scholar]
- Kallenberg, T. Academic middle managers shaping the landscape between Policy and practice. In Diversity and Excellence in Higher Education; Springer: Berlin, Germany, 2015; pp. 201–216. [Google Scholar]
- Parlar, H.; Türkoğlu, M.E.; Cansoy, R. Leadership Development in Students: Teachers’ Opinions Regarding Activities that can be Performed at Schools. Univers. J. Educ. Res. 2017, 5, 217–227. [Google Scholar] [CrossRef]
- Buengeler, C.; Homan, A.; Voelpel, S.C. The challenge of being a young manager: The effects of contingent reward and participative leadership on team-level turnover depend on leader age. J. Organ. Behav. 2016, 37, 1224–1245. [Google Scholar] [CrossRef]
- Maykrantz, S.A.; Houghton, J.D. Self-leadership and stress among college students: Examining the moderating role of coping skills. J. Am. Coll. Health 2018, 68, 89–96. [Google Scholar] [CrossRef] [PubMed]
- McCarley, T.A.; Peters, M.L.; Decman, J.M. Transformational leadership related to school climate: A multi-level analysis. Educ. Manag. Adm. Leadersh. 2016, 44, 322–342. [Google Scholar] [CrossRef]
- Asrar-Ul-Haq, M.; Anwar, S.; Hassan, M. Impact of emotional intelligence on teacher’s performance in higher education institutions of Pakistan. Futur. Bus. J. 2017, 3, 87–97. [Google Scholar] [CrossRef]
- Adewale, A.S.; Ghavifekr, S. Leadership self-efficacy and staff organisational citizenship behavior in higher education institutions: Experience from Nigeria. Int. J. Leadersh. Educ. 2019, 22, 116–133. [Google Scholar]
- Kezar, A.J.; Holcombe, E.M. Shared Leadership in Higher Education; American Council on Education: Washington, DC, USA, 2017. [Google Scholar]
- Elrehail, H.; Emeagwali, O.L.; Alsaad, A.; Alzghoul, A. The impact of Transformational and Authentic leadership on innovation in higher education: The contingent role of knowledge sharing. Telematics Inform. 2018, 35, 55–67. [Google Scholar] [CrossRef]
- Ruiz-Mallén, I.; Heras, M. What Sustainability? Higher Education Institutions’ Pathways to Reach the Agenda 2030 Goals. Sustainability 2020, 12, 1290. [Google Scholar] [CrossRef]
- Aleixo, A.M.; Leal, S.; Azeiteiro, U.M. Conceptualization of sustainable higher education institutions, roles, barriers, and challenges for sustainability: An exploratory study in Portugal. J. Clean. Prod. 2018, 172, 1664–1673. [Google Scholar] [CrossRef]
- Zacher, H.; Johnson, E. Leadership and creativity in higher education. Stud. High. Educ. 2014, 40, 1–16. [Google Scholar] [CrossRef]
- Balwant, P. Transformational instructor-leadership in higher education teaching: A meta-analytic review and research agenda. J. Leadersh. Stud. 2016, 9, 20–42. [Google Scholar] [CrossRef]
- Al-Husseini, S.; Elbeltagi, I. Transformational leadership and innovation: A comparison study between Iraq’s public and private higher education. Stud. High. Educ. 2016, 41, 159–181. [Google Scholar] [CrossRef]
- Al-Husseini, S.; Elbeltagi, I. Evaluating the effect of transformational leadership on knowledge sharing using structural equation modelling: The case of Iraqi higher education. Int. J. Leadersh. Educ. 2016, 21, 506–517. [Google Scholar] [CrossRef]
- Blanco-Portela, N.; R-Pertierra, L.; Benayas, J.; Lozano, R. Sustainability leaders’ perceptions on the drivers for and the barriers to the integration of sustainability in Latin American higher education institutions. Sustainability 2018, 10, 2954. [Google Scholar] [CrossRef]
- Gora, A.A.; Ștefan, S.C.; Popa, Ș.C.; Albu, C.F. Students’ perspective on quality assurance in higher education in the context of sustainability: A PLS-SEM approach. Sustainability 2019, 11, 4793. [Google Scholar] [CrossRef]
- Mattar, D.M. Lebanese cherishing a transformational educational leader. Int. J. Educ. Manag. 2016, 30, 1045–1071. [Google Scholar] [CrossRef]
- Alonderiene, R.; Majauskaite, M. Leadership style and job satisfaction in higher education institutions. Int. J. Educ. Manag. 2016, 30, 140–164. [Google Scholar] [CrossRef]
- Rosenberg, A.; McIntyre, L. Philosophy of Science: A Contemporary Introduction; Routledge: London, UK, 2019. [Google Scholar]
- Albright, S.C.; Zappe, C.; Winston, W. Data Analysis, Organization and Simulation Modeling; South-Western Cengage Learning: Boston, MA, USA, 2011. [Google Scholar]
- Nwachukwu, C.; Chladkova, H.; Zufan, P. Empirical assessment of mi-crofinance banks in Nigeria using EFQM excellence model. Int. J. Qual. Res. 2017, 11, 279–294. [Google Scholar]
- Reinartz, W.; Wiegand, N.; Imschloss, M. The impact of digital transformation on the retailing value chain. Int. J. Res. Mark. 2019, 36, 350–366. [Google Scholar] [CrossRef]
- Svensson, M.; Klefsjö, B. TQM-based self-assessment in the education sector: Experiences from a Swedish upper secondary school project. Qual. Assur. Educ. 2006, 14, 299–323. [Google Scholar] [CrossRef]
- Zink, K.J. Successful TQM: Inside Stories from European Quality Award Winners; John Wiley & Sons: Hoboken, NJ, USA, 1997. [Google Scholar]
- Karapetrovic, S.; Willborn, W. Audit and self-assessment in quality management: Comparison and compatibility. Manag. Audit. J. 2001, 16, 366–377. [Google Scholar] [CrossRef]
- Woo, D. The leadership of ICT coordinators: A distributed perspective. Educ. Manag. Adm. Leadersh. 2020, 1, 1741143220979714. [Google Scholar] [CrossRef]
- Alqahtani, A.Y.; Rajkhan, A.A. E-learning critical success factors during the COVID-19 pandemic: A comprehensive analysis of E-learning managerial perspectives. Educ. Sci. 2020, 10, 216. [Google Scholar] [CrossRef]
- Vijaya Sunder, M.; Antony, J. A conceptual lean six sigma framework for quality excellence in higher education institutions. Int. J. Qual. Reliab. Manag. 2018, 35, 857–874. [Google Scholar] [CrossRef]
- SerdarAsan, Ş.; Tanyaş, M. Integrating Hoshin Kanri and the balanced scorecard for strategic management: The case of higher education. Total Qual. Manag. 2007, 18, 999–1014. [Google Scholar] [CrossRef]
- Ahmed, H.O.K. A proposed systematic framework for applying Hoshin Kanri strategic planning methodology in educational institutions. Eur. Sci. J. 2016, 12, 158–194. [Google Scholar] [CrossRef]
- Harrington, K.; Flint, A.; Healey, M. Engagement through Partnership: Students as Partners in Learning and Teaching in Higher Education; Higher Education Academy: York, UK, 2014. [Google Scholar]
- Kaldi, S.; Xafakos, E. Student teachers’ school teaching practice: The relation amongst perceived self-competence, motivation and sources of support. Teach. Teach. Educ. 2017, 67, 246–258. [Google Scholar] [CrossRef]
- Ilgaz, G.; Eskici, M. Examination of teacher candidates’ lifelong learning competence and basic motivation resources as parts of sustainability. Sustainability 2019, 11, 23. [Google Scholar] [CrossRef]
- Subrahmanyam, A. Relationship between service quality, satisfaction, motivation and loyalty. Qual. Assur. Educ. 2017, 25, 171–188. [Google Scholar] [CrossRef]
- Malik, M.E.; Danish, R.Q.; Usman, A. The impact of service quality on students’ satisfaction in higher education institutes of Punjab. J. Manag. Res. 2010, 2, 1–11. [Google Scholar]
- Lašáková, A.; Bajzíková, Ľ.; Dedze, I. Barriers and drivers of innovation in higher education: Case study-based evidence across ten European universities. Int. J. Educ. Dev. 2017, 55, 69–79. [Google Scholar] [CrossRef]
- Zink, Z.L.; Schmidt, A. Measuring universities against the European quality award criteria. Total Qual. Manag. 1995, 6, 547–562. [Google Scholar]
- Osseo-Asare, A.E.; Longbottom, D. The need for education and training in the use of the EFQM model for quality management in UK higher education institutions. Qual. Assur. Educ. 2002, 10, 26–36. [Google Scholar] [CrossRef]
- Westlund, A.H. Measuring environmental impact on society in the EFQM system. Total Qual. Manag. 2001, 12, 125–135. [Google Scholar] [CrossRef]
- Nunnally, J.C.; Bernstein, I.H. Psychometric Theory, 3rd ed.; McGraw-Hill: New York, NY, USA, 1994. [Google Scholar]
- Rahman, S.U.; Bullock, P. Soft TQM, hard TQM, and organisational performance relationships: An empirical investigation. Omega 2005, 33, 73–83. [Google Scholar] [CrossRef]
- Bin Abdullah, M.M.; Uli, J.; Tarí, J.J. The influence of soft factors on quality improvement and performance. TQM J. 2008, 20, 436–452. [Google Scholar] [CrossRef]


Publisher’s Note: MDPI stays neutral with regard to jurisdictional claims in published maps and institutional affiliations. |
© 2021 by the authors. Licensee MDPI, Basel, Switzerland. This article is an open access article distributed under the terms and conditions of the Creative Commons Attribution (CC BY) license (https://creativecommons.org/licenses/by/4.0/).