Abstract
Aquaculture is increasingly considered a major contributor to the growing demand for worldwide seafood production. Sustainability is becoming a key issue for aquaculture systems, with the objective to produce seafood with lower environmental impacts and that is economically viable and socially fair. In the context of the SIMTAP project, a multi-attribute model called DEXiAqua was developed. DEXiAqua uses the DEX method to assess the sustainability of aquaculture systems via indicators from technical domains and reference methods (i.e., life cycle assessment, life cycle costing, social life cycle assessment, and emergy accounting) selected and organized by the partners in the SIMTAP project. The DEX method consists of building an attribute tree that is organized to characterize a complex problem. Qualitative or quantitative indicators are measured at the end of each branch of the tree. The value of each indicator is translated into a qualitative scale for the associated attribute via threshold values. Weighted utility functions are used to build attributes from sub-attributes until the attribute of overall sustainability is reached. DEXiAqua was applied to a case study of salmon farming in France, which illustrated its ability to assess overall sustainability and help identify ways to improve the production system by identifying environmental, social, and economic hotspots. More case studies are required to apply DEXiAqua to a variety of systems with technical and contextual differences, which could result in changing attribute weights to adapt it better to different contexts.
1. Introduction
In response to the growing world population, with 9 billion people estimated by 2050 [1], demand for seafood is expected to increase in the near future. The need for diverse protein sources is particularly at risk. From 1960 to 2010, the world demand for edible fish nearly doubled from 9.9 to 18.6 kg per capita per year, and it should continue to grow. Demand could reach 21.5 kg per capita per year by 2030 [2]. Fisheries catches have remained stable for ca. 10 years and do not seem sufficient to respond to this increase in demand. For decades, demand has been supplemented with aquaculture, whose production has increased by 7.5% per year since 1970 [2]. Current aquaculture systems are required to be more sustainable to better manage financial, technological, institutional, natural, and social resources [3].
Aquaculture has several direct effects, such as emission of fish farm waste (e.g., nitrogen, phosphorus) and potential effects on endemic species due to introducing non-native species or propagating diseases, and indirect effects related to the production of fish feed, all of which have an impact on the environment [4,5,6,7]. Aquaculture also depends greatly on fisheries since it is the largest consumer of fishmeal and fish oil. Ingredients from fisheries are critical since they provide polyunsaturated fatty acids and proteins with amino acid profiles suitable for fish growth. Alternative ingredients in feed have also been studied [8,9,10,11,12,13]. To be sustainable, aquaculture must improve socially and economically. Globally, labor rights violations that have been documented in the sector should be eradicated [2]. Europe should work to improve the situation, and relocating production could be part of the solution. Currently, 65% of fish consumed in Europe is imported, 25% comes from European Union (EU) fisheries, and only 10% is produced in EU aquaculture [2]. Aquaculture could also create employment. It is estimated that each percentage point increase in consumption of fish from aquaculture would create 3000–4000 full-time jobs [14]. Thus, the aquaculture sector is expected to increase production to sustain the increase in fish consumption by creating local jobs and, more generally, contributing to food security [2]. Consequently, aquaculture needs to change in order to grow.
Among the strategies for changing aquaculture systems, integrated multitrophic aquaculture (IMTA) goes further by associating complementary species in the same production system [15,16,17]. Different levels of the trophic chain are reared together to support each other’s growth. Inorganic and organic waste from fed aquaculture species (e.g., finfish) are respectively assimilated by autotrophic species (e.g., phytoplankton, macroalgae, macrophytes) and heterotrophic species (e.g., oysters, mussels, crustaceans, echinoderms, polychaetes) that are co-cultured with the fed aquaculture species. Currently, the most common IMTA systems are aquaponic systems that use nutrients in the wastewater from fish to support plant growth [18]. More complex systems combine polychaete-assisted sand filters and halophyte aquaponics for super-intensive marine fish farms [19]. IMTA systems are designed as potential future solutions to decrease the impacts of fish production on ecosystems [20,21,22].
The SIMTAP project (EU PRIMA 2018) was launched in June 2019 with the objective of developing self-sufficient IMTA systems in several Mediterranean countries (France, Italy, Malta, and Turkey) to improve nutrient recycling. The project will also assess their sustainability performance. Assessment of food-system sustainability needs to consider multiple criteria and multidisciplinarity [23,24]. In this context, environmental, social, and economic impacts should be evaluated together. Assessing sustainability also depends on the context and the issues that impact those involved. Therefore, multiple stakeholders from the regions concerned need to participate, as shown previously in the aquaculture sector [25,26]. A relevant option to meet this objective involves using a multicriteria decision analysis (MCDA) method, which explicitly considers multiple criteria to help individuals or groups explore relevant decisions [27]. It can combine objective measurements and value judgments using quantitative or qualitative indicators, makes subjectivity explicit, and manages this subjectivity by organizing input from the stakeholders concerned. To help decision makers choose more sustainable options or scenarios, MCDA was chosen to combine the environmental, social, and economic dimensions into a method to assess overall sustainability. To simplify this complex and multidimensional issue, the DEXi method [28] was selected as the MCDA method. Among other methods [29], the DEXi method has been used successfully in the agriculture sector to build sustainable assessment tools and to summarize expert knowledge. The MASC model was developed and applied to evaluate the sustainability of cropping systems [30,31] and later included in the DEXiPM model [32,33,34] and the MASC-OF model that focuses on organic production [35]. The DEXiFruit model aims to assess the sustainability of fruit production [36]. DEXi was also used to assess the sustainability of potato production [37]. DEXi was also combined with FisPro to include fuzzy logic to assess sustainability [38]. DEXi was also used in agricultural systems to evaluate specific issues as soil quality [39] or ecological and economic impacts of genetically modified crops [40]. To our knowledge, it has not yet been applied to assess the sustainability of aquaculture systems. It was used to select marine fish for IMTA production in the context of the SIMTAP project [41].
This article presents the DEXi model, which was developed with information from working groups, meetings, and discussions among stakeholders involved in the SIMTAP project to obtain an operational model, called DEXiAqua, to assess the sustainability of aquaculture systems. In this study, the term “system” refers to different scales associated with the farm: the farm itself with all the processes and workforce involved in the production of aquatic products; the upstream processes associated with the production of inputs (e.g., feed, energy), when LCA impact categories are calculated; and the network of economic and social links, especially in the assessment of the social pillar. The main steps were to (i) build a conceptual model to describe the three dimensions of sustainability in aquaculture systems based on technical and scientific literature, which yielded an attribute tree, (ii) determine utility functions and weights used to aggregate the attributes, and (iii) determine thresholds to convert quantitative and/or qualitative values of indicators into scales for attributes (e.g., low/medium/high). A template for data collection was developed to collect the raw data necessary and calculate the indicators. An initial application of DEXiAqua is also shown to illustrate its outputs. Four results of the study are presented: (1) the building of DEXiAqua, including the attribute tree, scales, and thresholds; (2) the indicator values and attribute scales obtained from applying the data-collection template to the reference case study; (3) results of applying DEXiAqua to the reference case study, and (4) the sensitivity of DEXiAqua to input variables.
2. Materials and Methods
2.1. DEXi Methodology
DEXi is software that can simplify complex systems when making multi-attribute decisions (the latest version, DEXi 5.04, is available online [42]). It is specially designed for choosing among multiple options, scenarios, or systems by considering many parameters [28]. Briefly, it breaks down a multi-factorial problem into smaller sub-problems until it obtains several problems that are easier to solve. DEXi can then be used to evaluate different scenarios or options for a multi-factorial system and help make decisions. Designing a DEXi model requires multiple steps (Figure 1) [31]:
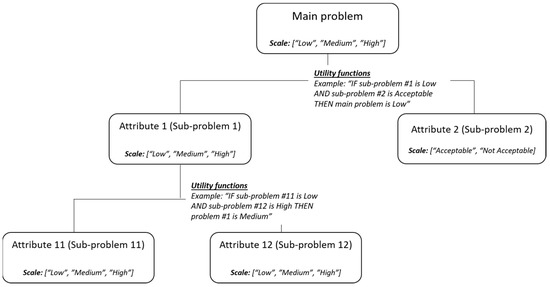
Figure 1.
Description of the principles and lexical field of DEXi.
- Define attributes, each of which is a qualitative variable that represents a sub-problem. An attribute, sometimes called a criterion [25], corresponds to each node of the tree;
- Define scales, each of which contains a set of options defined for each attribute (e.g., [Low; Medium; High], [Acceptable; Not acceptable]);
- Define the attribute tree, which breaks the main problem down into sub-problems (branches);
- Define utility functions, which aggregate branches of the attribute tree from the bottom (i.e., sub-problems) to the top (the main problem) (e.g., IF sub-problem #11 is Low AND sub-problem #12 is High THEN problem #1 is Medium).
DEXi uses qualitative attributes that are aggregated and potentially weighted to obtain a final score. This approach allows quantitative and qualitative attributes (e.g., social issues) to be considered simultaneously.
Once the DEXi model is built, the next step is to assign a scale to each attribute. In this project, an automatic scale calculator called the data-collection template was used with the DEXi model. For qualitative attributes, the user chooses one of at least two options, each of which belongs to a scale. For each quantitative indicator, multiple thresholds are defined for each scale. The user provides the value of the indicator, and the associated option in the attribute’s scale is automatically assigned according to the threshold values. Thus, DEXi evaluates a scenario by compiling “utility functions” and provides qualitative output (e.g., “the scenario is good”). It can also provide sub-assessments: “the scenario is good, but this branch is poor”. Thus, by subdividing the overall assessment, it can identify the attributes to focus on to improve the overall result. Evaluating multiple scenarios with the same DEXi model enables users to rank them according to the sub-problems and choose the best trade-off.
The development of DEXiAqua is detailed in the next section. First, the experts involved in the process are presented. Then, the first step is detailed, which consisted of creating the initial list of indicators from a literature review. Finally, the method used with experts and partners to build the model is described, as is the model itself. The data-collection template is then described. It is available upon request to the authors.
2.2. Development of DEXiAqua
2.2.1. Composition of the Working Groups
The partners of the SIMTAP project were involved in each step of building DEXiAqua: attribute selection, weighting, and threshold definition. To select the attributes, we formed multidisciplinary working groups:
- Economic: Théo Dubois (aquaculture, sustainability assessment using DEXi modeling), Nouraya Akkal-Corfini (vegetable production system design and multicriteria performance assessment of cropping systems using DEXi modeling), Alberto Barbaresi, Daniele Torreggiani and Enrica Santolini (design of smart agri-food structures and systems, energy modeling and renewable energy in agri-food and livestock systems, precision livestock farming, GIS spatial analysis and land suitability analysis, rural planning), Juan Francisco Fierro (aquaponics, aquaculture), Lorenzo Rossi (animal production, aquaculture, aquaponics), Romain Vandame (company director of Agriloops, which produces prawns and vegetables in aquaponics systems), Rainer Linke (legal counsel and head of government advisors);
- Social: Joël Aubin (environmental assessment (LCA) and agriculture system design), Jacopo Bacenetti (applying LCA to agricultural processes), Michele Costantini (applying the LCA to agricultural processes), Kyle Spiteri (diversification and scientific trials of agricultural production), Samuel Le Féon (environmental assessment using LCA), Chingoileima Maibam (marine biology and ecology, reproduction and nutrition of polychaetes);
- Environmental: Christophe Jaeger (environmental assessment and design of aquacultural systems), Aurélie Wilfart (environmental assessment of livestock systems using LCA and emergy accounting, nutrition and environmental optimization of livestock systems), Alberto Pardossi (irrigation and fertigation management of horticultural crops), Carlo Bibbiani (innovative rural building design, modeling energy and gas exchanges in greenhouse systems, aquaculture facilities), Baldassare Fronte (aquaculture, aquaponics, reproduction, and nutrition of marine fish species), Mehmet Ali Koçer (environmental monitoring and management related to eutrophication and microalgae, environmental impacts and management of aquaculture), Hüseyin Sevgili (fish nutrition and aquaculture).
2.2.2. Toward a Library of Attributes: Literature Review and Relevant Assessment Methods
The first step in assessing the sustainability of aquaculture systems using DEXi consisted of defining the relevant sustainability issues and how to qualify them. It entailed observing how the literature evaluated the three branches of sustainability. Approximately 60 references from the literature and project reports were analyzed to build an initial list of 413 potential attributes and indicators for aquaculture systems.
This step identified several key assessment methods to use: life cycle assessment (LCA), emergy accounting (accounting of the solar energy consumed directly and indirectly by the system), life cycle costing (LCC), and social life cycle assessment (SLCA). LCA quantifies potential environmental impacts. As a life cycle-oriented method, it assesses impacts throughout the life cycle of the studied system. As a multicriteria method, it calculates multiple environmental impacts. The principles and guidelines of LCA are internationally standardized [43,44]. LCA is widely used to estimate the environmental impacts of aquaculture systems [11,45,46,47]. It has been applied recently to IMTA systems [48,49]. In the SIMTAP project, life cycle impact assessment will be performed for seven environmental impact categories considered essential to assess for aquaculture systems by the project partners:
- Eutrophication potential [50];
- Acidification potential [50];
- Global warming potential [50];
- Land competition [50];
- Cumulative energy demand [51];
- Available water remaining [52];
- Net primary production use [53].
Emergy accounting is a quantitative top-down approach that transforms each non-monetary flow (e.g., sun, rain, wind) and monetary flow (e.g., products, services) into its equivalent solar energy content using a common unit, the solar emjoule [54]. It has been applied to aquaculture systems [55,56] in combination with LCA [57]. Two emergy indicators were included in DEXiAqua: emergy yield ratio and percentage of renewability, which reflect the system’s ability to use local natural resources and renewable resources, respectively.
LCC assesses the economic sustainability of a process, product, or service over time, focusing primarily on its costs. Although LCC predates LCA, it is not standardized, and no official guidelines exist for implementing it. General codes of practice have been developed [58], but many conceptual frameworks have been adopted in the literature, the most common of which is the use of conventional LCC, based on private cash-flow models [59]. The latter approach was therefore selected to evaluate the economic performance of SIMTAP systems but also to compare them to commercial aquaculture facilities. In the SIMTAP project, this assessment refers not to the product sold at the farm gate (i.e., farmed fish and other potential co-products) but rather to an operational aquaculture plant and its life span. Therefore, all costs were considered when building the model, including the initial capital investment and future ordinary and extraordinary expenses for operation and maintenance; capital depreciation and costs of resale, recovery, or disposal; and the income derived from subsidies and the sale of products. Some of the indicators selected could be calculated directly from this model (i.e., net present value and internal rate of return). Some values from the cash-flow model were used as inputs for secondary calculations (e.g., the gross value added from plant operations was used to calculate the labor productivity indicator in the economic branch).
SLCA, also based on LCA principles, combines quantitative and qualitative data to identify, evaluate and manage social impacts [60]. Social impacts are consequences, either positive or negative and direct or indirect, related to the life cycle of a product or service that influence the stakeholders involved. SLCA guidelines were published by the UNEP/SETAC Life Cycle Initiative [61,62] to unify the methodological approach with the social dimension of sustainability (e.g., identifying the stakeholders and attributes to evaluate the indicators to use). The principles dictated by these guidelines were considered when selecting the social sustainability indicators, along with their connections within the social branch. Specifically, a Type I SLCA was performed [63], which is based on giving a scale score to the selected indicators using thresholds (i.e., performance reference points) and on their subsequent weighting, a method that fits well within DEXiAqua. However, the guidelines provide a generic framework that is difficult to apply to specific sectors such as agriculture, fisheries, and forestry. Therefore, the framework was modified to adapt it to the reference context based on the literature review, which highlighted the social attributes relevant to the specific sector. One objective of the SIMTAP project is to characterize the social risks and benefits for stakeholders associated with aquaculture activities; therefore, a “gate-to-gate” approach was used for the aquaculture plants. The relevant stakeholders for this assessment include workers, consumers, society, and local communities. Indicators related to animal welfare were also considered in the “meeting social expectations” branch related to society. Previous SLCA studies in the field of animal production highlighted that this social aspect of the sector must be considered and evaluated [64,65]. To our knowledge, this is the first time an SLCA framework has been applied to aquaculture.
2.2.3. Consultation Process and Building of the DEXi Tree
The partners of the SIMTAP project were involved in the consultation process and participated in the steps described below (Figure 2). The DEXi method was first presented to the project consortium, with the objective to evaluate the sustainability of systems according to the three traditional branches of sustainability: environmental, social, and economic. An initial version of the tree (i.e., the division of the three main branches into multiple sub-branches) was based on the literature and former research projects. In particular, experience from the MASC project [31] was used. This initial tree was submitted to partners via an online survey so they could (i) validate sustainability dimensions and proposed attributes, (ii) propose additional attributes, if necessary, and (iii) rank attributes by importance based on their own experience. For each attribute, partners were asked to choose among five options: “Not relevant”, “Not so important”, “Important”, “Major issue”, and “I don’t understand the attribute”. The survey results validated the three sustainability dimensions and indicated the need to consider the quality of products, which had not been initially included. Thus, the initial version of the attribute tree was built. A workshop was then organized to share and discuss the tree with the partners to reach a consensus on the attributes to retain, remove or modify. For each attribute, three questions were asked and resolved: (i) “Do we keep the attribute?”, (ii) “Do we validate its hierarchical connections to other attributes?”, and (iii) “Does it need a more understandable name?”. In the second part of the workshop, partners were divided into three workgroups, each of which focused on one of the three dimensions. Based on the initial tree proposed, workgroups were asked to validate the relevance of the attributes, their hierarchy with each other, and the completeness of the tree. The workgroups were encouraged to add or remove attributes if inconsistencies appeared during these additional discussions. They then developed indicators that represented each sub-attribute. The indicators needed to (i) be associated with available data, (ii) define scales and thresholds, and (iii) be able to distinguish differences among systems/scenarios. In addition, three rules were followed: to have few indicators for each sub-attribute, sufficient comprehensiveness, and no redundancy in indicators of the sub-attributes. The proposals from each workgroup were compiled to obtain a definitive version of the attribute tree. Then, a second online survey was sent to partners that asked them to weigh the criteria for each level of the tree. Mean values were used when the weights of participants converged. When they diverged, they were discussed and validated in the last workshop. During this workshop, the thresholds within the scale allocated to each indicator were also defined. Finally, a complete tree was obtained, thus dividing overall sustainability into sub-attributes that continued until they reached measurable indicators. The scales of these indicators were automatically defined according to the thresholds previously determined and recorded in the DEXi software.
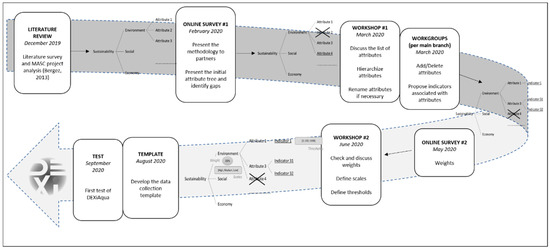
Figure 2.
Steps involved in building DEXiAqua.
2.2.4. Data Collection and Attribute Calculation Template
To simplify collection of the many data sets needed to assess sustainability, a template was created with four objectives:
- Collect data for the DEXiAqua tree, including those needed for LCA, emergy analysis, LCC, and SLCA (Figure 3);
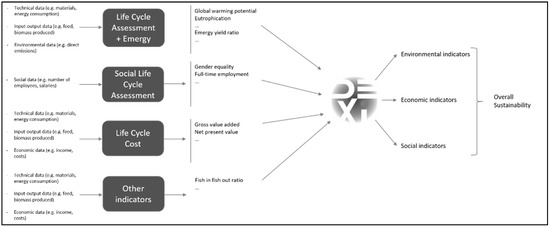 Figure 3. Overview of data collected in the data-collection template.
 - Perform additional calculations to transform input data into DEXi attributes;
- Determine a scale for each DEXi attribute by combining the data set with defined thresholds;
- Generate the list of scales formatted for import into DEXi software and that correspond to the model developed.
The template could not calculate all of the indicators itself. LCA and emergy indicators were calculated using other tools based on the data set collected, and then their results were incorporated into the template to determine the DEXi scales.
The template included the following:
- -
- Sheets to fill out:
- ○
- General system description;
- ○
- Input data;
- ○
- Calculation sheets: to help calculate input data;
- ○
- LCA sheets: to collect data used to calculate LCA impact categories.
- -
- Sheets to view and verify:
- ○
- Instructions;
- ○
- Secondary data calculation: calculate certain DEXi attributes from input data;
- ○
- Indicators: compile DEXi attributes and determine scales;
- ○
- DEXi export: format the scales into a list for import into the DEXi model for assessment.
One template must be filled for each system assessed in order to be able to compare sustainability among systems by exporting lists of scales into DEXi software. The template is available upon request.
2.3. Description of the Reference Case Study as a Synthetic Scenario
A reference case study was evaluated using DEXiAqua. This assessment involved applying the material developed to a data set, i.e., the comprehensiveness of the template and its ability to sort a formatted list of scales into input for the DEXi software. It assessed whether the DEXi model provides results that are understandable, consistent, and explainable based on the characteristics of a production system. The case study was based on a French fish farm that produced 56 tons of Atlantic salmon per year in a land-based recirculating aquaculture system. The water loop includes a mechanic filter extracting the suspended solids, stocked and sent for crop fertilization; a biologic filter for ammonia nitrification; and an ozonation device for disinfection and oxygenation of the water. The water is pumped from a brackish water table and released into the sea. The fish farm was chosen because it had been described in a previous study [57] and benefited from existing LCA and emergy accounting results. Since it had been previously studied in detail, we could analyze DEXiAqua results based on our knowledge and expectations. Additional data were extrapolated from the technical description of the site and the economic statistics of the sector. Thus, the case study did not completely refer to an existing farm but was a synthetic scenario based on estimates.
2.4. Initial Tests of the Sensitivity of DEXiAqua
To perform an initial sensitivity analysis, a Python script was used to generate randomized systems (Supplementary File S1). These random systems were assessed using DEXiAqua with DEXiEval, which consists of command lines written in the Windows Services console (available at: https://kt.ijs.si/MarkoBohanec/dexieval.html, accessed on 14 January 2020). Another Python script was used to export results to Microsoft® Excel (Supplementary File S1). Seven simulations were tested:
- -
- “Random”: a completely randomized simulation in which the value of the scale of each attribute was randomly generated;
- -
- “Eco_Low”, “Env_Low”, and “Soc_Low”, in which all attributes of the given dimension received the worst score, while the values of the remaining attributes were randomly generated;
- -
- “Soc_Eco_Low”, “Soc_Env_Low”, and “Eco_Env_Low”, in which all attributes of the two given dimensions received the worst score, while the values of the remaining attributes were randomly generated.
Results of the sensitivity analysis are shown in the Discussion section.
3. Results
3.1. Attribute Tree, Scales, and Thresholds
The method described was used to build an attribute tree divided into three main branches related to the three traditional dimensions of sustainability (i.e., environmental, social, and economic). Each branch was divided into several levels of attributes and sub-attributes to describe the complexity and unique characteristics of aquaculture systems. Indicators at the end of the branch expressed the corresponding attribute. For each attribute, a scale was defined to distinguish systems sufficiently without introducing too much complexity into the calculation method. For each quantitative attribute, thresholds were defined to help perform automatic scaling of values that were provided by users. Environmental, social and economic branches contained 27, 22, and 20 indicators, respectively (Table 1, Table 2 and Table 3, respectively) (see Table 4 for their definitions and Supplementary File S2 for detailed descriptions). Summary overviews of the three sustainability branches are available in Supplementary File S3.

Table 1.
Detailed environmental branch of the attribute tree, with description of scales, attributes, thresholds, and units. The hierarchy of attributes is represented by tabs and end with attributes (in italics). When an attribute is defined by several sub-attributes or indicators, the weights are also given. Units of the threshold values are given in the indicator description in Table 4.
Table 2.
Detailed social branch of the attribute tree, with description of scales, attributes, thresholds, and units. The hierarchy of attributes is represented by tabs and end with attributes (in italics). When an attribute is defined by several sub-attributes or indicators, the weights are also given. Units of the threshold values are given in the indicator description in Table 4.
Table 3.
Detailed economic branch of the attribute tree, with description of scales, attributes, thresholds, and units. The hierarchy of attributes is represented by tabs and end with attributes (in italics). When an attribute is defined by several sub-attributes or indicators, the weights are also given. Units of the threshold values are given in the indicator description in Table 4.
Table 4.
Description of indicators used in DEXiAqua.
3.2. Attribute Values and Scales of the Reference Case Study
Application of the DEXi method to the reference system yielded attribute values and associated scales (Table 5) (see Supplementary Files S4 and S5 for the template’s data calculation sheet and indicator sheet that translated indicator values into scales, respectively). The values of some missing data were estimated to test the method since the case study had been studied in the past, and no more data about it could be obtained.
Table 5.
Attribute values of the reference case study.
3.3. DEXi Assessment Results for the Reference Case Study
The overall sustainability of the reference case study was assessed as medium (see Supplementary File S6 for a summary for each branch). Branch summaries were obtained using the freeware IZI-EVAL, developed in the MASC project [30,31]. Environmental, social and economic sustainability were assessed as medium, low and high, respectively (Table 6).
Table 6.
Sustainability scores for each sustainability branch and its first-level sub-branches for the reference case study.
Based on low LCA impact scores, the reference case study appeared to have low negative impacts on ecosystems (Figure S1 in Supplementary File S6), especially for global impacts. The other environmental sub-branches were assessed as medium. Overall, general environmental scores were good (e.g., LCA scores), but only one species was reared in the system (i.e., salmon). Thus, the system was not as good for indicators related to diversification, output management, and decreasing inputs. Its respect for natural resources was assessed as medium because it used feed with relatively high environmental impacts and had a low level of renewability. It also required a large quantity of energy per ton of fish produced. Ecological efficiency was assessed as medium because recycling was limited (low score for the use of co-products as inputs), the large quantity of energy required did not come from renewable sources, and resources did not come from local sources. Biodiversity was not managed well (medium) due to a lack of predator control—which can be improved—and mono-trophic rearing, which was inherent to the system.
The system was economically viable due to low dependence on subsidies and high economic performance (Figure S2 in Supplementary File S6), which were assessed over a projected time horizon of 30 years. However, it could have been more autonomous and less vulnerable by reducing its dependence on suppliers and fisheries (due to the large quantities of fishmeal and fish oil in the diet). Production efficiency was assessed as medium. Despite high production costs, the production had high sales prices. This result was expected since salmon farming is one of the most profitable forms of aquaculture production in Europe [66]. Inland farms usually require much higher investment costs than those offshore. In this system, they were counterbalanced by (i) containment of consumed feed due to an excellent feed conversion ratio and (ii) no treatments for sea lice and related product losses, which are two major costs of salmon farming [67].
The system’s social sustainability was assessed as low (Figure S3 in Supplementary File S6) due mainly to relationships with other stakeholders. In particular, the system depended greatly on suppliers and did not develop relationships with professional institutions. This low score was thus due to the small contribution to local development. The system created few jobs and imported many of its inputs, especially feedstuffs. The salmon produced was less accessible to consumers due to its high price, and the system did not meet social expectations completely. Employment and working conditions suffered from gender inequality (no women were employed) and the low level of health and safety conditions (due to a large number of sick-leave days).
4. Discussion
4.1. Developing a General Method to Assess the Sustainability of Aquaculture Systems
Several difficulties were addressed while developing the method that should be considered when using DEXiAqua. First, the model was developed with partners in a single project and with the objective to assess aquaculture systems. The partners are experts in aquaculture systems and were asked to think in general terms, but they necessarily based their input on their personal experience and the multitrophic context of the SIMTAP project. DEXIAqua could thus lack some information needed to assess the sustainability of specific systems. From the SIMTAP project perspective, the attributes considered are the most relevant and allows to assess the sustainability of aquaculture systems. However, divergences existed between experts during the workshops and should exist with the community. For example, recent discussions appeared about the consideration of food safety and its introduction in the model should be discussed in the future. Consequently, DEXiAqua is an iterative model that should be improved in the future, if needed. Uses and feedbacks will be helpful.
When evaluating economic profitability, the results reflect uncertainty in the projected economic performance of the production system throughout its life span. For the reference case study, costs of raw materials and labor, as well as fish production and sales prices, were assumed not to change over time. Nonetheless, price volatility, especially for the fish-derived ingredients consumed [67], could influence production costs strongly, and changes in regulations or consumer behavior could alter product supply and demand and influence the sales price. DEXiAqua reflects these considerations by assessing the system’s vulnerability and degree of autonomy in the economic branch. In addition, the template developed can be used easily to modify the production and cost parameters in sensitivity analyses to verify their influence. Finally, for convenience, the economic assessment was based on private risks, costs, and income. According to an alternative approach called societal LCC, externalities should also be monetized and internalized, and this approach could be integrated into DEXiAqua in the future.
Defining the scaled attributes and the associated indicators and thresholds is an important added value of the model. When assessing sustainability, multiple systems are usually compared. Because this is a general feature of MCDA, it is recommended to define well the goal and scope of the assessment, initial questions, and reasons for the assessment. Rather than determining whether a future system has a high score, it is more important to know whether that system is better than existing systems. Defining a general conceptual framework with general values to compare is a step toward evaluating the sustainability of a system intrinsically. Thus, considering attributes related to multitrophic systems should lower the scores of mono-trophic systems, all other things being equal.
The case study increases our confidence in the model and its ability to evaluate the overall sustainability of aquaculture systems. Systems have many attributes, which reflects their complexity, but DEXiAqua can simplify them into sub-problems that are easier to assess and for which data are collectible. This responds to the objectives perfectly. The model can rebuild the cause-effect chain to explain the scores obtained for each sustainability branch related to expert knowledge about the system’s specific characteristics. This can identify hotspots and potentially identify recommendations.
4.2. Questions about Increasing the Complexity and Diversity of the Systems and Assessing IMTA Systems from Prototype Data
The project includes partners from several countries. The steps used to build the model revealed predictable differences between partners. During workshops and online surveys, participants answered questions based on their perceptions, knowledge background, and geographic context. This context implies a variety of social, economic, environmental, and regulation situations. Accordingly, some indicators were more important for certain participants. Some indicators differ more among systems, and for others, data availability may differ among contexts and case studies. For example, legislation on and perception of working conditions can differ among countries. The partners reached a consensus on some indicators by reflecting national averages. For example, income is not assessed in absolute value but rather in relation to a national average. The ability to adapt indicators, thresholds, scales, and weights was maintained. However, comparing systems from differing contexts requires using common values. Besides spatial differences in social, economic, and possibly environmental contexts, temporal changes must be considered. The current values in DEXiAqua resulted from a consensus among experts at a specific time—around 2020. They may need to change over time to reflect the reality of future systems better. This ability to evolve is a key point as it refers to the possible lack of consideration of the concerns and challenges of users cited as the most common reason for the lack of involvement in the use of assessment models [68].
Another important point is the diversity of systems. Besides differing geographically and temporally, IMTA systems also differ technically. For example, some are set in the nearshore directly using marine water, while others are set in buildings using reconstituted saltwater. Systems contain different species of different sizes. This variability suggests that, for certain systems, the current list of indicators lacks necessary indicators or, conversely, contains irrelevant indicators. Indicators should be added by keeping in mind the difficulty to reach both exhaustivity and simplicity [32]. Again, the data-collection and indicator-calculation template can be adapted to prevent this lack. If necessary, users should modify the template to assess their system better, but systems must still be compared using the same model. The assessment level could also be an important point to discuss depending on the systems. In our study, the reuse of material and energy is mainly considered at the farm level, where the management decisions of the farmer are applied. We considered the origin of the inputs and their potential recycled sources. Nevertheless, the fate of co-products downstream the farm, and their potential recycling by other actors in the territories, are poorly included. This is a way of improvement in future versions of the assessment method.
DEXiAqua was tested on a monoculture system that had been studied in previous projects. Thus, an important parameter was not considered: the time needed to collect data. Data collection was difficult, even for a simple system, due to the large number of indicators required to reflect overall sustainability. Data collection will likely be more complicated and time-consuming for new systems, especially multitrophic systems. This pitfall was partly expected because the model was designed according to project partners who knew well what kind of data should be collected. It was also expected due to the data-collection template’s inclusion of calculation sheets to simplify collection. However, the attributes used depend on other methods whose results cannot be calculated automatically. For example, the template helps collect data to calculate LCA indicators, but it cannot actually calculate them. Doing so requires the intervention of an expert.
One remaining factor was not expected and will be a future focus of the project. The SIMTAP project will design and construct prototypes from which data can be collected. These are not operational systems. Comparing IMTA systems to traditional systems requires upscaling the former to convert prototype data into a potential operational system. Some of the data for future operational systems will need to be estimated since they will not be available for a prototype (e.g., quantity of subsidies, sales price).
4.3. Initial Results and Discussion of the Sensitivity of the Model
In the sensitivity simulations, the results of each scenario had a Gaussian distribution (Figure 4). Results of the random scenario ranged mostly from “medium to low” to “medium to high” scores and almost never received extreme scores. Thus, it was difficult to obtain systems with extremely high or low scores. This result may lead us to reconsider final scale names in future versions of the model (e.g., changing “medium to low” to “low”) to communicate about overall sustainability better. The lack of spread in overall scores could also challenge the model’s ability to distinguish systems well. Indeed, the model quite poorly discriminates aquaculture systems. This was also one of the conclusions of sensitivity analysis made on the MASC model [69]. Another reason for the lack of discrimination can be linked to the compensation and/or correlation between indicators [31,32]. This will be a focus once more results from real systems have been obtained.
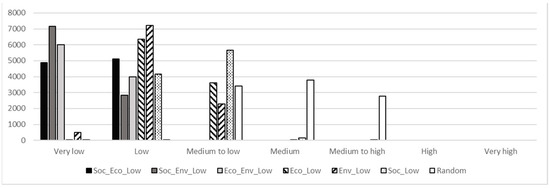
Figure 4.
Distributions of overall sustainability scores of 10,000 randomized simulations of DEXiAqua for seven scenarios: 3 x_y_Low, in which all indicators of two sustainability branches x and y (i.e., Soc(ial), Eco(nomic), and Env(ironmental)) were set to their lowest value and the others were randomized; 3 x_Low, in which all indicators of one sustainability branch x were set to their lowest value and the others were randomized; and Random, in which the values of all indicators were randomized.
By setting attributes to extreme values, the distribution of overall scores moved toward lower scores, meaning that systems with low scores theoretically exist. When one dimension had a low score, the overall sustainability was usually “low” and “medium to low”. When two dimensions had low scores, the overall sustainability was usually “very low” and “low”. Interestingly, dimensions differed in their influence on overall sustainability, even though each dimension’s branch contributes 33% of the overall score. This is because certain indicators are used in several branches of the attribute tree, meaning that they are related to several dimensions. For example, “production loss” is used to qualify animal welfare (part of social sustainability) and production management (part of economic sustainability). Since these scenarios were built by setting all indicators of one branch to a specific value, this can influence the other branches to greater or lesser degrees. Because environmental indicators are those most used in other branches, giving the environmental dimension a low score decreased the overall sustainability more than doing so with the economic or social dimensions. Consequently, even though each sustainability branch has the same weight, the branches are not completely balanced due to interconnected parameters, as also pointed out for the MASC model [69]. A system that has low environmental sustainability is more likely to have lower overall sustainability than a system that has low social sustainability. This should be a focus when assessing multiple real systems.
5. Conclusions
5.1. Theoretical Implications
This article describes a robust method to assess the sustainability of aquaculture systems with special emphasis on IMTA systems. It is based on combining parameters, including LCA, LCC, SLCA, and emergy accounting results, using DEXi freeware. A template was designed to help users easily provide data to perform the assessment. The template automatically transforms data into scaled indicators ready to be used by DEXiAqua. The method was developed by an expert consortium after multiple workshops and surveys that resulted in a consensual framework. It guarantees that, from the SIMTAP expert’s perspective, the attributes considered are the most relevant to assess the sustainability of aquaculture systems. However, to prevent possible divergences between experts linked to specific systems, this framework can be adapted to the geographic, economic, social, and environmental contexts of specific case studies. However, users should use common references (i.e., indicators, thresholds, and scales) to compare systems.
5.2. Practical Implications
The method was tested on an initial case study, which confirmed the time-consuming nature of such assessment, although part of the data had already been collected. It reveals the usefulness of the developed template that automatically calculates most of the indicators and the related scales. It permits the user to have the first check on obtained values and prevent some errors before launching the DEXi model. The case study also confirmed the ability of DEXiAqua to assess overall sustainability and to provide detailed indications for improvement. It can identify which parameters to focus on in a complex attribute tree of the system to improve the overall sustainability. Again, the template allows to quickly test modifications on the input data and their implications on sustainability.
5.3. Limitations and Future Research
Future steps will include applying the method to multiple systems. This will include an IMTA system and a reference system in each of France, Italy, Malta, and Turkey. Beyond their intrinsic objectives (to compare IMTA systems to those that already exist), the assessments will help determine how to adapt DEXiAqua to geographic contexts. They will also provide additional information to analyze the sensitivity of DEXiAqua. The method will benefit from these multiple assessments and will be adapted until the end of the project to apply it to additional case studies. It would also benefit from being tested by experts on aquaculture systems. Finally, the use of fuzzy logic should be investigated in the future principally in order to minimize the knife-edge effect of the use of thresholds as performed by the CONTRA model [38].
Supplementary Materials
The following are available online at https://www.mdpi.com/article/10.3390/su13147779/s1. Supplementary file S1: Python scripts for the sensitivity analysis; supplementary file S2: Indicators for DEXiAqua; supplementary file S3: Synoptic views of the three branches of sustainability; supplementary file S4: Input data for the case study; supplementary file S5: Scaling result for the case study; supplementary file S6: Synoptic view od the case study results.
Author Contributions
Conceptualization, T.D., C.J., A.W., N.A.-C. and J.A.; methodology, S.L.F., T.D., C.J., A.W., N.A.-C., J.B., M.C. and J.A.; software, S.L.F. and T.D.; validation, S.L.F., T.D., C.J., A.W., N.A.-C., J.B., M.C. and J.A.; investigation, S.L.F., T.D., C.J., A.W., N.A.-C., J.B., M.C. and J.A.; resources, S.L.F., T.D., C.J., A.W., N.A.-C., J.B., M.C. and J.A.; writing—original draft preparation, S.L.F., C.J., A.W., N.A.-C. and J.A..; writing—review and editing, S.L.F., T.D., C.J., A.W., N.A.-C., J.B., M.C. and J.A.; supervision, J.A.; project administration, J.A. All authors have read and agreed to the published version of the manuscript.
Funding
This study was conducted within the framework of the EU PRIMA S2 2018 SIMTAP project and financially supported by ANR-18-PRIM-0017-05.
Institutional Review Board Statement
Not Applicable.
Informed Consent Statement
Not Applicable.
Acknowledgments
We thank the partners of the SIMTAP project who helped develop DEXiAqua: Alberto Pardossi, Juan Francisco Fierro Sañudo, Lorenzo Rossi, Chingoileima Maibam (University of Pisa, Italy, Department of Agriculture, Food and Environment), Carlo Bibbiani, Baldassare Fronte (University of Pisa, Italy, Department of Veterinary Sciences), Daniele Torregiani, Alberto Barbaresi, Enrica Santolini (University of Bologna, Italy), Rainer Linke (Kolorev GmbH, Bonn, Germany), Kyle Spiteri (Ministry for Agriculture, Fisheries, and Animal Rights, Marsa, Malta), and Mehmet Ali Turan Koçer, Hüseyin Sevgili (Mediterranean Fisheries Research Production and Training Institute, Antalya, Turkey). Finally, the authors thank Tristan Senga-Kiesse (INRAE) for good advice about sensitivity analysis and Thomas Foricher for help writing Python scripts.
Conflicts of Interest
The authors declare no conflict of interest. The funders had no role in the design of the study; in the collection, analysis, or interpretation of data; in the writing of the manuscript; or in the decision to publish the results.
References
- Godfray, H.C.J.; Beddington, J.R.; Crute, I.R.; Haddad, L.; Lawrence, D.; Muir, J.F.; Pretty, J.; Robinson, S.; Thomas, S.M.; Toulmin, C. Food Security: The Challenge of Feeding 9 Billion People. Science 2010, 327, 812–818. [Google Scholar] [CrossRef] [PubMed]
- FAO. The State of World Fisheries and Aquaculture 2020; FAO: Rome, Italy, 2020. [Google Scholar] [CrossRef]
- Valenti, W.C.; Kimpara, J.M.; Preto, B.D.L.; Moraes-Valenti, P. Indicators of sustainability to assess aquaculture systems. Ecol. Indic. 2018, 88, 402–413. [Google Scholar] [CrossRef]
- Pelletier, N.; Tyedmers, P. Feeding farmed salmon: Is organic better? Aquaculture 2007, 272, 399–416. [Google Scholar] [CrossRef]
- Pelletier, N.; Tyedmers, P. Life Cycle Considerations for Improving Sustainability Assessments in Seafood Awareness Campaigns. Environ. Manag. 2008, 42, 918–931. [Google Scholar] [CrossRef] [PubMed]
- Pelletier, N.; Tyedmers, P.; Sonesson, U.; Scholz, A.; Ziegler, F.; Flysjo, A.; Kruse, S.; Cancino, B.; Silverman, H. Not All Salmon Are Created Equal: Life Cycle Assessment (LCA) of Global Salmon Farming Systems. Environ. Sci. Technol. 2009, 43, 8730–8736. [Google Scholar] [CrossRef] [PubMed]
- Ford, J.S.; Pelletier, N.L.; Ziegler, F.; Scholz, A.J.; Tyedmers, P.; Sonesson, U.; Kruse, S.A.; Silverman, H. Proposed Local Ecological Impact Categories and Indicators for Life Cycle Assessment of Aquaculture. J. Ind. Ecol. 2012, 16, 254–265. [Google Scholar] [CrossRef]
- Zamprogna, A.; Fratoni, S.; Buis, J.; John, S.; Ong, X.; Khajouei, E.; Kathirampatti, R. Insects and Derived Products as Ingredient for Fish Feed; Wageningen University: Wageningen, The Netherlands, 2017. [Google Scholar] [CrossRef]
- Thévenot, A.; Rivera, J.L.; Wilfart, A.; Maillard, F.; Hassouna, M.; Kiesse, T.S.; Feon, S.; Aubin, J. Mealworm meal for animal feed: Environmental assessment and sensitivity analysis to guide future prospects. J. Clean. Prod. 2018, 170, 1260–1267. [Google Scholar] [CrossRef]
- Philis, G.; Gracey, E.O.; Gansel, L.C.; Fet, A.M.; Rebours, C. Comparing the primary energy and phosphorus consumption of soybean and seaweed-based aquafeed proteins—A material and substance flow analysis. J. Clean. Prod. 2018, 200, 1142–1153. [Google Scholar] [CrossRef]
- Feon, S.L.; Thévenot, A.; Maillard, F.; Macombe, C.; Forteau, L.; Aubin, J. Life Cycle Assessment of fish fed with insect meal: Case study of mealworm inclusion in trout feed, in France. Aquaculture 2019, 500, 82–91. [Google Scholar] [CrossRef]
- Malcorps, W.; Kok, B.; Land, M.V.; Fritz, M.; Van Doren, D.; Servin, K.; Van Der Heijden, P.; Palmer, R.; Auchterlonie, N.; Rietkerk, M.; et al. The Sustainability Conundrum of Fishmeal Substitution by Plant Ingredients in Shrimp Feeds. Sustainability 2019, 11, 1212. [Google Scholar] [CrossRef]
- Maiolo, S.; Parisi, G.; Biondi, N.; Lunelli, F.; Tibaldi, E.; Pastres, R. Fishmeal partial substitution within aquafeed formulations: Life cycle assessment of four alternative protein sources. Int. J. Life Cycle Assess. 2020, 25, 1455–1471. [Google Scholar] [CrossRef]
- European Commission. Communication from the Commission to the European Parliament, the Council, the European Economic and Social Committee and the Committee of the Regions. Strategic Guidelines for the Sustainable Development of EU Aquaculture; European Commission: Brussels, Belgium, 2013; Volume 229. [Google Scholar]
- Neori, A.; Chopin, T.; Troell, M.; Buschmann, A.; Kraemer, G.P.; Halling, C.; Shpigel, M.; Yarish, C. Integrated aquaculture: Rationale, evolution and state of the art emphasizing seaweed biofiltration in modern mariculture. Aquaculture 2004, 231, 361–391. [Google Scholar] [CrossRef]
- Granada, L.; Sousa, N.; Lopes, S.; Lemos, M.F.L. Is integrated multitrophic aquaculture the solution to the sectors’ major challenges?—A review. Rev. Aquac. 2015, 8, 283–300. [Google Scholar] [CrossRef]
- Cunha, M.; Quental-Ferreira, H.; Parejo, A.; Gamito, S.; Ribeiro, L.; Moreira, M.; Monteiro, I.; Soares, F.; Pousão-Ferreira, P. Understanding the individual role of fish, oyster, phytoplankton and macroalgae in the ecology of integrated production in earthen ponds. Aquaculture 2019, 512, 734297. [Google Scholar] [CrossRef]
- Waller, U.; Buhmann, A.K.; Ernst, A.; Hanke, V.; Kulakowski, A.; Wecker, B.; Orellana, J.; Papenbrock, J. Integrated multi-trophic aquaculture in a zero-exchange recirculation aquaculture system for marine fish and hydroponic halophyte production. Aquac. Int. 2015, 23, 1473–1489. [Google Scholar] [CrossRef]
- Marques, B.; Lillebø, A.; Nunes, C.; Coimbra, M.; Calado, R.; Ricardo, F. Adding value to ragworms (Hediste diversicolor) through the bioremediation of a super-intensive marine fish farm. Aquac. Environ. Interact. 2018, 10, 79–88. [Google Scholar] [CrossRef]
- Frankic, A.; Hershner, C. Sustainable aquaculture: Developing the promise of aquaculture. Aquac. Int. 2003, 11, 517–530. [Google Scholar] [CrossRef]
- Van Woensel, L.; Archer, G.; Panades-Estruch, L.; Vrscaj, D. Ten Technologies Which Could Change our Lives: Potential Impacts and Policy Implications: In-Depth Analysis; STOA: Brussels, Belgium, 2015. [Google Scholar]
- Kleitou, P.; Kletou, D.; David, J. Is Europe ready for integrated multi-trophic aquaculture? A survey on the perspectives of European farmers and scientists with IMTA experience. Aquaculture 2018, 490, 136–148. [Google Scholar] [CrossRef]
- Pope, J.; Annandale, D.; Morrison-Saunders, A. Conceptualising sustainability assessment. Environ. Impact Assess. Rev. 2004, 24, 595–616. [Google Scholar] [CrossRef]
- Lairez, J.; Feschet, P.; Aubin, J.; Bockstaller, C.; Bouvarel, I. Agriculture et Développement Durable: Guide pour L’évaluation Multicritère; Éditions Quae: Versailles, France, 2015. [Google Scholar]
- Lazard, J.; Rey-Valette, H.; Clément, O.; Aubin, J.; Mathé, S.; Chia, E.; Legendre, M.; Caruso, D.; Mikolasek, O.; Blancheton, J.-P.; et al. (Eds.) Guide de Co-Construction D’indicateurs de Développement Durable en Aquaculture. EVAD. 2008. Available online: https://agritrop.cirad.fr/548449/ (accessed on 27 January 2021).
- Lazard, J.; Rey-Valette, H.; Aubin, J.; Mathé, S.; Chia, E.; Caruso, D.; Mikolasek, O.; Blancheton, J.P.; Legendre, M.; René, F.; et al. Assessing aquaculture sustainability: A comparative methodology. Int. J. Sustain. Dev. World Ecol. 2014, 21, 503–511. [Google Scholar] [CrossRef][Green Version]
- Belton, V.; Stewart, T.J.; Belton, V.; Stewart, T.J. Multiple Criteria Decision Analysis: An Integrated Approach. 2002. Available online: https://pureportal.strath.ac.uk/en/publications/multiple-criteria-decision-analysis-an-integrated-approach (accessed on 27 January 2021).
- Bohanec, M. DEXi: Program for Multi-Attribute Decision Making, User’s Manual, Version 3.03; IJS Report DP-10707; Jozef Stefan Institute: Ljubljana, Slovenia, 2011; Available online: http://www-ai.ijs.si/MarkoBohanec/pub/DEXiManual303.pdf (accessed on 14 January 2020).
- Sadok, W.; Angevin, F.; Bergez, J.-É.; Bockstaller, C.; Colomb, B.; Guichard, L.; Reau, R.; Doré, T. Ex ante assessment of the sustainability of alternative cropping systems: Implications for using multi-criteria decision-aid methods. A review. Agron. Sustain. Dev. 2008, 28, 163–174. [Google Scholar] [CrossRef]
- Sadok, W.; Angevin, F.; Bergez, J.-E.; Bockstaller, C.; Colomb, B.; Guichard, L.; Reau, R.; Messéan, A.; Doré, T. MASC, a qualitative multi-attribute decision model for ex ante assessment of the sustainability of cropping systems. Agron. Sustain. Dev. 2009, 29, 447–461. [Google Scholar] [CrossRef]
- Bergez, J.-E. Using a genetic algorithm to define worst-best and best-worst options of a DEXi-type model: Application to the MASC model of cropping-system sustainability. Comput. Electron. Agric. 2013, 90, 93–98. [Google Scholar] [CrossRef]
- Pelzer, E.; Fortino, G.; Bockstaller, C.; Angevin, F.; Lamine, C.; Moonen, C.; Vasileiadis, V.; Guérin, D.; Guichard, L.; Reau, R.; et al. Assessing innovative cropping systems with DEXiPM, a qualitative multi-criteria assessment tool derived from DEXi. Ecol. Indic. 2012, 18, 171–182. [Google Scholar] [CrossRef]
- Vasileiadis, V.; Moonen, A.C.; Sattin, M.; Otto, S.; Pons, X.; Kudsk, P.; Veres, A.; Dorner, Z.; van der Weide, R.; Marraccini, E.; et al. Sustainability of European maize-based cropping systems: Economic, environmental and social assessment of current and proposed innovative IPM-based systems. Eur. J. Agron. 2013, 48, 1–11. [Google Scholar] [CrossRef]
- Estorgues, V.; Lecuyer, G.; Allainguillaume, J.; Faloya, V. DEXiPM—Field Vegetables: Un modèle d’analyse ex ante de la durabilité des systèmes légumiers. Innov. Agron. 2017. [Google Scholar] [CrossRef]
- Colomb, B.; Carof, M.; Aveline, A.; Bergez, J.-E. Stockless organic farming: Strengths and weaknesses evidenced by a multicriteria sustainability assessment model. Agron. Sustain. Dev. 2012, 33, 593–608. [Google Scholar] [CrossRef]
- Alaphilippe, A.; Angevin, F.; Guérin, A.; Guillermin, P.; Vélu, A.; Zavagli, F. DEXiFruits, un outil d’évaluation multicritère des systèmes de production de fruits: D’un outil recherche à un outil terrain. Un outil co-construit. Innov. Agron. 2017. [Google Scholar] [CrossRef]
- Rezaei, M.E.; Barmaki, M.; Veisi, H. Sustainability assessment of potato fields using the DEXi decision support system in Hamadan Province, Iran. J. Integr. Agric. 2018, 17, 2583–2595. [Google Scholar] [CrossRef]
- Bockstaller, C.; Beauchet, S.; Manneville, V.; Amiaud, B.; Botreau, R. A tool to design fuzzy decision trees for sustainability assessment. Environ. Model. Softw. 2017, 97, 130–144. [Google Scholar] [CrossRef]
- Bohanec, M.; Cortet, J.; Griffiths, B.; Žnidaršič, M.; Debeljak, M.; Caul, S.; Thompson, J.; Krogh, P.H. A qualitative multi-attribute model for assessing the impact of cropping systems on soil quality. Pedobiologia 2007, 51, 239–250. [Google Scholar] [CrossRef]
- Bohanec, M.; Messéan, A.; Scatasta, S.; Angevin, F.; Griffiths, B.; Krogh, P.H.; Žnidaršič, M.; Džeroski, S. A qualitative multi-attribute model for economic and ecological assessment of genetically modified crops. Ecol. Model. 2008, 215, 247–261. [Google Scholar] [CrossRef]
- Rossi, L.; Bibbiani, C.; Fierro-Sañudo, J.F.; Maibam, C.; Incrocci, L.; Pardossi, A.; Fronte, B. Selection of marine fish for integrated multi-trophic aquaponic production in the Mediterranean area using DEXi multi-criteria analysis. Aquaculture 2021, 535, 736402. [Google Scholar] [CrossRef]
- Bohanec, M. DEXi: A Program for Multi-Attribute Decision Making. 2020. Available online: https://kt.ijs.si/MarkoBohanec/dexi.html (accessed on 12 January 2021).
- ISO. ISO 14044:2006 Environmental Management—Life Cycle Assessment—Requirements and Guidelines; International Organization for Standardization: London, UK, 2006. [Google Scholar]
- ISO. ISO-14040:2006 Environmental Management—Life Cycle Assessment—Principles and Framework; International Organization for Standardization: London, UK, 2006. [Google Scholar]
- Aubin, J.; Papatryphon, E.; van der Werf, H.; Chatzifotis, S. Assessment of the environmental impact of carnivorous finfish production systems using life cycle assessment. J. Clean. Prod. 2009, 17, 354–361. [Google Scholar] [CrossRef]
- Samuel-Fitwi, B.; Nagel, F.; Meyer, S.; Schroeder, J.; Schulz, C. Comparative life cycle assessment (LCA) of raising rainbow trout (Oncorhynchus mykiss) in different production systems. Aquac. Eng. 2013, 54, 85–92. [Google Scholar] [CrossRef]
- Chen, X.; Samson, E.; Tocqueville, A.; Aubin, J. Environmental assessment of trout farming in France by life cycle assessment: Using bootstrapped principal component analysis to better define system classification. J. Clean. Prod. 2015, 87, 87–95. [Google Scholar] [CrossRef]
- Czyrnek-Delêtre, M.M.; Rocca, S.; Agostini, A.; Giuntoli, J.; Murphy, J.D. Life cycle assessment of seaweed biomethane, generated from seaweed sourced from integrated multi-trophic aquaculture in temperate oceanic climates. Appl. Energy 2017, 196, 34–50. [Google Scholar] [CrossRef]
- Chary, K.; Aubin, J.; Sadoul, B.; Fiandrino, A.; Covès, D.; Callier, M.D. Integrated multi-trophic aquaculture of red drum (Sciaenops ocellatus) and sea cucumber (Holothuria scabra): Assessing bioremediation and life-cycle impacts. Aquaculture 2020, 516, 734621. [Google Scholar] [CrossRef]
- ILCD. Supporting Information to the Characterization Factors of Recommended EF Life Cycle Impact Assessment Methods: New Methods and Differences with ILCD; Publications Office of the EU: Luxembourg, 2018; Available online: https://data.europa.eu/doi/10.2760/671368 (accessed on 1 April 2021).
- Röhrlich, M.; Mistry, M.; Martens, P.N.; Buntenbach, S.; Ruhrberg, M.; Dienhart, M.; Briem, S.; Quinkertz, R.; Alkan, Z.; Kugeler, K. A method to calculate the cumulative energy demand (CED) of lignite extraction. Int. J. Life Cycle Assess. 2000, 5, 369–373. [Google Scholar] [CrossRef]
- Boulay, A.-M.; Bare, J.; De Camillis, C.; Döll, P.; Gassert, F.; Gerten, D.; Humbert, S.; Inaba, A.; Itsubo, N.; Lemoine, Y.; et al. Consensus building on the development of a stress-based indicator for LCA-based impact assessment of water consumption: Outcome of the expert workshops. Int. J. Life Cycle Assess. 2015, 20, 577–583. [Google Scholar] [CrossRef]
- Papatryphon, E.; Petit, J.; Kaushik, S.J.; Van Der Werf, H.M.G. Environmental Impact Assessment of Salmonid Feeds Using Life Cycle Assessment (LCA). Ambio 2004, 33, 316–323. [Google Scholar] [CrossRef] [PubMed]
- Odum, H.T. Environmental Accounting: EMERGY and Environmental Decision Making; Wiley: New York, NY, USA, 1996. [Google Scholar]
- Li, L.; Lu, H.; Ren, H.; Kang, W.; Chen, F. Emergy evaluations of three aquaculture systems on wetlands surrounding the Pearl River Estuary, China. Ecol. Indic. 2011, 11, 526–534. [Google Scholar] [CrossRef]
- Williamson, T.R.; Tilley, D.R.; Campbell, E. Emergy analysis to evaluate the sustainability of two oyster aquaculture systems in the Chesapeake Bay. Ecol. Eng. 2015, 85, 103–120. [Google Scholar] [CrossRef]
- Wilfart, A.; Prudhomme, J.; Blancheton, J.-P.; Aubin, J. LCA and emergy accounting of aquaculture systems: Towards ecological intensification. J. Environ. Manag. 2013, 121, 96–109. [Google Scholar] [CrossRef]
- Swarr, T.E.; Hunkeler, D.; Klöpffer, W.; Pesonen, H.-L.; Ciroth, A.; Brent, A.; Pagan, R. Environmental life-cycle costing: A code of practice. Int. J. Life Cycle Assess. 2011, 16, 389–391. [Google Scholar] [CrossRef]
- Costa, D.; Quinteiro, P.; Dias, A. A systematic review of life cycle sustainability assessment: Current state, methodological challenges, and implementation issues. Sci. Total. Environ. 2019, 686, 774–787. [Google Scholar] [CrossRef] [PubMed]
- Commission of the European Union Joint Research Centre. Social Life Cycle Assessment: State of the Art and Challenges for Product Policy Support; Publications Office of the EU: Luxembourg, 2015; Available online: https://data.europa.eu/doi/10.2788/53485 (accessed on 4 January 2021).
- Andrews, E.S.; Barthel, L.-P.; Beck, T. Guidelines for Social Life Cycle Assessment of Products; United Nations Environment Programme: Paris, France, 2013; Available online: https://www.deslibris.ca/ID/236529 (accessed on 12 April 2021).
- UNEP. Guidelines for Social Life Cycle Assessment of Products and Organizations 2020; Benoît-Norris, C., Traverso, M., Neugebauer, S., Ekener, E., Schaubroeck, T., Russo Garrido, S., Berger, M., Valdivia, S., Lehmann, A., Finkbeiner, M., et al., Eds.; United Nations Environment Programme (UNEP): Cambridge, UK, 2020. [Google Scholar]
- Garrido, S.R.; Parent, J.; Beaulieu, L.; Revéret, J.-P. A literature review of type I SLCA—Making the logic underlying methodological choices explicit. Int. J. Life Cycle Assess. 2016, 23, 432–444. [Google Scholar] [CrossRef]
- Pelletier, N. Social Sustainability Assessment of Canadian Egg Production Facilities: Methods, Analysis, and Recommendations. Sustainability 2018, 10, 1601. [Google Scholar] [CrossRef]
- Zira, S.; Röös, E.; Ivarsson, E.; Hoffmann, R.; Rydhmer, L. Social life cycle assessment of Swedish organic and conventional pork production. Int. J. Life Cycle Assess. 2020, 25, 1957–1975. [Google Scholar] [CrossRef]
- EU/JRC. Economic Report of the EU Aquaculture Sector (STECF-18-19); Publications Office of the EU: Luxembourg, 2018; Available online: https://data.europa.eu/doi/10.2760/45076 (accessed on 20 April 2021).
- Iversen, A.; Asche, F.; Hermansen, Ø.; Nystøyl, R. Production cost and competitiveness in major salmon farming countries 2003–2018. Aquaculture 2020, 522, 735089. [Google Scholar] [CrossRef]
- Craheix, D.; Bergez, J.-E.; Angevin, F.; Bockstaller, C.; Bohanec, M.; Colomb, B.; Doré, T.; Fortino, G.; Guichard, L.; Pelzer, E.; et al. Guidelines to design models assessing agricultural sustainability, based upon feedbacks from the DEXi decision support system. Agron. Sustain. Dev. 2015, 35, 1431–1447. [Google Scholar] [CrossRef]
- Carpani, M.; Bergez, J.-E.; Monod, H. Sensitivity analysis of a hierarchical qualitative model for sustainability assessment of cropping systems. Environ. Model. Softw. 2012, 27–28, 15–22. [Google Scholar] [CrossRef]


Publisher’s Note: MDPI stays neutral with regard to jurisdictional claims in published maps and institutional affiliations. |
© 2021 by the authors. Licensee MDPI, Basel, Switzerland. This article is an open access article distributed under the terms and conditions of the Creative Commons Attribution (CC BY) license (https://creativecommons.org/licenses/by/4.0/).