Article

Defects Impact on PV System GHG Mitigation Potential and Climate Change

by
Waqas Ahmed
1,
Jamil Ahmed Sheikh
2,
Shahjadi Hisan Farjana
3 and
M. A. Parvez Mahmud
4,*
1
Secret Minds, Entrepreneurial Organization, Islamabad 44000, Pakistan
2
Department of Sociology, University of Wah, Wah Cantt 47040, Pakistan
3
Department of Mechanical Engineering, University of Melbourne, Melbourne, VIC 3053, Australia
4
School of Engineering, Deakin University, Geelong, VIC 3216, Australia
*
Author to whom correspondence should be addressed.
Sustainability 2021, 13(14), 7793; https://doi.org/10.3390/su13147793
Submission received: 30 May 2021 / Revised: 6 July 2021 / Accepted: 7 July 2021 / Published: 13 July 2021

Abstract

:
Solar photovoltaic (PV) systems are widely used to mitigate greenhouse gases (GHG), due to their green renewable nature. However, environmental factors such as bird drops, shade, pollution, etc., accommodation on PV panels surface reduce photons transmission to PV cells, which results in lower energy yield and GHG mitigation potential of PV system. In this study, the PV system’s energy and GHG mitigation potential loss is investigated under environmental stresses. Defects/hotspots caused by the environment on PV panel surface have unknown occurrence frequency, time duration, and intensity and are highly variable from location to location. Therefore, different concentrations of defects are induced in a healthy 12 kWp PV system. Healthy PV system has the potential to avoid the burning of 3427.65 L of gasoline by 16,157.9 kWh green energy production per annum. However, in 1% and 20% defective systems, green energy potential reduces to 15,974.3 and 12,485.6 kWh per annum, respectively. It is equivalent to lesser evasion burning of 3388.70, and 2648.64 L of gasoline, respectively. A timely solution to defective panels can prevent losses in the PV system to ensure optimal performance.

1. Introduction

Solar photovoltaic (PV) energy systems are widely used as green renewable energy sources across the globe. PV systems have a combustion-free nature, i.e., no burning of fossil fuels such as oil, gas, coal, etc., in the running phase. Hence, there are no production and emissions of greenhouse gases (GHG) such as CO2, NOX, water vapors, etc. GHGs are the leading cause of global climate change [1,2,3]. Moreover, fossil fuels are limited energy resources and are depleting fast [3]. However, across the globe, a major portion of energy production is based on conventional thermal power plants. For example, Pakistan’s energy production is heavily based on fossil fuel technology [4]. In contrast, the PV system offers a green solution because of its 1500–50,000 EJ per year, which is direct free solar energy potential across the globe [1]. PV systems have the advantage that small-scale PV systems can be installed on load sites, i.e., on rooftops of end-energy users. It reduces transmission and distribution losses; hence, GHG emissions reduction [2]. As a result, PV system energy production capacity was increased to 117 GW in 2019 [3].
Despite the tremendous potential, PV system efficiency varies depending upon geographical location and natural parameters. These factors in turn affect PV system output [2,5]. PV systems like other power system components such as insulators are exposed to environmental stresses. Environmental stresses include ultraviolet radiations, inert and active pollution, rain, snow, etc. [6]. These factors reduce the PV system’s performance [7]. Moreover, hotspots/defects that arise in the PV system due to the environment such as bird drops [3], shading effect [8], dust [9], etc., are responsible for energy losses and affect PV system output as well [3,10]. In addition, bypass diodes may not bypass the defective cell/part effectively, which results in energy loss and accelerated aging of panels [11]. The literature reports up to 18.9% annual power loss [7] and a reduction of PV output of up to 50% [3] due to PV system issues. Other issues may include wiring issues, aging, maximum power point tracking errors, manufacturing faults, etc. [3].
The PV panel suffering due to environmental issues brought on by shadow, bird drops, dust, etc., results in localized heating of PV panels. Issues, if they remain undetected, damage the PV module, which results in system permanent degradation [9]. Shaded PV cells operate in the reverse region, blocking the normal flow of current by healthy PV cells due to its series connection [3,12]. For instance, light dust particle accommodation on PV systems reduces light transmission up to 11%. While particle size may vary between 1 and 50 microns [5]. This gives a temperature rise at reverse-biased PV cells, which forms localized heating or the creation of hotspots [13]. These hotspots affect the PV systems in the short term and long term, which includes performance, efficiency, health, and reliability of PV systems [8,14]. The literature suggests that almost 50% of the overall fault is the hotspot [15]. However, PV system overheating may arise due to aging, cracks, snail tracks, etc., as well other than hotspots [3]. Bypass diodes provide an alternative path to avoid additional power loss due to PV cell(s) reverse-biased operation; however, the PV system still suffers from efficiency loss [14].
Some PV issues can be seen through the naked eye such as broken cells, burned cells, corrosion, etc. [16]. However, extensive analysis on PV panels condition/health monitoring for hotspots formation due to environmental issues is very much important specifically in large scale PV systems. Monitoring approaches include a non-invasive image-based approach, such as infrared (IR) thermographic images [3,17], electroluminescence images [18], etc. Moreover, the performance of PV panels can also be monitored using electrical signals, voltage, and current characteristics curves [19]. In IR images, hotspots and defective parts are brighter in appearance compared to the rest of the body [20]. Therefore, some PV panel hotspots and defects are identifiable in IR images [12]. PV issues such as bird drops, string, block, etc., are identifiable through infrared images. More detail of defects and possible identification through visuals of IR images is provided in [12,20]. PV panel issues such as bird drops, string, block, etc., have different concentrations on PV panels surface; hence, their impact is different, as shown in Figure 1. Importantly, the occurrence of these environmental issues is purely natural, and its impact (time duration and intensity) is highly variable. Therefore, their impact on energy production and GHG mitigation potential varies from case to case. IR thermographic experimental approach is provided in [17].
PV systems due to their green nature are capable of mitigating GHGs [1]. GHGs are one of the primary causes of climate change. Climate change has a devastating impact on the environment and creates unanticipated health threats [21]. Climate change has affected air quality, human health, food, and water supplies, i.e., social, and natural resources. It has affected sectors such as tourism and agriculture due to their linkage with weather and climate [21,22]. In a nutshell, climate change has affected human health, illness, air quality, the occurrence of extreme events, vector-borne diseases, water-related illness, food safety, nutrition and distribution, mental health, well-being, etc. More details are provided in [21].
Concisely, PV systems have tremendous green energy potential. Therefore, across the globe, PV systems are used to mitigate the GHGs. However, PV systems suffer from lower efficiency and output due to multiple issues. In this study, the PV system’s GHGs mitigation potential under environmentally induced hotspots/defects are investigated. Environmental issues may involve bird drops, shadow, pollution, etc., and accommodation on PV surface. Moreover, hotspots/defects occurrence and concentration are highly variable. For this purpose, different percentages of losses are added in the healthy PV system to investigate the drop in the energy production of a 12 kWp PV system. Afterwards, green energy output by the PV system and equivalent GHG production under mixed fuel combustion in conventional power plants are used to calculate the GHG mitigation potential in different defects/hotspots concentrations. However, this study is generic, but the geographical parameters of Pakistan’s capital, Islamabad, are considered.
The rest of the paper is structured as follows: Section 2 discusses the defects concentration on PV panels surface; Section 3 presents the research approach, while Section 4 focuses on the results; afterward, Section 5 discusses research significance, whereas the conclusion is presented in Section 6.

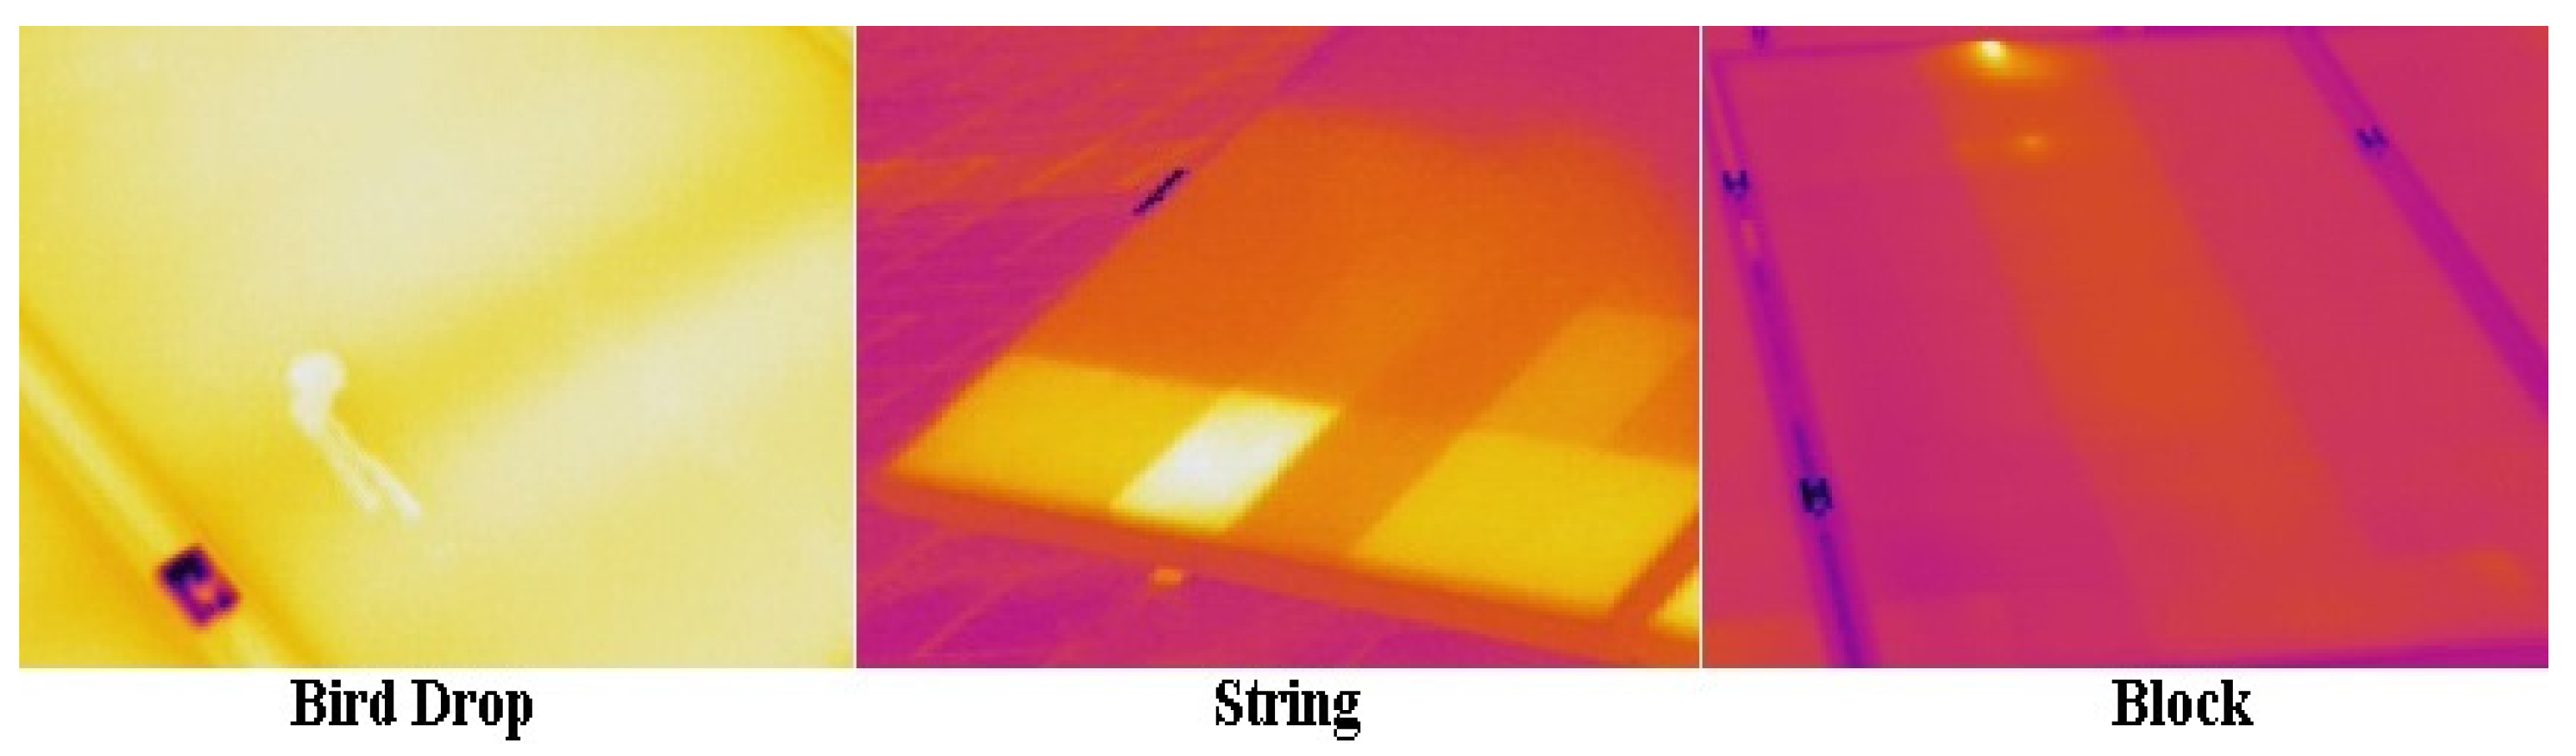
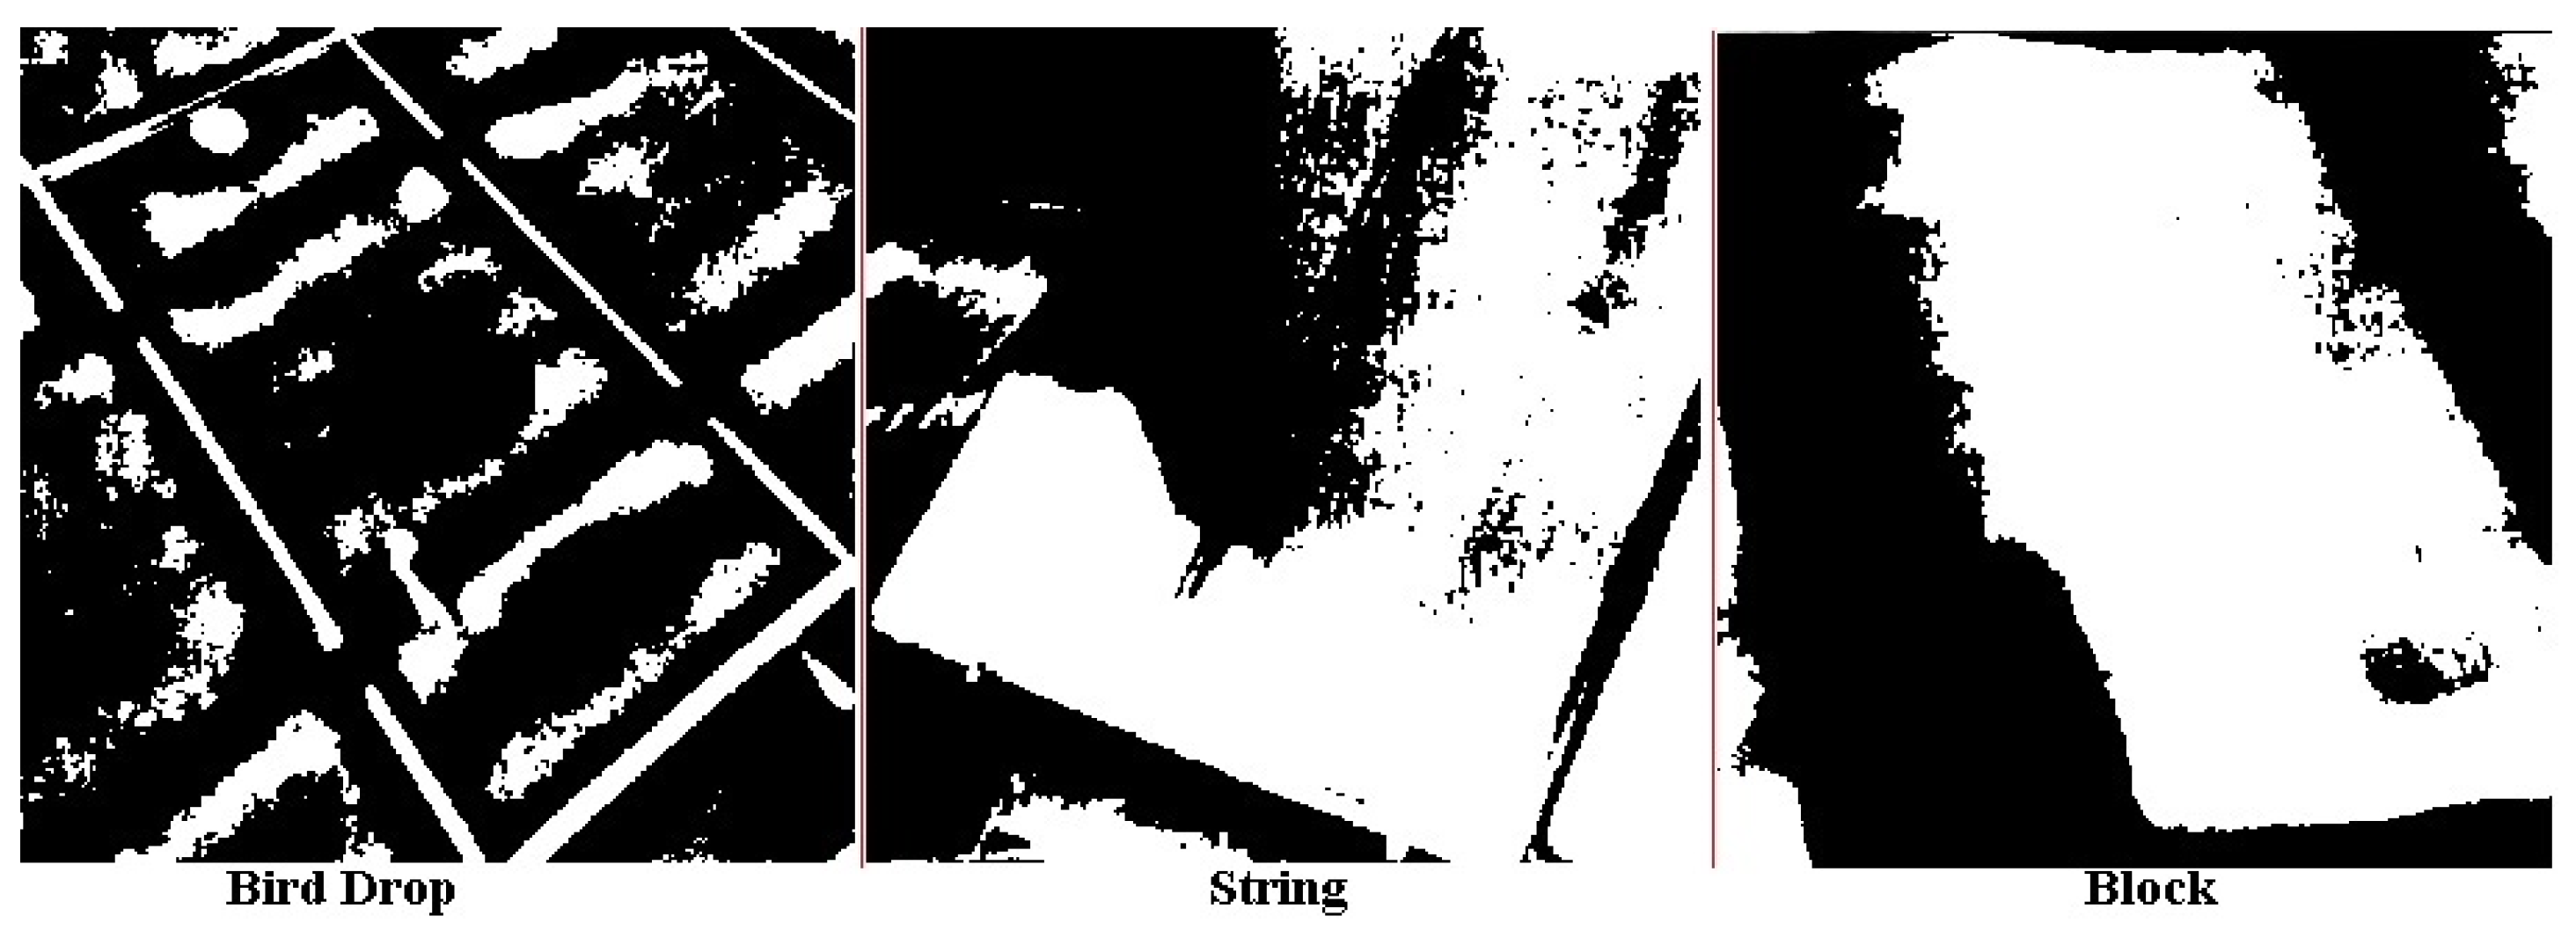
2. Defects Concentration on PV Panel Surface

The PV panel defects can be seen through the brighter areas due to high temperature/hotspots on the PV surfaces [20]. However, it is difficult to identify exactly how much area of PV panel is suffering. For this purpose, defects/hotspots covering PV panels surface are shown in Figure 2 by the white area and the healthy surface through the black surface. Initially, defective PV panels infrared images, i.e., presented in Figure 1 were converted to grayscale images. Afterward, IR images contrast was improved, and a filter was applied to reduce the noise and improve visibility on the PV surface image. Finally, images were binarized using Otsu’s method (string and block). Otsu chooses the threshold value to minimize the intraclass variance of the threshold black and white pixels [23].
However, birds’ drop image after filter was binarized by calculating locally adaptive image threshold using local first-order image statistics around each pixel. MATLAB 2020a was utilized for binarized defects investigation on solar PV panels surface. Moreover, it is important that the binarization approach, filters, etc., play a pivotal role. These techniques need careful selection, and results may greatly vary as a result.

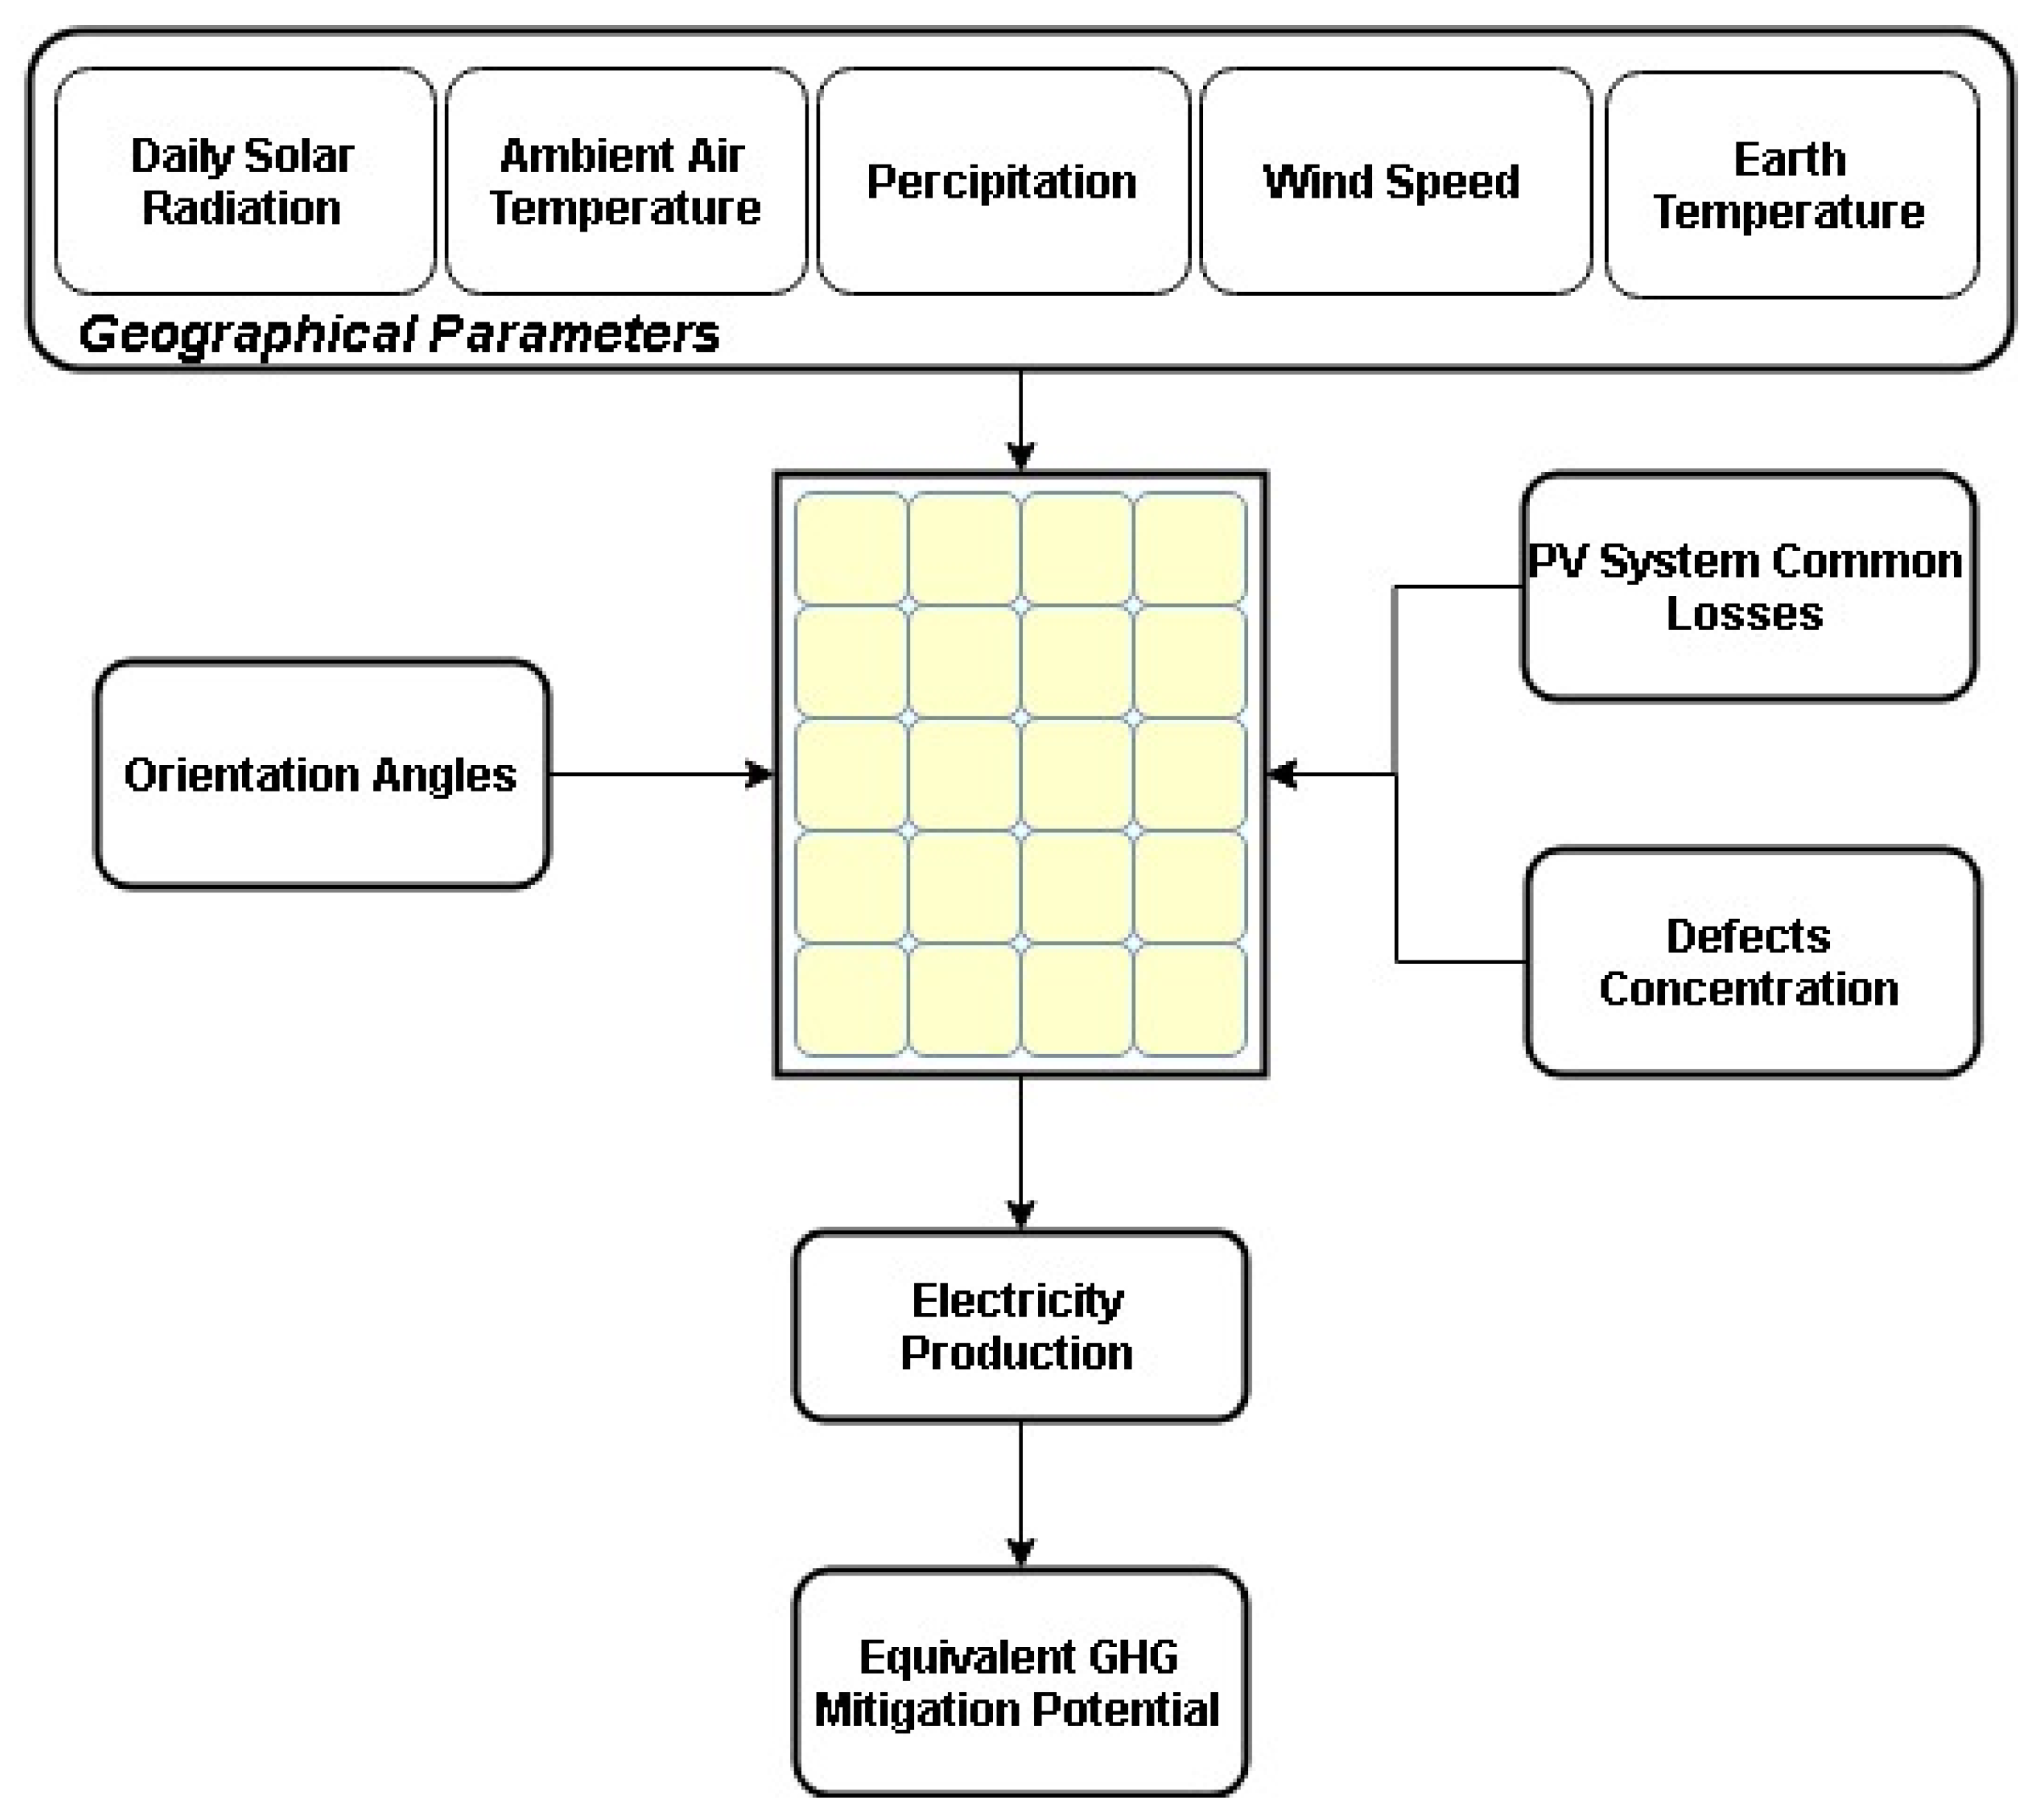
3. Research Approach

Environmental issues’ impact on PV system energy and GHG mitigation potential are carried out in RETScreen Expert software. RETScreen Expert is developed by the Ministry of Natural Resources, Canada. RETScreen is utilized for various analyses, financial, investment, GHG, etc., for power plants, industries, individual households, etc. [24]. The study is generic. However, Islamabad, Pakistan, is considered to analyze the performance of PV systems with different defects/hotspot concentrations.
After location selection, 12 kW PV system orientation angles are optimized to maximize the annual average daily solar radiations potential. Moreover, the PV system’s minor losses due to geographical constraints and aging issues are defined. Since PV system defects/hotspots frequency, severity, and time are purely unpredictable, PV system output energy with different percentages of defects is calculated for a year. Finally, PV systems’ energy production potential and GHG mitigation potential under different concentrations of defects are calculated. The proposed research approach is provided in Figure 3.

3.1. Location

The capital of Pakistan, Islamabad, was considered to be an appropriate location for the PV system. Islamabad’s geographical parameters are provided in Table 1, which were fetched from NASA meteorological data using RETScreen Expert Software. Geographical parameters greatly affect the PV system output in terms of solar radiations intercept and ambient temperature.

3.2. PV System

PV cell’s proper selection plays a crucial role in PV system performance by extracting energy from intercepted solar radiations. PV system grid tied topology is used in this research to utilize maximum PV system potential. Grid-tied scheme transmits surplus energy to the fossil-fuel-based main grid after fulfilling local load demand. PV system details are provided in Table 2.
Islamabad’s annual average daily solar radiation is 4.02 kWh/m2/d at the horizontal surface. The optimization of PV system orientation (tilt and azimuth) angles increases the PV system electricity production potential. Optimized orientation angles expose the PV surface to most solar radiations without additional investment, operation, and maintenance costs [1]. PV system orientation angles are adjusted to −34 tilted and 180 azimuth angles after careful consideration. This increases the annual average daily solar radiation to 4.38 kWh/m2/d.

3.3. PV System Losses
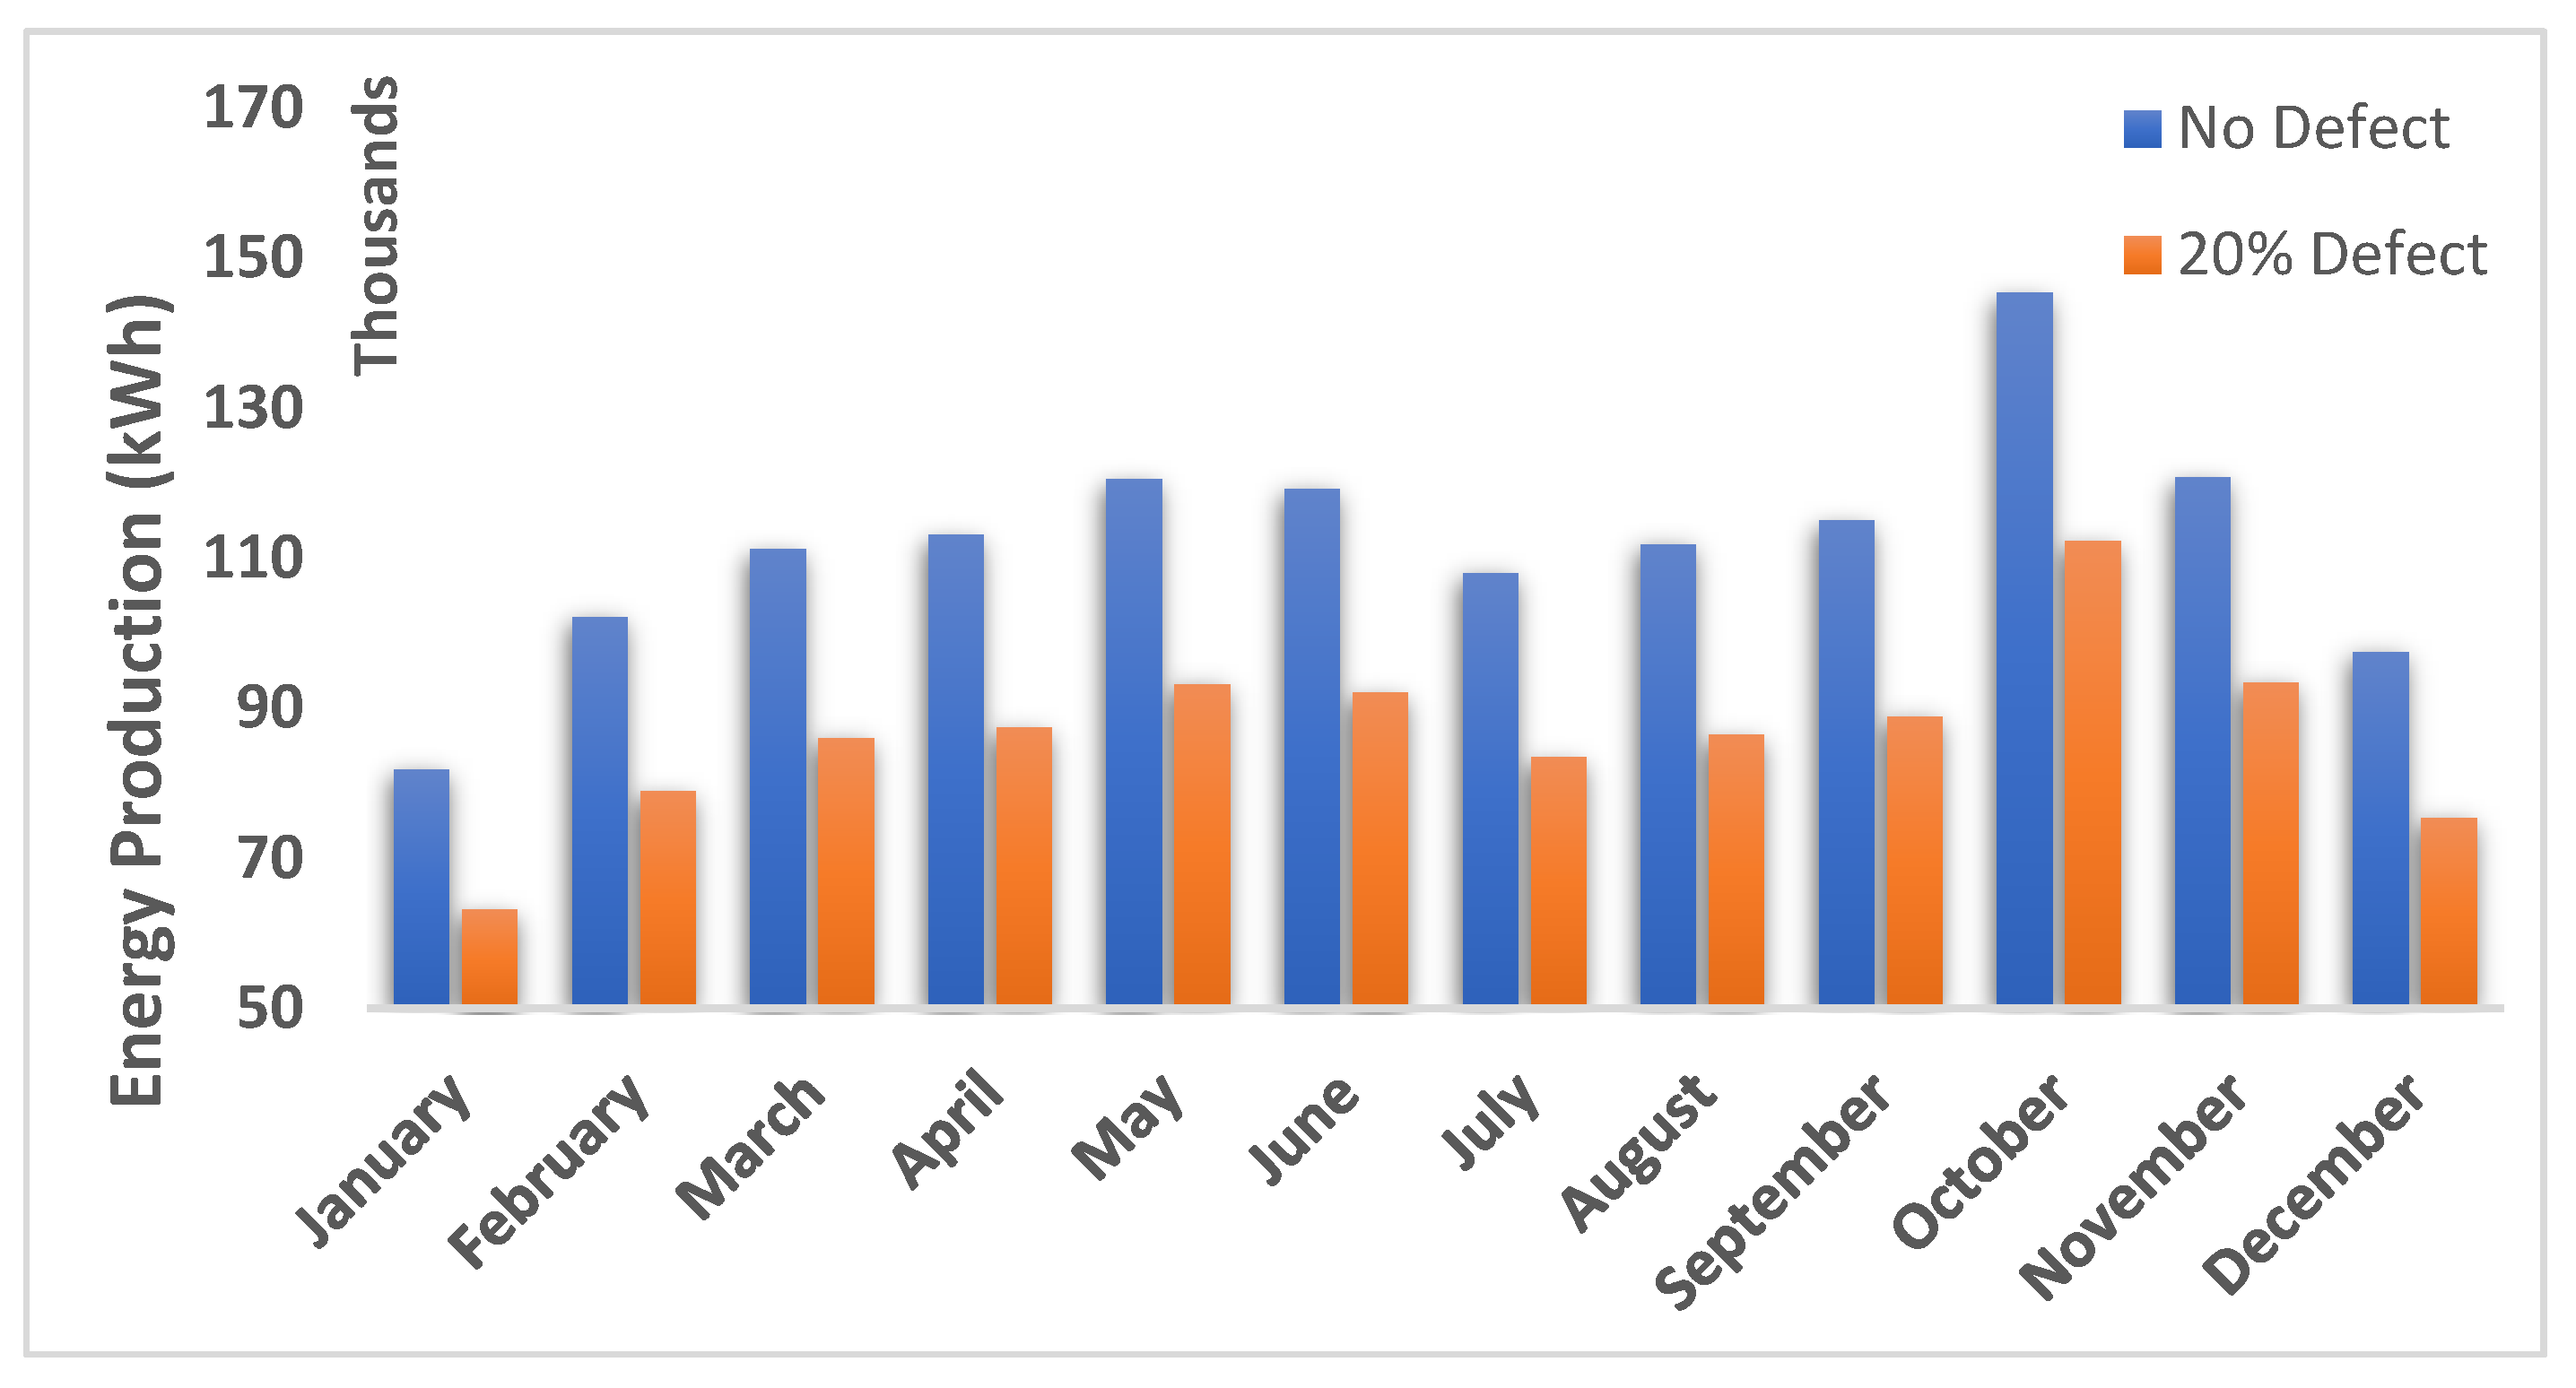
PV systems mainly comprised of PV panels, and inverters have manufacturing limitations defined by the manufacturer on the respective component’s datasheet [25]. Moreover, component performance declines over time due to the aging effect [6]. Additionally, the PV system based on geographical location may suffer from yield limitations. Limitations are due to very minute inert pollution accommodation on the surface of PV panels daily. This pollution layer on PV panels highly varies from location to location. Therefore, considering a real-time scenario, a 13% total loss in a PV system is considered right from the first year to tackle the minute uniform distributed pollution layer, which arises due to location and the aging phenomenon of electrical components.

4. Results

In this section, firstly a 12 kWp PV system output without any operational defects caused by any environmental stress (bird drops, shadow, etc.) or internal issues (wiring, manufacturing faults, etc.) is calculated as a reference. Afterward, 0.5 percent loss in the PV system may arise due to a minor defect/hotspot, such as birds drop, is considered, since it covers a very small part of the PV panel, reflected in Figure 1. Afterward, defect/hotspot-like vicinal objects’ shadow covers a considerable amount of PV cells. A 1% loss is considered in the PV system for a year. Finally, multiple hotspots or major fault/defect such as a block covering one third of PV panel surface [12] in the PV system is considered as a 20% loss. However, defects and their occurrence frequency, time span, and causes in the PV system may vary. Since these are purely unpredictable natural events. It is not necessarily a minor loss in the PV system due to bird drop or having the same concentration and loss percentage. It may have other reasons; the details of defects are provided in [20]. Moreover, due to the cleaning of the PV panels, the potential formation of hotspots decreases. However, in this study, the average concentration of hotspots and defects is added for a whole year due to their unpredictable nature and duration. However, their timely monitoring may prevent PV panels from greater and permanent issues [3]. Table 3 provides comparative details of healthy and different percentages of losses in PV system due to defects.
PV system green output per annum in presence of different defects/hotpots concentration is used to calculate the GHG production under mixed fuels energy production technology using RETScreen Expert software. PV system energy output drops due to defects/hotspots directly relate to the PV system’s GHG mitigation potential. Detail of GHG mitigation potential in terms of CO2 equivalent, of PV system under different losses condition, and equivalent cases for better understanding are provided in Table 4. For GHG analysis, losses in Pakistan’s transmission and distribution (T&D) sector are considered to be 17.136% [26]. In addition PV system T&D losses are considered as zero, considering the case of a household rooftop.
A 12 kWp PV system located in Islamabad has the potential to mitigate approximately 8 t of CO2 equivalent GHG emissions per year, which reduces to 6.16 tonnes of CO2 equivalent GHG emission in case of 20% loss in green renewable energy production due to defects. In the worst-case scenario, 25 years life span of the PV system, if the same percentage of loss persists, limits approximately 45.33 tonnes of CO2 equivalent GHG emissions, which highly compromises the true potential of the 12 kWp PV system. In terms of energy production capacity, it is approximately 91,806.1 kWh lesser production in PV system life span.

5. Research Significance

A defect can be simply defined as a cause of energy loss in a PV system. A defect/hotspot caused by environmental factors such as bird drops, vicinal objects shadow, and impurities accommodation on the PV surface reduces the efficiency of absorbing incident solar energy. It forces the PV cells to operate in the reverse region. Hence, dissipating energy and resulting into localized heating. A 20% defect in a healthy 12 kWp PV system reduces the production of 91,806.1 kWh, which is equivalent to 19,475.3 L of gasoline or 105.41 barrels of crude oil burned for the lost energy production, in PV 25 years lifetime.
However, the impact of a household rooftop PV system on GHG emissions mitigation is very limited on a global scale but has equal importance, as conducted in [1,2] studies. Since the reduction in PV output forces energy users to depend on fossil-fuel-based main grid. It results in the production of GHGs. The impact of hotspots and defects, especially if they remain undetected in multiple PV systems or in a large-scale PV system, will have more prominent consequences. For this purpose, multiple PV-equipped rooftop households (single end energy users) scenario equivalent to 1 MW PV system is considered. It illustrates the impact of the defect on large-scale PV system with two cases, without defect and with 20% defect. Defects impact on the energy production capability of the 1 MW PV system is shown in Figure 4. A 20% defective PV system GHG emissions mitigation potential with equivalent cases is shown in Table 5.

6. Conclusions

PV systems due to their huge potential, renewable and green nature are widely used across the globe. However, PV systems suffer in efficiency, performance, output, and effective GHG mitigation potential because of hotspots and defects. These defects in the PV system arise due to internal issues (manufacturing, etc.) and external/environmental issues (bird drops, shadow, etc.). In addition, environmental issues such as concentration, time, occurrence frequency, etc., are unpredictable and vary from location to location. Therefore, the losses in the PV system specifically due to environmental issues reduce green output, hence lowering GHG mitigation potential.
The 20% environmentally induced defects on the 1 MW PV system in Islamabad reduce the energy output by 306,081.5 kWh in a single year. Moreover, to meet the energy demand gap due to losses in a PV system using mixed fuels combustion, thermal power plants emit approximately 151.12 t of CO2 equivalent GHGs with 17.136% transmission and distribution losses in Pakistan energy sector. This is equivalent to the burning of 64,930.6 L of gasoline or combustion of 351.4 barrels of crude oil. It requires 34.3 acres of forest to absorb the emitted equivalent CO2.
Timely identification of PV system issues restrains from green energy loss and dependence on fossil fuel-based main grid. Future works include the practical verification of defects impact on PV system output and identification of PV panel defects and hotspots using machine-learning approaches through noninvasive image processing techniques.

Author Contributions

Conceptualization, J.A.S.; methodology, W.A.; software, W.A. validation, M.A.P.M.; investigation, J.A.S.; writing—original draft preparation, W.A.; writing—review and editing, M.A.P.M.; supervision, S.H.F.; and M.A.P.M.; project administration, S.H.F.; and M.A.P.M.; All authors have read and agreed to the published version of the manuscript.

Funding

This research received no external funding.

Institutional Review Board Statement

Not applicable.

Informed Consent Statement

Not applicable.

Data Availability Statement

The data presented in this study are available on request.

Conflicts of Interest

The authors declare no conflict of interest.

References

  1. Ahmed, W.; Sheikh, J.A.; Ahmad, S.; Farjana, S.H.; Mahmud, M.P. Impact of PV System Orientation Angle Accuracy on Greenhouse Gases Mitigation. Case Stud. Therm. Eng. 2021. [Google Scholar] [CrossRef]
  2. Ahmed, W.; Sheikh, J.A.; Kouzani, A.Z.; Mahmud, M.A. The Role of Single End-Users and Producers on GHG Mitigation in Pakistan—A Case Study. Sustainability 2020, 12, 8351. [Google Scholar] [CrossRef]
  3. Ali, M.U.; Khan, H.F.; Masud, M.; Kallu, K.D.; Zafar, A. A machine learning framework to identify the hotspot in photovoltaic module using infrared thermography. Sol. Energy 2020, 208, 643–651. [Google Scholar] [CrossRef]
  4. Energy Resources of Pakistan. Available online: http://ntdc.gov.pk/energy (accessed on 12 July 2021).
  5. Bdour, M.; Dalala, Z.; Al-Addous, M.; Radaideh, A.; Al-Sadi, A. A Comprehensive Evaluation on Types of Microcracks and Possible Effects on Power Degradation in Photovoltaic Solar Panels. Sustainability 2020, 12, 6416. [Google Scholar] [CrossRef]
  6. Ahmed, W.; Masood, M.T.; Ali, M.U. Influence of load-shedding and night on SiR insulator environmental aging under AC test voltages. SN Appl. Sci. 2021, 3, 190. [Google Scholar] [CrossRef]
  7. Madeti, S.R.; Singh, S.N. A comprehensive study on different types of faults and detection techniques for solar photovoltaic system. Sol. Energy 2017, 158, 161–185. [Google Scholar] [CrossRef]
  8. Niazi, K.; Khan, H.A.; Amir, F. Hot-spot reduction and shade loss minimization in crystalline-silicon solar panels. J. Renew. Sustain. Energy 2018, 10, 033506. [Google Scholar] [CrossRef]
  9. Bharadwaj, P.; Karnataki, K.; John, V. Formation of hotspots on healthy PV modules and their effect on output performance. In Proceedings of the 2018 IEEE 7th World Conference on Photovoltaic Energy Conversion (WCPEC) (A joint conference of 45th IEEE PVSC, 28th PVSEC & 34th EU PVSEC), Waikoloa, HI, USA, 10–15 June 2018; pp. 0676–0680. [Google Scholar]
  10. Ahsan, S.; Niazi, K.A.K.; Khan, H.A.; Yang, Y. Hotspots and performance evaluation of crystalline-silicon and thin-film photovoltaic modules. Microelectron. Reliab. 2018, 88, 1014–1018. [Google Scholar] [CrossRef]
  11. Olalla, C.; Hasan, M.; Deline, C.; Maksimović, D. Mitigation of hot-spots in photovoltaic systems using distributed power electronics. Energies 2018, 11, 726. [Google Scholar] [CrossRef] [Green Version]
  12. Dunderdale, C.; Brettenny, W.; Clohessy, C.; van Dyk, E.E. Photovoltaic defect classification through thermal infrared imaging using a machine learning approach. Prog. Photovolt. Res. Appl. 2020, 28, 177–188. [Google Scholar] [CrossRef]
  13. Jadin, M.S.; Zamridin, K.A.B.; Shah, A.S.M. Development of PV Module Hotspot Detector. In InECCE2019; Springer: Singapore, 2020; pp. 875–884. [Google Scholar]
  14. Dhimish, M.; Holmes, V.; Mather, P.; Sibley, M. Novel hot spot mitigation technique to enhance photovoltaic solar panels output power performance. Sol. Energy Mater. Sol. Cells 2018, 179, 72–79. [Google Scholar] [CrossRef] [Green Version]
  15. Pramana, P.A.A.; Dalimi, R. Hotspot Detection Method in Large Capacity Photovoltaic (PV) Farm. In IOP Conference Series: Materials Science and Engineering; No. 1; IOP Publishing: Purbalingga, Indonesia, 2020; p. 012019. [Google Scholar]
  16. Gallardo-Saavedra, S.; Hernández-Callejo, L.; Alonso-García, M.D.C.; Muñoz-Cruzado-Alba, J.; Ballestín-Fuertes, J. Infrared Thermography for the Detection and Characterization of Photovoltaic Defects: Comparison between Illumination and Dark Conditions. Sensors 2020, 20, 4395. [Google Scholar] [CrossRef]
  17. Niazi, K.A.K.; Akhtar, W.; Khan, H.A.; Yang, Y.; Athar, S. Hotspot diagnosis for solar photovoltaic modules using a Naive Bayes classifier. Sol. Energy 2019, 190, 34–43. [Google Scholar] [CrossRef]
  18. Tang, W.; Yang, Q.; Xiong, K.; Yan, W. Deep learning based automatic defect identification of photovoltaic module using electroluminescence images. Sol. Energy 2020, 201, 453–460. [Google Scholar] [CrossRef]
  19. Itako, K.; Hossam, B.; Kudoh, T.; Huang, Q. Development of real time hotspot detection system using scan-method for PV generation system. In Proceedings of the IECON 2015-41st Annual Conference of the IEEE Industrial Electronics Society, Yokohama, Japan, 9–12 November 2015; pp. 001032–001036. [Google Scholar]
  20. Review of Failures of Photovoltaic Modules. Available online: https://iea-pvps.org/wp-content/uploads/2020/01/IEA-PVPS_T13-01_2014_Review_of_Failures_of_Photovoltaic_Modules_Final.pdf (accessed on 12 July 2021).
  21. The Impacts of Climate Change on Human Health in the United States: A Scientific Assessment. Available online: https://health2016.globalchange.gov/ (accessed on 12 July 2021).
  22. Climate Impacts on Society. Available online: https://19january2017snapshot.epa.gov/climate-impacts/climate-impacts-society_.html#Overview (accessed on 12 July 2021).
  23. Otsu, N. A threshold selection method from gray-level histograms. IEEE Trans. Syst. Man Cybern. 1979, 9, 62–66. [Google Scholar] [CrossRef] [Green Version]
  24. RETScreen International. RETScreen Software Online User Manual; CANMET Energy Technology Centre: Varennes, QC, Canada, 2005; Available online: http://www.nrcan.gc.ca/energy/software-tools/7465 (accessed on 12 July 2021).
  25. Solar Panel Datasheet. Available online: https://www.canadiansolar.com/au/wp-content/uploads/sites/2/2020/05/Canadian_Solar-Datasheet-KuBlack_CS3K-MS_IEC1500V_v5.61_AU-1.pdf (accessed on 12 July 2021).
  26. Electric Power Transmission and Distribution Losses (% of output)—Pakistan. Available online: https://data.worldbank.org/indicator/EG.ELC.LOSS.ZS?end=2014&locations=PK&start=1971 (accessed on 12 July 2021).
Figure 1. Environmental stresses (hotspots/defects) on PV panels.
Sustainability 13 07793 g001
Figure 2. Defects covering PV panel surface (white defects, black healthy).
Sustainability 13 07793 g002
Figure 3. Proposed research approach.
Sustainability 13 07793 g003
Figure 4. 1 MW PV system energy loss due to 20% defective PV system.
Sustainability 13 07793 g004
Table 1. Geographical data of Islamabad.
Latitude33.62 N
Longitude73.1 E
Air temperature21.6 Celsius
Relative humidity62.0%
Precipitation30.52 inches
Annual average daily solar radiations4.02 kWh/m2/d
Atmospheric pressure91.1 kPa
Wind speed (10 m height)2.4 m/s
Earth temperature20.1 Celsius
Table 2. PV system technical data.
PV Panel (Pmax)300 Wp
Module efficiency18.05%
Operating voltages32.5 V
Operating current9.24 A
Output25 years, linear
PV System12 kWp
Inverter12 kW
Inverter efficiency99%
Table 3. PV system energy output in the presence of defects/hotspots.
Location33.62 N, 73.1 E
Orientation angles−34 tilt, 180 azimuths
Ambient air temperature per annum average21.6 Celsius
Defect/hotspot Concentration
PV output per month average (kWh)Daily Solar Radiations (kWh/m2/d)Healthy0.5%1%20%
January2.90981.310975.735970.159758.285
February4.111225.7321218.7681211.803947.157
March4.171334.8961327.3111319.7271031.510
April4.551357.4841349.7111342.0581048.965
May4.851447.0771438.8551430.6331118.196
June5.041430.1011421.9761413.8501105.078
July4.351295.8851288.5221281.1591001.366
August4.461342.2881334.6611327.0351037.222
September4.661380.1101372.2691364.4271066.449
October5.521743.6881733.7801723.8731347.395
November4.551449.6481441.4111433.1741120.182
December3.471169.6521163.0061156.361903.822
PV output per annum average (kWh)4.3816,157.87116,066.06515,974.25912,485.6278
System efficiency (%)-10099.4398.8677.27
Energy Loss (%)-00.571.1422.73
Common LossAging and very small layer of inert pollution
Table 4. PV system GHG mitigation otential with different defects/hotspots conditions.
Equivalent CasesGHG Reduction Potential (per Annum)
Healthy0.5% Loss1% Loss20% Loss
Annual GHG emissions reduction7.9774 t CO27.932 t CO27.8867 t CO26.1643 t CO2
Cars and light trucks not used1.46111.45281.44451.129
Litres of gasoline not consumed3427.64793408.17263388.69742648.637
Barrels of crude oil not consumed18.55218.446618.341214.3356
People reducing energy use by 20%7.97747.9327.88676.1643
Acres of forest absorbing carbon1.8131.80271.79241.401
Hectares of forest absorbing carbon0.73370.72950.72540.567
Tons of waste recycled2.75082.73522.71962.1256
Table 5. 1 MW PV system GHG mitigation potential loss due to 20% defective PV system.
Equivalent CasesGHG Reduction Potential (per Annum)
No Defect20% DefectiveDifference
Annual GHG emissions reduction664.9126 t CO2513.7961 t CO2151.1165 t CO2
Cars and light trucks not used121.778994.101927.677
Litres of gasoline not consumed285,694.4523220,763.89564,930.5573
Barrels of crude oil not consumed1546.30851194.8747351.4338
People reducing energy use by 20%664.9126513.7961151.1165
Acres of forest absorbing carbon151.1165116.771834.3447
Hectares of forest absorbing carbon61.154747.255913.8988
Tons of waste recycled229.2802177.171152.1091
Publisher’s Note: MDPI stays neutral with regard to jurisdictional claims in published maps and institutional affiliations.

