Article

Perspective Biomethane Potential and Its Utilization in the Transport Sector in the Current Situation of Latvia

24701 Water Research and Environmental Biotechnology Laboratory, Faculty of Civil Engineering, Riga Technical University, P. Valdena Street 1, LV-1048 Riga, Latvia
*
Author to whom correspondence should be addressed.
Sustainability 2021, 13(14), 7827; https://doi.org/10.3390/su13147827
Submission received: 15 June 2021 / Revised: 4 July 2021 / Accepted: 5 July 2021 / Published: 13 July 2021

Abstract

:
A major problem in the modern world is the overuse of fossil resources. The use of such resources and of that amount contribute negatively to the environment we live in. Fossil resources should be replaced with renewable ones. That way, less impact would be done to the environment. Renewable resources would greatly contribute to a healthy sustainable future. Latvia currently ranks seventh on the number of biogas plants per 1 million per capita (27) and is searching for new ways and opportunities to switch from the production of electricity to biomethane. Thus, in this study, a mathematical approach for the calculations of biomethane potentials and emissions of different feedstocks under the anaerobic digestion principle was studied. Databases were searched for the factual numbers of livestock animals, as well as processed sludge, and average food waste. RED II and JEC Well-To-Wheels report v5 were analyzed for data on emission factors and future obligations. Out of combined biomethane potentials of different feedstocks, livestock manure’s potential share was 91%, of which 61% is dairy cow manure. The overall biomethane potential in Latvia is 2.21 to 4.28 PJ. Replacing fossil fuels with biomethane in the transport sector could lower the overall CO2-eq emissions by 12.47–23.86% or 0.4–0.8 million tonnes.

1. Introduction

During the last few years in Europe, different studies have been focused on biomethane’s potential [1,2,3]. The utilization of a renewable fuel would greatly increase the well-being of the world due to lower emissions and natural resource depletion. Finland has been in front of European countries in the use of biomethane because of their legislation on renewable fuel use. They have found that waste is a valuable resource and can be transformed into secondary products for a great benefit. In 2019, researchers such as Rasi [2] and Pääkkönen [3] calculated the biomethane potential from different feedstocks and the main conclusion was that using such fuel would be economically and environmentally friendly to use.
Diesel oil is mainly made from fossil resources, and the use of such kinds of resources contributes to an increase in pollution. Renewable fuel replacing fossil fuel should be used to prevent this. One of such fuels is biogas. Biogas can be made by an anaerobic digestion process using organic waste as a source [4,5,6,7]. Different waste can be used for biogas production, such as industrial food waste, municipal waste, and manure from farm animals. Biogas produced from waste contains about 40–70% CH4 and needs to be upgraded to a CH4 content of >95% to be called biomethane. Biomethane is a renewable fuel that can completely replace fossil natural gas because of the similarities in its composition. By using renewable energy, greenhouse gas emissions can be reduced. Different biogas upgrading technologies will be mentioned in a further section. These technologies vary to be an effective use with different kinds of raw biogas compositions, each with their pros and cons [8].
This study aims to assess the biogas perspective and biomethane potential from livestock manure, wastewater sludge, and municipal organic food waste in Latvia. This study would be beneficial for Latvia because it assesses the biogas properties and utilization, as well as biomethane’s potential and the possible use of renewable fuel as a replacement for fossil fuel. The potential use of biomethane would help to achieve sustainability and renewability criteria in the following years.

1.1. Production Process

Most of the anaerobic digesters in Latvia operate in a mesophilic mode in the temperature range of 39 °C to 42 °C. The pH of the slurry fed into the digester is maintained between 6.5 and 7.5. The typical decomposing time (known as hydraulic retention time) of organic matter in the anaerobic digesters varies from 32 days to over 60 days in Latvia, depending on the organic matter concentration and the type of digester [9].
Some of the organic waste in the tank is more difficult to break down than others. Food waste, oils, fats, and lubricants are the most easily decomposable organic waste, while livestock waste tends to be the most difficult. Mixing several wastes in the same digester can help increase biogas yields.
Once captured, biogas can produce heat and electricity for engines, microturbines, and fuel cells. Biogas can also be upgraded to biomethane, known as renewable natural gas (RNG) or compressed biomethane (CBM), fed into natural gas pipelines or used as a vehicle fuel.

1.1.1. Biogas and Its Properties

Biogas is a gaseous fuel produced from biomass by fermentation under specific conditions in an oxygen-free environment. Depending on the technological process parameters, biogas contains 50–70% methane, which allows for the use of this gas as an energy source. Biogas is a renewable energy source [10]. In practice, specially designed and insulated tanks facilitate the anaerobic digestion process under a controllable atmosphere. These tanks are known as anaerobic digesters. The digesters’ waste after the completion of the digestion process is known as digestate. It has nutrient value and can be applied to land as fertilizer, and it has much less odor than stored manure [9].
Biogas quality can depend on the raw materials used, bioreactor design, temperature, hydraulic retention time, and many more parameters. The biogas energy content is purely dependent on methane content. The average calorific value of biogas is 21.5 MJ/m3, density—1.22 kg/m3 (with 60% methane content) [11].
When methane in biogas is burned producing heat, power, or cooling, carbon dioxide and water are formed. This water will be hot, exceeding 100 °C, and in the vapor phase. If the water vapor does not condense into a liquid, it will escape from the combined heat and power generator or boiler as a vapor with a lower heating value (LHV). More energy is captured when the water vapor is condensed into a liquid using a heat exchanger or economizer, as the energy in the water phase change from a vapor to a liquid is collected as the higher heating value (HHV) [12]. A comparison of the LHV and HHV values are shown in Table 1.
Stored biogas can provide a renewable, clean, and safe source of baseload energy instead of coal or natural gas. The baseload is continuously produced to meet the minimum energy requirements; renewable baseload capacity can complement more periodic renewable energy sources. Similar to natural gas made from fossil resources, biogas can also be used as a source of maximum energy that can be increased quickly. The use of stored biogas limits the amount of methane released into the atmosphere and reduces dependence on fossil fuels. Based on an assessment of well-to-wheels, compressed natural gas from biogas reduces greenhouse gas emissions by up to 91% compared to petrol [3,9].
In addition to the climate benefits, anaerobic digestion can reduce waste treatment costs and benefit the local economy. Anaerobic digestion also reduces pathogens, odors, and the risk of water contamination from livestock waste. Digestate, a material left over from the digestive process, can be used or sold as a fertilizer, reducing the need for chemical fertilizers. Digestate can also generate additional revenue if sold as livestock bedding or a soil modifier [14].
Digestate is a nutrient-rich solid or liquid material that remains after the digestive process; it contains all the processed nutrients in the original organic material but in a more easily accessible form for plants and soil formation (see Table 2).
The nutrient content and the composition of the digestate depend on the raw materials added to the bioreactor. Liquid digestate can be easily sprayed on farmland as a fertilizer, reducing the need for synthetic fertilizer. Digestate is obtained from natural sources, whereas synthetic fertilizers are manufactured in factories. Digestate is eco-friendly, whereas fertilizers harm the useful microbes present in the soil and also decrease soil fertility if used for a longer time [16].
In Europe, every tonne of mineral fertilizer produced emits an average of 9.7 tonnes of CO2-eq, and by replacing mineral fertilizers with organic ones, digestate can drastically reduce emissions in Europe’s energy-intensive agricultural sector [17].
Solid digestate can be composted or used as livestock bedding. Recently, the biogas industry has developed a digestate certification scheme to ensure digestate safety and quality control. It is estimated that around 6 million tonnes of chemical phosphate fertilizers are imported and used in Europe every year, and with proper management, 30% can be replaced with renewable organic fertilizer made from digestate [18,19].
Plant residues may include stalks, straw, and plant cuttings, and also green mass from park management, such as leaves and grass. Some are feasible, so are left in the field to maintain soil organic matter, moisture, and all erosion. However, higher crop yields have increased in the form of waste, and part of its removal can be sustainable. Sustainable results vary depending on the green mass, soil type, and climatic factors. Plant residues are usually digested together with other organic wastes, as they are challenging to break down due to their high lignin content.
Landfills are the third-largest source of anthropogenic methane emissions. Landfills contain the same bacteria as the fermenter that degrade organic materials to produce biogas. As the solid municipal waste deposited in landfills is rich with organic matter [4], a better idea of allowing landfill gas (LFG) to escape into the atmosphere and produce GHG emissions, is to be collected and used as energy. In large biogas landfill stations, electricity and heat can also be produced by using biogas as fuel. In Latvia, there are currently five biogas landfill stations: SIA “Getliņi EKO”, “Liepājas RAS”, “Rekonstrukcija un investīcijas”, “ZAAO enerģija”, and SIA “Brakšķu Enerģija” with installed capacities of 6.28 MWh, 1.05 MWh, 0.815 MWh, 0.35 MWh, and 0.16 MWh, respectively, for a total of 8655 MWh [20]. For this study, only the biomethane potential of livestock manure, wastewater sludge, and municipal food waste was calculated.

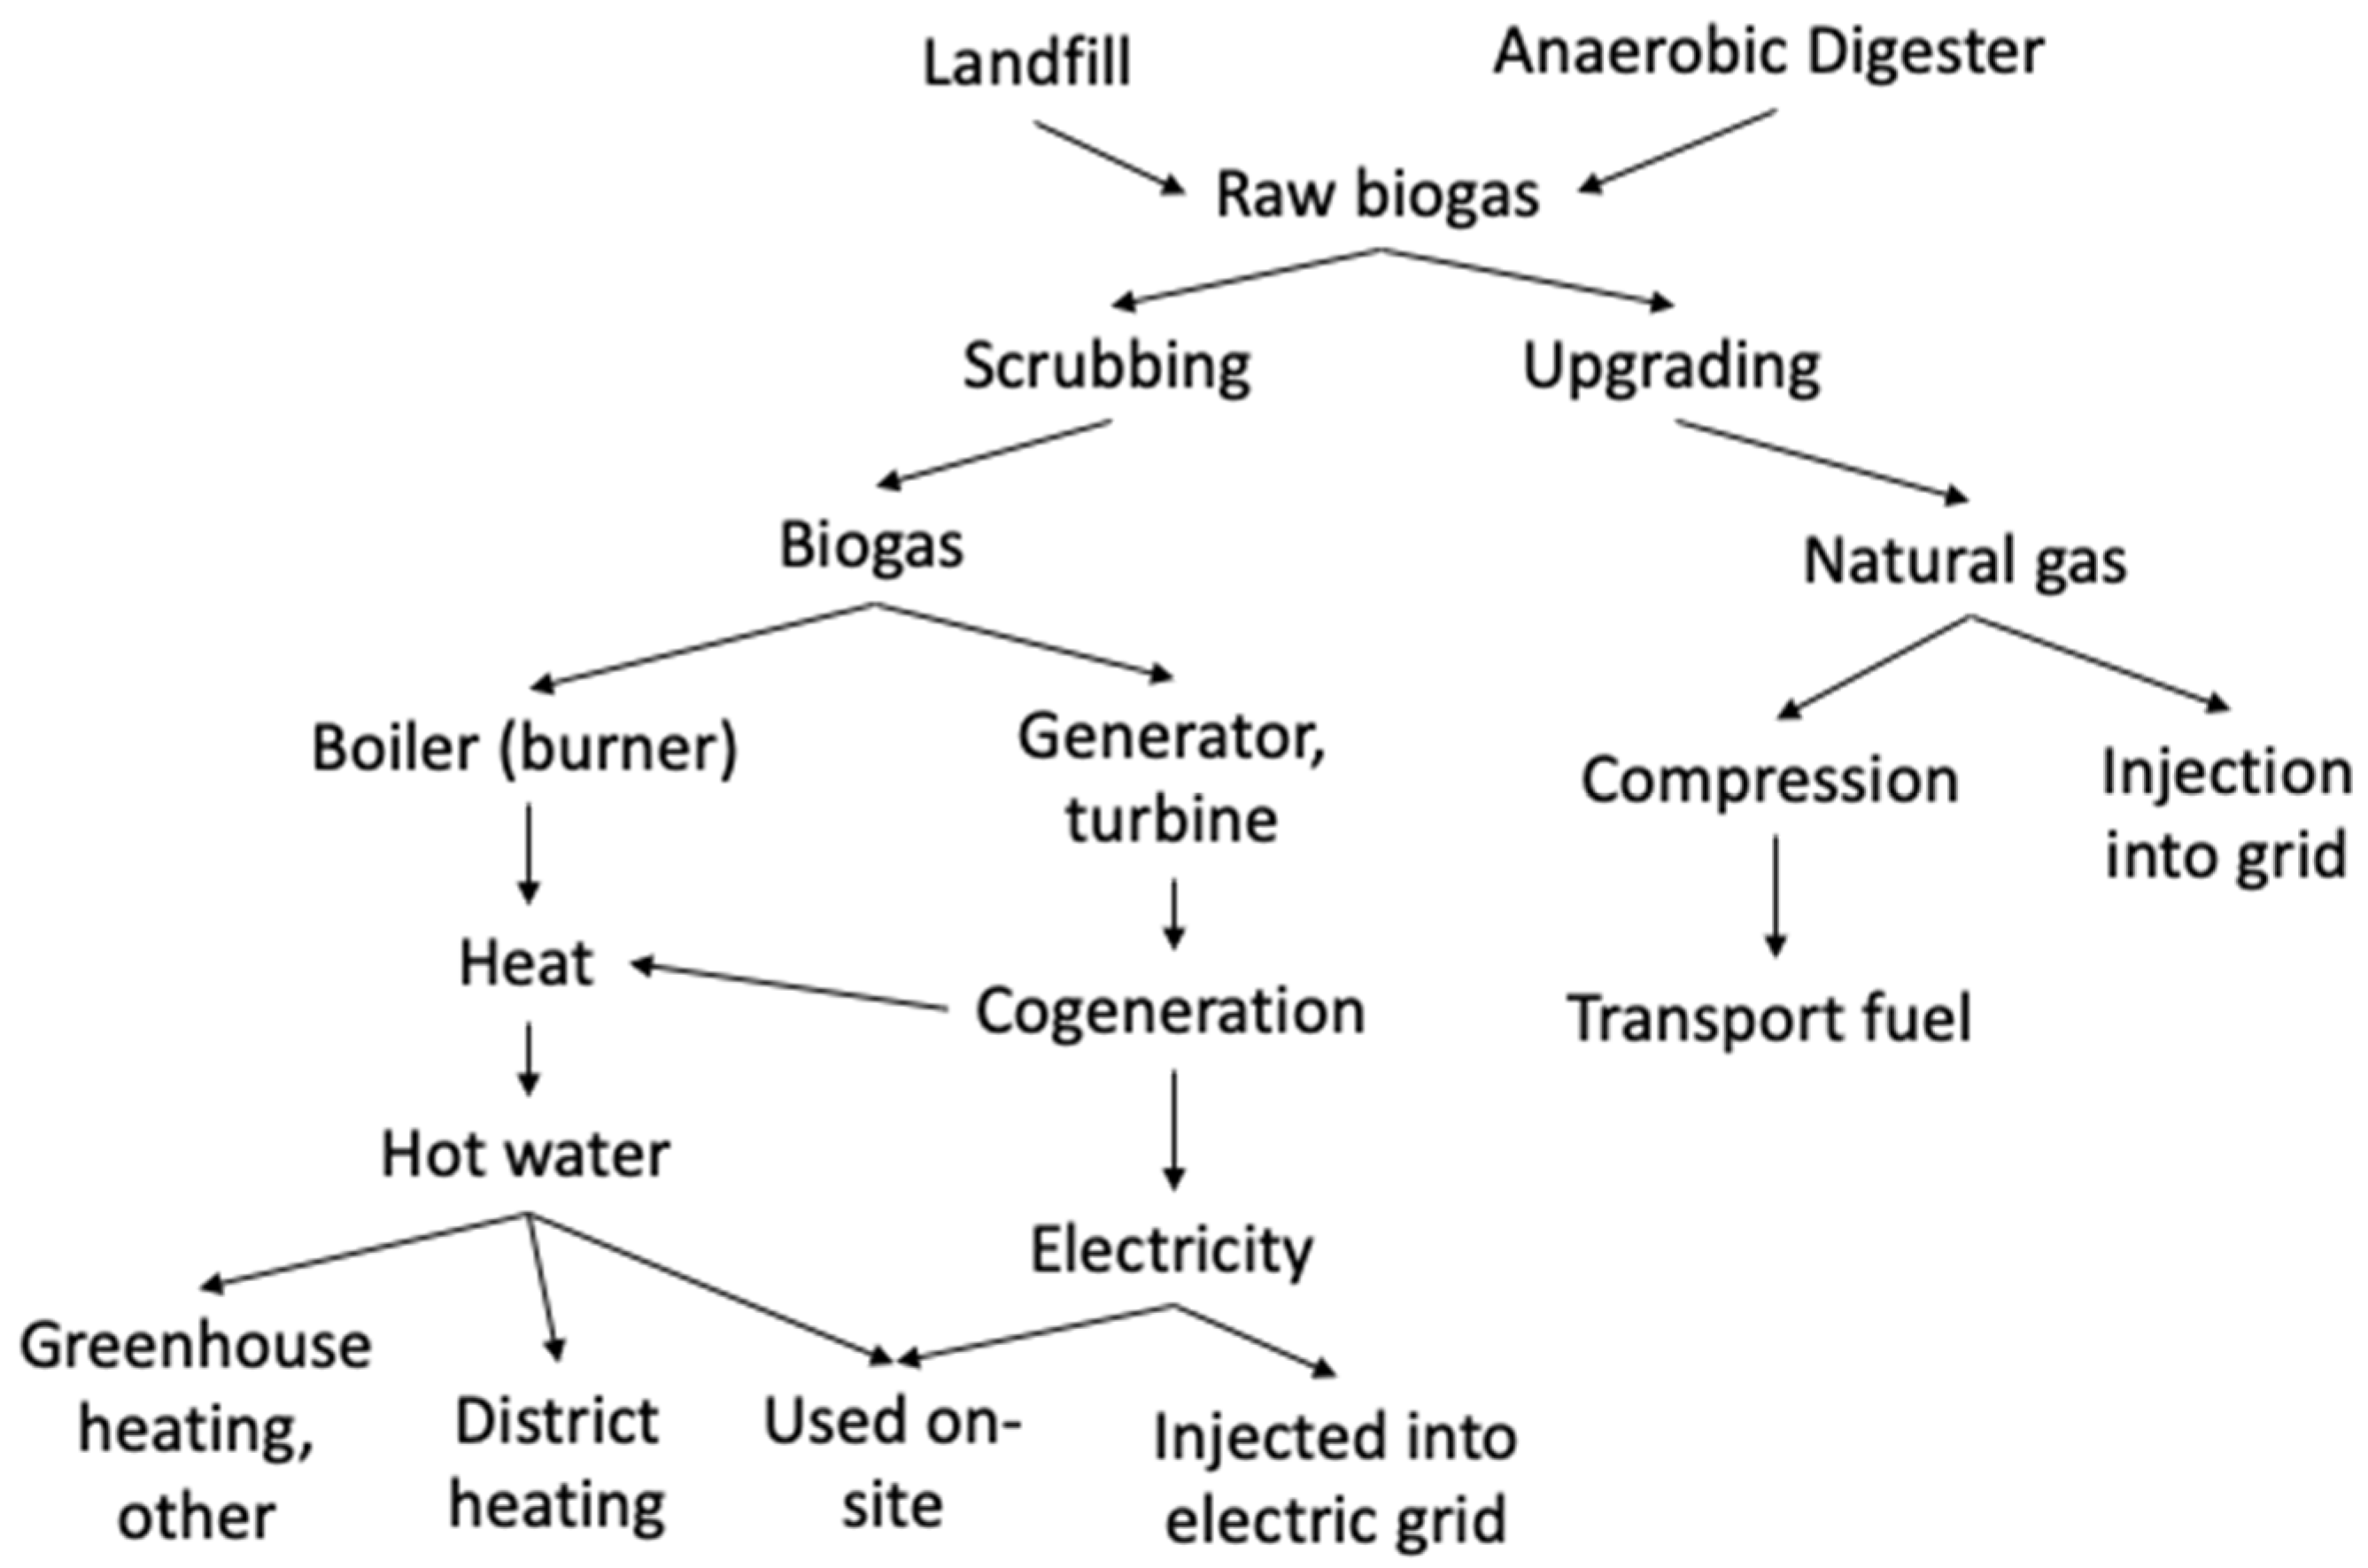
1.1.2. Biogas Utilization

Biogas from the anaerobic digester has traces of unwanted gases, such as water vapor, hydrogen sulfide (H2S), hydrogen, nitrogen, and oxygen. Among these trace gases, water vapor and H2S gas require removal before the biogas is used to produce energy.
The water vapor trace is removed as condensate when warm biogas cools in the condenser. Typically, a gas scrubber is used to remove H2S. The H2S content in biogas must be less than 7 g/m3 before injection into the natural gas grid in Latvia, according to Regulations of the Cabinet of Ministers No. 650, to ensure good equipment performance and the quality of biogas [9,21].
With a minimum biogas processing (see Figure 1), it can be burned on-site to heat buildings and boilers or even the digester. Biogas can be utilized for combined heat and power (CHP) production or can simply be processed into electricity using a fuel cell, combustion engine, or gas turbine. The resulting electricity is sold onto the electric grid or used on-site [14].

1.2. Production Costs

Biogas plant investment payback is usually 5 to 20 years. The total costs of biogas treatment and improvement are obtained by summing the investment costs, plant operation, and equipment maintenance costs. When biogas is produced for use in vehicles or on the grid, the most expensive part of the treatment is the price of biogas itself, and the second most expensive part is cleaning the biogas from carbon dioxide.
The cost of a plant to upgrade biogas to vehicle fuel quality depends on several factors. The main factor is the size of the station. Investment costs increase as capacity increases, but investment per unit of installed capacity for larger stations is lower than for smaller stations. A biogas upgrade plant working with 1000 m3 of biogas an hour costs between EUR 1.0 and 2.1 million [22]. From these 1000 m3 of biogas (CH4~55%), based on the process efficiency, 576–865 m3 of biomethane (CH4 >97%) can be produced. If the plant is sophisticated, then CO2 recovery is also a plausible income source as well as CH4 production [22,23].
Finding a suitable location for the installation of a biogas plant is one of the most important aspects of its development. The considerations to evaluate before deciding the next station site are listed below [11]:
  • To avoid inconveniences, nuisances, and disputes linked to odors and increased traffic to and from the biogas plant, the site must be located at a suitable distance from populated areas.
  • The direction of the prevailing winds must be taken into account to avoid wind-borne odors reaching populated areas.
  • The area must have easy access to infrastructure, such as the electricity grid, to facilitate the sale of electricity, and transport routes to facilitate the transportation of raw materials and recycled digestate.
  • Before starting construction, the soil of the area must be examined.
  • The potential area must not be located in flood-affected areas.
  • The area must be relatively close (centrally located) to agricultural raw materials (manure, slurry, energy crops) to reduce the transportation of raw materials distances, time, and costs.
  • Due to cost efficiency, the biogas plant should be located as close as possible to the potential heat consumers. Alternatively, other potential heat consumers may be transferred, such as plants, greenhouses, etc., closer to the biogas plant site.
  • The size of the site must be sufficient for the activities carried out and the amount of biomass supplied.

1.3. Biomethane Production

As for the other way of biogas processing, biogas can be upgraded to biomethane by the means of removing carbon dioxide, water vapor, H2S, and other trace elements needed to ensure biomethane quality. Biogas methane concentration is increased from 50–75% to above 95%. Upgraded biomethane can be fed into the existing natural gas grid and used as a substitute for natural gas or compressed and used as a transport fuel.
To use biogas as fuel, its calorific value is increased by the carbon dioxide removal, and by removing it, a small part of methane is also lost due to methane slip, which can be 0–2% based on the technology used [22]. Biogas can be upgraded with different technologies, the most common are compiled in Figure 2, from which it can be seen that membrane separation, water scrubbing, and chemical scrubbing are the most commonly used technologies, and in 2019, their share was 74% of all the used technologies in Europe. The produced CO2 can be used as an energy carrier for hydrogen. Through the electrolysis process, electricity (ideally solar or wind power) can be used to obtain hydrogen and oxygen. Hydrogen can be used as a reagent for upgraded biomethane waste CO2 to produce methane. This process is called power-to-gas, and it is a great way to increase methane amount from the waste CO2. [24,25].

1.3.1. Biomethane as a Transport Fuel

The upgraded biogas (biomethane) is transported to the filling stations via public gas pipelines, to fulfill the requirements, it needs to be compressed to the pipeline operating pressure. Alternatively, biomethane can be transported by trucks in high-pressure gas cylinders (200–250 bar) or directly used at a filling station at the location of the biomethane production plant.
To be delivered by trucks, biomethane must meet particular quality requirements for methane content and water dew point, as the methane number must be at least 65 and water dew point −10 °C; −20 °C, and −30 °C for classes A; B, and C at 20 MPa, respectively [27]. Transporting biomethane via road incurs additional transportation and capital equipment costs, as well as most likely, additional compression expenses at the filling station.
Biomethane can be provided and utilized as a liquid fuel (LBM or bio-LNG) in addition to compressed biomethane (CBM). Because the energy density is substantially higher, longer distances may be covered with the same fuel storage capacity. This is a very interesting alternative for heavy-duty transportation on highways or by ships. There aren’t many other renewable fuel options for heavy-duty transportation. This appears to be a promising future alternative. Liquefying biomethane (or natural gas) is, however, a costly and energy-intensive operation [28].
For use of biomethane as fuel in the transport sector, guarantees of origin (GoO) are needed for the proof of renewability of the gas [29], in many European countries such systems have been developed and are in use, but Latvia falls behind in the development of such system.

1.3.2. Biomethane Injection in the Natural Gas Grid

For biomethane injection and transport in the public gas distribution system, many countries have established regulations, which, for example, define gas quality requirements as well as responsibilities for the planning, building, financing, and operating of the grid injection unit. Concerning gas quality, biomethane must usually reach natural gas specifications and fulfill threshold values regarding biogas-specific trace compounds [28]. Upgraded biogas (biomethane) can be injected and distributed into the natural gas network after it has been compressed to the required pressure in the pipelines. Under EU regulations, all biogas suppliers are guaranteed access to the gas network (Guidelines for opening the gas network to biogas and gas from biomass (European Parliament, 2001)) [11].
There are several advantages to using a natural gas network for biomethane distribution. One important advantage is that the network connects the biomethane production site, which is usually located in rural areas, to more densely populated areas. This allows gas to be used by new customers. In this way, it is also possible to increase biogas production in remote areas without having to worry about the use of residual heat [11]. The high cost of upgrading and injecting biomethane into the grid is the main obstacle to biomethane injection. The location of the biomethane plant and upgrading site used, which must be near the natural gas grid, limits injection into the grid.
Standards (certification systems) for injecting biogas into the natural gas network exist in countries such as Sweden, Switzerland, Germany, and France. To avoid contamination of the gas network or end-user equipment, standards for quantifying components such as sulfur, oxygen, particulate matter, and water dew point have been established. The Wobbe index has been introduced to avoid impacts on gas measurements and end-uses. Compliance with the standards is in most cases easy to achieve through improvement measures. In some cases, landfill gas can be difficult to upgrade to the required quality due to its high nitrogen content.
Latvia has not yet achieved that level of renewable energy usage, but it is on its way as, in 2016, the Cabinet of Ministers released regulation No. 650 “Requirements for the injection and transportation of biomethane and gaseous liquefied natural gas in the natural gas transmission and distribution system” that defines biomethane quality parameters that are needed for qualitative injection or transportation of this fuel [21].

2. Materials, Methods, and Assumptions

2.1. Biomethane Potential Calculations and Assumptions

Table 3 summarizes the data for biogas production from different feedstock materials. As it can be seen, the greatest values are from pig and poultry manure processing. Although that is the case, it should be noted that dairy cows produce much more manure and for the potential calculations, dairy cow manure was counted as beef manure and accounted for 60% of potentially processable manure.

2.1.1. Livestock Manure Potential

Biomethane potential was calculated based on the currently available data. Farm animal (dairy cow, pig, poultry) quantity was multiplied by the produced manure yield in tons per year (Equation (1)). From that, we obtained the total animal manure yield of all mentioned farm animals in tons per year. The yield of total animal manure was multiplied with solid content (Equation (2)), and the yield of total solid manure was obtained. Using [30], we assessed the minimum and maximum biogas yield from the manure total solid content (Equation (3)) as follows:
Y t m = Y m × N
where:
Y t m —Manure yield of total animals, t/year;
Y m —Manure yield of 1 animal, t/year;
N—Animal quantity.
Y s = Y t m × S 100
where:
Y s —Total solid manure yield, t/year
Y t m —Manure yield of total animals, t/year
S—Total solid content, %.
Y t b = Y s × Y b × 10 3
where:
Y t b —Total biogas yield, m3
Y s   —Total solid manure yield, t/year
Y b   —biogas yield potential, m3/kg organic solid
From the biogas yield, a biomethane yield can be calculated using Equation (4), and from the possible biomethane yield, and using Equation (4) the biomethane potential can be calculated as follows:
Y C H 4 = Y t b × M B M C H 4
where:
Y C H 4 —Total biomethane yield, m3
M B —CH4 content in biogas (this case—0.60)
M C H 4 —CH4 content in biomethane (this case—0.97)
P C H 4 = Y C H 4 × E C H 4 10 6
where:
P C H 4 —Biomethane potential, GWh
Y C H 4   —Total biomethane yield, m3
E C H 4 —Energy content of biomethane, kWh/m3

2.1.2. Wastewater Sludge Potential

Wastewater sludge biomethane potential was calculated using the data from the largest Latvia cities: Ventspils, Daugavpils, Rezekne, Jelgava, Valmiera, and the capital—Riga. Knowing the dry sludge amount that these six cities produce, assumptive calculations were made to find wastewater sludge biomethane potential. Formulae were adapted from the livestock manure potential Equations (1)–(3) to specify wastewater sludge potential. The dry sludge amount was multiplied by the potential biogas yield from wastewater sludge in an interval of minimum biogas to maximum biogas yield. Knowing the biogas yield, the biomethane yield and the potential can be calculated using Equations (4) and (5).

2.1.3. Municipal Organic Food Waste Potential

Based on Europe’s and Latvia’s data about food waste, biomethane’s potential was calculated. The average food waste amount per person was analyzed to find out how much food waste could be avoided. Avoidable food waste amount was then multiplied with the population of Latvia to find out the total avoidable food waste amount (Equation (6)). From the avoidable food waste, biogas yield can be calculated using Equation (7) Knowing the biogas yield, and using Equations (4) and (5), biomethane yield and potential can be calculated.
W T F = P L × W A F 10 3
where:
W T F —Total food waste, tonnes;
P L —Population in Latvia;
W A F —Avoidable food waste amount, kg/person.
Y t b = W T F × Y F
where:
Y t b —Total biogas yield, m3;
W T F   —Total food waste, tonnes;
Y b —biogas yield potential from food, m3/tonne.

2.2. Emission Calculations and Assumptions

Emissions for different waste groups were calculated based on the calculated biomethane potentials. Emission factors from JEC Well-To-Wheels report v5 [31] were used. Biomethane potential was multiplied by the emission factor for compressed biomethane from different feedstocks to obtain the potential emissions that are produced using renewable biomethane. For comparison emissions from using fossil fuels were calculated using Equation (9).
Total GHG emissions for production and distribution for CBM vary from the feedstock. By using municipal waste as feedstock, GHG emissions for WtT analyses are 9.5 gCO2-eq/MJ, but using closed stored liquid manure, a staggering amount of −102.9 g CO2-eq/MJ could be achieved [31]. By using sewage sludge as the feedstock, GHG emissions are 22.3 gCO2-eq/MJ, although this is biogas as CNG; if it were upgraded to remove CO2, this value would be lower. For calculations, a fossil comparator of 94 gCO2-eq/MJ was used:
E w = P C H 4 × e w × 10 3
where:
E l m —Potential waste emissions, tonnes CO2-eq;
P C H 4   —Biomethane potential, PJ;
e w —emission factor for compressed biomethane made from different feedstocks [31].
E f c = P C H 4 × e f c × 10 3
where:
E f c —Fossil fuel emissions, tonnes CO2-eq;
P C H 4   —Biomethane potential, PJ;
e f c —emission factor for fossil fuel comparator, gCO2-eq/MJ.
To compare the potential benefit of the emissions, the emission factor for avoidable emissions was calculated using Equation (11). The fossil fuel comparator emission factor is subtracted from renewable fuel emission factor to obtain the avoidable emission factor. The avoidable emission factor is then multiplied by the biomethane potential of the selected waste group and 10 3 to obtain the avoidable emissions in tonnes of CO2-eq (Equation (11)). Emission savings were calculated based on Equation (12):
E a = P C H 4 × e a × 10 3
where:
E a —Avoidable emissions, tonnes CO2-eq;
P C H 4   —Biomethane potential, PJ;
e a —emission factor for avoidable emissions, gCO2-eq/MJ.
e a = e w e f c
where:
e a —emission factor for avoidable emissions, gCO2-eq/MJ;
e w —emission factor for compressed biomethane made from different feedstocks [31], gCO2-eq/MJ;
e f c —emission factor for fossil fuel comparator, gCO2-eq/MJ.
e a = e l m e f c e f c × 100
where:
e s —emission savings, %;
e l m —emission factor for compressed biomethane made from livestock manure [31], gCO2-eq/MJ;
e f c —emission factor for fossil fuel comparator, gCO2-eq/MJ.

3. Results and Discussion

3.1. Biomethane Potential

3.1.1. Livestock Manure Potential

Fuel is an essential part of human development, but now a lot of fuel is made from fossil resources, and the use of such fuel harms the environment. To avoid these environmental problems, a sustainable source of renewable fuel should be examined, one of such ways is to process farm animal manure, as it contains all the necessary ingredients for a renewable fuel—biogas and valuable fertilizer digestate. In Latvia, in 2021, there are more than 136 thousand dairy cows, 300 thousand pigs, and over 5.5 million poultry [32]. One dairy cow in a year produces 21 tonnes of manure, one pig produces 2.5 tonnes, and poultry produce roughly 100 kg per bird [33]. All these animals combined produce around 3.8 million tonnes of manure each year.
Anaerobic digestion can reduce odors, greenhouse gas emissions, and reduce more than 90 percent of manure pathogens. In Latvia, there are 42 agricultural biogas stations of a total of 55 [20], which use livestock waste in their anaerobic digestion process, but all of them can use livestock waste as a feedstock to some degree. The overall capacity of all the stations is 64.05 MWh, which translates to 853 GWh or 3.07 PJ of biogas energy in a year. Figure 3 illustrates the typical agricultural biogas station with a cogeneration unit. These stations are the main type of biogas stations used. Cogeneration units can be replaced with an upgrading facility to produce biomethane. Only one biogas station in Latvia partially produces biomethane with 0.25 MWh capacity, while others produce electricity and heat.
Table 4 comprises the assumptive biomethane potential calculations of dairy cow, poultry, and pig manure. From the table, it can be assessed that the biggest share, from 56 to 113 million m3 of biogas (61%) is dairy cow manure potential, second being poultry manure potential (22%), and lastly, pig manure potential. The overall possible biogas yield is estimated to be from 94 to 182 million m3 of biogas with a methane content of 60%, and from that biomethane from 58 to 112 million m3 (CH4—97%). The calculated biomethane potential is 559–1 084 GWh or 2.012 to 3.902 PJ.

3.1.2. Wastewater Sludge Potential

Anaerobic fermentation is widely used to treat primary and secondary sludge generated by the anaerobic treatment of domestic wastewater. The system in combination with modern domestic wastewater treatment systems is used in many developed countries. The anaerobic fermentation process is used to stabilize and reduce the final amount of sludge.
Anaerobic fermentation technology for the treatment of sewage sludge has become well established. Many manufacturing companies can also provide an anaerobic fermentation system by providing wastewater treatment facilities. In European countries, depending on the regulatory framework and priorities, about 30 to 70% of sewage sludge is usually treated by anaerobic fermentation [11]. In Latvia, four biogas plants are cooperating with WWTP.
The recycled substrate is used as fertilizer for agricultural land or energy recovery by incineration. In some countries, it is also landfilled, but this practice harms the environment due to the potential for nutrient leakage into the soil and emissions into the atmosphere, so it is banned in most European countries [11].
In 2016, there were 74 agglomerations in Latvia with a population equivalent of more than 2000 and where the generated wastewater must be treated to the concentrations of pollutants, total nitrogen, and total phosphorus specified in Directive 91/271/EEC and Cabinet Regulation No. 34. Gradually, from year to year, by modernizing wastewater management infrastructure and increasing the availability of centralized sewerage services, pollution discharged into the environment (mainly residual phosphorus and nitrogen pollution discharged) is reduced, resulting in improved water quality of surface water bodies.
Riga treatment plants have a very large impact on the total Latvian wastewater load in the environment, as they are the largest treatment plants in the country. In 2016, the total amount of wastewater discharged in Riga was 55.43 million m3, which is 27% of the total volume discharged into the Latvian environment [34].
From the 19 thousand tonnes of dry sludge, a biogas yield of 3.8 to 11.5 million m3 can be produced (see Table 5), from which 2.3 to 6.9 million m3 of biomethane with a methane content of 97% can be produced. Calculated biomethane yield on average translates to 47.76 GWh or 0.172 PJ of energy.

3.1.3. Municipal Organic Food Waste Potential

Waste is generated for any action a human will make, and it is our job to reduce this waste. To do so, we, as people, should pay more attention to the waste we make and the options of reducing it (see Figure 4). In Latvia, waste recycling and prevention is not that common. In 2019, from 439 kg per capita of municipal waste generated, a staggering 252 kg per capita was landfilled [35]. Comparing 2005 and 2019, the municipal waste generated in Latvia has increased by 119 kg per capita [36]. Comparing other European countries, a variation from 280 kg per capita in Romania to 844 kg per capita in Denmark of municipal waste was generated [36]. In 2004, methodologies were finalized in many of the European countries, so the waste generation time series of 2005 and later are more accurate for suitable comparison with newer data.
On average, from all municipal waste, about 173 kg per capita is food waste. Food waste by definition means food that is intended for human consumption, edible or inedible parts of it removed from the supply or production chain, including waste from spheres such as primary production, manufacturing, processing, transportation, retail, and storage [38]. On average, about a third of all food produced is wasted, and that is alarming because it is a resource we just throw away to rot in landfills [38]. In the last few years, the biodegradable waste stream in municipal waste is around 40–50% [38], but the landfilled waste has not been reduced. The fact that landfills keep increasing their waste volume means there is a significant waste management problem. This problem is more common in eastern and southeastern areas of the EU [5]. From 439 kg of waste generated, about 92 kg is food waste from households, and from that, about 17% is liquid waste going to sewers. This means that around 76.6 kg of solid food waste is generated in a year per person, in Europe [38]. From 76.6 kg, around 7.4 kg are home composted, and 69.2 kg are left as municipal food waste. It has been calculated that around 30% or 20 kg of food waste per year could be avoided with proper waste management [38].
The population in Latvia in 2019 was 1.907 million people, and the average food waste per person was 173 kg [39]; from that, 92 kg is household food waste, of which, 25.4 kg is avoidable waste that can be processed for secondary benefit. That sums up to almost 50 thousand tonnes of food waste each year (Equation (6)). Comparing different studies, a biogas potential of 110 m3 per tonne of fresh food waste [7,39,40,41] was obtained and used to calculate biogas yield (Equation (7)). Using Equations (3)–(5), a calculation can be made based on the fact that if Latvia processed avoidable food waste, it would result in around 5.3 million m3 of biogas or 2.2 million m3 of biomethane each year (see Table 6). To put it in an energy perspective, 31.46 GWh or 0.113 PJ of energy could be produced each year.

3.1.4. Overall Biomethane Potential

By assessing the waste groups separately, we can obtain a clearer picture of the potential here in Latvia and Table 7 comprises a calculation summary of the overall biomethane potential. By adding up all the three groups of waste, a biomethane potential of 2.21–4.28 PJ can be achieved if all the waste was processed into biomethane. A big share of the overall potential comes from processing livestock manure, 91% to be exact. That means that wastewater sludge and municipal organic food waste processing would not be that effective, giving only 0.079–0.265 and 0.113 PJ of energy, respectively, but the rising costs of landfills and control of GHG emissions would make this process effective and needed for a sustainable future. Although 0.113 PJ sounds quite low compared to livestock manure potential, to put in perspective, it is equivalent to 3070 m3 of diesel fuel and is enough energy to supply electricity for 8 880 households for a year [42].

3.2. Emissions

Along with odor, surface water, and groundwater contamination are significant concerns in expanding the livestock industry. According to most suppliers, anaerobic digesters can reduce odor from livestock facilities by 80% [9].
The introduction of anaerobic digester technology on farms improves manure management and reduces the risk of ground or surface water contamination due to leakage of pathogens and nutrients. Several studies [43,44,45] have shown that this process significantly reduces harmful pathogens and reduces greenhouse gas emissions.
Renewable energy sources produce electricity or heat without depleting the natural resources. Greenhouse gas emissions are being blamed for accelerating climate change around the world. The reduction of greenhouse gas emissions and the use of renewable energy are recommended worldwide [9].

3.2.1. Livestock Manure Emissions

Manure not only produces methane during decomposition but can also contribute to nutrient surpluses in waterways. Part of the manure is used as fertilizers, but the problem here is that on a sunny day, when manure is spread on the field, it evaporates, causing ammonium to evaporate into the atmosphere. Another problem is the storage of manure. If they are stored in open-air storage, evaporation can cause issues, as one dairy cow in a year produces around 70 kg of nitrogen from its manure, out of which 0.07 to 1.4 kg are emitted from its storage, causing greenhouse gas emissions to rise. In addition, the nutrient surpluses can get into the groundwaters, which is also not good for the environment [46]. In 2016, in Latvia, the total ammonium emissions were 16.25 thousand tonnes, out of which 86%, or 13.97 thousand tonnes, were from agriculture. Out of the total agricultural ammonium emissions, 51% were from the use of mineral and organic fertilizers and 49% were from manure management [47,48]. In 2018, manure management accounted for 73% of the total ammonium emissions [49].
Based on the processes used and management, a cow can produce from 8 to 12 tonnes of CO2-eq emissions in one year. That means that a large farm consisting of 1000 cows will produce around 8 to 12 thousand tonnes of CO2-eq emissions every year [50]. Part of this can be avoided if manure is used to produce biogas.
Livestock manure is the most promising feedstock for the production of biomethane because of its great emission savings. As mentioned, if manure is used as feedstock, GHG emissions are in the negatives, −102.9 g CO2-eq/MJ to be exact. In Latvia, the biomethane potential of manure is 2.013 to 3.902 PJ. If all of this energy would be used in the transport sector as a replacement for diesel fuel, 396 to 768 thousand tonnes of CO2-eq emissions could be avoided.

3.2.2. Wastewater Sludge Emissions

A similar situation is with sewage sludge biomethane. If all the sewage sludge would be processed and used as a transport fuel, emissions would be 1.7–5.9 thousand tonnes of CO2-eq, but if it were diesel, it would be 7.4–24.9 thousand tonnes of CO2-eq. By replacing the diesel fuel with biomethane from sewage sludge, 5.6 to 19.0 thousand tonnes of CO2-eq emissions could be avoided.

3.2.3. Municipal Organic Food Waste Emissions

Based on the previously mentioned data (Section 3.1.3) about the biomethane potential of municipal waste, we can assess emissions that using such fuel would produce. The potential of 0.1133 PJ is converted in MJ and multiplied by the corresponding emission factor. If all the biomethane would be used, emissions would only be 1.1 thousand tonnes of CO2eq, comparing them to 10.6 thousand tonnes of CO2-eq emissions that diesel would produce for the same energy quantity. That is roughly 10 times lower emissions and would benefit the country environmentally and economically by 9.6 thousand tonnes of CO2-eq emissions.

3.2.4. Overall Emissions

As mentioned in Section 3.1 in Latvia, there are 55 biogas stations with an overall capacity of 64.05 MWh and the potential of 853 GWh or 3.07 PJ. If all the currently produced biogas would be used replacing diesel fuel in transport sector an avoidance of 0.6 million tonnes of CO2-eq emissions could be achieved.
In 2019, Latvia produced over 5.1 million tonnes of transport fuel emissions, of which 65% or 3.3 million tonnes were from using diesel as a fuel [51]. If all the mentioned biomethane potential would be used in the transport sector replacing diesel fuel, an avoidance of 0.6 million tonnes of CO2-eq emissions could be achieved (see Table 8). Negative numbers in the table show avoidance regarding emissions. This avoidance would lower total transport emissions by 11.7% or 18.2% if replacing diesel. This and the fact that the European Commission sets laws that make it an obligation of using renewable fuel is a great motivation and a start of more sustainable fuel production and the reduction of environmental pollutants. Renewable energy directive II has set values that have to be achieved with regard to advanced biofuel incorporation in the existing market, and these shares have to be 0.2% in 2022, at least 1% in 2025, and at least 3.5% in 2030. Values to achieve for advanced biofuels will help in the development of a sustainable future with renewable fuels.
The majority of the biogas stations in Latvia already use manure as primary feedstock, but not all. Livestock manure potential alone could exceed the current maximum capacity of the biogas stations. By combining the current situation in the biogas sector with the biomethane potential, an avoidance of up to 0.77 million tonnes of CO2-eq emissions could be achieved, if all the biomethane, made from 100% livestock manure, would be used in the transport sector replacing fossil fuel.
Currently, in Latvia, there are over 93 thousand trucks (>3500 kg), 744 thousand cars, and 3922 buses. Almost all of the trucks and buses in Latvia run on diesel fuel (95.4 and 99.1%, respectively) [52]. All these vehicles produce over 2.4 million tonnes of CO2-eq emissions, and for a sustainable future, we have to reduce these amounts. To do so, fossil fuel needs to be replaced with renewable fuel. The easiest fuel to integrate is biomethane as it is sustainable and is produced locally in the country.
On average, 19.2% of the overall transport emissions are produced by heavy-duty trucks and buses, 8.7% from light-duty trucks (see Table 9). By using biomethane instead of fossil fuel, all light-duty trucks and 48.4% of heavy-duty truck and bus emissions could be replaced by the calculated biomethane potential. In a different scenario, if biomethane would be used only for heavy-duty trucks and buses, 93.7% of fossil emissions could be replaced with renewables.

4. Conclusions

Biogas systems turn waste management costs into an income opportunity for farms and dairies. The conversion of waste into electricity, heat, or vehicle fuel provides a renewable energy source that can reduce greenhouse gas emissions, improve the environment’s quality, increase local jobs, and reduce dependence on foreign oil imports. Biogas systems also make it possible to process nutrients into the food supply, reducing the need for petrochemicals and fertilizers.
This study does not address the possibilities of lignocellulose biomass processing, although, in Latvia, it would be more effective than sewage sludge and food waste processing as Latvia has a large forestry industry.
Biogas production systems are a waste management solution that solves several problems and brings many benefits. However, to achieve its full potential, the industry must be supported by consistent policies. Reliable programs and tax reliefs should be incorporated in the national law to encourage more investments and innovations in the biogas sector. If Latvia is to diversify its fuel supply, it must carefully consider the many benefits of biogas.
From this study few conclusions should be highlighted:
  • Total biomethane potential from processing livestock manure, wastewater sludge, and municipal organic food waste in Latvia is 2.21 to 4.28 PJ.
  • 91% of biomethane potential comes from processing livestock manure, out of which ~61% share is from processing dairy cow manure. Emission savings from using livestock manure as feedstock for biomethane production is calculated to be 209%.
  • If all the biomethane potential would be used in the transport sector, potentially 4.07–7.88% of total energy could be replaced, and total transport emissions would be with renewable biomethane. Total transport emissions would be 8.06–15.43% less.
  • If diesel fuel would be replaced with renewable biomethane, potentially 6.30–12.19% of diesel could be replaced, and emissions would be reduced by 12.47 to 23.86%.
  • If all the biomethane potential would be used in the transport sector replacing fossil fuel, 0.4–0.8 million tonnes of CO2-eq emissions could be avoided, and if the current total biogas station energy would be used combined with the total biomethane potential, 1.0–1.4 million tonnes of CO2-eq emissions could be avoided.

Author Contributions

Conceptualization, K.V. and P.P.A.; methodology, P.P.A.. and K.V.; formal analysis, P.P.A.; investigation, P.P.A. and K.V.; resources, K.V.; data curation, K.V.; writing—original draft preparation, P.P.A. and K.V.; writing—review and editing, P.P.A. and K.V.; supervision, K.V.; project administration, K.V.; funding acquisition, K.V. Both authors have read and agreed to the published version of the manuscript.

Funding

This research was funded by the European Regional Development Fund within the Activity 1.1.1.2 “Post-doctoral Research Aid” of the Specific Aid Objective 1.1.1 of the Operational Program “Growth and Employment” (No. 1.1.1.2/VIAA/1/16/116, “The development of biomethane production technologies”).

Acknowledgments

Authors are especially grateful to the Latvian water and wastewater works association for the data provided about wastewater sludge.

Conflicts of Interest

The authors declare no conflict of interest.

References

  1. Shanmugam, K.; Baroth, A.; Nande, S.; Yacout, D.M.M.; Tysklind, M.; Upadhyayula, V.K.K. Social cost benefit analysis of operating compressed biomethane (CBM) transit buses in cities of developing nations: A case study. Sustainability 2019, 11, 4190. [Google Scholar] [CrossRef] [Green Version]
  2. Rasi, S.; Timonen, K.; Joensuu, K.; Regina, K.; Virkajärvi, P.; Heusala, H.; Tampio, E.; Luostarinen, S. Sustainability of vehicle fuel biomethane produced from grass silage in Finland. Sustainability 2020, 12, 3994. [Google Scholar] [CrossRef]
  3. Pääkkönen, A.; Aro, K.; Aalto, P.; Konttinen, J.; Kojo, M. The potential of biomethane in replacing fossil fuels in heavy transport-a case study on Finland. Sustainability 2019, 11, 4750. [Google Scholar] [CrossRef] [Green Version]
  4. Dubrovskis, V. Biogas from Landfills in Latvia; 6th International Conference on Renewable Energy Gas Technology: Malmö, Sweden, 2018; pp. 1–2. Available online: https://lfg-baltic.beic.nu/Resources/P89_Vilis_Dubrovskis.pdf (accessed on 1 March 2021).
  5. Dzene, I.; Barisa, A.; Rosa, M.; Dobraja, K. A Conceptual Methodology for Waste-to-biomethane Assessment in an Urban Environment. Energy Procedia 2016, 95, 3–10. [Google Scholar] [CrossRef] [Green Version]
  6. Svenskt Gastekniskt Center AB. Basic Data on Biogas; Serviceförvaltningen i Lunds kommun: Lund, Sweden, 2012; ISBN 9789185207107. [Google Scholar]
  7. Al-Wahaibi, A.; Osman, A.I.; Al-Muhtaseb, A.H.; Alqaisi, O.; Baawain, M.; Fawzy, S.; Rooney, D.W. Techno-economic evaluation of biogas production from food waste via anaerobic digestion. Sci. Rep. 2020, 10. [Google Scholar] [CrossRef] [PubMed]
  8. Kapoor, R.; Ghosh, P.; Kumar, M.; Vijay, V.K. Evaluation of biogas upgrading technologies and future perspectives: A review. Environ. Sci. Pollut. Res. 2019. [Google Scholar] [CrossRef]
  9. Navaratnasamy, M.; Koberstein, B.; Partington, B. Anaerobic Digesters. Available online: https://www.thepigsite.com/articles/anaerobic-digesters (accessed on 25 May 2021).
  10. Latvijas Biogāzes Asociācija. Priekšizpēte Par Biometāna Ražošanas un Uzglabāšanas Iespējām Latvijā; Latvijas Biogāzes Asociācija: Riga, Latvia, 2019. [Google Scholar]
  11. Blumberga, D.; Dzene, I.; Al Sedi, A.I.; Rucs, D.; Prasls, H.; Ketners, M.; Finstervalders, T.; Folka, S.; Jansens, R. Biogāze: Rokasgrāmata [Biogas: Handbook]; Big>East, Germany, 2009; ISBN 9789934805806. Available online: https://ortus.rtu.lv/science/en/publications/5847 (accessed on 1 March 2021).
  12. How Much Energy in Biogas Inoplex. Available online: https://www.inoplex.com.au/information/how-much-energy-is-in-biogas (accessed on 25 May 2021).
  13. Grab-rogaliński, K. Selected combustion parameters of biogas at elevated pressure—Temperature conditions. Siln. Spalinowe 2012, 51, 40–47. [Google Scholar]
  14. Sara, T. Fact Sheet—Biogas: Converting Waste to Energy. Available online: https://www.eesi.org/papers/view/fact-sheet-biogasconverting-waste-to-energy (accessed on 21 May 2021).
  15. Priekulis, J.; Aplocina, E.; Laurs, A. Chemical composition of digestate. Eng. Rural Dev. 2016, 2016, 381–386. [Google Scholar]
  16. Schmidt, A.M. 2014 UNL Manure Demonstration Day Manure vs. Commercial Fertilizer: Can soil and Crops Tell the Difference? University of Nebraska: Nebraska, NE, USA, 2014. [Google Scholar]
  17. European Biogas Association. Digestate Factsheet: The value of organic fertilisers for Europe’s economy, society and environment. Dig. Factsheet 2015, 9, 1–4. [Google Scholar]
  18. Mieldažys, R.; Jotautienė, E.; Jasinskas, A.; Pekarskas, J.; Zinkevičienė, R. Investigation of physical-mechanical properties and impact on soil of granulated manure compost fertilizers. J. Environ. Eng. Landsc. Manag. 2019, 27, 153–162. [Google Scholar] [CrossRef] [Green Version]
  19. Mieldazys, R.; Jotautiene, E.; Jasinskas, A.; Aboltins, A. Evaluation of physical mechanical properties of experimental granulated cattle manure compost fertilizer. Eng. Rural Dev. 2017, 16, 575–580. [Google Scholar] [CrossRef]
  20. Latvijas Biogāzes Asociācija. Biogāzes Attīstība Latvijā; Latvijas Biogāzes Asociācija: Riga, Latvia, 2020. [Google Scholar]
  21. Latvijas Valsts Ministru Kabinets Prasības Biometāna un Gāzveida Stāvoklī Pārvērstas Sašķidrinātās Dabasgāzes Ievadīšanai un Transportēšanai Dabasgāzes Pārvades un Sadales Sistēmā. Available online: https://likumi.lv/ta/id/285189-prasibas-biometana-un-gazveida-stavokli-parverstas-saskidrinatas-dabasgazes-ievadisanai-un-transportesanai-dabasgazes-parvades (accessed on 23 May 2021).
  22. Hoyer, K.; Hulteberg, C.; Svensson, M.; Jernberg, J. Energiforsk Technical Repport: Biogas Upgrading—Technical Review; Energiforsk: Stockholm, Sweden, 2016; ISBN 978-1-4673-6773-8. [Google Scholar]
  23. Repele, M.; Paturska, A.; Valters, K.; Bazbauers, G. Life cycle assessment of bio-methane supply system based on natural gas infrastructure. Agron. Res. 2014, 12, 999–1006. [Google Scholar]
  24. Bernacchi, S.; Weissgram, M.; Wukovits, W.; Herwig, C. Process efficiency simulation for key process parameters in biological methanogenesis. AIMS Bioeng. 2014, 1, 53–71. [Google Scholar] [CrossRef]
  25. Götz, M.; Lefebvre, J.; Mörs, F.; McDaniel Koch, A.; Graf, F.; Bajohr, S.; Reimert, R.; Kolb, T. Renewable Power-to-Gas: A technological and economic review. Renew. Energy 2016, 85, 1371–1390. [Google Scholar] [CrossRef] [Green Version]
  26. Bioenergy Europe Statistical Report 2020-Biomass Supply. 2020. Available online: https://bioenergyeurope.org/index.php?option=com_content&view=article&id=270 (accessed on 15 May 2021).
  27. Latvijas Standarts. Dabasgāze un Biometāns Lietošanai Transportā un Biometāns Ievadei Dabasgāzes Tīklā. 2. Daļa: Automobiļu Degvielas Specifikācija; LVS: Riga, Latvia, 2020. [Google Scholar]
  28. IRENA. Biogas for Road Vehicles Technology Brief. Available online: https://www.irena.org/publications/2017/Mar/Biogas-for-road-vehicles-Technology-brief (accessed on 26 May 2021).
  29. Dena, M.E.; Rubial, D.; Nedgia, F.; Focroul, D.; Ergar, A.K.; Agcs, S.K.; Elering, O.; Agcs, A.W.; Cib, L.M.; Eba, D.; et al. D3. 1 Guidelines for Establishing National Biomethane Registries Registries. Available online: https://www.regatrace.eu/wp-content/uploads/2019/11/REGATRACE-D3.1.pdf (accessed on 26 May 2021).
  30. Latvijas Republikas Zemkopības Ministrija. Kūtsmēslu Ieguve un Apsaimniekošana; Latvijas Republikas Zemkopības Ministrija: Riga, Latvia, 2008. [Google Scholar]
  31. Prussi, M.; Yugo, M.; De Prada, L.; Padella, M.; Edwards, M. JEC Well-To-Wheels Report v5; EUR 30284 EN; Publications Office of the European Union: Luxembourg, 2020; ISBN 978-92-76-20109-0. [Google Scholar]
  32. Lauksaimniecības Datu Centrs LDC. Publiskā Datu Bāze. Available online: http://pub.ldc.gov.lv/pub_stat.php?lang=lv (accessed on 15 May 2021).
  33. Latvijas Republikas Ministru Kabinets. Prasības Ūdens, Augsnes un Gaisa Aizsardzībai no Lauksaimnieciskās Darbības Izraisīta Piesārņojuma. In Minist. Kabineta Noteikumi Nr.834. Available online: https://likumi.lv/doc.php?id=271376 (accessed on 16 May 2021).
  34. Vides Aizsardzības un Reģionālās Attīstības Ministrija. Komunālo Notekūdeņu un Notekūdeņu Dūņu Apsaimniekošana Latvijā; Vides Aizsardzības un Reģionālās Attīstības Ministrija: Riga, Latvia, 2018. [Google Scholar]
  35. Eurostat Municipal Waste by Waste Management Operations. Available online: https://ec.europa.eu/eurostat/databrowser/view/env_wasmun/default/table?lang=en (accessed on 12 May 2021).
  36. EUROSTAT. Statistics Explained Municipal Waste Statistics—Statistics Explained; 2020; ISSN 2443-8219. Available online: https://ec.europa.eu/eurostat/statistics-explained/index.php/Municipal_waste_statistics#Municipal_waste_generation (accessed on 13 May 2021).
  37. Simon, J.M. A Zero Waste Hierarchy for Europe. Zero Waste Europe. Available online: https://zerowasteeurope.eu/2019/05/a-zero-waste-hierarchy-for-europe/ (accessed on 17 May 2021).
  38. Andriukaitis, V.; Billingham, C.; Borzan, B.; Cioci, G.; Depouillon, J.; Hartikainen, H.; Joensuu, K.; Kavasa, D.; Kruopienė, J.; Markey, E.; et al. (Food) Waste Not. Want Not. Why Food Waste Is a Big Deal and How to Scale-Up Preventive Action; ISBN 9789934864735. Available online: https://www.feps-europe.eu/attachments/publications/food_web.pdf (accessed on 18 May 2021).
  39. Stenmarck, Å.; Jensen, C.; Quested, T.; Moates, G.; Cseh, B.; Juul, S.; Parry, A.; Politano, A.; Redlingshofer, B.; Scherhaufer, S.; et al. FUSIONS Estimates of European Food Waste Levels; 2016; ISBN 9789188319012. Available online: https://www.eu-fusions.org/phocadownload/Publications/Estimates%20of%20European%20food%20waste%20levels.pdf (accessed on 17 May 2021).
  40. Bharathiraja, B.; Sudharsana, T.; Jayamuthunagai, J.; Praveenkumar, R.; Chozhavendhan, S.; Iyyappan, J. Retraction notice to “Biogas production—A review on composition, fuel properties, feed stock and principles of anaerobic digestion” (Renewable and Sustainable Energy Reviews (2018) 90 (570–582)). Renew. Sustain. Energy Rev. 2018, 94, 1229. [Google Scholar] [CrossRef]
  41. Kythreotou, N.; Tassou, S.A.; Florides, G. An assessment of the biomass potential of Cyprus for energy production. Energy 2012, 47, 253–261. [Google Scholar] [CrossRef]
  42. WorldData.info. Energy Consumption in Latvia. Available online: https://www.worlddata.info/europe/ireland/energy-consumption.php (accessed on 17 May 2021).
  43. Bés, K.; Brisola, M.C.; Crecencio, R.B.; Bitner, D.S.; Frigo, A.; Rampazzo, L.; Faria, G.A.; Araujo, D.N.; da Silva, A.S.; Stefani, L.M. Evaluation of a novel anaerobic co-digestion system for disposal of dead swine and manure: An important tool in animal production. Int. J. Recycl. Org. Waste Agric. 2020, 9, 229–236. [Google Scholar] [CrossRef]
  44. Chiapetta, H.; Harrison, J.; Gay, J.; McClanahan, R.; Whitefield, E.; Evermann, J.; Nennich, T.; Gamroth, M. Reduction of Pathogens in Bovine Manure in Three Full-scale Commercial Anaerobic Digesters. Water. Air. Soil Pollut. 2019, 230. [Google Scholar] [CrossRef]
  45. Rajagopal, R.; Ghosh, D.; Ashraf, S.; Goyette, B.; Zhao, X. Effects of low-temperature dry anaerobic digestion on methane production and pathogen reduction in dairy cow manure. Int. J. Environ. Sci. Technol. 2019, 16, 4803–4810. [Google Scholar] [CrossRef]
  46. Jun, P.; Gibbs, M.; Gaffney, K. CH4 and N2O emissions from livestock manure. Backgr. Pap. Good Pract. Guid. Uncertain. Manag. Natl. Greenh. Gas. Invent. 2000, 2, 321–338. [Google Scholar]
  47. Skrebele, A.; Štelce, V.; Lupkina, L.; Rubene, L.; Cakars, I.; Siņics, L.; Bārdule, A. Latvia’s Informative Inventory Report. Available online: https://www.meteo.lv/fs/CKFinderJava/userfiles/files/Vide/Gaiss/Piesarnojums/New/IIR_2020_NECD.pdf (accessed on 18 May 2021).
  48. Latvijas Republikas Zemkopības Ministrija. Gaisa Kvalitātes Aizsardzība. Available online: https://www.zm.gov.lv/lauksaimnieciba/statiskas-lapas/vides-aizsardzibas-prasibas-lauksaimnieciskai-darbibai/gaisa-kvalitates-aizsardziba?nid=2751 (accessed on 10 May 2021).
  49. Frolova, O.; Priekulis, J.; Berzina, L.; Aboltins, A. Trend of ammonia emissions from livestock sector in Latvia. Eng. Rural Dev. 2020, 19, 598–602. [Google Scholar] [CrossRef]
  50. Rotz, C.A. Modeling greenhouse gas emissions from dairy farms. J. Dairy Sci. 2018, 101, 6675–6690. [Google Scholar] [CrossRef] [PubMed]
  51. Worldometer Latvia CO2 Emissions. 2016. Available online: https://www.worldometers.info/co2-emissions/latvia-co2-emissions/ (accessed on 12 May 2021).
  52. CSDD. Statistics of Registered Vehicle. 2021. Available online: https://www.csdd.lv/vehicles/statistics-of-registered-vehicle (accessed on 13 May 2021).
  53. Statista Latvia. Annual Greenhouse Gas Emissions of the Transport Sector 2017|Statista; Statista Latvia. Available online: https://www.statista.com/statistics/411863/annual-greenhouse-gas-emissions-of-the-transport-sector-in-germany/ (accessed on 13 May 2021).
  54. EEA. Greenhouse Gas Emissions from Transport in Europe—European Environment Agency. Europe Environment Agency. 2018. Available online: https://www.eea.europa.eu/data-and-maps/indicators/transport-emissions-of-greenhouse-gases-7/assessment%0Ahttps://www.eea.europa.eu/data-and-maps/indicators/transport-emissions-of-greenhouse-gases-7/assessment%0Ahttps://www.eea.europa.eu/data-and-maps/ind (accessed on 14 May 2021).
Figure 1. Biogas production and utilization diagram [11].
Sustainability 13 07827 g001
Figure 2. Most commonly used biogas upgrading technologies in Europe 2019 [26].
Sustainability 13 07827 g002
Figure 3. Typical agricultural biogas station “two-in-one” with soft membrane roofing diagram [11].
Sustainability 13 07827 g003
Figure 4. Waste reduction management scheme [37].
Sustainability 13 07827 g004
Table 1. LHV and HHV of Biogas Based on its CH4 Content [12,13].
Lower Heating ValueHigher Heating Value
Biogas CH4 Content, %MJ/m3kWh/m3MJ/m3kWh/m3
4516.14.4717.94.97
5017.94.9719.95.53
5519.75.4719.96.08
6021.55.9623.96.63
6523.36.4625.97.18
7025.16.9627.97.74
Upgraded Biogas
9534.09.4437.810.50
9634.49.5438.210.61
9734.79.6438.610.72
9835.19.7439.010.83
9935.49.8439.410.94
Table 2. Nutrient Content of Livestock Animals [15].
Manure TypeCattle ManurePig Liquid ManurePoultry Manure
Dry matter, %7.286.268.85
Total amount of N, % DM3.517.616.35
Ammonium N, % DM2.825.036.00
Phosphorus P2O5, % DM2.683.576.20
Potassium K2O, % DM5.155.036.15
Table 3. Biogas Production Values from Different Biomasses [30].
BiomassBiogas Production, m3/kg
Pig manure0.34–0.68
Beef manure0.2–0.4
Poultry manure0.37–0.64
Wastewater sludge0.2–0.6
Organic household food waste0.11
Table 4. Calculation Summary of Biomethane Potential of Livestock Manure.
Biogas Yield, m3 (60% CH4)Biomethane Yield, m3 (97% CH4)Biomethane Potential, GWhBiomethane Potential, PJ
MinMaxMinMaxMinMaxMinMax
Dairy cow56,563,353113,126,70634,987,64169,975,2823376751.2132.430
Poultry21,384,18036,988,85213,227,32822,879,7021282210.4610.796
Pig15,809,15431,618,3089,778,85819,557,716941890.3380.680
Total93,756,687181,733,86657,993,827112,412,7005591 0842.0123.902
Average137,745,27785,203,2648222.958
Table 5. Calculation Summary for Wastewater Sludge Potential.
Biogas Yield, m3 (60% CH4)Biomethane Yield, m3 (97% CH4) Biomethane Potential, GWhBiomethane Potential, PJ
MinMaxMinMaxMinMaxMinMax
Wastewater sludge3,822,19011,466,5692,285,4336,856,29922.0473.490.0790.265
Average7,644,3794,570,86647.760.172
Table 6. Calculation Summary for Municipal Organic Food Waste Potential.
Biogas Yield, m3 (60% CH4)Biomethane Yield, m3 (97% CH4)Biomethane Potential
GWhPJ
Municipal organic food waste5,274,8763,262,81031.460.133
Table 7. Calculation Summary for Overall Biomethane Potential.
Biogas Yield, m3 (60% CH4)Biomethane Yield, m3 (97% CH4)Biomethane Potential, GWhBiomethane Potential, PJ
MinMaxMinMaxMinMaxMinMax
Livestock manure93,756,687181,733,86657,993,827112,412,7005591,0842.0133.902
Wastewater sludge3,822,19011,466,5692,285,4336,856,29922.0473.490.0790.265
Municipal organic food waste5,274,8763,262,81031.460.113
Total102,853,753193,200,43563,542,070119,268,9996131.1892.2114.280
Average148,027,09491,405,5359013.243
Table 8. Overall Emission Calculation Summary for Biomethane use in the Transport Sector.
Biomethane Potential, PJEmissions If Diesel, Tonnes CO2-eqPotential Emissions, Tonnes CO2-eqAvoidable Emissions, Tonnes CO2-eq
MinMaxMinMaxMinMaxMinMax
Livestock manure2.0133.902189,222366,788−207,138−401,516−396,360−768,304
Wastewater sludge0.0790.265742624,91017625910−5664−19,001
Municipal organic food waste0.11310 6501 076-9 574
Total2.2114.280207,298391,698−204,300−395,606−411,598−787,304
Average3.243299,498−299,953−599,451
Current biogas stations3.072288,731−316,068−604,799
Table 9. CO2-eq Emissions From Different Vehicle Types in Latvia [31,53,54].
Emission ShareFossil Fuel Emissions, Tonnes CO2-eqReplacing Fossil with Renewable Emissions, Tonnes CO2-eq
Heavy-duty trucks and busses19.2639,36039,909
Light-duty trucks8.7289,710−309,741
Cars44.31,475,190875,739
Publisher’s Note: MDPI stays neutral with regard to jurisdictional claims in published maps and institutional affiliations.

