Article

Emission Characteristics of Hazardous Air Pollutants from Medium-Duty Diesel Trucks Based on Driving Cycles

1
Division of Global Environment Research, National Institute of Environmental Research, Incheon 22689, Korea
2
Transportation Pollution Research Center, National Institute of Environmental Research, Incheon 22689, Korea
*
Author to whom correspondence should be addressed.
Sustainability 2021, 13(14), 7834; https://doi.org/10.3390/su13147834
Submission received: 13 June 2021 / Revised: 10 July 2021 / Accepted: 11 July 2021 / Published: 13 July 2021

Abstract

:
Studies on the characteristics of hazardous air pollutants (HAPs) in the emissions of medium-duty diesel trucks are significantly insufficient compared to those on heavy-duty trucks. This study investigated the characteristics of regulated pollutants and HAPs, such as volatile organic compounds (VOCs), aldehydes, and polycyclic aromatic hydrocarbons (PAHs), and estimated non-methane hydrocarbon (NMHC) speciation in the emissions of medium-duty diesel trucks. Ten medium-duty diesel trucks conforming to Euros 5 and 6 were tested for four various driving cycles (WLTC, NEDC, CVS-75, and NIER-9) using a chassis dynamometer. In an urban area such as Seoul, CO and NMHC emissions were increased because of its longer low-speed driving time. NOx emissions were the highest in the high-speed phase owing to the influence of thermal NOx. PM emissions were almost not emitted because of the DPF installation. Alkanes dominated non-methane volatile organic compound (NMVOC) emissions, 36–63% of which resulted from the low reaction of the diesel oxidation catalyst. Formaldehyde emissions were the highest for 35–53% among aldehydes irrespective of driving cycles. By sampling the particle-phase of PAHs, we detected benzo(k)fluoranthene and benzo(a)pyrene and estimated the concentrations of the gas-phase PAHs with models to obtain the total PAH concentrations. In the particle portion, benzo(k)fluoranthene and benzo(a)pyrene were over 69% and over 91%, respectively. The toxic equivalency quantities of benzo(k)fluoranthene and benzo(a)pyrene from NIER-9 (cold) for both Euro 5 and Euro 6 vehicles were more than five times higher than those of NIER (hot) and NEDC. In the case of NMHC speciation, formaldehyde emissions were the highest for 10–45% in all the driving cycles. Formaldehyde and benzene must be controlled in the emissions of medium-duty diesel trucks to reduce their health threats. The results of this study will aid in establishing a national emission inventory system for HAPs of mobile sources in Korea.

1. Introduction

Air pollution caused by various transportation sources poses a serious threat to human health. The Seoul Metropolitan Area (SMA) is significantly affected by mobile sources of pollution as the number of registered vehicles in the region is more than ten million as of 2019 [1]. Therefore, the management of automobile emissions is required in areas of high population density. The SMA is a metropolitan area composed of Seoul in its center, the Gyeonggi Province, and Incheon, and the contribution of automobiles to air pollution is high in this region. According to the national air pollutant emissions [2] data for 2017, medium-duty trucks are a major source of emissions as they contribute high proportions of CO (37.4%), NOx (25.1%), and PM2.5 (19.9%) in the SMA. Even though many studies on emissions from heavy-duty trucks have been conducted, domestic and overseas studies on emissions from medium-duty trucks are insufficient.
Regulated pollutants (e.g., CO, NOx, HC, and particulate matter (PM)) from mobile sources, such as trucks, have been systematically managed in South Korea by establishing emission standards and inventories. Recently, the importance of managing hazardous air pollutants (HAPs) including volatile organic compounds (VOCs), aldehydes, and polycyclic aromatic hydrocarbons (PAHs) is gradually increasing with the growing interest in health risks associated with them. HAPs emanating from diesel engines, which are mainly used in trucks, are known to have high health risks associated with long-term exposure because of their carcinogenicity, toxicity, and bioaccumulation properties despite their trace concentrations [3]. It is difficult to manage HAPs in emissions from mobile sources, such as trucks, owing to the absence of regulatory standards.
These HAPs are classified into gaseous and particulate matter. Mobile sources are the main contributors of gaseous and particulate matter pollutants in urban air [4]. Gaseous matter includes VOCs composed of aromatic hydrocarbons, such as benzene and toluene, and their derivatives, as well as aldehydes that have a unique odor. VOCs easily evaporate into the atmosphere because of their high saturation vapor pressures and are known as the precursors of photochemical smog that contributes to secondary ozone generation through photolysis reactions with NOx in the atmosphere. Benzene has been reported to cause leukemia, myeloma, and lymphoma [5,6]. Aldehydes are organic compounds with the carbonyl group of -(CH)=O [5], and they are formed by the incomplete combustion of hydrocarbons [7]. Among aldehydes, exposure to formaldehyde is known to cause emotional instability, memory loss, and difficulty in concentration [8]. Particulate matter (PM) includes PAHs, which are known to cause bronchitis, lung cancer, dermatitis, and conjunctivitis [9,10,11], and carcinogenic substances, such as heavy metals. PAHs are present in large quantities in the PM of diesel engine emissions, and they are highly likely to be generated by the incomplete combustion of fuel. In addition, the higher loading of a diesel engine has a significant relationship with endocrine disruption [12] because of their emission of PAHs. Many studies [13,14,15,16,17] have explored the characterization of PAHs in particles from diesel vehicles. A recent study reported that the PAH concentration in terms of the toxic equivalency quantity (TEQ) associated with the benzene ring number demonstrated two peak concentrations with respect to smaller ultrafine (>66 nm) and quasi-accumulation (170–330 nm) size ranges [18]. Therefore, various domestic and overseas studies have been conducted on the toxicity, generation mechanisms, and occurrence paths of HAPs.
The quantity of carbonyls emitted from a medium-duty diesel truck was 67.1 ± 49.3 mg/km, and in that, formaldehyde was the highest, followed by acetaldehyde [19]. According to George et al. (2014) [20], carbonyls, such as formaldehyde and acetaldehyde, account for more than 72% of the VOCs of diesel trucks equipped with after-treatment technologies such as diesel particulate filter (DPF), selective catalytic reduction (SCR), and diesel oxidation catalysts (DOC). Nelson et al. (2008) [21] reported that formaldehyde (1.1–160 mg/km) exhibited the highest proportion among the VOCs emitted from diesel trucks and buses, followed by acetaldehyde (1.3–69 mg/km), benzene (2.1–11 mg/km), and toluene (1.1–7.2 mg/km). In addition, Jung et al. (2019) found high proportions of formaldehyde (14–29.9%) and acetaldehyde (5.7–12.4%) among the non-methane hydrocarbon (NMHC) emissions of heavy-duty diesel trucks equipped with a reduction device (DPF + exhaust gas recirculation (EGR) or SCR). According to Hu et al. (2013) [22], PAHs emitted from heavy-duty diesel vehicles fitted with DPFs reduced by more than 90%. They also reported that the proportion of gaseous PAHs among the total PAHs was high in the emissions of heavy-duty diesel vehicles without DPF. According to Li et al. (2019), PAHs that generally exist in fossil fuels and the increased combustion temperature could the highest content of the PAHs [23]. For biofuels, the hazardous pollutants such as PAHs and nitrogen compounds released at 800 °C were much higher than those released at 700 °C [24]. Domestic and overseas studies on the characteristics of emissions from medium-duty diesel trucks and on the speciation of HAPs in their emissions are significantly insufficient compared to those on heavy-duty trucks.
This study investigated the characteristics of regulated pollutants and HAPs in the emissions of medium-duty diesel trucks using various test modes. This article presents measurement-based characteristics of regulated pollutants and speciation of HAPs that reflect the domestic situation in Seoul, and pollutants for priority management are identified.

2. Materials and Methods

2.1. Test Vehicle and Fuel
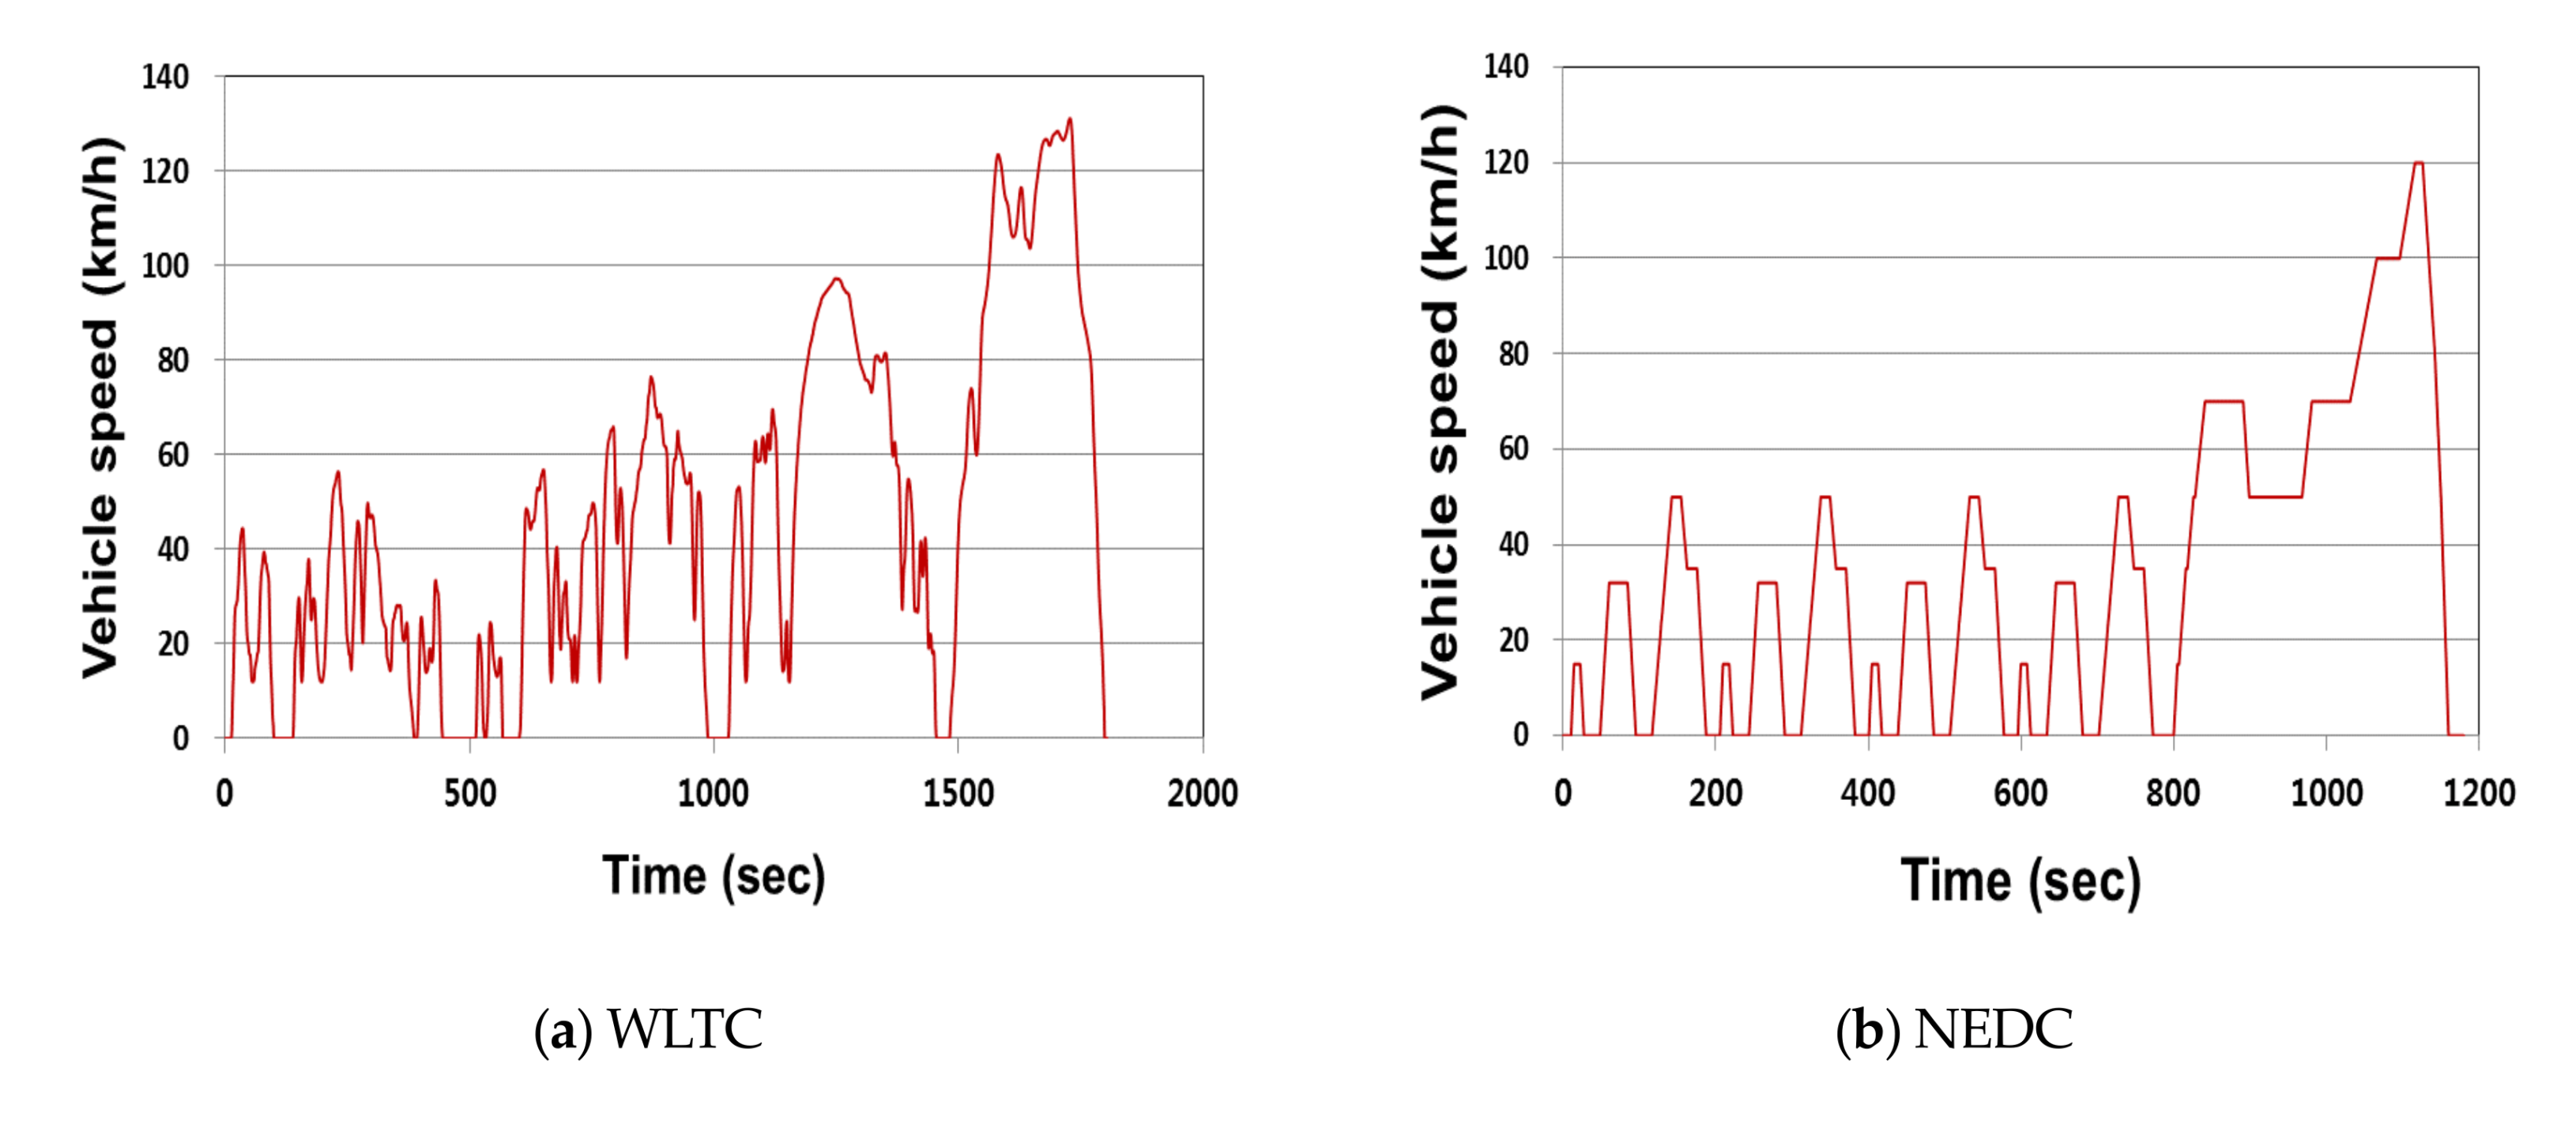
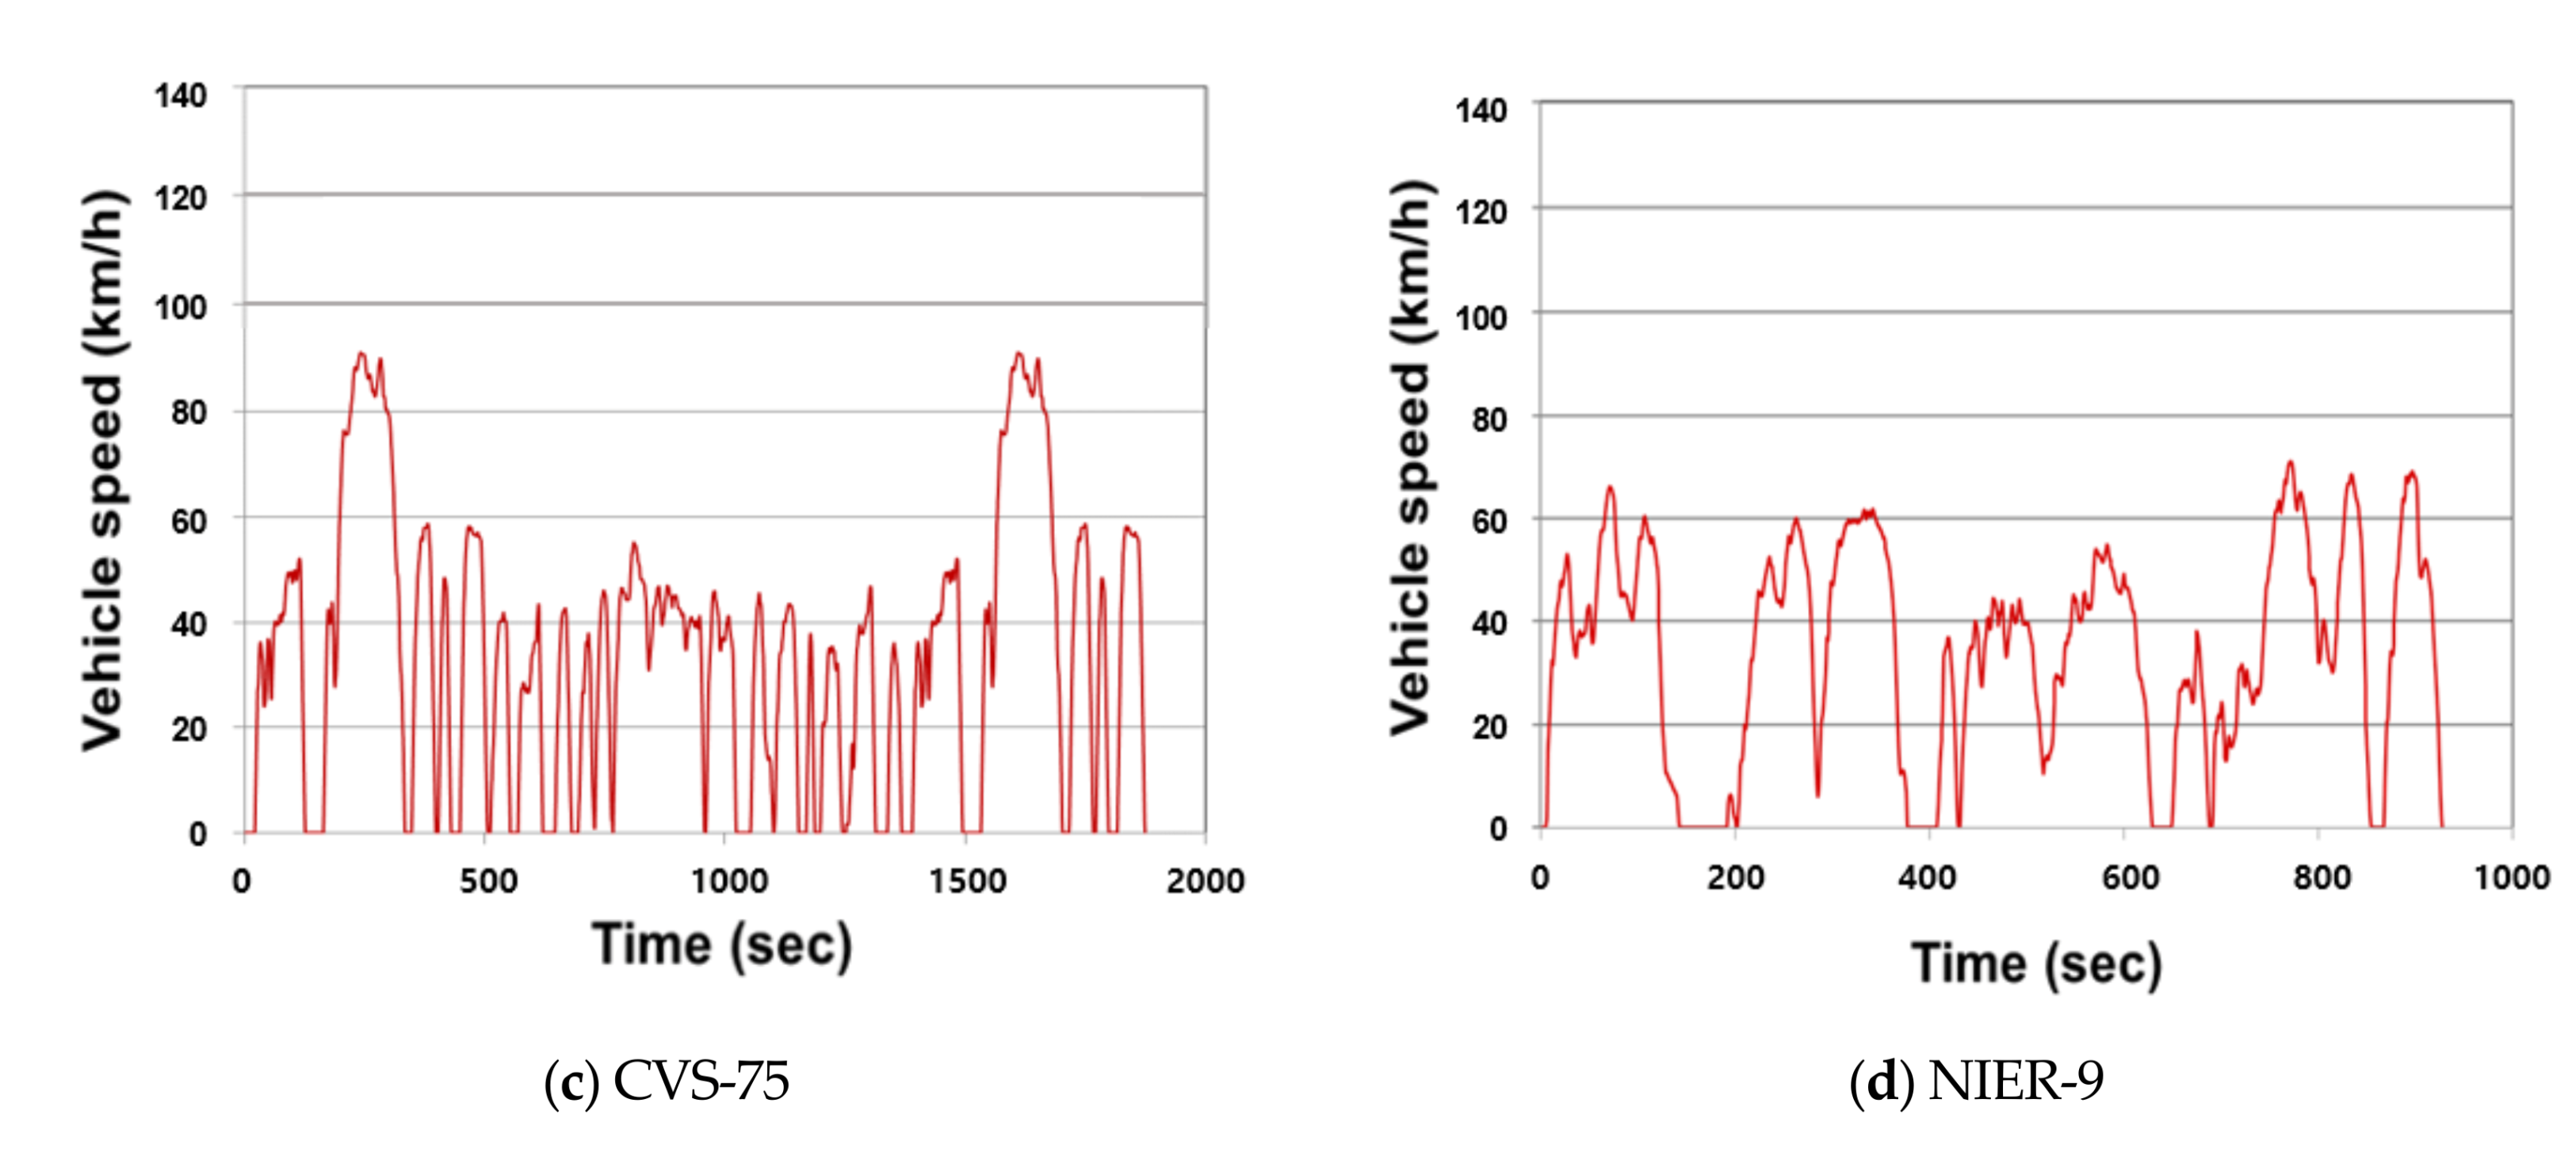
In this study, a total of ten medium-duty diesel trucks, five each conforming to Euro 6 and Euro 5, were selected based on data of their market share derived from the statistics of registered vehicles obtained from the Korea Automobile Manufacturers Association [25] to investigate the characteristics of their emissions in terms of regulated pollutants and HAPs. Table 1 lists the specifications of the test vehicles. The fuel used for testing satisfied the diesel emission standards of the Clean Air Conservation Act of Korea, and its properties are listed in Table 2.

2.2. Test Cycles

To investigate the characteristics of air pollutants from the emissions of medium-duty diesel trucks, test cycles were classified based on vehicle speed and by simulating the driving characteristics on major arterial roads, including those in Seoul. The National Institute of Environment Research (NIER)-9 driving cycle, with an average speed of 34–35 km/h, is one of the 15 driving cycles developed by the NIER to simulate real driving conditions on various urban roads in Korea. Apart from NIER-9, various certification cycles including the worldwide harmonized light duty test cycle (WLTC), the new European driving cycle (NEDC), and the constant volume sampler (CVS)-75 were used. The WLTC are chassis dynamometer tests for the determination of emissions and fuel consumption from light-duty vehicles. It consists of four parts for low, medium, high and extra-high speed sections. The NEDC is a driving cycle, designed to assess the emission levels of car engines and the fuel economy in passenger cars. It consists of four repeated ECE-15 urban driving cycles (UDC) and one extra-urban driving cycle (EUDC). The CVS-75 is federal test procedure (FTP)-75, which has been used for emission certification and fuel economy testing of light-duty vehicles in the United States. It consists of a cold-start transient, a stabilized, and a hot-start transient phase. In addition, 50% of the maximum load was reflected in the test vehicles, and the test was conducted three times or more. Table 3 lists the specifications of the test cycles. The driving patterns of the considered driving cycles are shown in Figure 1. The various test cycles of this study include certification cycles for export to Europe, America, and Asia, making it possible to compare and analyze the results of this study in other countries.

2.3. Measuring Instruments and Test Method

2.3.1. Chassis Dynamometer Emission Measurement System

As shown in Figure 2, the concentrations of pollutants were measured using a chassis dynamometer emission measurement system. The measurement system consists of a chassis dynamometer, an auxiliary operation device, a dilution tunnel, a constant volume sampler, and an exhaust gas analyzer. In the chassis dynamometer, set mechanical loads were applied to reflect the driving conditions of the vehicles, such as acceleration, deceleration, and constant speed. According to the set driving cycle, the gas emitted from the exhaust pipe during vehicle driving was mixed with air in the dilution tunnel and allowed to flow into the constant-volume sampler. The mixed gas was collected in a sample collection bag in the constant volume sampler for analysis using an exhaust gas analyzer. The quantity of emissions was calculated by converting into weight unit per traveled distance (g/km). Among the emissions, CO and CO2 were analyzed using nondispersive infrared (NDIR) spectroscopy, and total hydrocarbons (THC) and CH4 were analyzed using a heated flame ionization detector (HFID). The NOx was analyzed using a chemiluminescence detector (CLD). Table 4 lists the specifications of the exhaust gas analyzer.
PM was collected by diluting the exhaust gas with air at a certain ratio while driving using the chassis dynamometer. After collecting part of the exhaust gas and diluting it with external air in the dilution tunnel, the PM was collected using a quartz filter. A microbalance (CP2P-F, Sartorius) was used to measure the weight of the PM collected in the filter, and the measurement was performed in a weighing chamber at a temperature of 20 ± 5 °C and a relative humidity of 47 ± 5% for accurate measurement. PM measurements were performed in the following sequence. First, a filter, the weight of which was measured at a constant temperature in a humidity chamber, was installed in the filter holder of the PM sampler, and a PM sample was collected by suctioning the exhaust gas from the exhaust pipe at a constant flow rate and a constant speed. During this process, the temperature of the exhaust gas that penetrates through the filter was maintained at 52 °C or less. The filter in which the PM was collected was stored in a Petri dish to ensure that it remained intact. The filter containing the PM sample remained in the weighing chamber at a temperature of 20 ± 5 °C and a relative humidity of 47 ± 5% for 24 ± 4 h, and the weight difference before and after the measurement was obtained. The number of particles was measured using a condensation particle counter (CPC, MEXA-2000 SPCS).

2.3.2. Analysis Method for HAPs

For VOCs, a sample was collected in a 5-L Tedlar bag through a purge line after collecting diluted exhaust gas in a sample collection bag during the vehicle driving and analysis processes. VOCs were analyzed using the US EPA TO-14A [26] method. In the sample concentration and pretreatment process through a thermal desorption system, the moisture of the sample was removed using a Nafion dryer using the purge and trap technique, and VOCs were concentrated and adsorbed at a low temperature of −15 °C in the cold trap part. The concentrated sample was heated to 300 °C for desorption and injected into the gas chromatograph/mass spectrometer (GC/MS) for analysis. A 100-ppb standard gas containing a mixture of 56 materials, including ozone precursors, was used as the standard material. The calibration curve was confirmed at 2, 5, 10, 20, and 50 ppb, and the coefficient of determination (R2) for the concentration and area was 0.998. Table 5 lists the analytical conditions used. Aldehydes were sampled by collecting the exhaust gas at a flow rate of 2 L/min through the dilution tunnel of the engine dynamometer and the pitot tube of the portable emission measurement system after connecting the Waters ozone scrubber and the 2,4-dinitrophenylhydrazine cartridge to the front and rear ends. The sample was stored in a freezer at −4 °C or less before pretreatment. For the extraction solvent, acetonitrile was filtered with a GHP filter (47 mm and 0.2 μm) before use in the extraction of the cartridge. The extraction volume was set to 5 mL. The sample was placed in a dedicated 2-mL vial and analyzed using ultra-performance liquid chromatography (UPLC) based on the US EPA TO-11A [27] method. A 40 µg/mL standard solution from Supelco, a mixture of 13 materials, was mixed and diluted and used as the standard material, and the calibration curve was confirmed at concentrations of 100, 200, 500, 800, and 1000 ng/mL. The R2 for the concentration and area was 0.997. Table 6 lists the analytical conditions used. The PM was collected in quartz filters for the analysis of PAHs. The front and rear filters that collected PM were placed in the 11 mL extraction cell of the accelerated solvent extractor. The empty space of the cell was filled with diatomite to prevent errors during extraction. The accelerated solvent extractor performed sample extraction at a high temperature and pressure, and it extracted approximately 20 mL with dichloromethane for 15 min at a temperature of 100 °C and a pressure of 2000 psi. For the analysis of PAHs, the standard material was analyzed using the US EPA TO-13A [28] method. A 100 µg/mL standard solution from Supelco, a mixture of 16 materials, was diluted and used as the standard material. The calibration curve was confirmed at 0.1, 0.25, 0.5, 1, and 2 µg/mL, and the R2 for the concentration and area was 0.995. Table 7 lists the analytical conditions used.

3. Results and Discussion

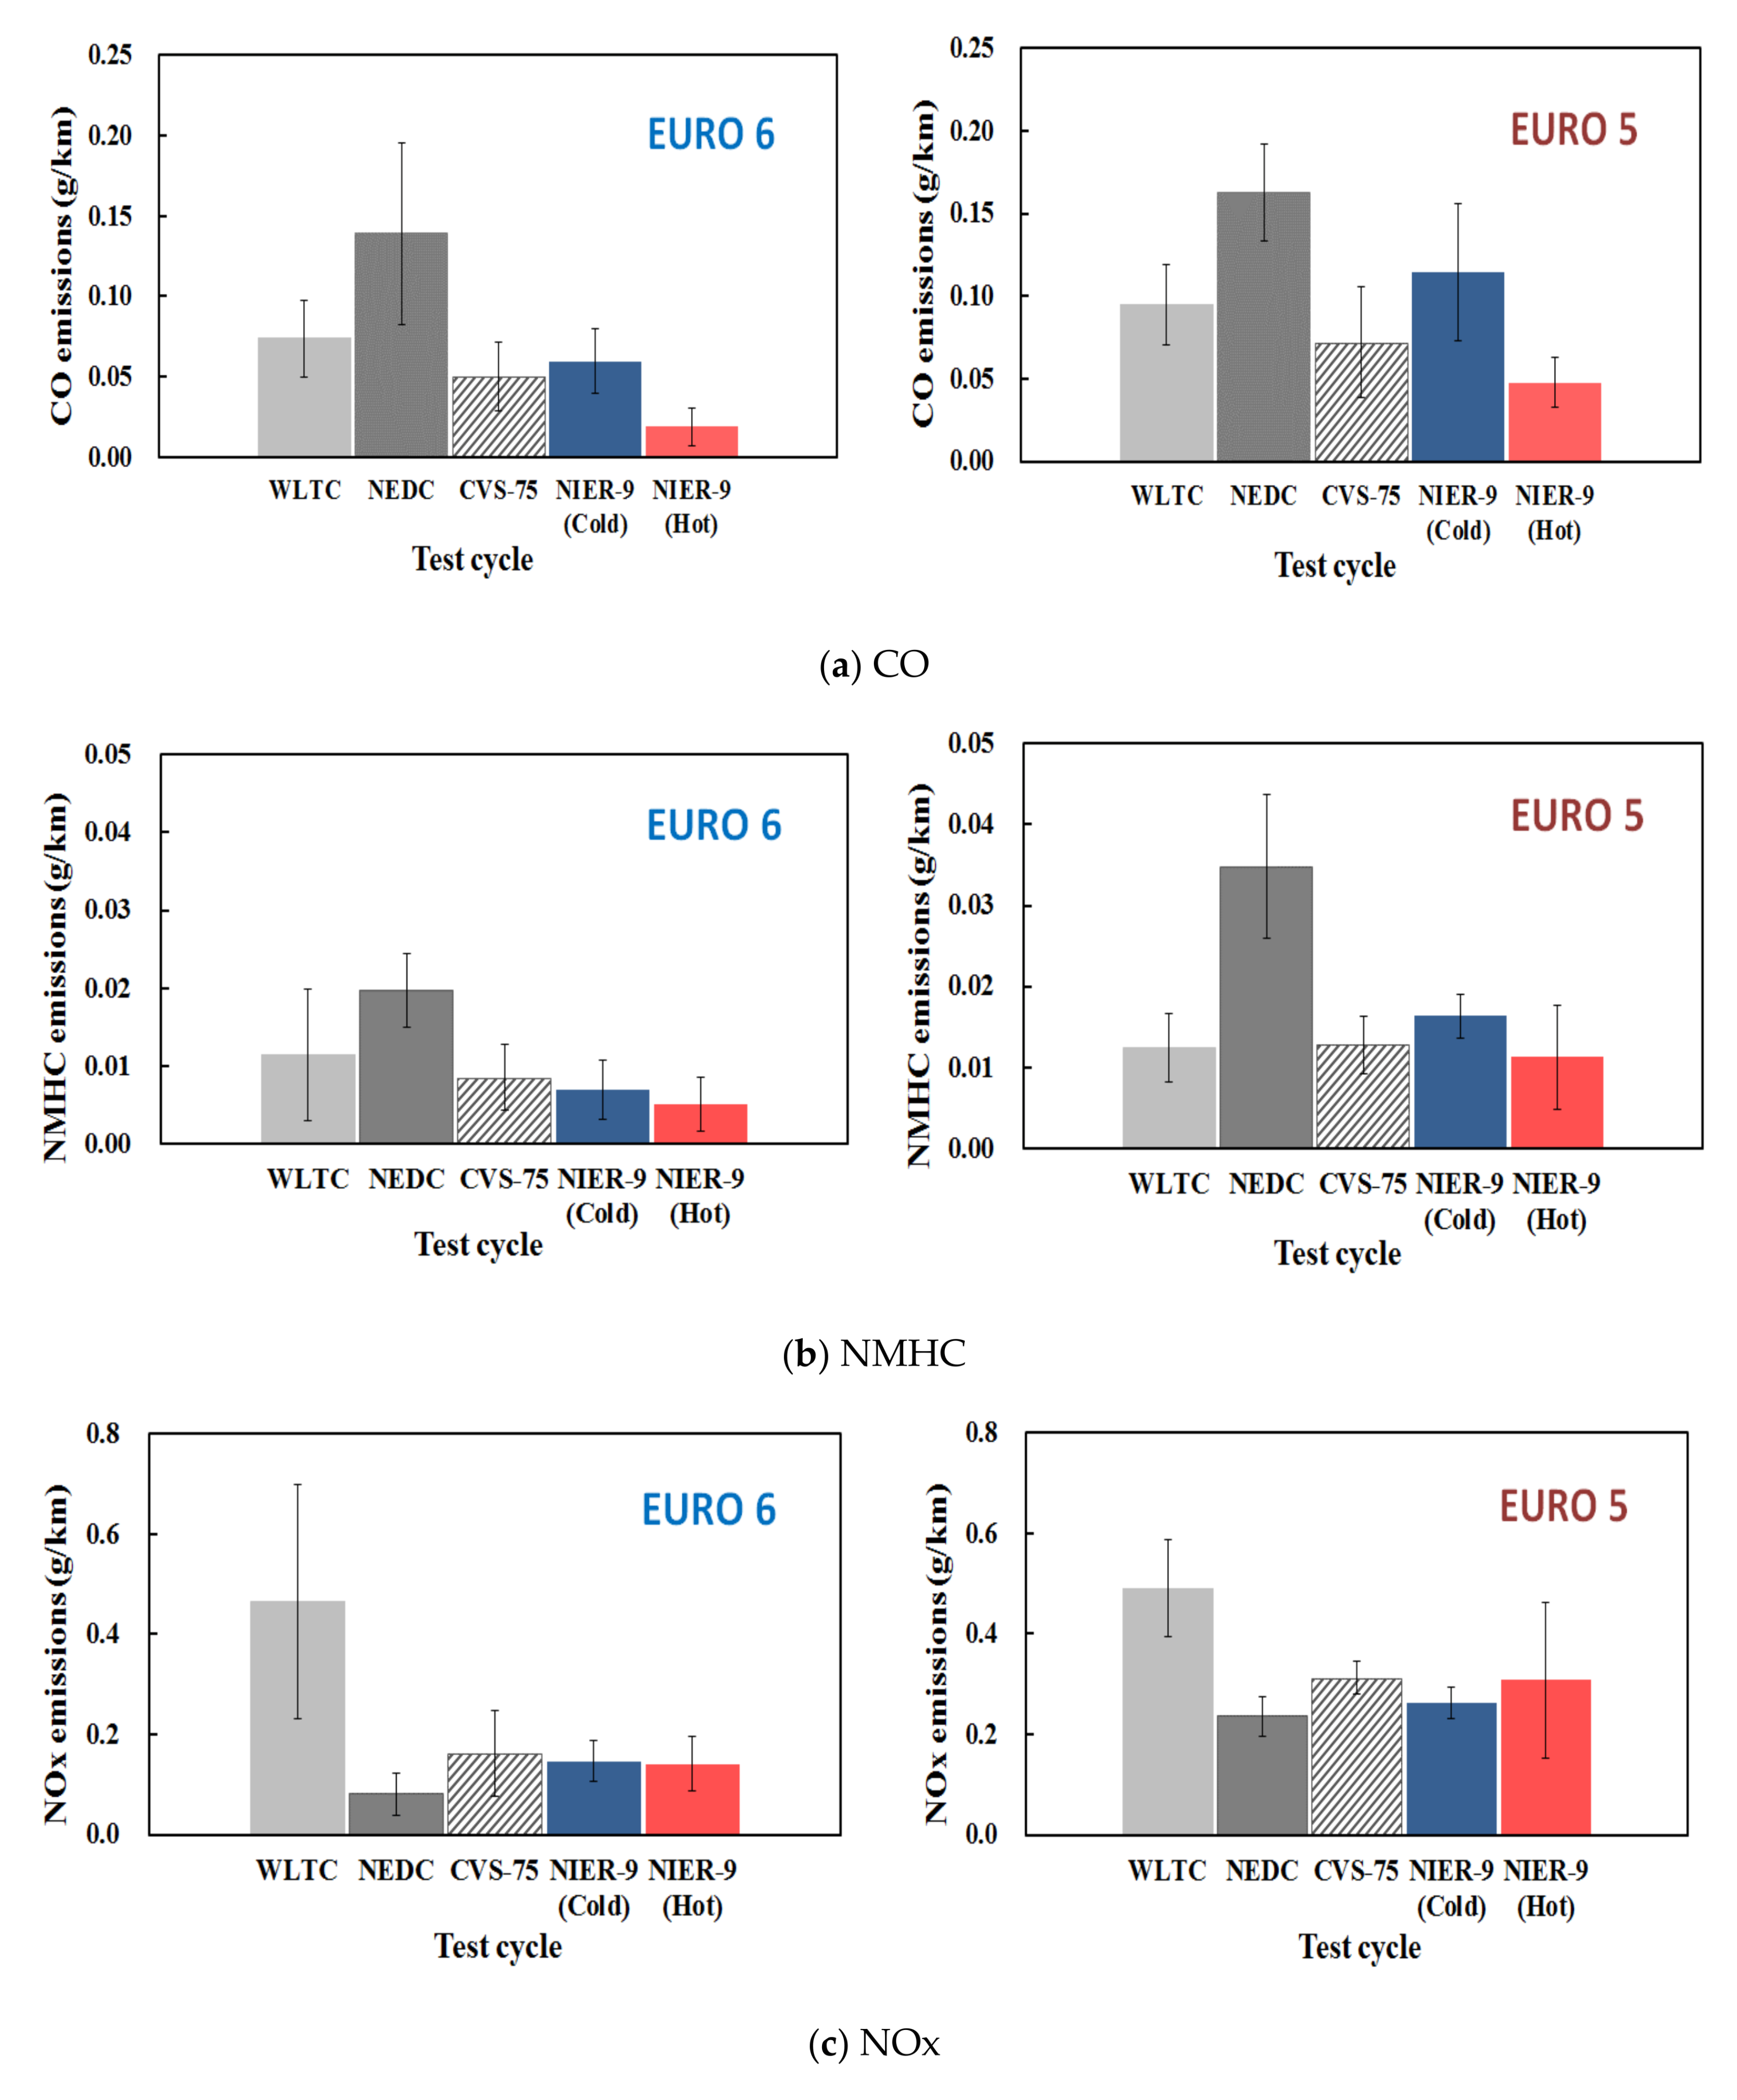
3.1. Emission Characteristics of Regulated Pollutants

The results of the tests conducted in various test cycles (WLTC, NEDC, CVS-75, and NIER-9) using a chassis dynamometer for medium-duty diesel trucks are presented in Figure 3. As shown in Figure 3, as the regulatory standard for diesel vehicles is strengthened from Euro 5 to Euro 6, CO (0.021–0.55 g/km (15–61%)), NMHC (0.001–0.015 g/km (8–64%), and NOx (0.02–0.17 g/km (5–54%)) showed a tendency to decrease. CO and NMHC emissions were the highest in the NEDC. This appears to be because the acceleration and deceleration rates of the engine speed were higher, and the low-speed driving time was longer than that of the other modes. In urban areas such as Seoul, due to heavy traffic, the low-speed driving period is long because of idling and frequent stops, resulting in high CO and NMHC emissions. In the NIER-9, CO emissions were 2.4–3.2 times higher and NMHC emissions were 1.4–1.5 times higher because the cold-start condition had a higher combustion instability and a lower catalytic activity than that of the hot-start condition [6,16,29,30]. In the WLTC, NOx emissions were 1.5–5.8 times higher than those in the other cycles. This appears to be due to the influence of thermal NOx caused by the high-speed section [15,16]. Euro 6 showed a 43% reduction in NOx emissions compared to Euro 5 owing to the lean NOx trap (LNT). As shown in Figure 4, the PM emissions of medium-duty diesel trucks were less than 0.001 g/km. It appears that the PM emissions were significantly low owing to the installation of the DPF in the test vehicles. Particle numbers (PN) in the emissions from the Euro 6 vehicles ranged from 8.2 × 10¹⁰ to 1.2 × 10¹¹ #/km, which were lower than those from the Euro 5 vehicles (1.0 × 10¹¹ to 1.3 × 10¹¹ #/km).
As a limiting point, the engine and reduction device technology are advanced in Euro 5 and higher vehicles, so the emissions are low and the standard deviation is relatively large. Therefore, the difference is not large from a statistical point of view, but Euro 6 is considered to have a slight decrease compared to Euro 5.

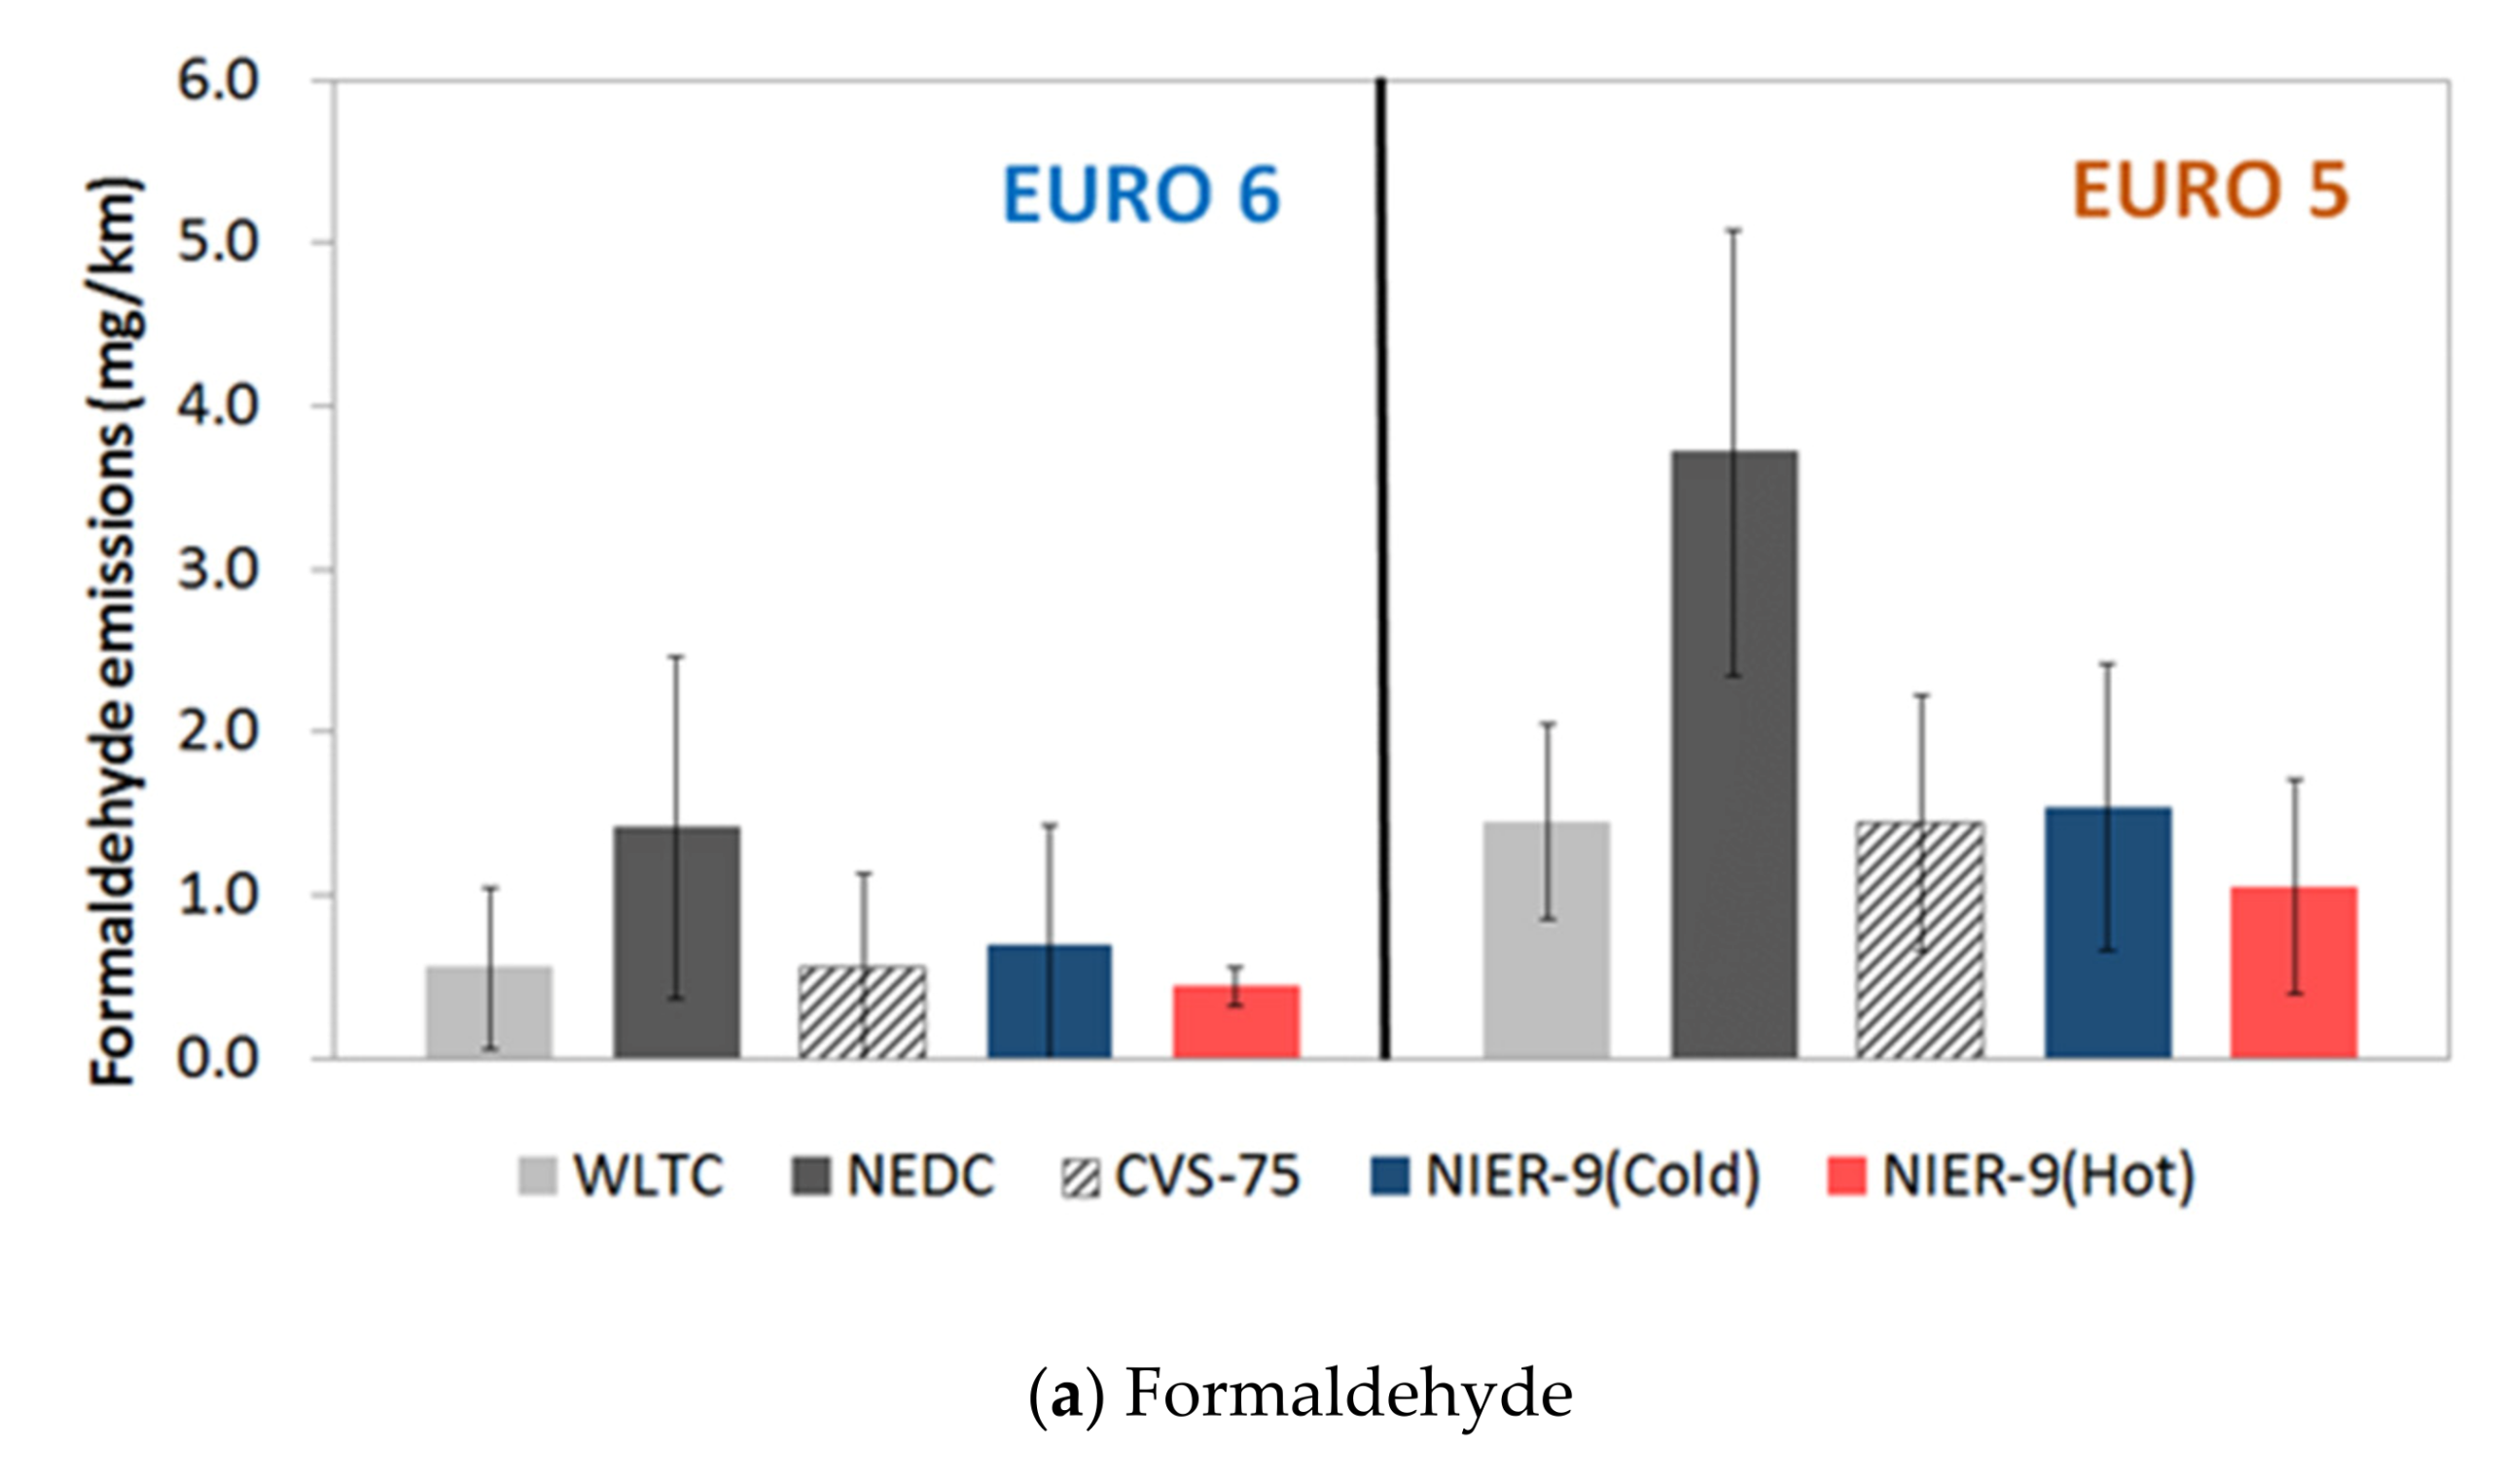
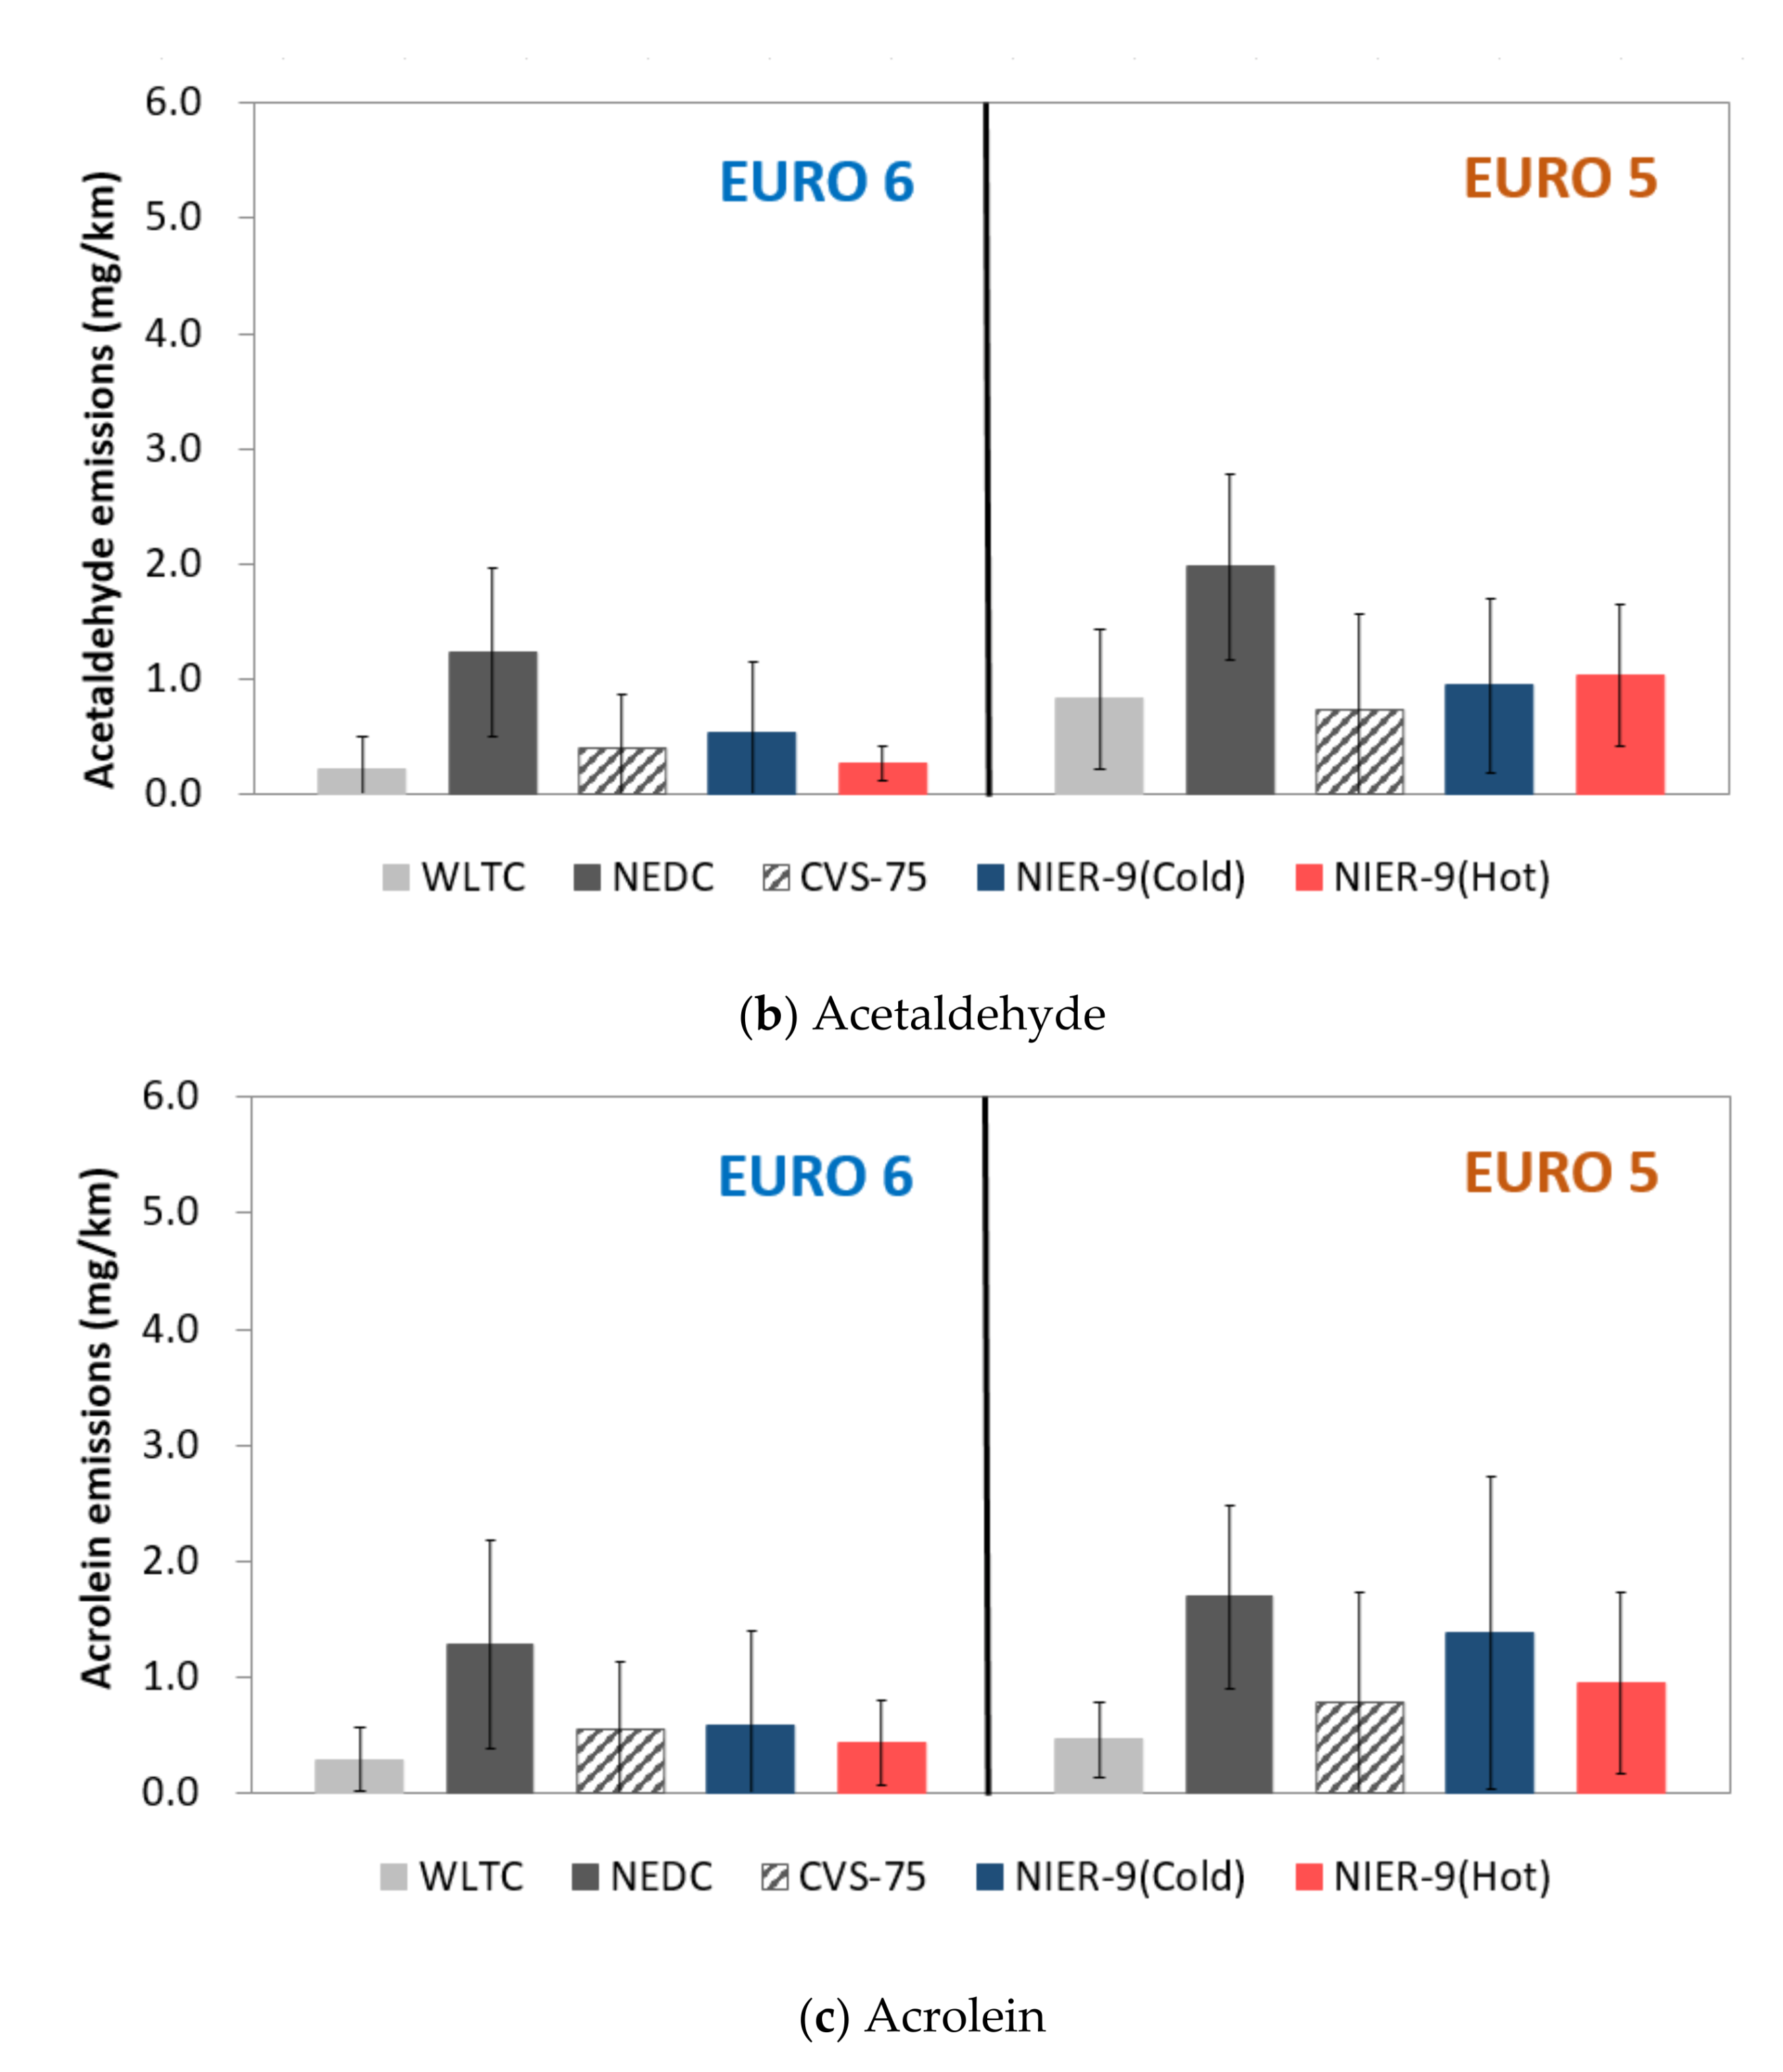
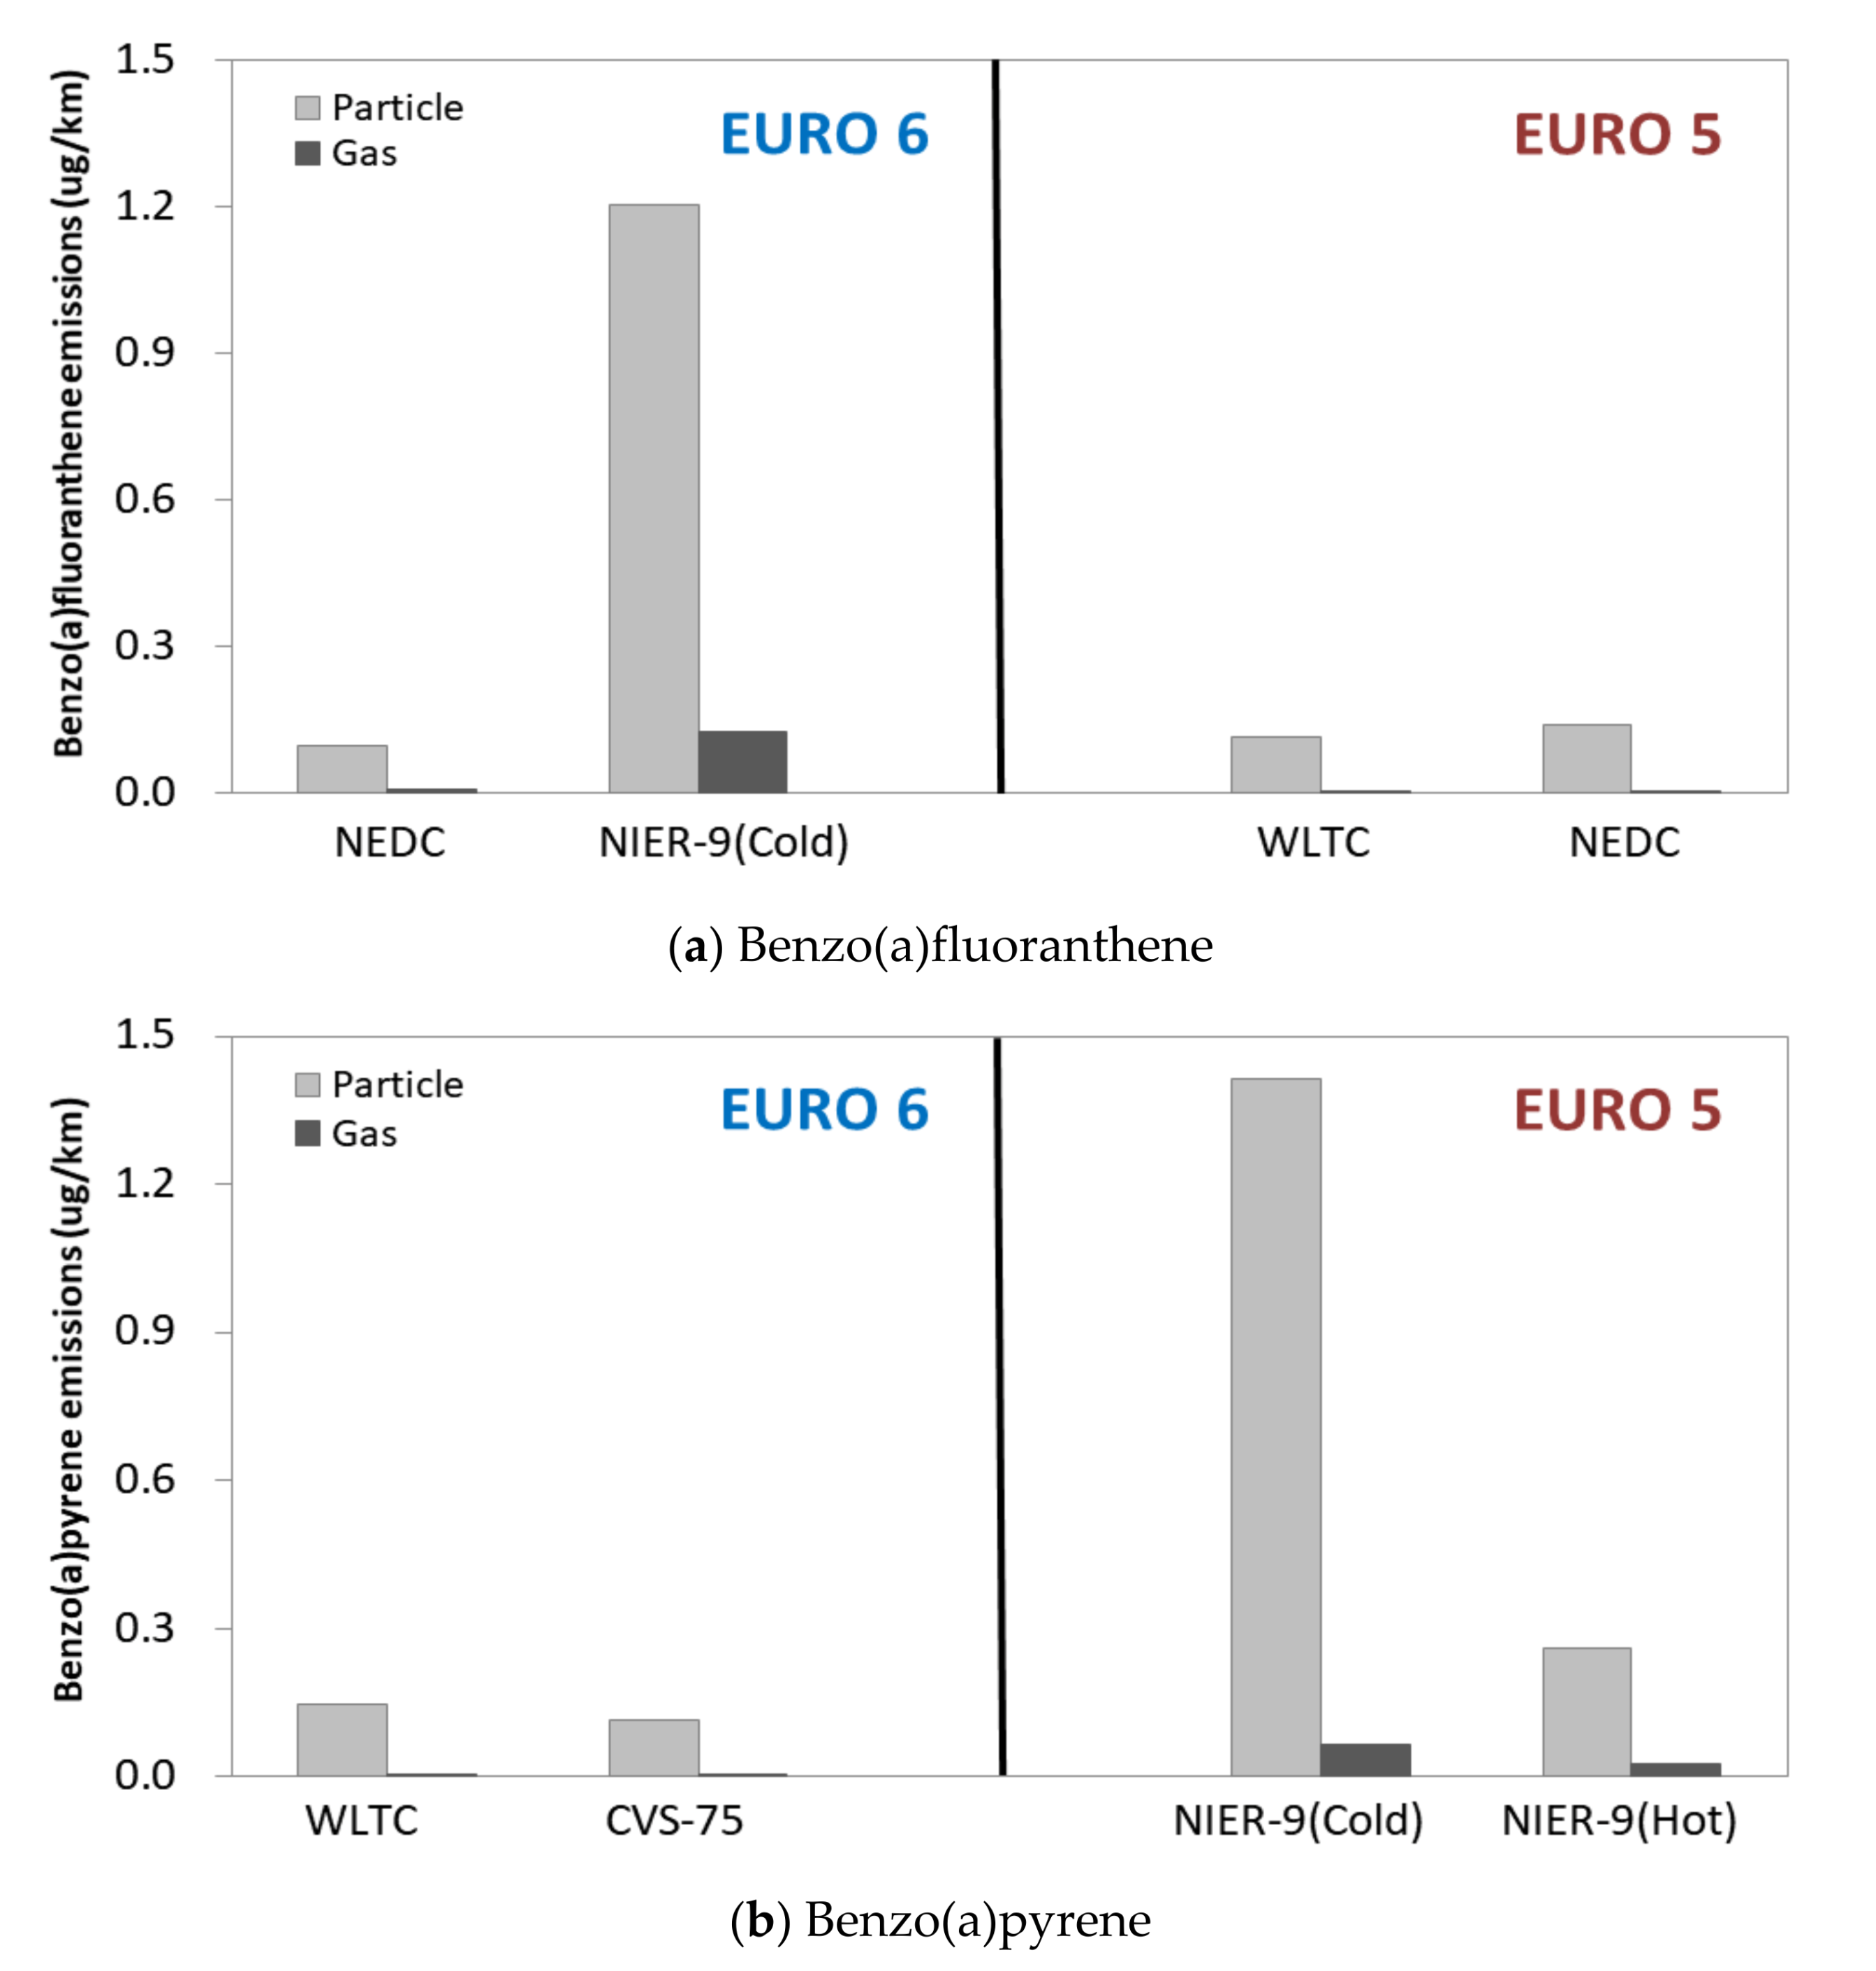
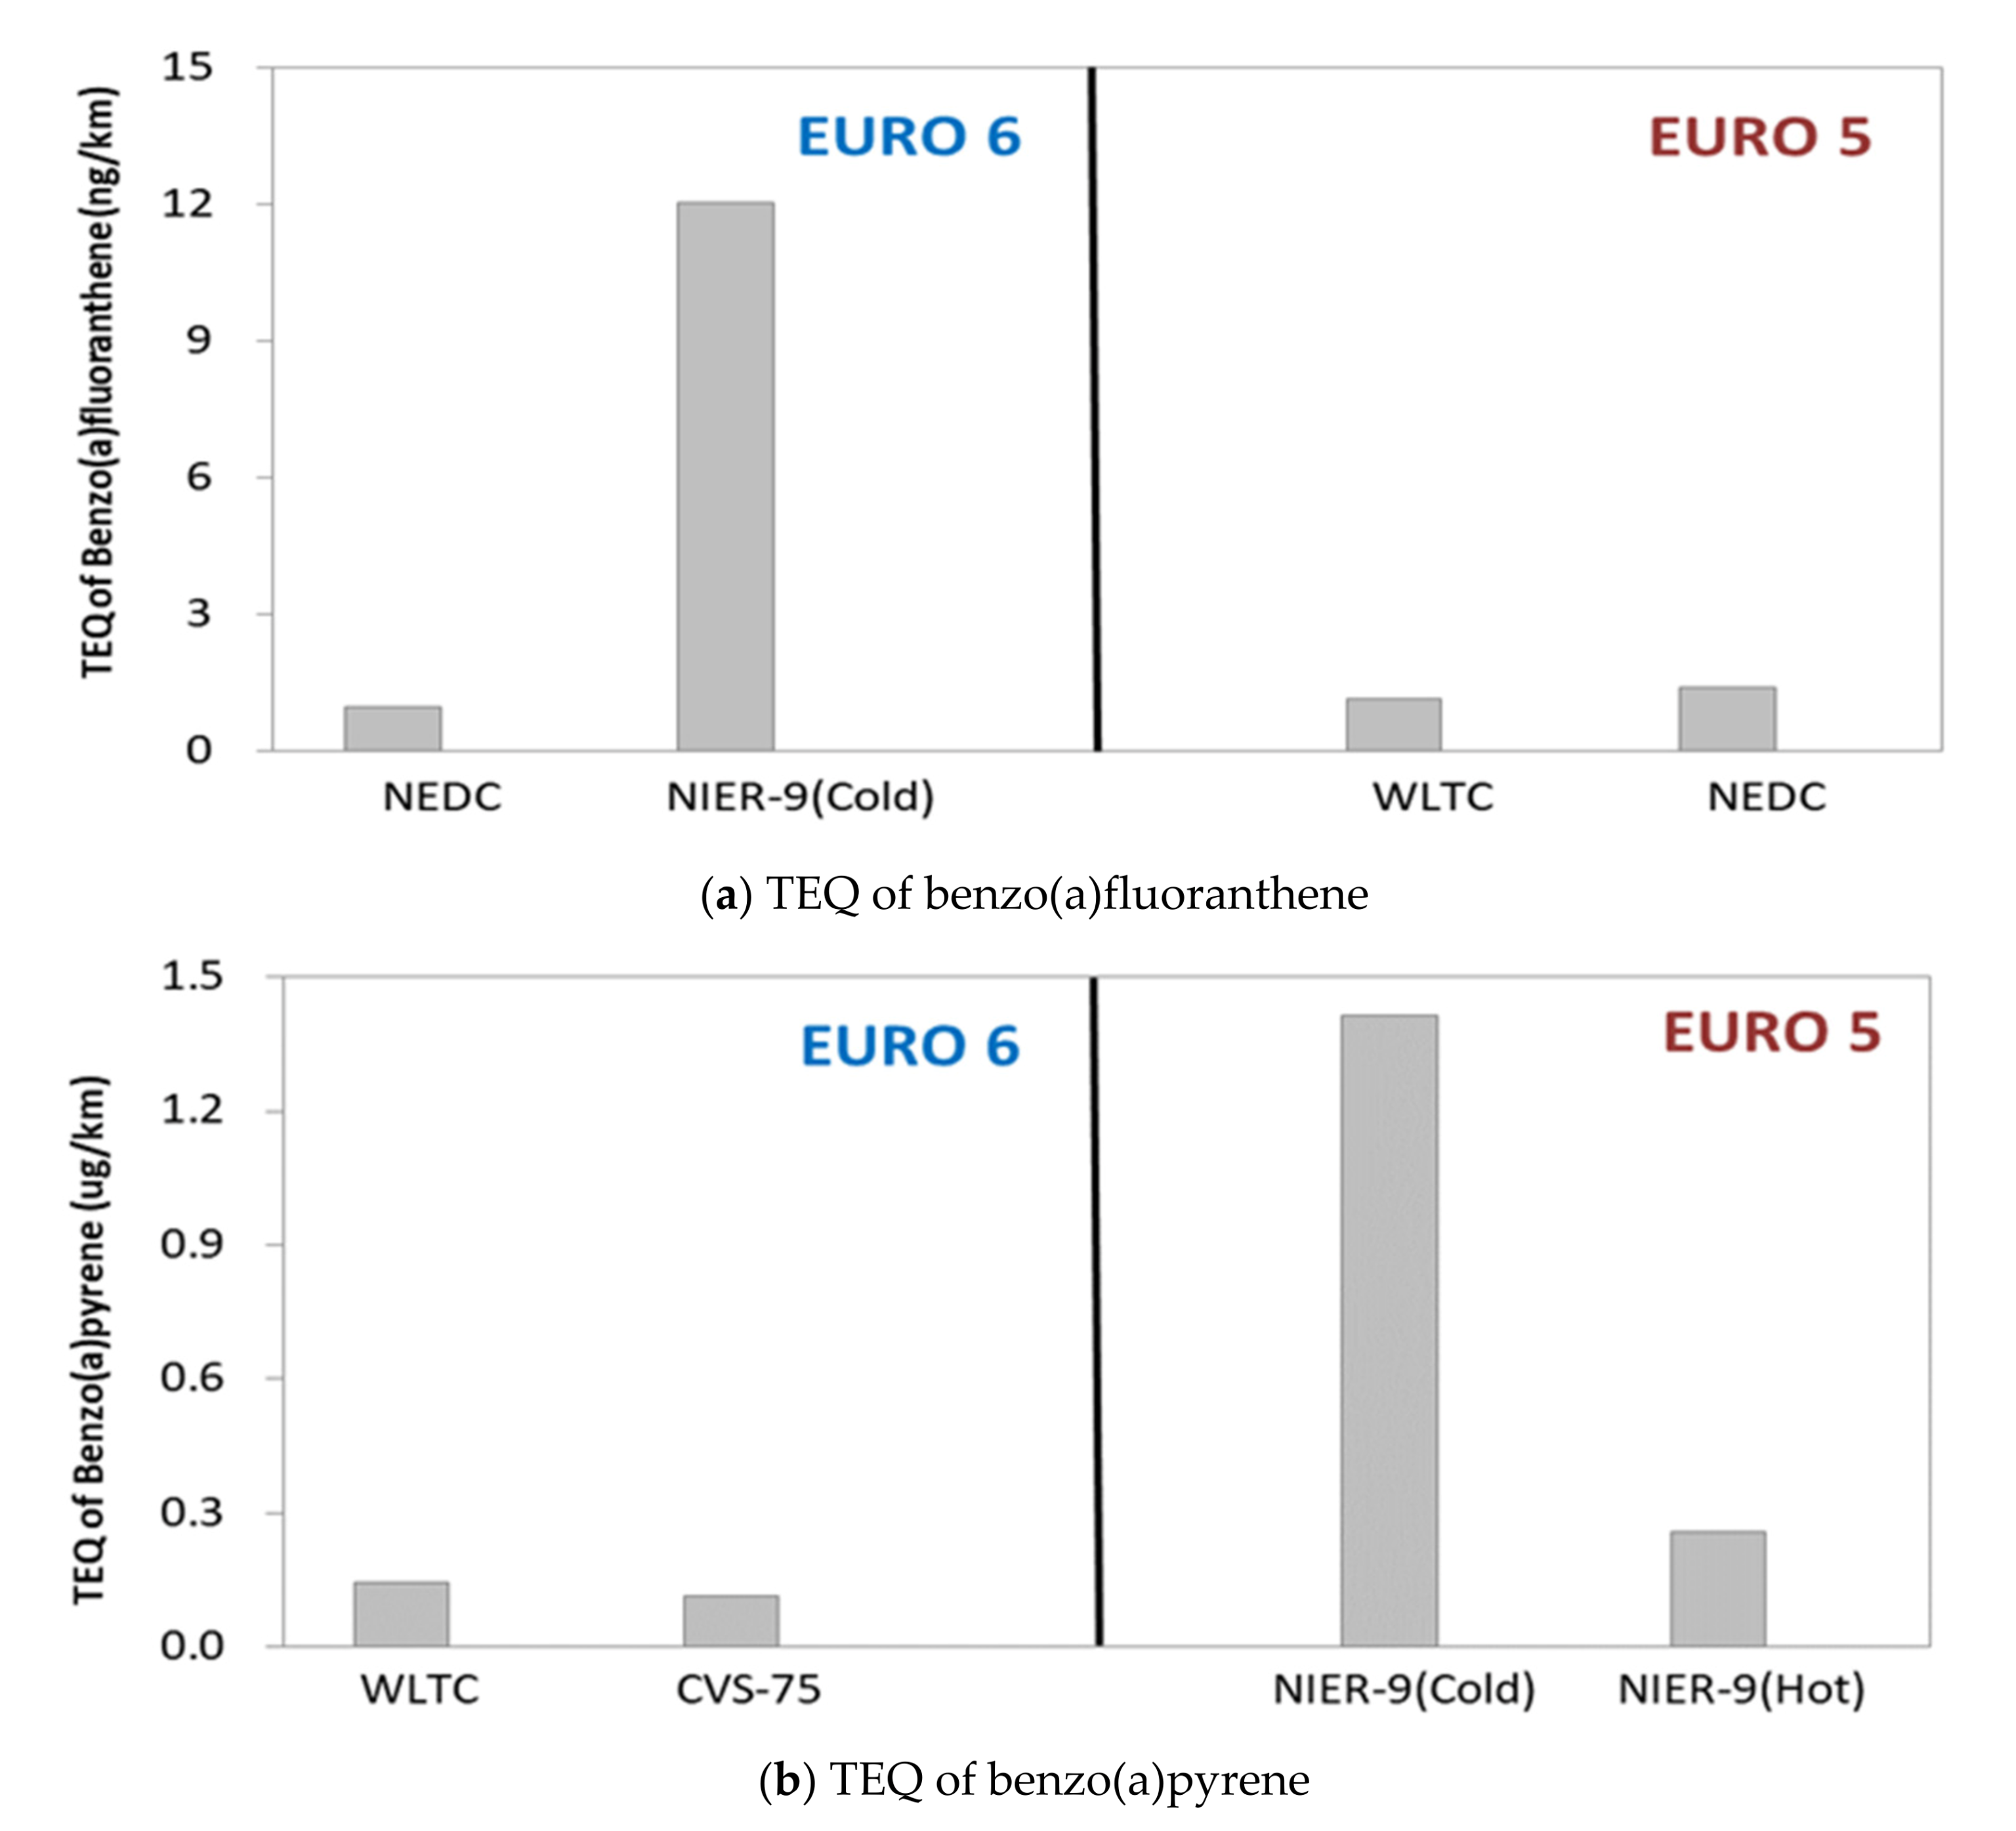
3.2. Emission Characteristics of HAPs

As for the components of NMVOCs, alkanes exhibited the highest proportion (36.2–62.5%) in all the test modes of the Euro 6 and Euro 5 vehicles, followed by aromatics (14.4–40.1%), alkenes (8.0–34.9), and cycloalkanes (1.7–12.7%), as shown in Figure 5. Alkanes showed the highest proportion because they have lower reactivity in the DOC than in the other components [31,32].
Table 8 shows the five major chemical components in the NMVOC emissions for each regulatory standard and test mode. For Euro 6, benzene emissions (0.19–1.01 mg/km) were the highest in the WLTC, NEDC, CVS-75, and NIER-9 (hot) cycles, and dodecane emissions (1.72 mg/km) were the highest in the NIER-9 (cold). For Euro 5, the highest emissions were benzene (0.38 mg/km) in the WLTC, propylene (0.91 mg/km) in the NEDC, and dodecane (0.41–1.91 mg/km) in the CVS-75 and NIER-9 (cold and hot) cycles. The rankings of chemical components of the emissions varied based on the regulatory standard and test mode, and they are known to be influenced by emission reduction devices, driving conditions, and engine start conditions [15,16].
As for aldehyde emissions, formaldehyde emissions (0.44–3.71 mg/km) were the highest for all regulatory standards and test modes, followed by acetaldehyde (0.22–1.97 mg/km) and acrolein (0.29–1.69 mg/km) emissions as shown in Figure 6. Formaldehyde (34.6–52.8%) and acetaldehyde (20.5–34.1%) were present in high proportions. Formaldehyde emissions are known to be the highest from diesel trucks, followed by acetaldehyde emissions among the aldehydes [7,22]. A similar tendency (formaldehyde 48% and acetaldehyde 21%) was observed in heavy-duty diesel trucks [33]. In the NEDC, the aldehyde emissions were the highest. In the case of the NIER-9, they were 1.0–1.9 times higher under the cold-start condition compared to the hot-start condition. The aldehydes from biofuels showed that a higher temperature during pyrolysis processing increased the content of aldehydes [23].
In this study, 16 particle-phase PAHs in PM were analyzed, whereas gas-phase PAHs were not sampled. In the atmosphere, PAHs are present as semi-volatile compounds in both the gas and particle phases [34]. For total PAH concentrations, gas-phase PAHs were estimated using the gas–particle partition coefficient (KP) calculated for five low molecular weight PAH compounds [35] based on previously established models [35,36,37,38] using the following equation:
KP = (F/TSP)/A
where, KP is the gas–particle partition coefficient (μg/m3), TSP is the concentration of total suspended particulate material (μg/m3), F is the particle phase concentration of PAHs (μg/m3), and A is the gaseous phase concentration of PAHs (μg/m3).
Figure 7 shows the total PAH emissions (gas + particle phase) estimated in this study. For the test cycles on the x-axis, only the cycles in which the substances were detected were indicated. For the benzo(k)fluoranthene, 0.14–1.33 μg/km for Euro 6 and 0.12–0.15 μg/km for Euro 5 were estimated. For the benzo(a)pyrene, 0.11–0.15 μg/km for Euro 6 and 0.21–0.28 μg/km for Euro 5 were estimated. The results showed that 68.7–99.8% of benzo(k)fluoranthene and 90.7–98.1% benzo(a)pyrene were in the particle phase. According to Akyüz and Çabuk (2010), high molecular weight PAHs (4–5 rings) are mainly associated with the particle phase. When the KP·TSP is larger than 1, the compound partitions dominantly to the particle phase; a KP·TSP smaller than 1 indicates partitioning dominantly to the gaseous phase [39]. It appears that some PAHs were detected in trace amounts because of the high PM reduction rate as DPF was installed in all the test vehicles. Hu et al. (2013) [22] reported that vehicles with DPF can efficiently reduce emission of PAHs by more than 90%. In addition, standards for PAH emissions from high-quality diesel fuel have been made more stringent [21]. According to Li et al. (2020), four species of PAHs from biofuels were released at a temperature of 800 °C. The relative content of PAHs was clearly detected at a temperature of 750 °C rather than 650 °C [23]. In this study, the tested diesel fuel satisfied the high-quality diesel fuel standard specified limits for sulfur, PAHs, lubrication, and aromatic compounds.
The toxicity equivalent factor (TEF) method is commonly used and is reliable for the evaluation of carcinogenicity of the identified PAHs. [14,15,18,40,41]. Since Nisbet and LaGoy (1992) put forward the concept of TEF based on the toxicity of PAHs (Table 9), benzo(a)pyrene is usually used as a reference compound to derive the TEQ of PAHs [14,15,18,40,41].
TEQ is a classic method to evaluate the toxicities of particles, and it is calculated as follows:
TEQ = ∑ Ci × TEFi
where, Ci denotes the concentration of an individual i PAH.
Figure 8 depicts the TEQ of the two identified PAHs based on driving conditions. For the test cycles on the x-axis, only the cycles in which the substances were detected were indicated. The two identified PAHs had a 5-ring structure, but the TEQ of benzo(a)pyrene was 100 times higher than that of benzo(a)fluoranthene because of a more bay-region-like benzene ring structure, which could cause more mutagenicity and carcinogenicity compared to linear-structured PAHs [42,43,44].
Notably, the TEQs of benzo(a)pyrene and benzo(a)fluoranthene emitted from NIER-9 (cold) were more than 5 times and 12 times higher than that of NIER (hot) and NEDC for each Euro 5 and Euro 6 vehicles, respectively, implying that sufficient warm-up of vehicles could prevent the emission of carcinogenic aromatic compounds.
Moreover, only two 5-ring PAHs were identified because of the equipped after-treatment systems such as DPF and LNT, which reduce the particle phase emission of PAHs from the tested vehicles [45].

3.3. Speciation of HAPs and Selection of Priority Management Pollutants

In this study, HAPs speciation was derived based on the NMHC emissions of medium-duty diesel trucks measured in various test cycles. As shown in Table 10, formaldehyde tended to exhibit the highest proportion (9.8–44.6%) in terms of all the regulatory standards and test modes, and a tendency similar to that of the European Environment Agency (EEA) [46] was observed. The proportion of formaldehyde was relatively the highest in both Euro 6 and Euro 5. The proportion of benzene was higher for Euro 6 than for Euro 5. When the speciation was derived during various test cycles based on each relevant regulatory standard, there were differences in speciation between the overseas driving cycles and the domestic driving cycle, confirming that the consideration of the domestic situation is important. In addition, it is deemed necessary to consider formaldehyde and benzene, which are carcinogens, as priority management pollutants through continuous monitoring.

4. Conclusions

In this study, measurement-based speciation that reflects the domestic situation was derived, and priority management pollutants were identified by investigating the emission characteristics of regulated pollutants and VOCs, aldehydes, and PAHs using various test modes for medium-duty diesel trucks. In contrast to previous studies, we researched the emission characteristics and speciation of unregulated air pollutants from medium-duty diesel trucks while also considering various driving cycles (WLTC, NEDC, CVS-75, and NIER-9), emission standards (Euro 5 and Euro 6), engine start conditions (cold- and hot-start temperatures), and after-treatment systems (DPF + LNT and DPF). When the emission characteristics of the regulated pollutants from medium-duty diesel trucks were investigated, the CO and NMHC emissions were highest in the NEDC mode because its low-speed driving time was longer compared to the other modes. In the SMA, CO and NMHC were increased during the urban driving cycle. NOx emissions were higher in the WLTC than in the other cycles because of the influence of thermal NOx caused by the high-speed section. PM emissions were 0.001 g/km or less because of the influence of the DPF installation in the test vehicles.
When the emission characteristics of HAPs were investigated, alkanes exhibited the highest proportion among the components of NMVOCs because they have a lower reactivity in DOC than those of the other components. Among the components of NMVOCs, benzene, propylene, and dodecane exhibited the highest emissions. The rankings of the chemical components in terms of emissions differed based on the test mode because of the influence of emission reduction devices as well as the engine and driving conditions. As for aldehydes, formaldehyde emissions were the highest in all the regulatory standards and test modes followed by acetaldehyde and acrolein emissions. For PAHs, only benzo(k)fluoranthene and benzo(a)pyrene were detected in trace amounts because PM emissions were low owing to the influence of the DPF installation. The benzo(k)fluoranthene and benzo(a)pyrene were over 69% and over 91% in the particle phase, respectively. We detected benzo(k)fluoranthene and benzo(a)pyrene in the particle-phase PAHs and estimated the concentrations of the gas-phase PAHs with models to obtain the total PAH concentrations. The TEQ of two identified PAHs (benzo(k)fluoranthene and benzo(a)pyrene) from NIER-9 (cold) for the Euro 5 and Euro 6 vehicles each were more than 5 times and 12 times higher than NIER (hot) and NEDC, respectively.
When HAPs speciation was derived from the NMHC emission results of the medium-duty diesel trucks measured in various test cycles, formaldehyde exhibited the highest proportion in all regulatory standards and test cycles, and a tendency similar to that of the EEA was observed. Differences in speciation between the domestic and overseas test cycles indicated the importance of considering the domestic situation. The carcinogens, formaldehyde and benzene, were identified as priority management pollutants that required continuous monitoring. The HAP speciation from medium-duty diesel trucks and the priority management pollutants identified in this study are expected to form the basis for policy implementation that will ensure the reduction of HAPs from domestic mobile sources in the SMA, where automobiles have a significant influence on air pollution. It is expected that the results will be utilized by inventory establishment researchers and air pollution reduction policy makers.

Author Contributions

Conceptualization, S.J.; Formal analysis, S.J.; Investigation, S.J., S.K., T.C., H.H. and S.L.; Methodology, S.J.; Writing–original draft, S.J.; Writing–review & editing, S.J. and J.L. All authors have read and agreed to the published version of the manuscript.

Funding

This work was supported by a grant from the National Institute of Environmental Research (NIER) funded by the Ministry of Environment (MOE) of the Republic of Korea (ex: NIER-2018-01-01-071).

Institutional Review Board Statement

Not applicable.

Informed Consent Statement

Not applicable.

Data Availability Statement

Not applicable.

Conflicts of Interest

The authors declare no conflict of interest.

Abbreviations

HAPshazardous air pollutants
VOCsvolatile organic compounds
PAHspolycyclic aromatic hydrocarbons
NMHCnon-methane hydrocarbon
WLTCworldwide harmonized light duty driving test cycle
NEDCnew European driving cycle
CVSconstant volume sampler
NIERNational Institute of Environmental Research
NMVOCnon-methane volatile organic compound
SMASeoul Metropolitan Area
TEQtoxic equivalency quantity
DPFdiesel particulate filter
SCRselective catalytic reduction
DOCdiesel oxidation catalysts
EGRexhaust gas recirculation
LNTlean NOx trap
UDCurban driving cycle
EUDCextra-urban driving cycle
FTPfederal test procedure
NDIRnondispersive infrared
THCtotal hydrocarbons
HFIDheated flame ionization detector
CLDchemiluminescence detector
PNparticle number
KPgas–particle partition coefficient (μg/m3)
TSPconcentration of total suspended particulate material (μg/m3)
Fparticle phase concentration of PAHs (μg/m3)
Agaseous phase concentration of PAHs (μg/m3)
TEFtoxicity equivalent factor
EEAEuropean Environmental Agency

References

  1. Ministry of Land, Transport, Maritime Affairs (MLTMA). Automobile Registration Statistics (2019); Ministry of Land, Transport, Maritime Affairs: Sejong, Korea, 2020. [Google Scholar]
  2. National Center for Fine Dust Information (NCFDI). National Air Pollutant Emission Service. Available online: http://airemiss.nier.go.kr (accessed on 20 March 2021).
  3. National Institute of Environmental Research (NIER). Study on Emission Characteristics of Hazardous Air Pollutants in Vehicle; National Institute of Environmental Research: Incheon, Korea, 2018. [Google Scholar]
  4. Jung, S.; Lim, J.; Kwon, S.; Jeon, S.; Kim, J.; Lee, J.; Kim, S. Characterization of particulate matter from diesel passenger cars tested on chassis dynamometers. J. Environ. Sci. 2017, 54, 21–32. [Google Scholar] [CrossRef]
  5. National Institute of Environmental Research (NIER). A Study on the Estimation of the HAPs Emission Factors for the Mobile Source (Ⅲ); National Institute of Environmental Research: Incheon, Korea, 2006. [Google Scholar]
  6. National Institute of Environmental Research (NIER). The Emission Characteristics of Mobile Source Air Toxics and Management Strategy (IV); National Institute of Environmental Research: Incheon, Korea, 2017. [Google Scholar]
  7. Kumar, S.; Nayek, M.; Tandon, A.; Mondal, P.; Vijay, P.; Bhangale, U.D.; Tyagi, D. Aldehyde, Ketone and Methane Emissions from Motor Vehicle Exhaust: A Critical Review. Am. Chem. Sci. J. 2011, 1, 1–27. [Google Scholar] [CrossRef] [Green Version]
  8. Han, J.-S.; Lee, M.-D.; Lim, Y.-J.; Lee, S.-U.; Kim, Y.-M.; Kong, B.-J.; An, J.-Y.; Hong, Y.-D. Study on the distributions of VOCs, aldehydes, PAHs concentration in Seoul metropolitan area. J. Korean Soc. Atmos. Environ. 2006, 22, 574–589. [Google Scholar]
  9. Wang, J.; Jin, L.; Gao, J.; Shi, J.; Zhao, Y.; Liu, S.; Jin, T.; Bai, Z.; Wu, C.-Y. Investigation of speciated VOC in gasoline vehicular exhaust under ECE and EUDC test cycles. Sci. Total Environ. 2013, 445–446, 110–116. [Google Scholar] [CrossRef]
  10. Costagliola, M.A.; Murena, F.; Prati, M.V. Exhaust emissions of volatile organic compounds of powered two-wheelers: Effect of cold start and vehicle speed. Contribution to greenhouse effect and tropospheric ozone formation. Sci. Total Environ. 2014, 468–469, 1043–1049. [Google Scholar] [CrossRef] [PubMed]
  11. Li, L.; Ge, Y.; Wang, M.; Li, J.; Peng, Z.; Song, Y.; Zhang, L. Effect of gasoline/methanol blends on motorcycle emissions: Exhaust and evaporative emissions. Atmos. Environ. 2015, 102, 79–85. [Google Scholar] [CrossRef]
  12. Pěnčíková, K.; Ciganek, M.; Neča, J.; Illés, P.; Dvořák, Z.; Vondráček, J.; Machala, M. Modulation of endocrine nuclear receptor activities by polyaromatic compounds present in fractionated extracts of diesel exhaust particles. Sci. Total Environ. 2019, 677, 626–636. [Google Scholar] [CrossRef]
  13. Lim, J.; Lim, C.; Kim, S.; Hong, J. Characterizations of organic compounds in diesel exhaust particulates. J. Environ. Sci. 2015, 34, 171–183. [Google Scholar] [CrossRef]
  14. Zhang, Z.; Balasubramanian, R. Effects of oxygenated fuel blends on the composition of size-segregated engine-out diesel particulate emissions and on the toxicity of quasi-ultrafine particles. Fuel 2018, 215, 161–170. [Google Scholar] [CrossRef]
  15. Zhou, S.; Zhou, J.; Zhu, Y. Chemical composition and size distribution of particulate matters from marine diesel engines with different fuel oils. Fuel 2019, 235, 972–983. [Google Scholar] [CrossRef]
  16. Jung, S.; Mun, S.; Chung, T.; Kim, S.; Seo, S.; Kim, I.; Hong, H.; Chong, H.; Sung, K.; Kim, J.; et al. Emission Characteristics of Regulated and Unregulated Air Pollutants from Heavy Duty Diesel Trucks and Buses. Aerosol Air Qual. Res. 2019, 19, 431–442. [Google Scholar] [CrossRef]
  17. Jung, S.; Kim, S.; Lim, Y.; Lee, J.; Chung, T.; Hong, H.; Mun, S.; Lee, S.; Jang, W.; Lim, J. Emission Characteristics of Hazardous Air Pollutants from Construction Equipment. Aerosol Air Qual. Res. 2020, 20, 2012–2024. [Google Scholar] [CrossRef]
  18. Lim, J.; Lim, C.; Jung, S. Characterizations of Size-segregated Ultrafine Particles in Diesel Exhaust. Aerosol Air Qual. Res. 2021, 21, 21. [Google Scholar] [CrossRef]
  19. Dong, D.; Shao, M.; Li, Y.; Lu, S.; Wang, Y.; Ji, Z.; Tang, D. Carbonyl emissions from heavy-duty diesel vehicle exhaust in China and the contribution to ozone formation potential. J. Environ. Sci. 2014, 26, 122–128. [Google Scholar] [CrossRef]
  20. George, I.J.; Hays, M.D.; Snow, R.; Faircloth, J.; George, B.J.; Long, T.; Baldauf, R.W. Cold Temperature and Biodiesel Fuel Effects on Speciated Emissions of Volatile Organic Compounds from Diesel Trucks. Environ. Sci. Technol. 2014, 48, 14782–14789. [Google Scholar] [CrossRef]
  21. Nelson, P.F.; Tibbett, A.R.; Day, S.J. Effects of vehicle type and fuel quality on real world toxic emissions from diesel vehicles. Atmos. Environ. 2008, 42, 5291–5303. [Google Scholar] [CrossRef]
  22. Hu, S.; Herner, J.D.; Robertson, W.; Kobayashi, R.; Chang, M.-C.O.; Huang, S.-M.; Zielinska, B.; Kado, N.; Collins, J.F.; Rieger, P.; et al. Emissions of polycyclic aromatic hydrocarbons (PAHs) and nitro-PAHs from heavy-duty diesel vehicles with DPF and SCR. J. Air Waste Manag. Assoc. 2013, 63, 984–996. [Google Scholar] [CrossRef] [Green Version]
  23. Li, G.; Ji, F.; Bai, X.; Zhou, Y.; Dong, R.; Huang, Z. Comparative study on thermal cracking characteristics and bio-oil production from different microalgae using Py-GC/MS. Int. J. Agric. Biol. Eng. 2019, 12, 208–213. [Google Scholar] [CrossRef]
  24. Li, G.; Bai, X.; Huo, S.; Huang, Z. Fast pyrolysis of LERDADEs for renewable biofuels. IET Renew. Power Gener. 2020, 14, 959–967. [Google Scholar] [CrossRef]
  25. Korea Automobile Manufacturers Association (KAMA). Automobile Registration Statistics (2019); KAMA: Seoul, Korea, 2020. [Google Scholar]
  26. United States Environmental Protection Agency (US EPA). Determination of Volatile Organic Compounds (VOCs) in Ambient Air Using Specially Prepared Canisters with Subsequent Analysis by Gas Chromatography, Method TO-14A; Environmental Protection Agency: Washington, DC, USA, 1999. [Google Scholar]
  27. United States Environmental Protection Agency (US EPA). Determination of Formaldehyde in Ambient Air Using Adsorbent Cartridge Followed by High Performance Liquid Chromatography (HPLC), Method TO-11A; Environmental Protection Agency: Washington, DC, USA, 1999.
  28. United States Environmental Protection Agency (US EPA). Determination of Polycyclic Aromatic Hydrocarbons (PAHs) in Ambient Air Using Gas Chromatography/Mass Spectrometry (GC/MS), Method TO-13A; Environmental Protection Agency: Washington, DC, USA, 1999.
  29. National Institute of Environmental Research (NIER). The Emission Characteristics of Mobile Source Air Toxics and Management Strategy (V); National Institute of Environmental Research: Incheon, Korea, 2018.
  30. Hong, H.; Mun, S.; Seo, S.; Kim, J.; Jung, S.; Chung, T.; Hong, Y.; Sung, K.; Kim, S. Emission Characteristics of Hazardous Air Pollutants from Diesel Heavy Duty Trucks for Euro 5. J. Liq. At. Spray Syst. 2018, 23, 74–80. [Google Scholar]
  31. Knafl, A.; Busch, S.B.; Han, M.; Bohac, S.V.; Assanis, D.N.; Szymkowicz, P.G.; Blint, R.J. Characterizing Light-Off Behavior and Species-Resolved Conversion Efficiencies During In-Situ Diesel Oxidation Catalyst Degreening. SAE Tech. Paper Ser. 2006, 53–62. [Google Scholar] [CrossRef]
  32. Bohac, S.V.; Han, M.; Jacobs, T.J.; López, A.J.; Assanis, D.N.; Szymkowicz, P.G. Speciated Hydrocarbon Emissions from an Automotive Diesel Engine and DOC Utilizing Conventional and PCI Combustion. SAE Tech. Paper Ser. 2006, 41–52. [Google Scholar] [CrossRef]
  33. Yao, Z.; Jiang, X.; Shen, X.; Ye, Y.; Cao, X.; Zhang, Y.; He, K. On-Road Emission Characteristics of Carbonyl Compounds for Heavy-Duty Diesel Trucks. Aerosol Air Qual. Res. 2015, 15, 915–925. [Google Scholar] [CrossRef] [Green Version]
  34. Akyüz, M.; Çabuk, H. Gas–particle partitioning and seasonal variation of polycyclic aromatic hydrocarbons in the atmosphere of Zonguldak, Turkey. Sci. Total Environ. 2010, 408, 5550–5558. [Google Scholar] [CrossRef] [PubMed]
  35. Yamasaki, H.; Kuwata, K.; Miyamoto, H. Effects of ambient temperature on aspects of airborne polycyclic aromatic hydrocarbons. Environ. Sci. Technol. 1982, 16, 189–194. [Google Scholar] [CrossRef]
  36. Pankow, J.F. Review and comparative analysis of the theories on partitioning between the gas and aerosol particulate phases in the atmosphere. Atmos. Environ. 1987, 21, 2275–2283. [Google Scholar] [CrossRef]
  37. Pankow, J.F.; Bidleman, T. Effects of temperature, TSP and per cent non-exchangeable material in determining the gas-particle partitioning of organic compounds. Atmos. Environ. Part A Gen. Top. 1991, 25, 2241–2249. [Google Scholar] [CrossRef]
  38. Pankow, J.F.; Bidleman, T.F. Interdependence of the slopes and intercepts from log-log correlations of measured gas-particle partitioning and vapor pressure-I. Theory and analysis of available data. Atmos. Environ. 1992, 26, 1071–1080. [Google Scholar] [CrossRef]
  39. Volckens, J.; Leith, D. Comparison of methods for measuring gas-particle partitioning of semivolatile compounds. Atmos. Environ. 2003, 37, 3177–3188. [Google Scholar] [CrossRef]
  40. Catino, S.; Tutino, M.; Ruggieri, S.; Marinaccio, C.; Giua, R.; De Gennaro, G.; Corsi, P.; Assennato, G.; Ribatti, D. Angiogenic activity in vivo of the particulate matter (PM10). Ecotoxicol. Environ. Saf. 2017, 140, 156–161. [Google Scholar] [CrossRef]
  41. Tan, P.-Q.; Zhong, Y.-M.; Hu, Z.-Y.; Lou, D.-M. Size distributions, PAHs and inorganic ions of exhaust particles from a heavy duty diesel engine using B20 biodiesel with different exhaust aftertreatments. Energy 2017, 141, 898–906. [Google Scholar] [CrossRef]
  42. Upham, B.L.; Weis, L.M.; Trosko, J.E. Modulated gap junctional intercellular communication as a biomarker of PAH epigenetic toxicity: Structure-function relationship. Environ. Health Perspect. 1998, 106, 975–981. [Google Scholar] [CrossRef] [PubMed]
  43. Rummel, A.M.; Trosko, J.E.; Wilson, M.R.; Upham, B. Polycyclic aromatic hydrocarbons with bay-like regions inhibited gap junctional intercellular communication and stimulated MAPK activity. Toxicol. Sci. 1999, 49, 232–240. [Google Scholar] [CrossRef] [Green Version]
  44. Catterall, F.S.; Coombs, M.M.; Ioannides, C.; Sepiol, J.J.; Wilson, J. Mutagenicity of bay-region amino-substituted cyclopenta[a]phenanthrenes and 2- and 5-aminochrysene. Mutat. Res. Toxicol. Environ. Mutagen. 2001, 492, 7–11. [Google Scholar] [CrossRef]
  45. Jiang, Y.; Yang, J.; Cocker, D.; Karavalakis, G.; Johnson, K.C.; Durbin, T.D. Characterizing emission rates of regulated pollutants from model year 2012 + heavy-duty diesel vehicles equipped with DPF and SCR systems. Sci. Total Environ. 2018, 619-620, 765–771. [Google Scholar] [CrossRef] [Green Version]
  46. Ntziachristos, L.; Samaras, Z.; Kouridis, C. EMEP/EEA Air Pollutant Emission Inventory Guidebook 2016, European Environ Agency. 2017. Available online: https//www.eea.Eur.eu/themes/air/emep-eea-air-pollutant-emission-inventory-guidebook/emep (accessed on 14 December 2018).
Figure 1. Driving pattern of in (a) WLTC, (b) NEDC, (c) CVS-75, and (d) NIER-9 cycles.
Sustainability 13 07834 g001aSustainability 13 07834 g001b
Figure 2. Schematic diagram of exhaust emission test system.
Sustainability 13 07834 g002
Figure 3. Emission characteristics of (a) CO, (b) NMHC, and (c) NOx from medium-duty diesel trucks according to driving cycles. All data points represent an average of triplicate measurements with a standard deviation.
Sustainability 13 07834 g003
Figure 4. Emission characteristics of (a) PM and (b) PN from medium-duty diesel trucks according to driving cycles. All data points represent an average of triplicate measurements with a standard deviation.
Sustainability 13 07834 g004
Figure 5. NMVOCs composition of medium-duty diesel trucks according to driving cycles.
Sustainability 13 07834 g005
Figure 6. Emission characteristics of (a) formaldehyde, (b) acetaldehyde, and (c) acrolein from medium-duty diesel trucks according to driving cycles. All data points represent an average of triplicate measurements with a standard deviation.
Sustainability 13 07834 g006aSustainability 13 07834 g006b
Figure 7. Emission characteristics of (a) benzo(a)fluoranthene and (b) benzo(a)pyrene from medium-duty diesel trucks according to driving cycles. Particle data points represent an average of triplicate measurements with a standard deviation of (a) 0–0.32 μg/km for NEDC, 0.32–2.10 μg/km for NIER-9 (cold), 0–0.37 μg/km for WLTC, and 0–0.46 μg/km for NEDC; (b) 0–0.33 μg/km for WLTC, 0–0.24 μg/km for CVS-75, 0–2.99 μg/km for NIER-9 (cold); and 0–0.84 μg/km for NIER-9 (hot).
Sustainability 13 07834 g007
Figure 8. Toxicity equivalent quantity (TEQ) of (a) benzo(a)fluoranthene and (b) benzo(a)pyrene from medium-duty diesel trucks according to driving cycles. All data points represent an average of triplicate measurements with a standard deviation of (a) 0–3.16 μg/km for NEDC, 3.16–20.96 μg/km for NIER-9 (cold), 0–3.68 μg/km for WLTC, and 0–4.56 μg/km for NEDC; (b) 0–0.33 μg/km for WLTC, 0–0.24 μg/km for CVS-75, 0–2.99 μg/km for NIER-9 (cold), and 0–0.84 μg/km for NIER-9 (hot).
Sustainability 13 07834 g008
Table 1. Specifications of test vehicles.
Vehicle
Type
Fuel
Type
MakerDisplace-ment (cc)GVW (kg)Max Power
(ps/rpm)
After-Treatment
System a
Emission Standards
Medium-duty
truck
DieselHyundai24972975133/3600DPF + LNTEuro 6
Hyundai24972915133/3800
Hyundai24972945133/3600
Hyundai24973200133/3800
KIA24972985133/3600
Hyundai24973200133/3800DPFEuro 5
KIA24972895133/3800
KIA24972985133/3600
SSangyong19982720155/4000
a Diesel Particulate Filter (DPF); Lean NOx Trap (LNT).
Table 2. Properties of diesel used for testing.
PropertiesResultStandards b
Residual carbon content/10% residual oil (wt %)0.01≤0.15
Density (15 °C, kg/m3)824815–835
Sulfur content (ppm)7≤10
PAHs a (wt %)2≤5
Lubrication (μm)292≤400
Aromatic compounds (wt %)21≤30
Cetane index (or Cetane number)55≥52
a Polycyclic aromatic hydrocarbons. b Korea Ministry of Environment, Air Quality Conservation Law (KME, 2020).
Table 3. Specifications of driving cycles used for testing.
Driving CycleDriving Time
(s)
Driving Distance
(km)
Average Speed
(km/h)
Maximum Speed
(km/h)
WLTC180023.2546.4131.3
NEDC118010.9333.4120.0
CVS-75187417.7736.191.2
NIER-99268.7634.170.9
Table 4. Specifications of exhaust gas analyzer.
PollutantMeasuring MethodMeasuring Conc. Range
CONDIR b50, 100, 300, 3000 ppm
THC aHFID c20, 50, 100, 200 ppmC e
NOxCLD d20, 50, 100, 1000 ppm
CO2NDIR b1, 2, 3, 6%
CH4HFID c10, 20, 50 ppm
a Total hydrocarbons. b Non-dispersive infrared. c Heated flame ionization detector. d Chemiluminescence detector. e The concentration based on carbon is called the carbon equivalent concentration.
Table 5. Analytical conditions for thermal desorber and GC/MS.
MethodEPA TO-14A
ThermaldesorberModelMarkes International/Unity2
PurgePrepurge time (mL/min)1
Trap prepurge time (mL/min)1
SampleSampling time (min)10
Sample flow rate (mL/min)20
Trap desorberTrap low temp. (°C)−15
Trap high temp. (°C)300
Trap hold time (min)5
Split flow (mL/min)30
GC/MSModelAgilent 7890B/Almsco BenchTOF-Select
ColumnDB-1
(60 m × 0.32 mm × 3.00 μm)
Column temp.Temp.
(°C)
Rate
(°C/min)
Hold time
(min)
Total time
(min)
300.030.0030.00
1505.010.0064.00
20015.010.0077.33
Transfer line temp.200
Ion source temp.200
Electron energy70 eV
Ionization modeEI
MS scan range35–350 amu
Table 6. Analytical conditions of UPLC.
MethodEPA TO-11A
ModelWaters US/ACOUITY UPLC
DetectorTUV, 360 nm
ColumnACQUITY UPLC™ BEH C18 1.7 μm 2.1 × 100 mm
Mobile phaseSolvent A: 90% water + 10% tetrahydrofuran (THF)
Solvent B: 100% acetonitrile (ACN)
GradientTime
(min)
Flow
(mL/min)
A(%)B(%)
Initial0.36040
5.00.36040
10.00.30100
12.00.36040
15.00.36040
Flow rate0.3 mL/min
Injection volume2 μL
Table 7. Analytical conditions of GC/MS.
MethodEPA TO-13A
ModelAgilent 7890A/Almsco Bench TOF-dx
ColumnHP-5MS
(30 m × 0.25 mm × 0.25 μm)
Column temp.Temp
(°C)
Rate
(°C/min)
Hold time
(min)
Total time
(min)
50 11
1808017.25
2405029.25
300101045.25
Column flow1 mL/min
Inlet heater300 °C
Split ratio10:1
Injection volume1 μL
Transfer line300 °C
Ion source250 °C
MS san range100–300 amu
Table 8. Comparison of the five major chemical components of NMVOC emissions from diesel medium-duty trucks for driving cycles. All data represent an average of triplicate measurements with a standard deviation.
Euro 6 (Unit: mg/km)
No.WLTCNEDCCVS-75NIER-9(Cold)NIER-9(Hot)
1Benzene0.51 ± 0.53Benzene0.91 ± 1.64Benzene0.19 ± 0.22Dodecane1.72 ± 1.53Benzene1.01 ± 1.04
2Dodecane0.24 ± 0.32Propylene0.35 ± 0.31Undecane0.18 ± 0.25Undecane1.70 ± 1.92Dodecane0.67 ± 0.75
3Undecane0.23 ± 0.28 Undecane0.16 ± 0.21Dodecane0.16 ± 0.23n-Heptane1.18 ± 1.27Undecane0.52 ± 0.62
4Propylene0.13 ± 0.18Dodecane0.13 ± 0.151,2,4-T.M.B. a0.11 ± 0.19n-Decane1.02 ± 1.32Propylene0.43 ± 0.45
5n-Decane0.12 ± 0.151-Butene0.12 ± 0.16n-Decane0.09 ± 0.111,2,4-T.M.B. a0.84 ± 0.91n-Decane0.29 ± 0.27
Euro 5 (Unit: mg/km)
No.WLTCNEDCCVS-75NIER-9(Cold)NIER-9(Hot)
1Benzene0.38 ± 0.63Propylene0.91 ± 0.85Dodecane0.41 ± 0.48Dodecane1.91 ± 1.56Dodecane0.63 ± 0.58
2Propylene0.36 ± 0.35Dodecane0.39 ± 0.36Toluene0.19 ± 0.26Toluene1.18 ± 1.25n-Nonane0.43 ± 0.47
3Dodecane0.16 ± 0.19n-Nonane0.36 ± 0.42Undecane0.16 ± 0.22m,p-Xylene0.78 ± 0.85n-Octane0.41 ± 0.52
4n-Nonane0.14 ± 0.18Benzene0.31 ± 0.25n-Decane0.14 ± 0.17n-Nonane0.76 ± 0.72Methyl C.H. b0.32 ± 0.36
5m,p-Xylene0.13 ± 0.16n-Decane0.28 ± 0.31n-Nonane0.14 ± 0.19Isobutane0.73 ± 0.81Isobutane0.28 ± 0.26
a 1,2,4-trimethylbenzene, b Methylcyclohexane.
Table 9. Chemical parameters and toxic equivalent factors of PAHs.
PAHsAbbreviationRingsMol. WeightToxic Equivalent Factors
Benzo(k)fluorantheneBkFt52520.01
Benzo(a)pyreneBaP52521.0
Table 10. Speciation of hazardous air pollutants from NMHC emissions of medium-duty diesel trucks (unit: %).
CompoundsThis StudyEEA
Euro 6Euro 5
WLTCNEDCCVS-75NIER-9
(Cold)
NIER-9
(Hot)
WLTCNEDCCVS-75NIER-9
(Cold)
NIER-9
(Hot)
Benzene16.0210.466.322.924.892.922.131.543.451.881.98
Toluene2.330.372.151.372.901.511.302.634.961.810.69
Ethylbenzene1.020.160.870.830.220.620.480.862.581.160.29
Xylene2.360.322.051.950.631.491.501.984.402.030.88
Formaldehyde21.0922.7519.3513.4812.4344.6435.9331.409.7514.4912.00
Acetaldehyde16.0222.3013.6810.9714.9214.0816.4917.634.6314.016.47
Acrolein8.2423.4318.1813.1627.998.1812.9311.915.8814.013.58
Publisher’s Note: MDPI stays neutral with regard to jurisdictional claims in published maps and institutional affiliations.

