
Microscopic Modeling of Pedestrian Movement in a Shida Night Market Street Segment: Using Vision and Destination Attractiveness

Abstract
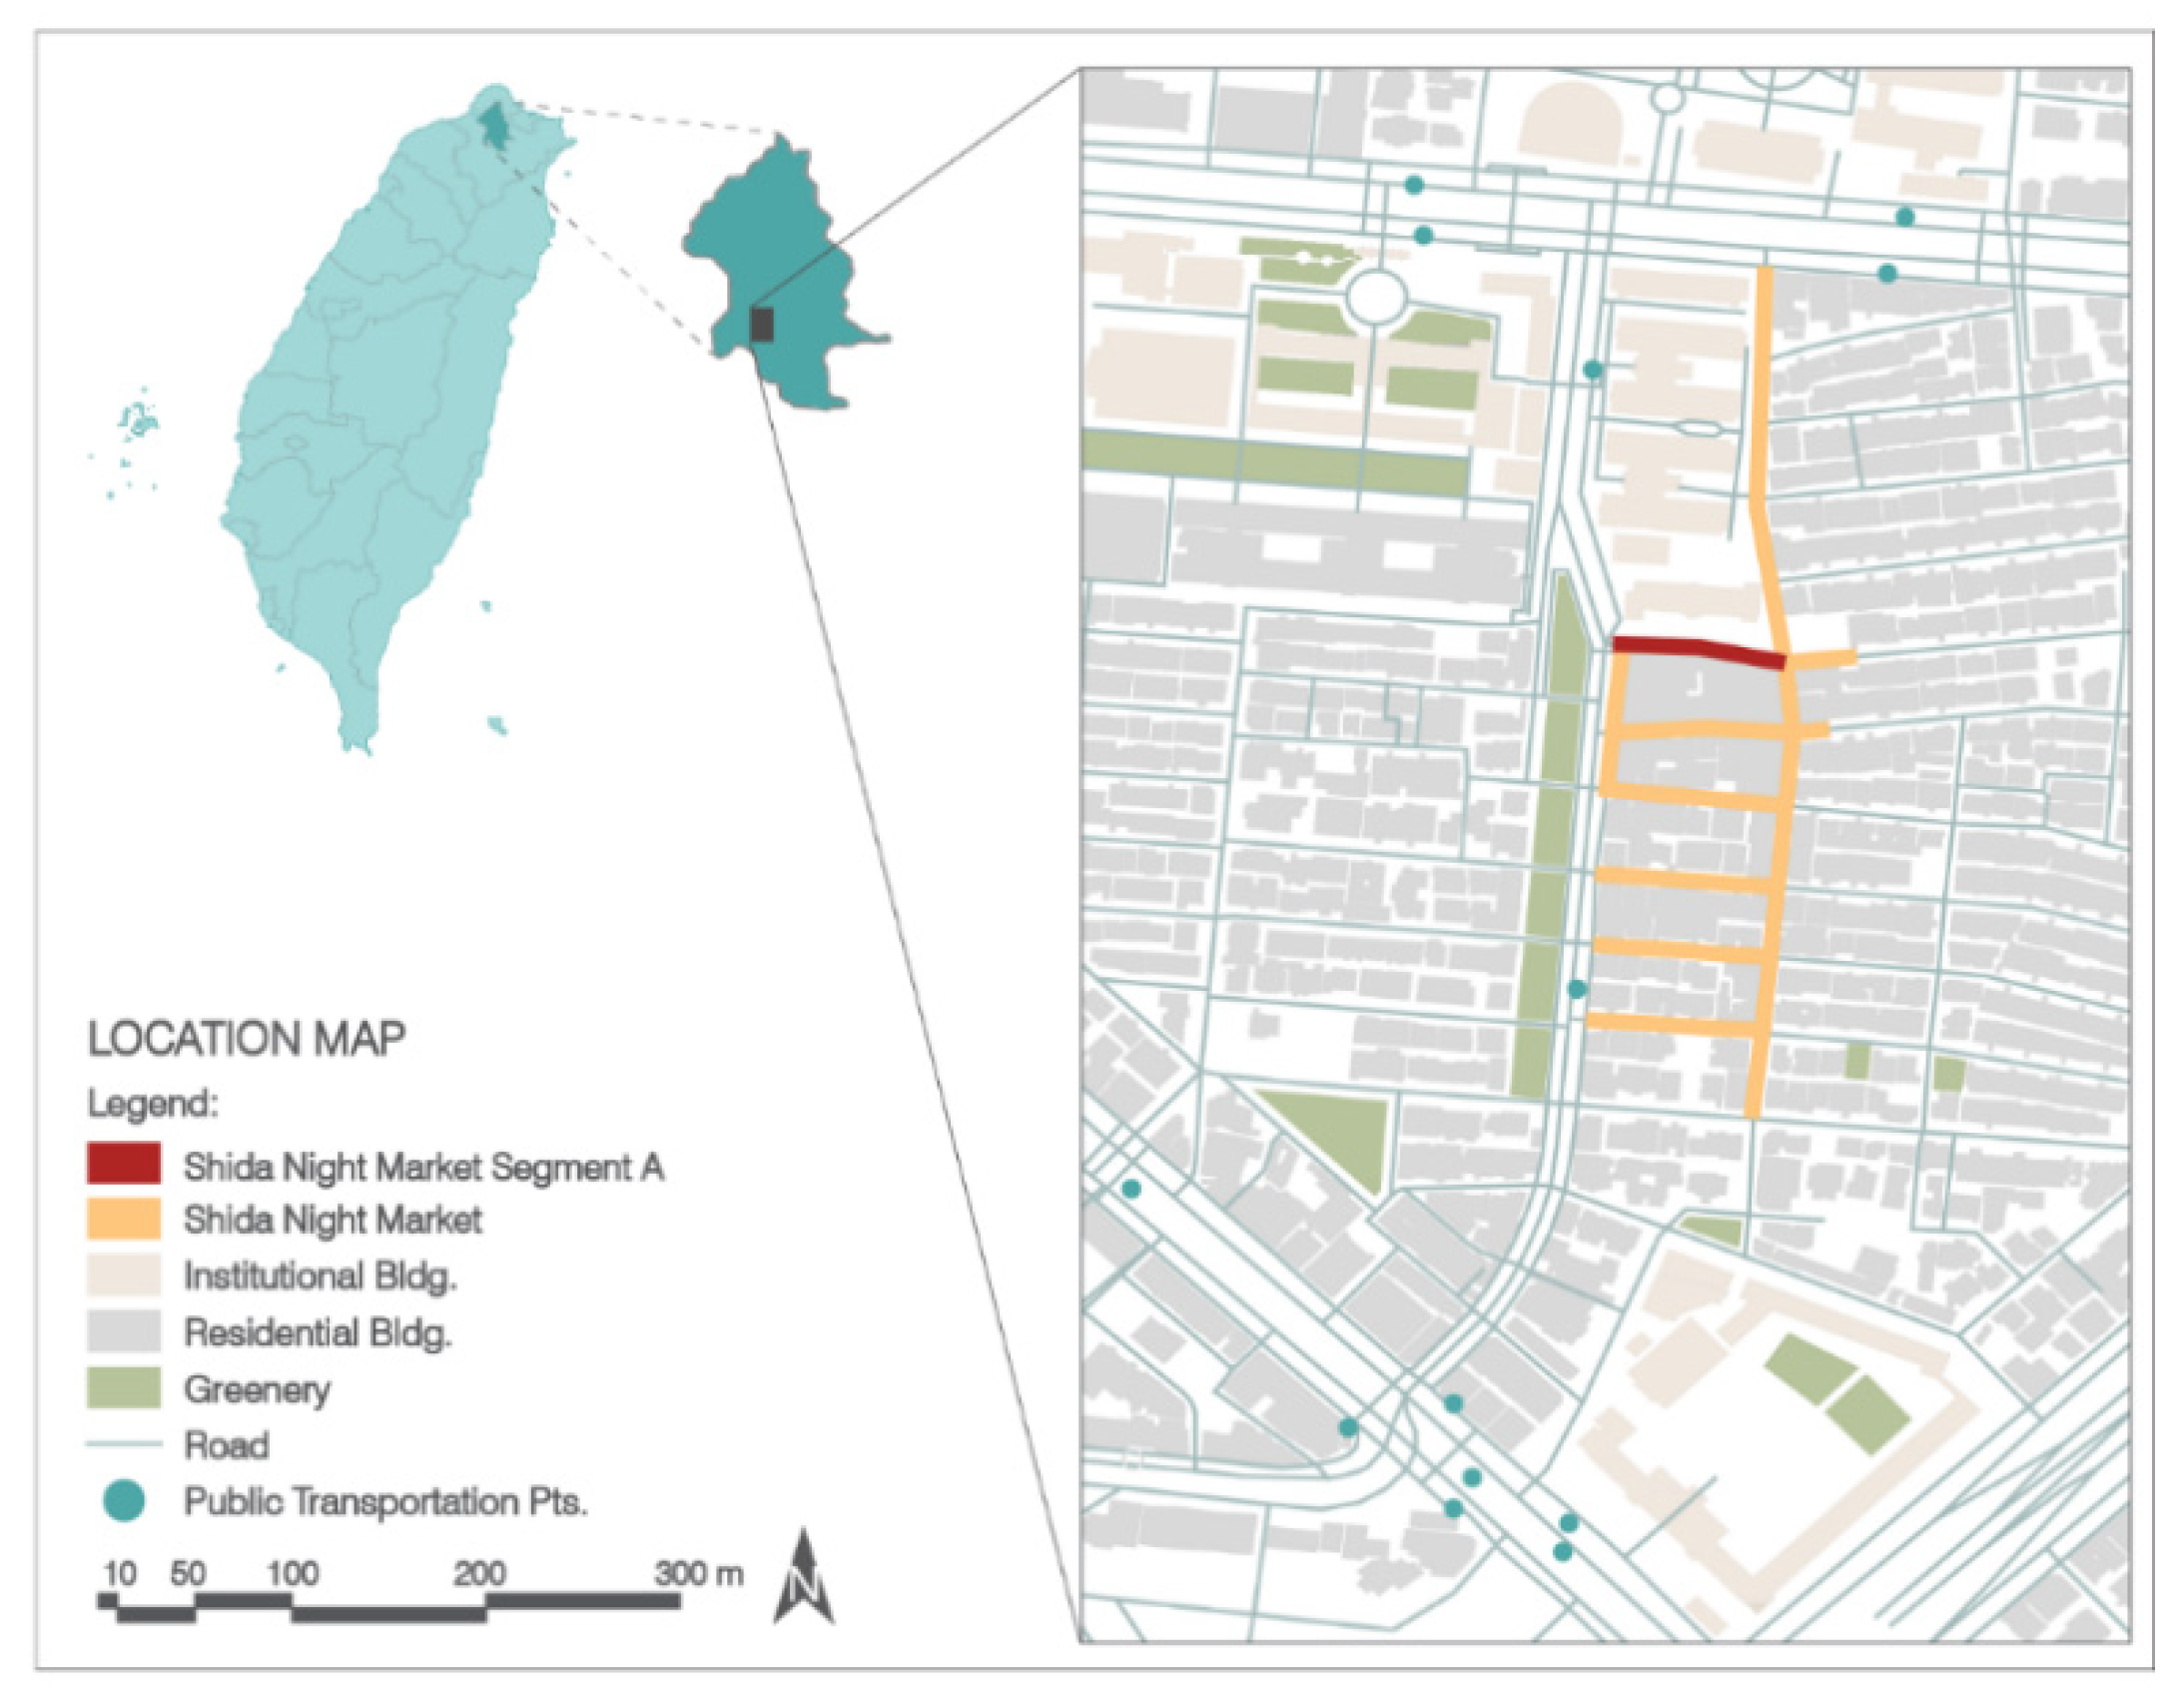
:1. Introduction
2. Materials and Methods
2.1. Data Collection and Analysis
2.1.1. Initial Field Observation, Video Data Collection, and Analysis
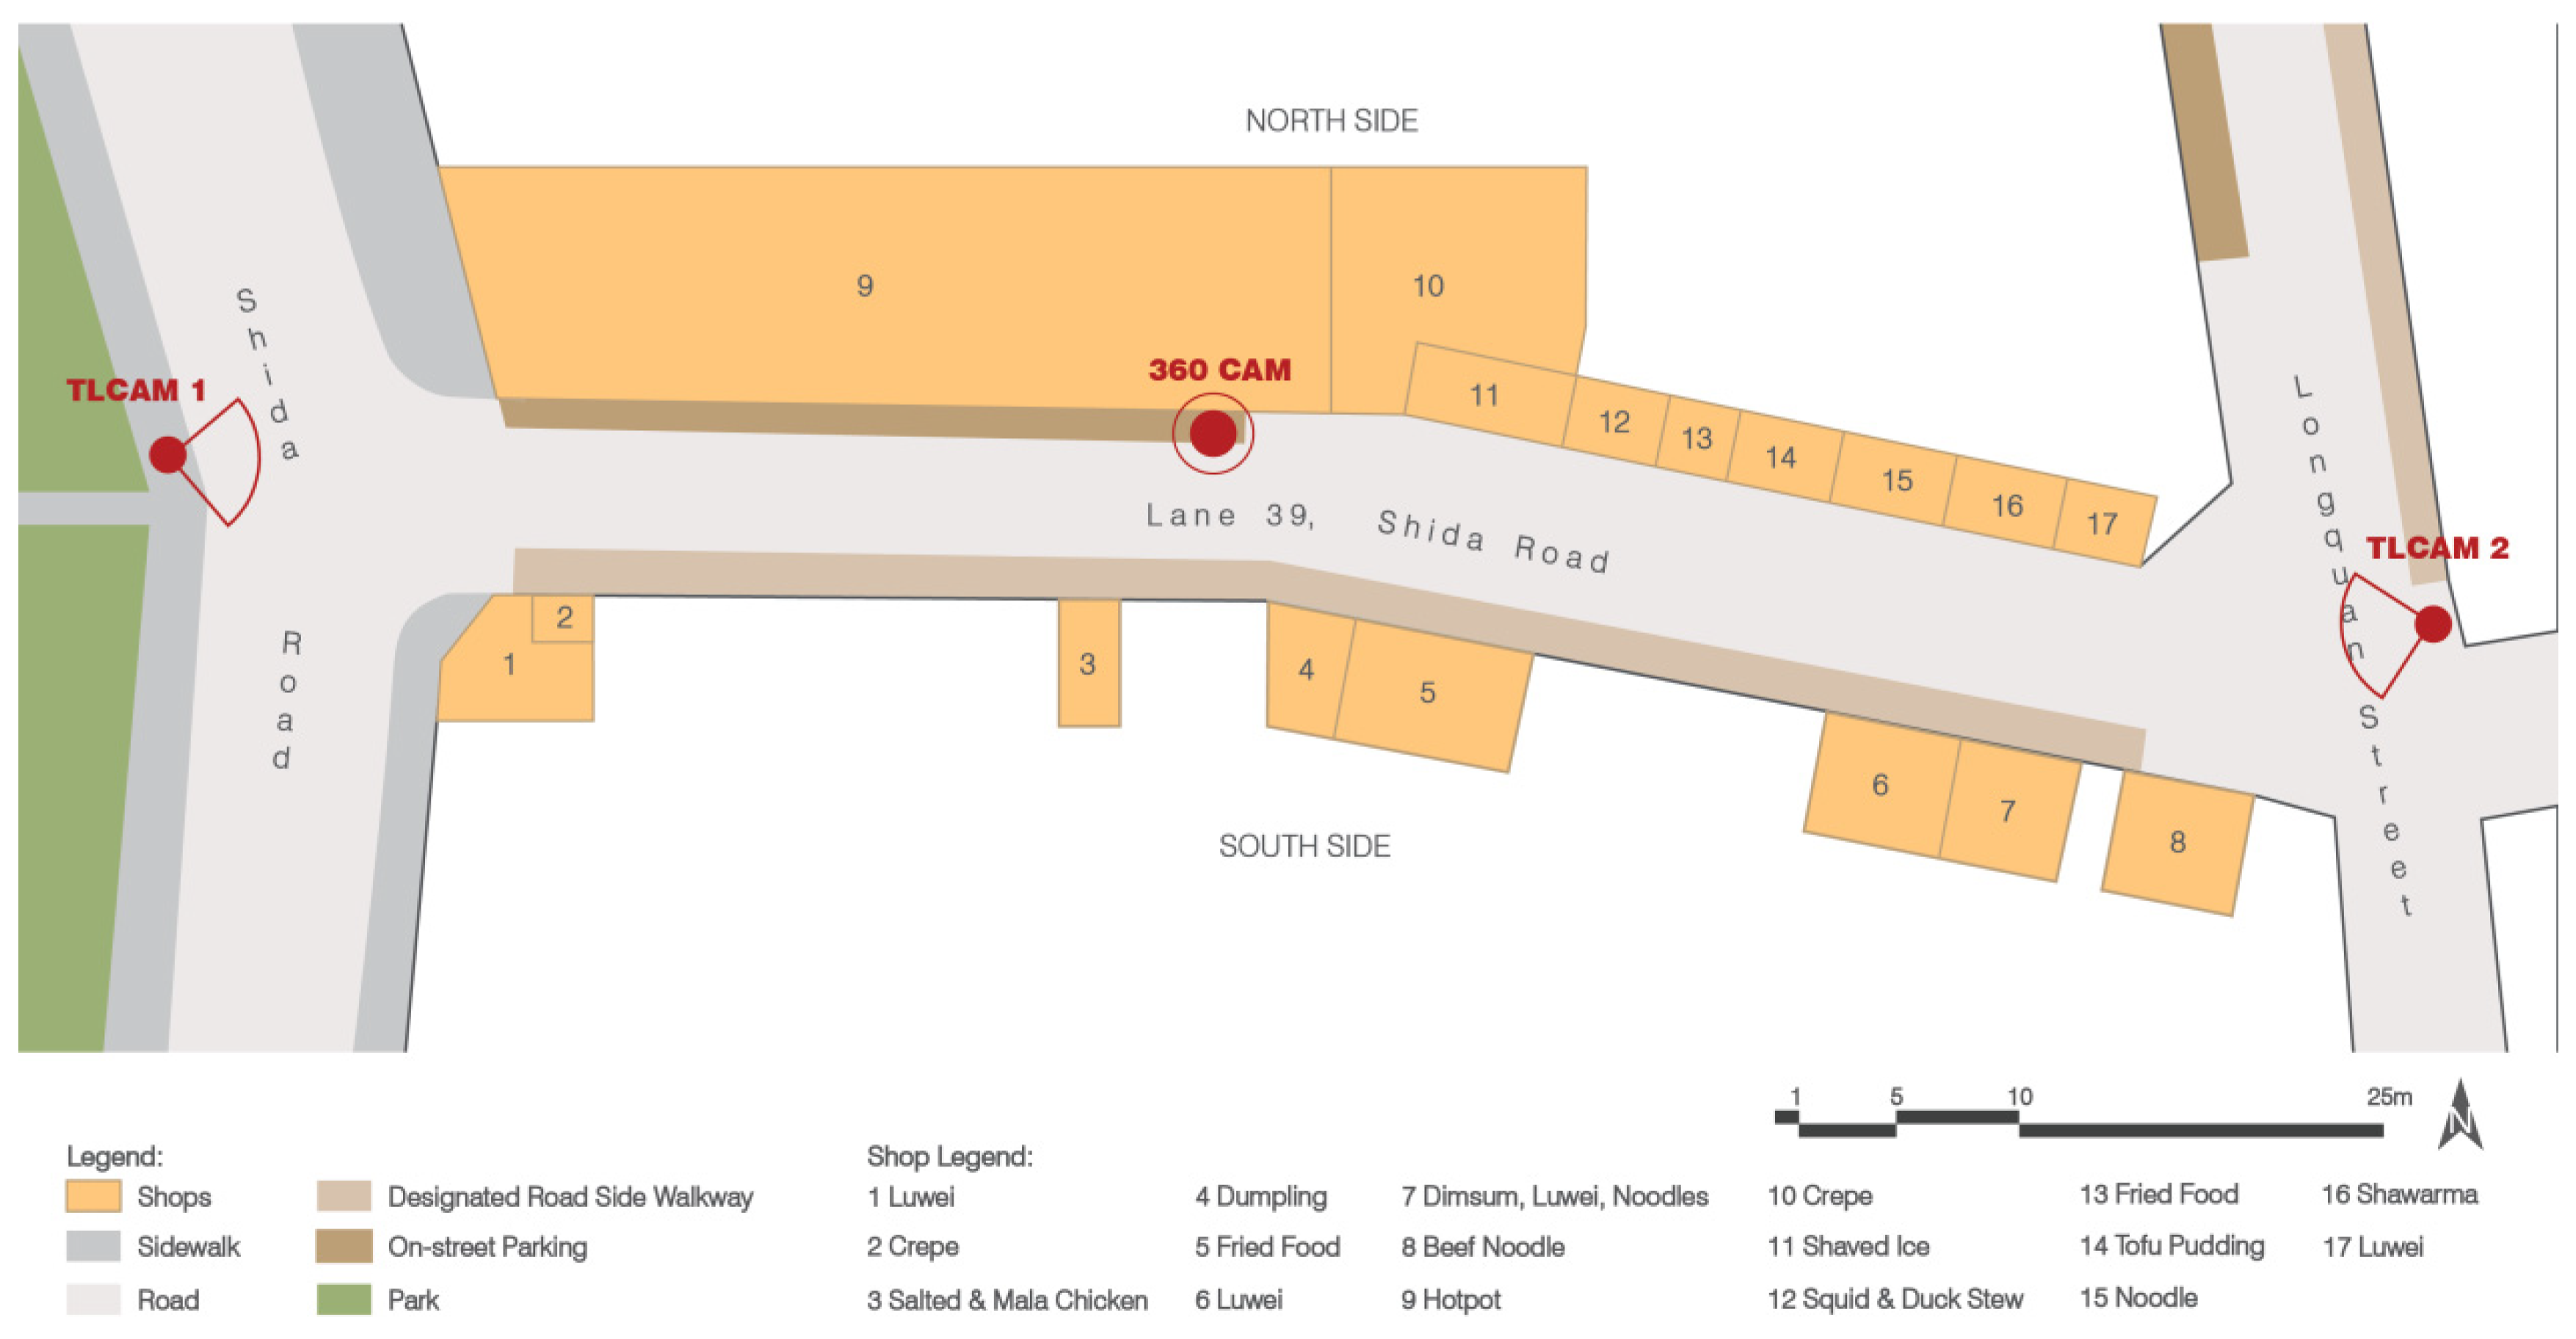
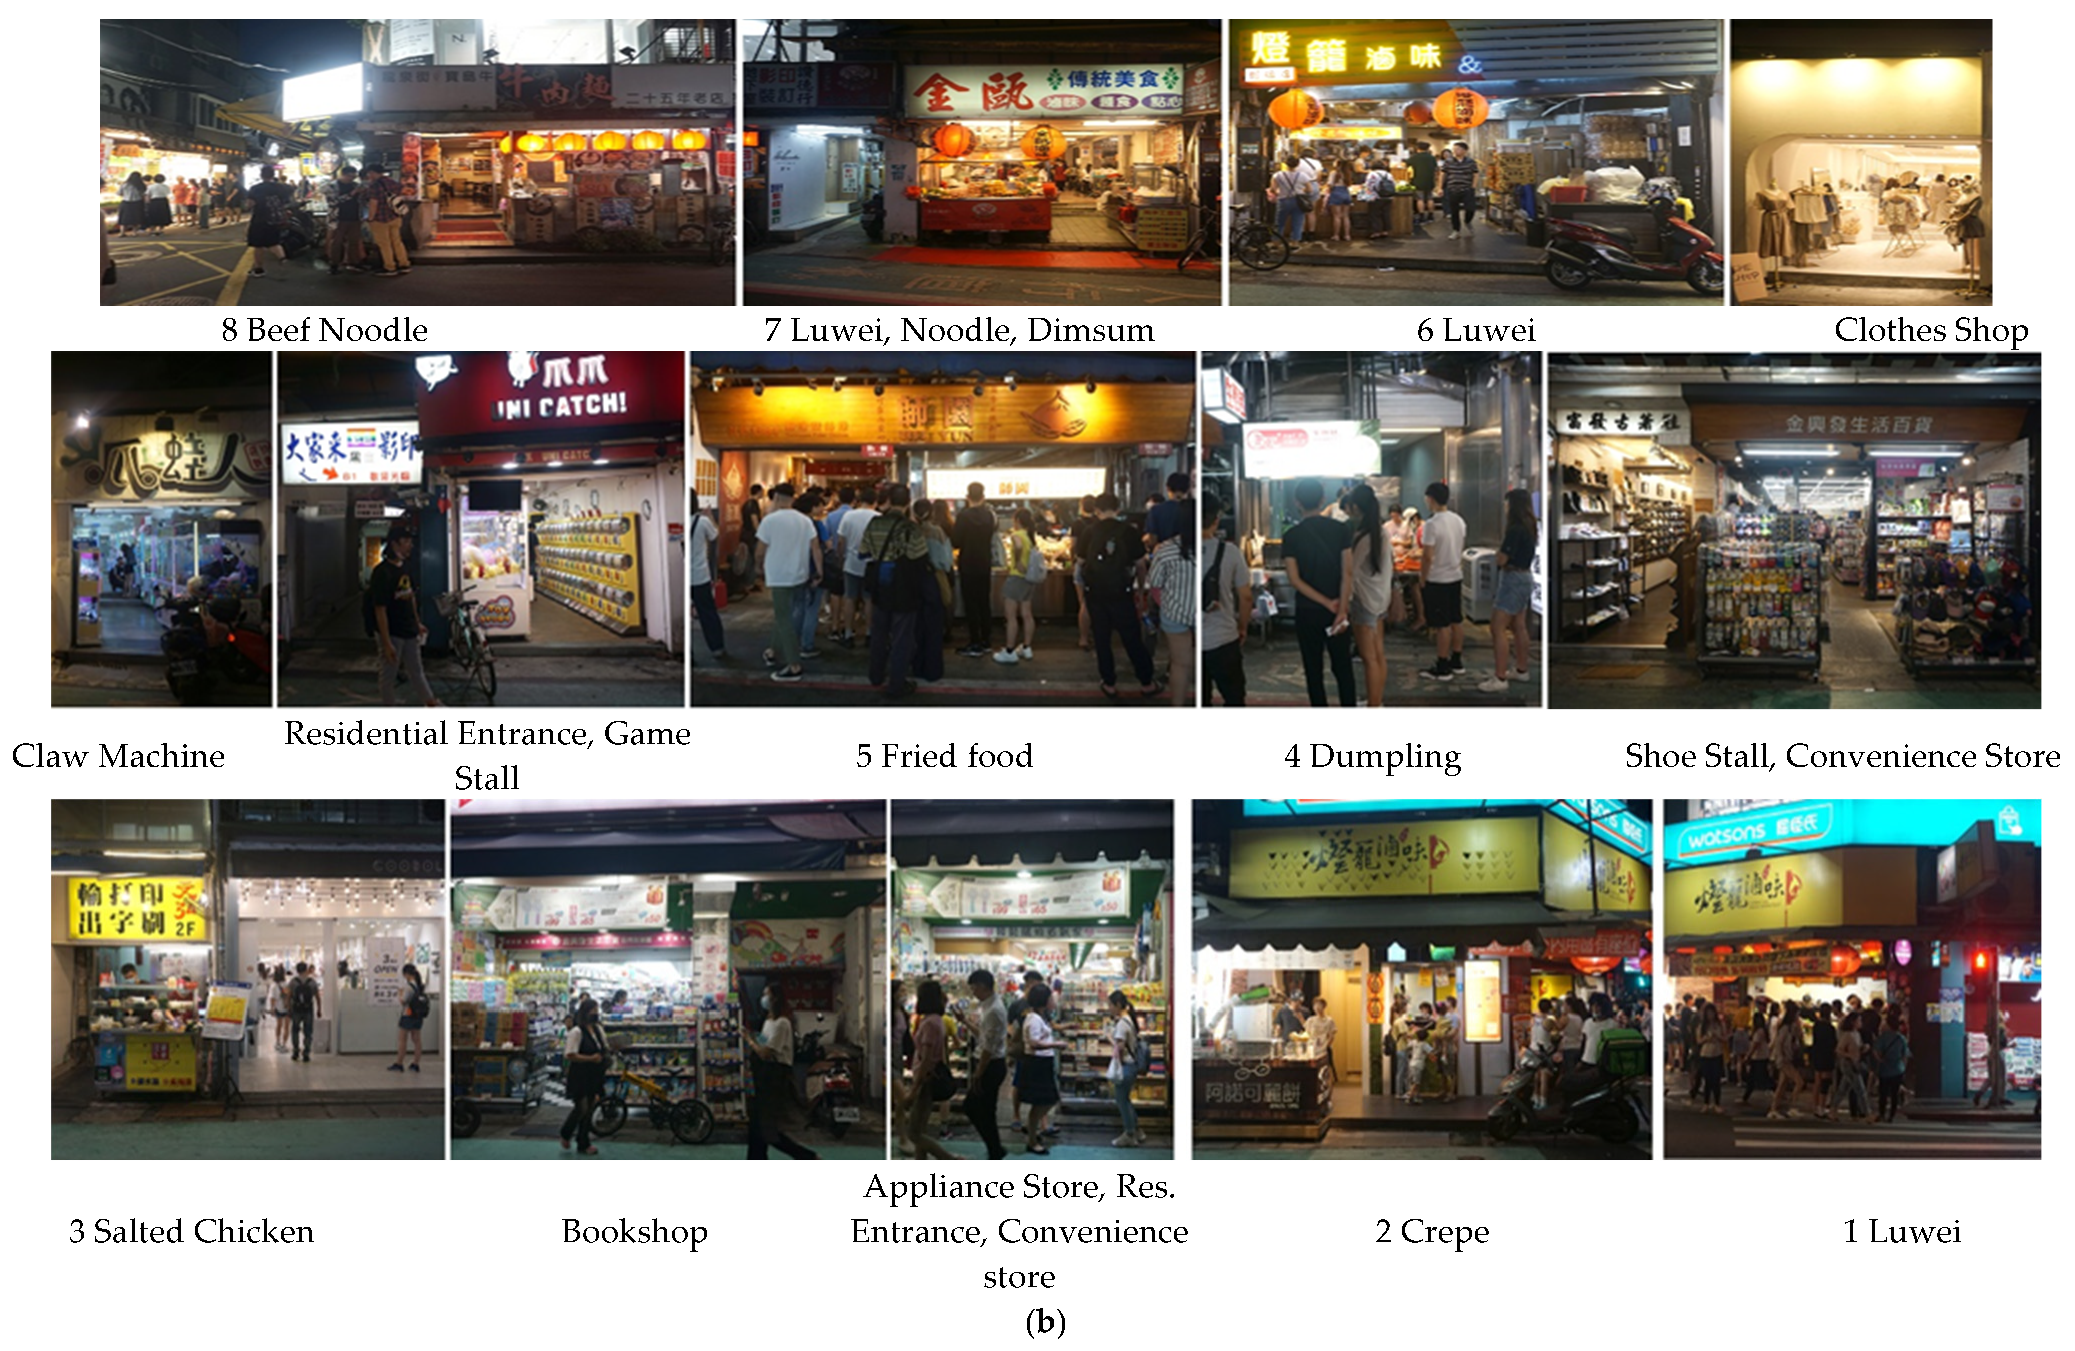
2.1.2. Final Field Observation, Video Data Collection Analysis
- Field Observation
- 2.
- Video Data Collection and Analysis Process
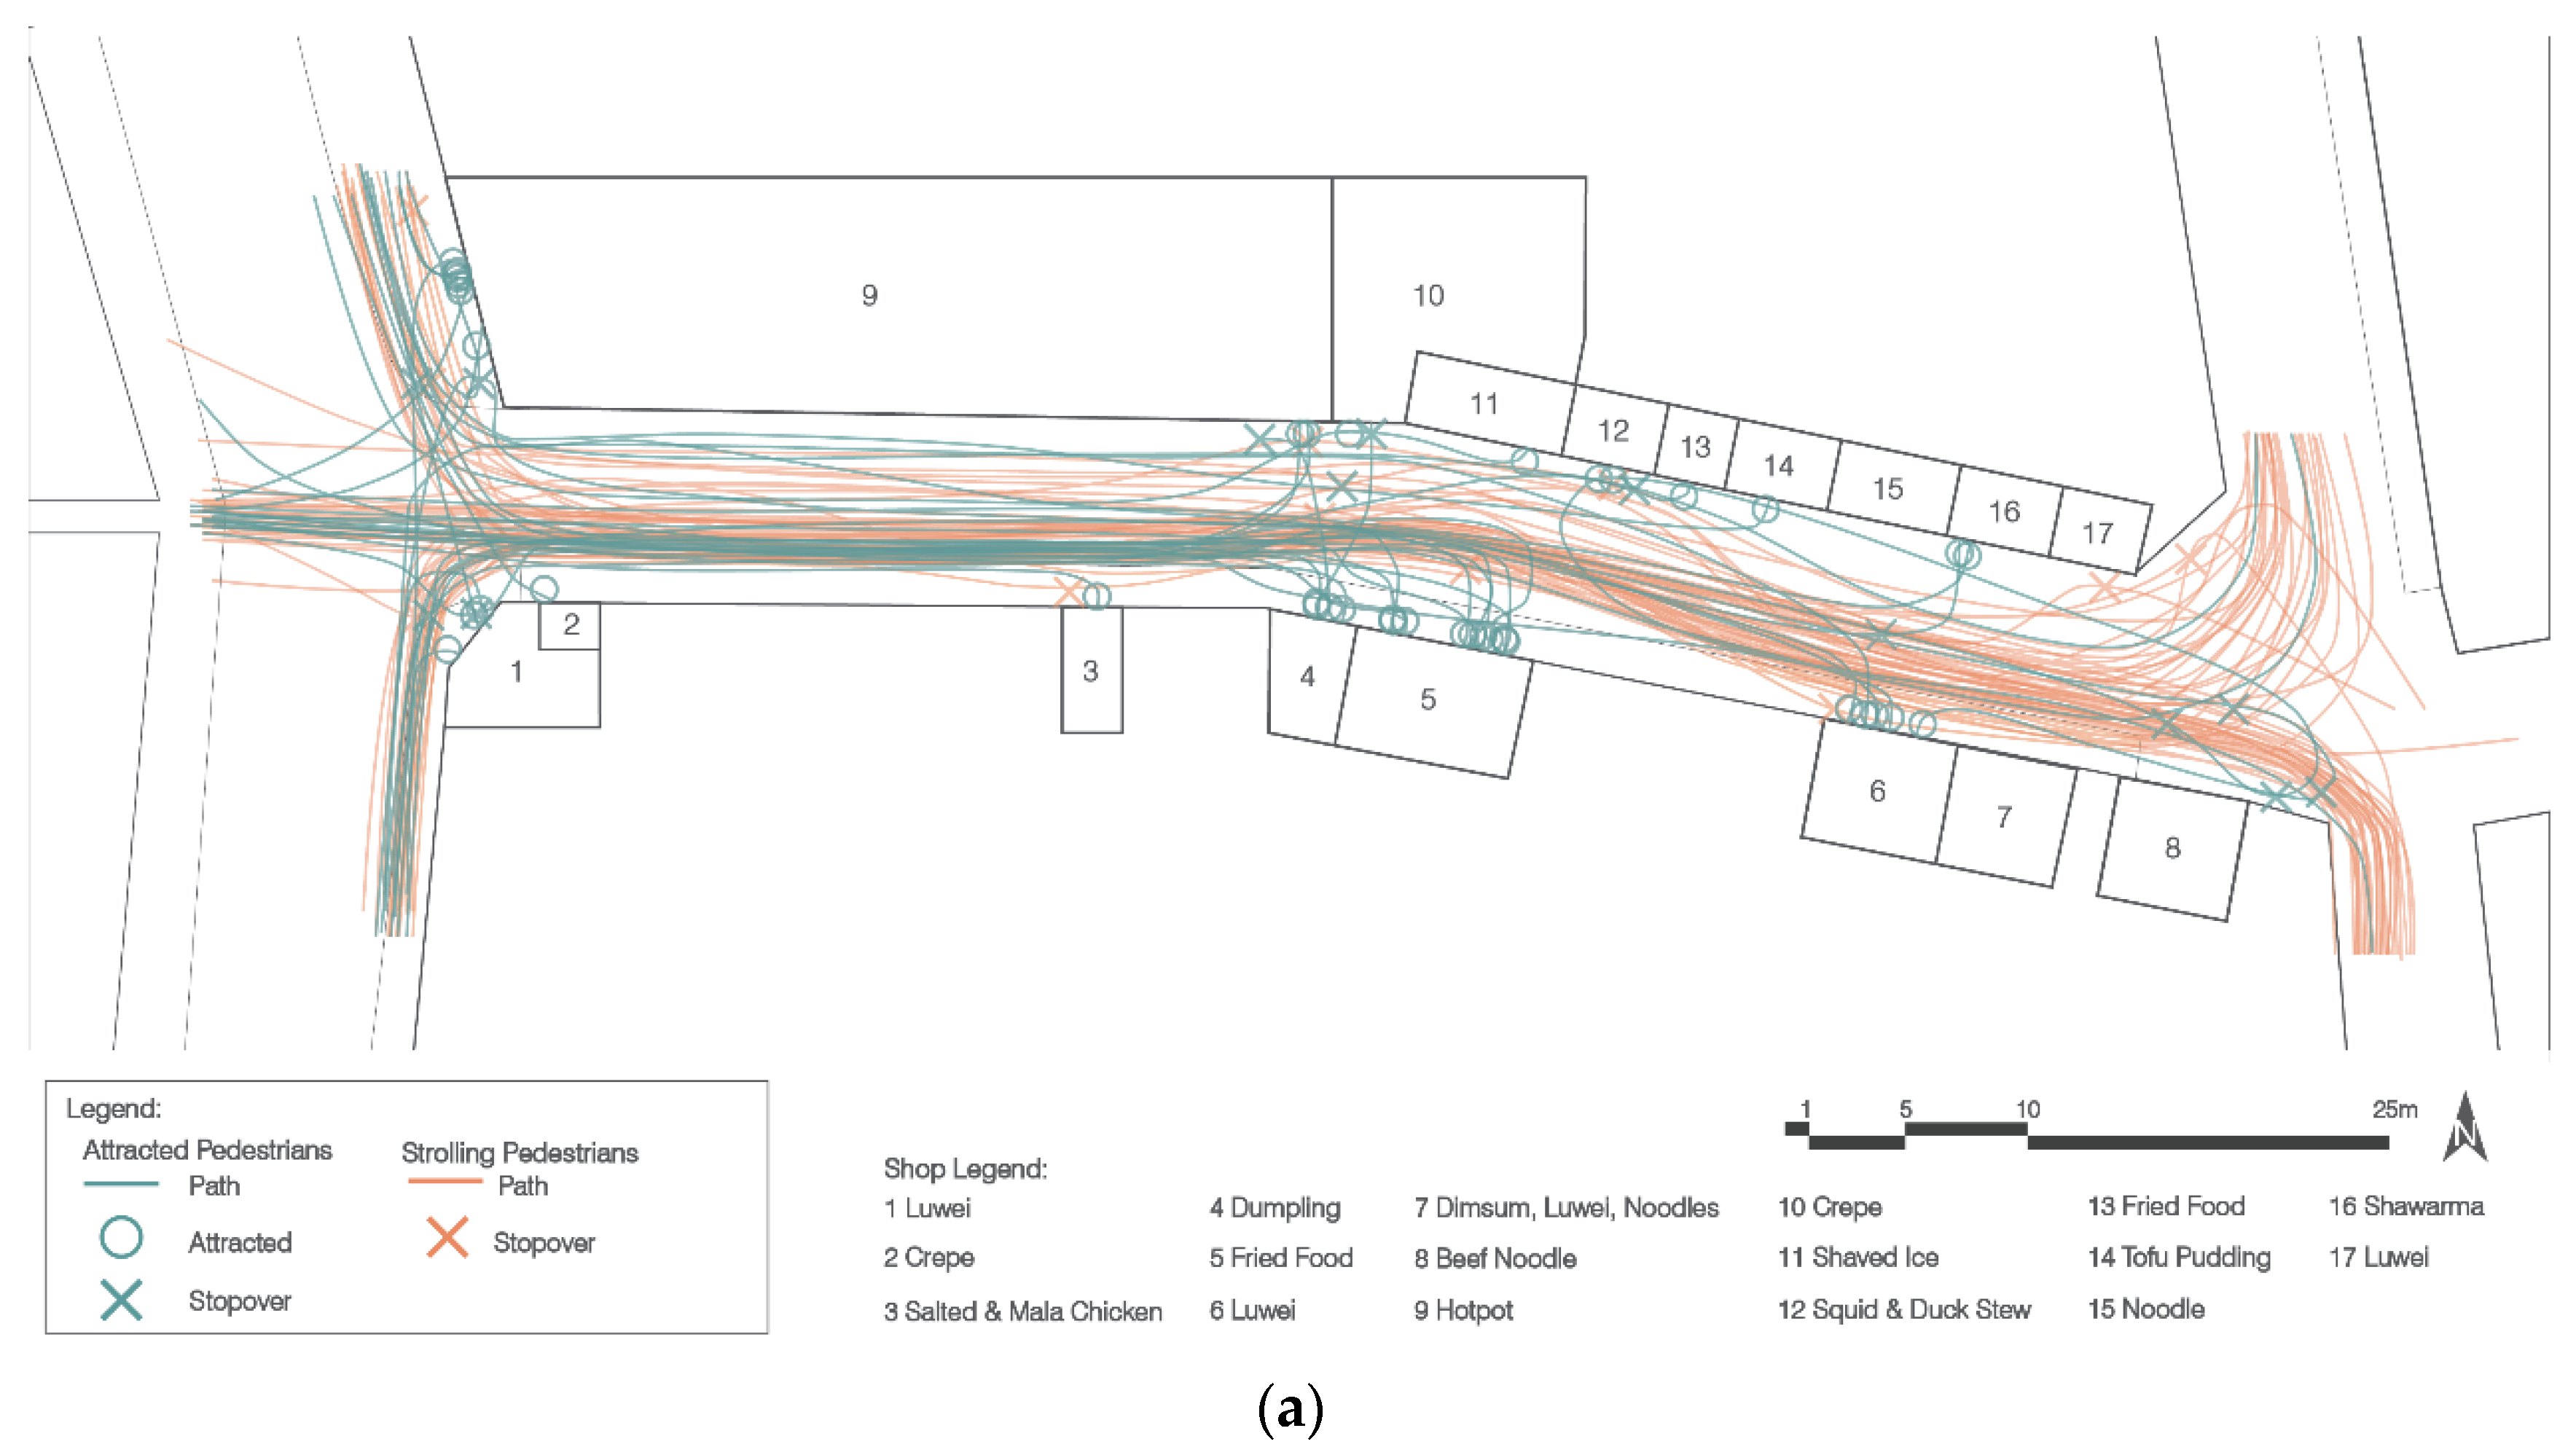
2.1.3. Shida Night Market Street Segment A: Analysis and Results
- Strolling Pedestrians
- 2.
- Attracted Pedestrians
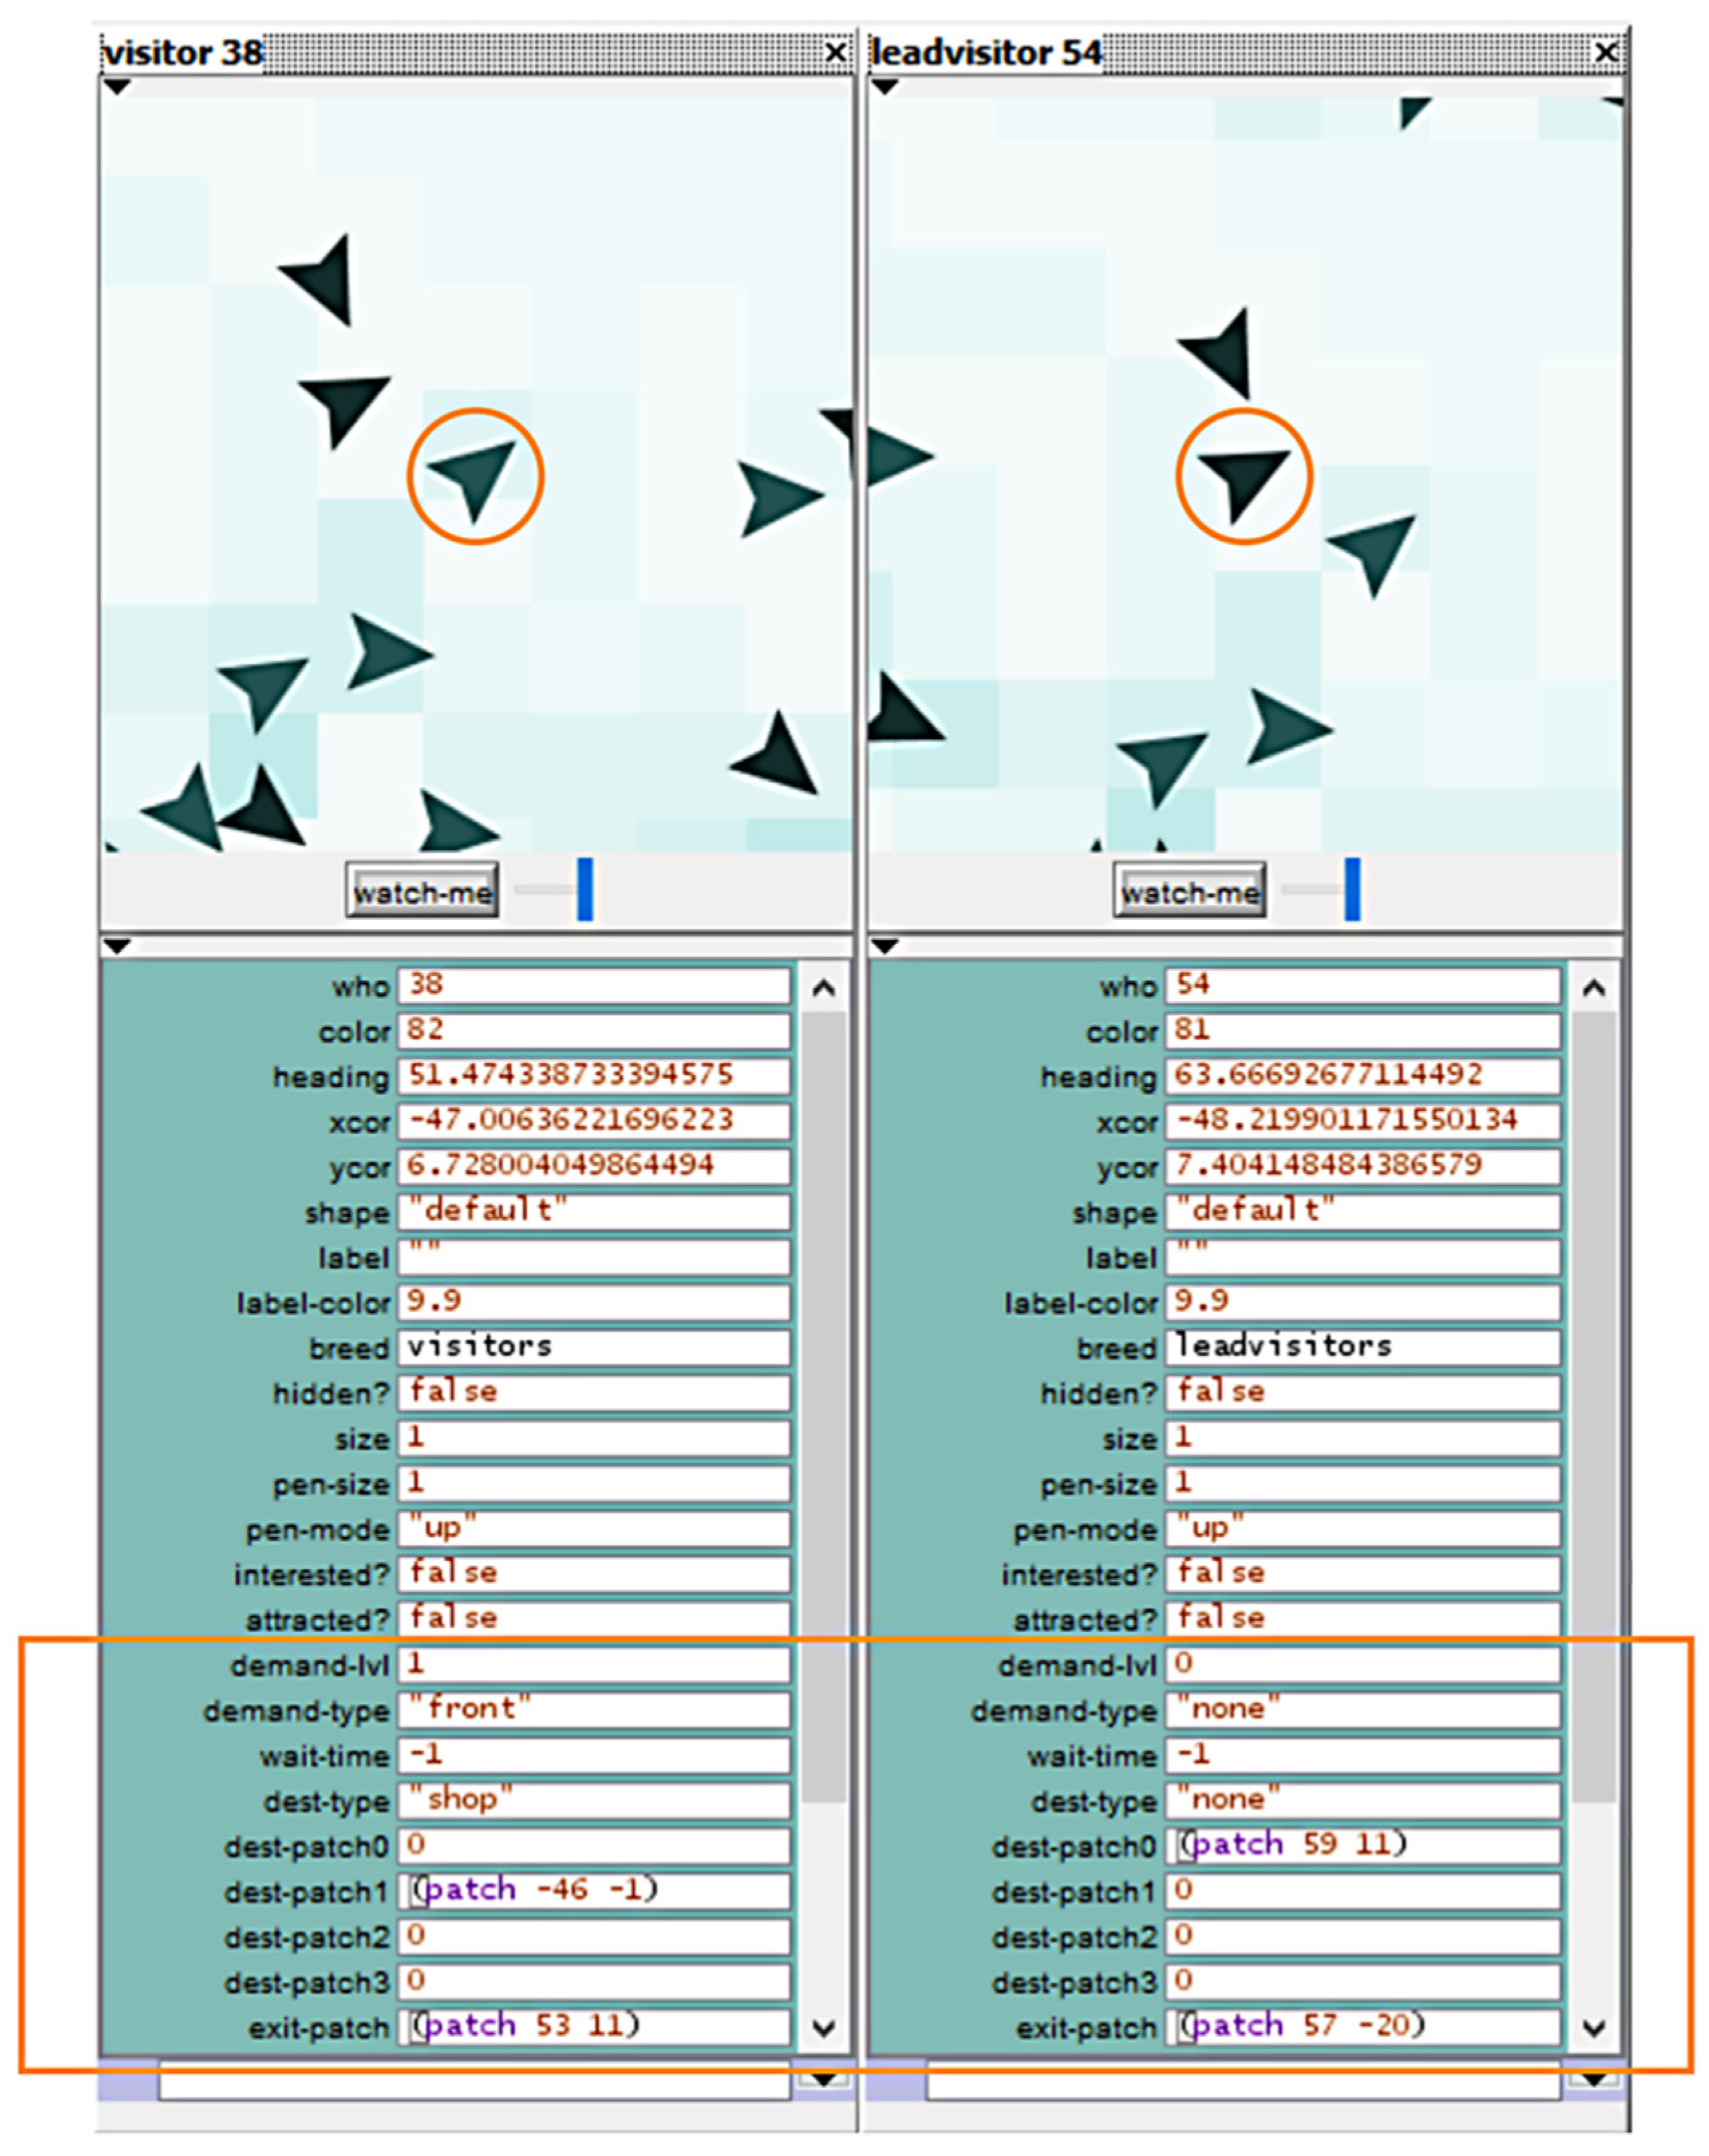
2.2. Simulation Model: NetLogo 5.2.0
2.2.1. Environment Parameters
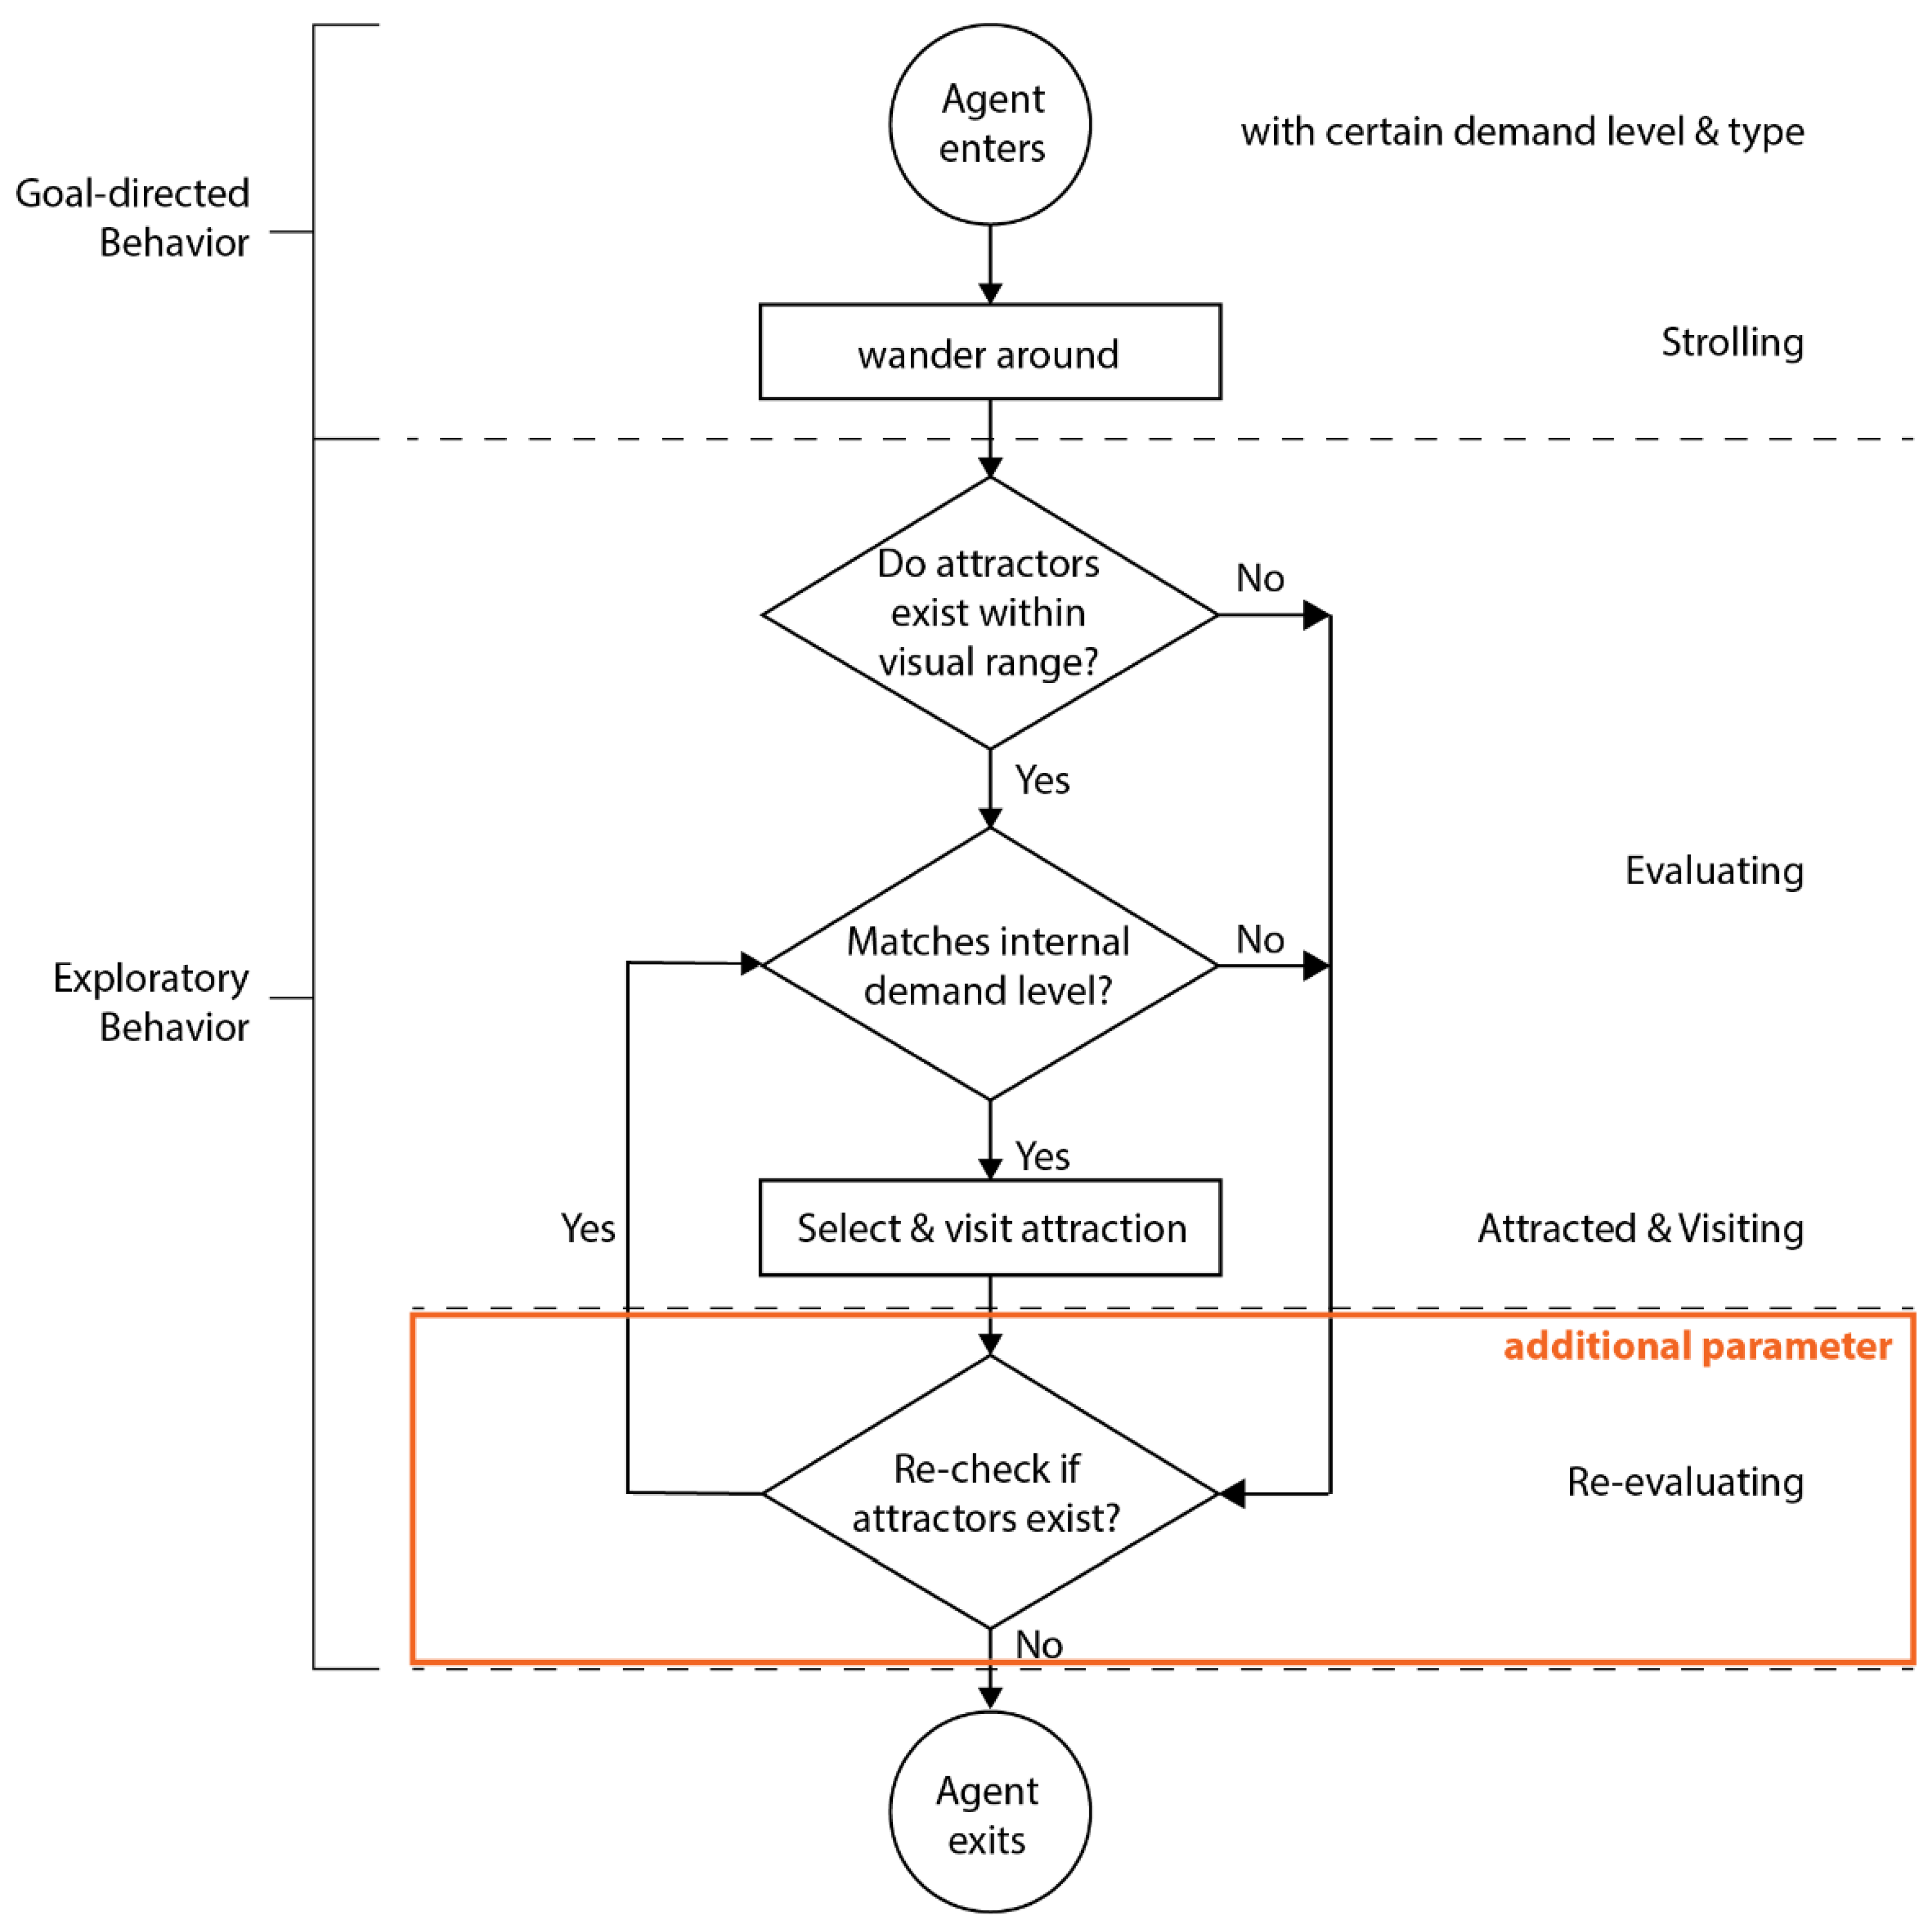
2.2.2. Pedestrians’ Visual Attraction Navigation Parameters
- Strolling Behavior
- 2.
- Attraction Behavior, Vision Angle, and Depth
2.2.3. Visual Attraction Model: Parameter Settings
3. Results and Comparisons
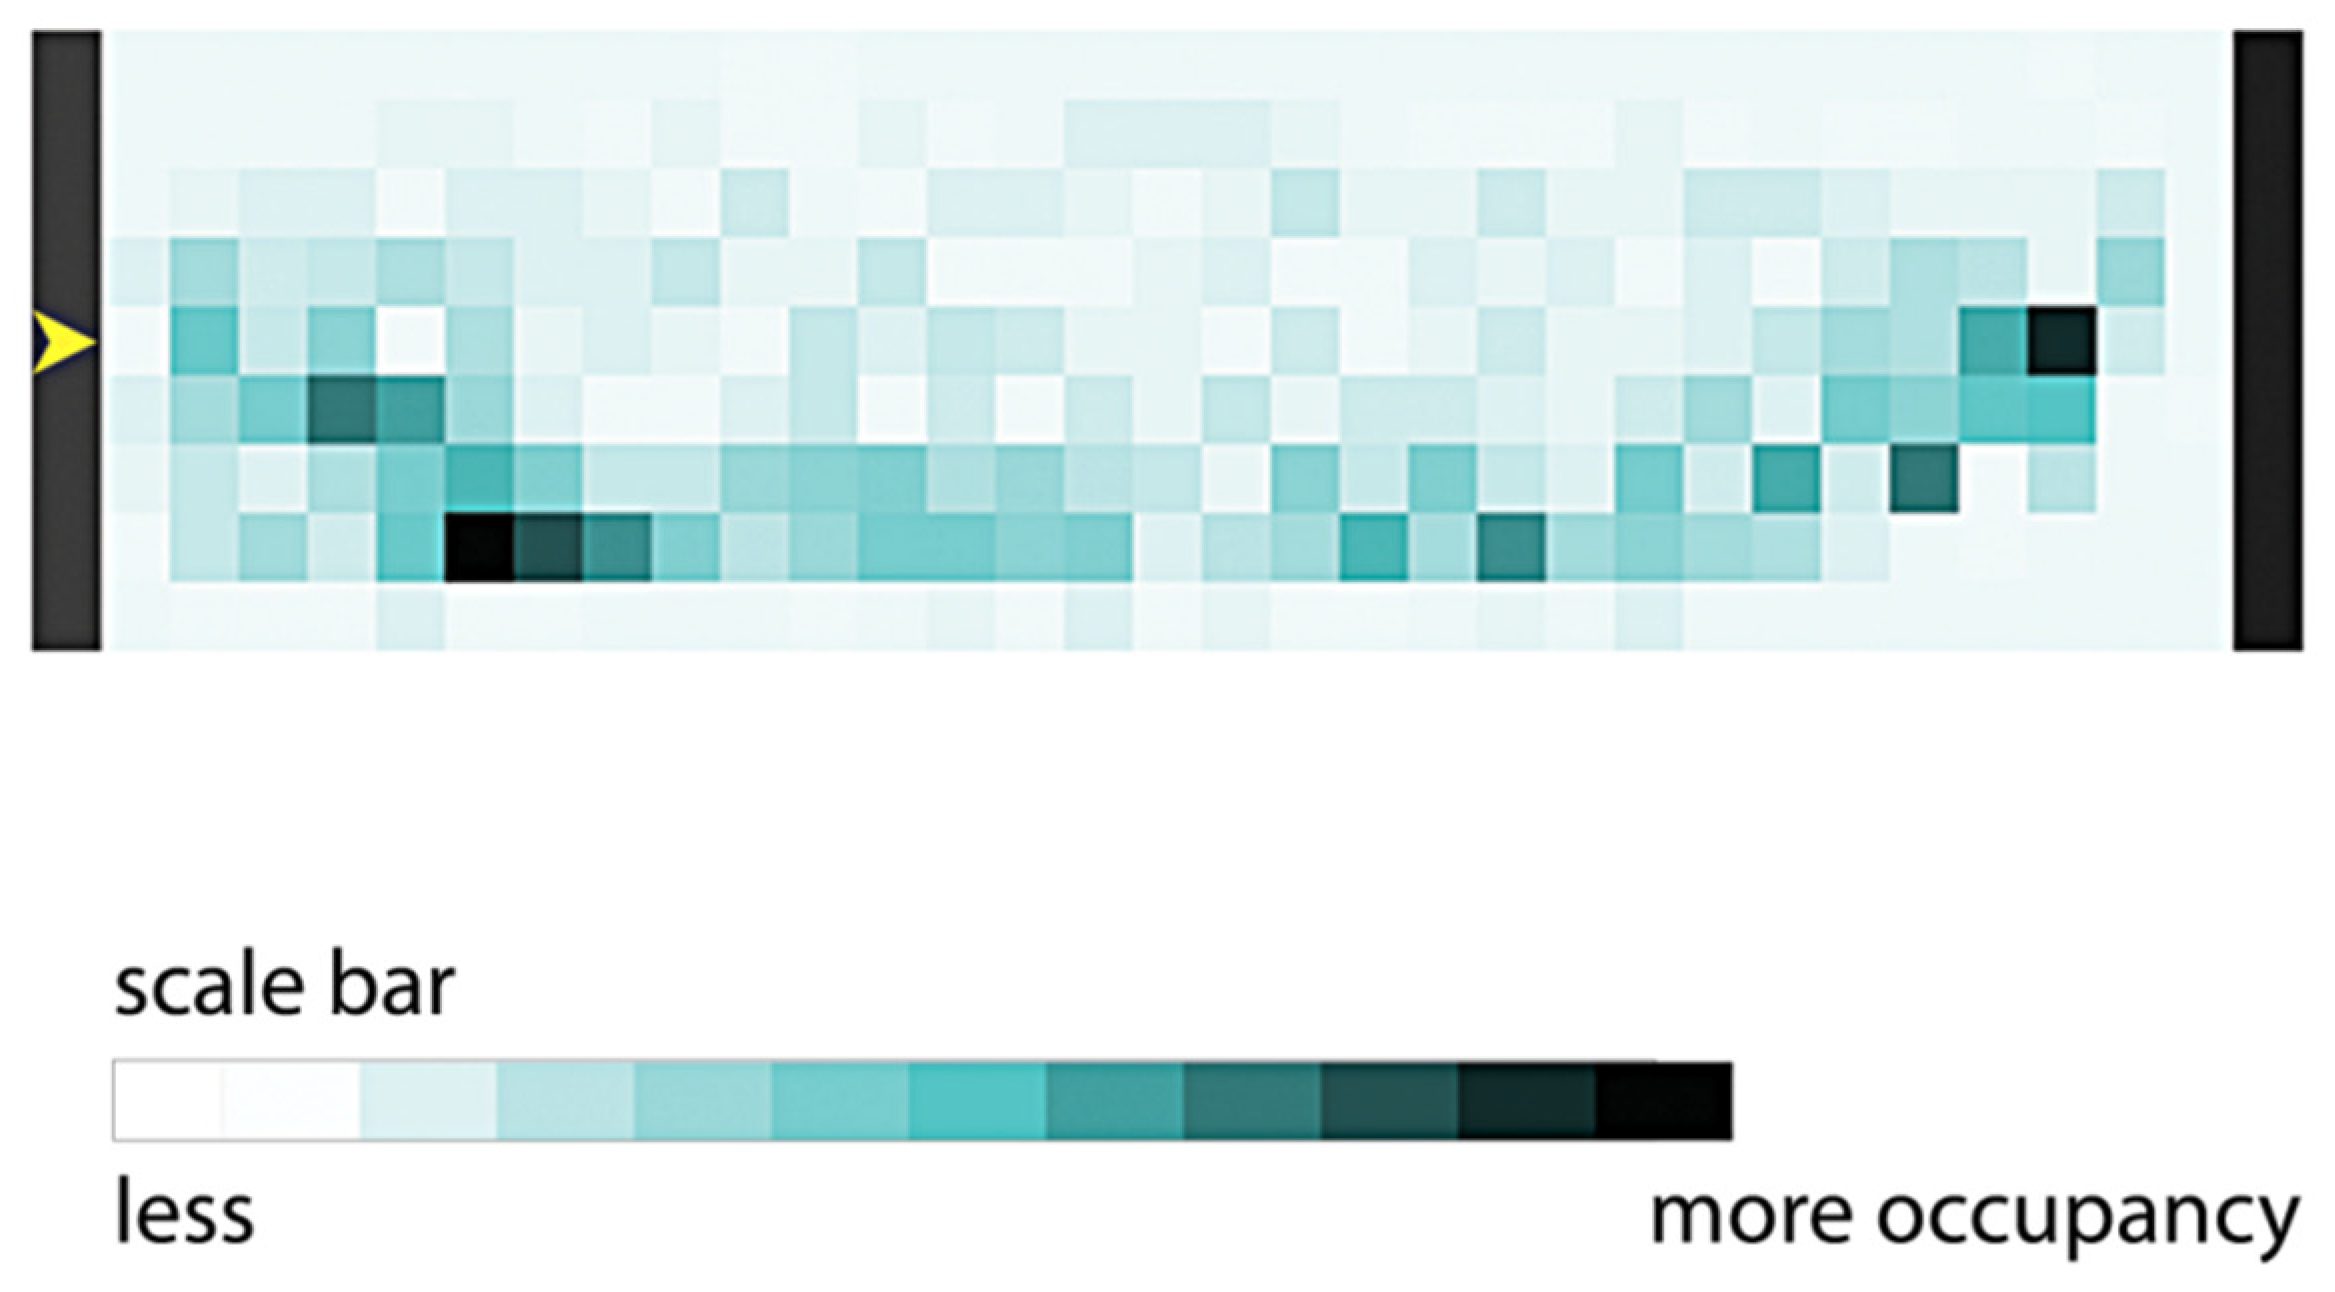
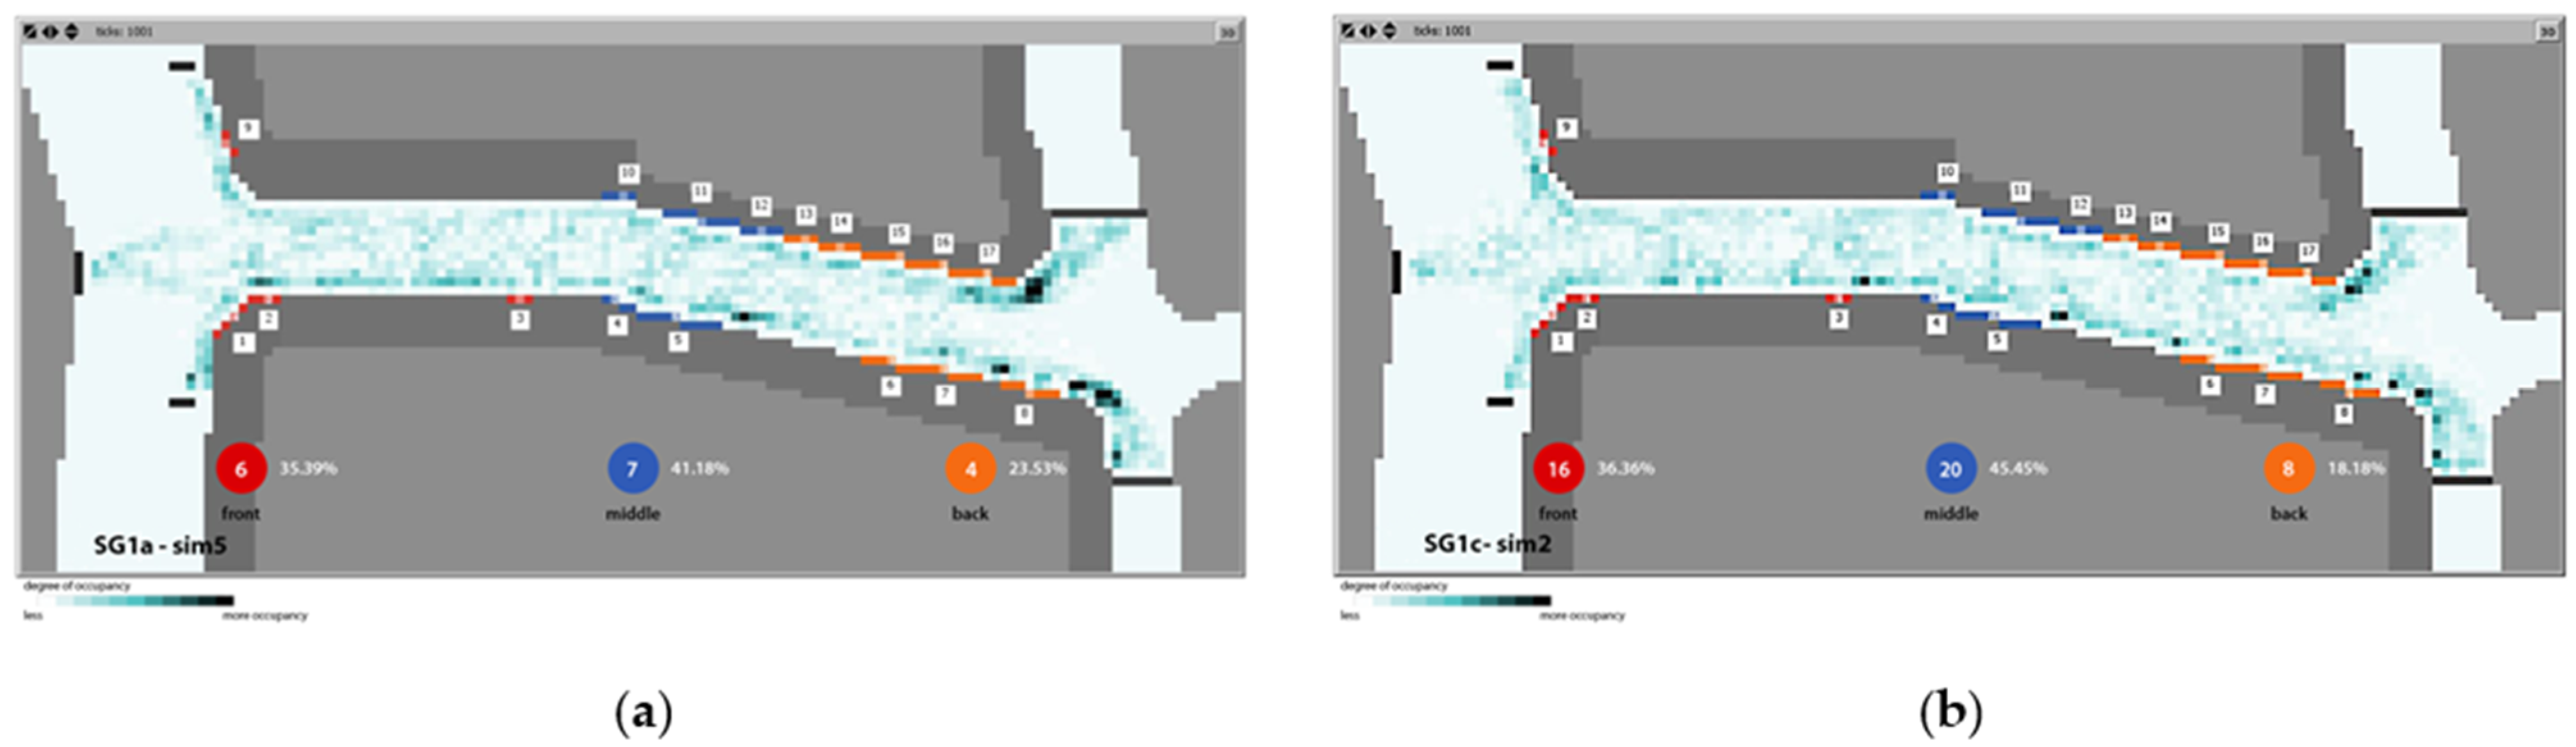
3.1. Simulation Results
3.2. Comparison against the Observed Data
4. Conclusions
Author Contributions
Funding
Institutional Review Board Statement
Informed Consent Statement
Data Availability Statement
Acknowledgments
Conflicts of Interest
References
- Chang, J.; Heish, A.T. Leisure motives of eating out in Night Markets. Bus. Res. 2006, 59, 1276–1278. [Google Scholar] [CrossRef]
- Iqbal, M.; Karsono, B.; Atthaillah, A.; Lisa, N.P. Night Market Contribution to Sustainability of Urban Spaces. Pertanika J. Soc. Sci. Hum. 2017, 25, 131–138. [Google Scholar]
- Kuo, C.T.; Chung, M.L.; Kuo, F.C. To Explore Taiwaneses Night Markets Culture and Tourism Experience and Behavior. Soc. Behav. Sci. 2012, 40, 435–440. [Google Scholar] [CrossRef] [Green Version]
- Taiwan Tourism Bureau. Available online: https://admin.taiwan.net.tw/ (accessed on 30 October 2020).
- Lee, S.H.; Chang, S.C.; Hou, J.S.; Lin, C.H. Night Market experience and image of temporary residents and foreign visitors. Int. J. Cult. Tour. Hosp. Res. 2008, 2, 217–233. [Google Scholar] [CrossRef]
- Crooks, A.; Croitoru, A.; Lu, X.; Wise, S.; Irvine, J.M.; Stefanidis, A. Walk This Way: Improving Pedestrian Agent-Based Models through Scene Activity Analysis. ISPRS Int. J. Geo-Inf. 2015, 4, 1627–1656. [Google Scholar] [CrossRef] [Green Version]
- Park, J.H.; Rojas, F.A.; Yang, H.S. A collision avoidance behavior model for crowd simulation based on psychological findings. Comput. Animat. Virtual Worlds 2013, 24, 173–183. [Google Scholar] [CrossRef]
- Moussaïd, M.; Helbing, D.; Theraulaz, G. How simple rules determine pedestrian behavior and crowd disasters. Proc. Natl. Acad. Sci. USA 2011, 108, 6884–6888. [Google Scholar] [CrossRef] [Green Version]
- Asano, M.; Iryo, T.; Kuwahara, M. Microscopic pedestrian simulation model combined with a tactical model for route choice behaviour. Transp. Res. Part C Emerg. Technol. 2010, 18, 842–855. [Google Scholar] [CrossRef]
- Gibson, J.J. The Ecological Approach to Visual Perception; Houghton Mifflin: Boston, MA, USA, 1979. [Google Scholar]
- Hillier, B.; Penn, A.; Hanson, J.; Grajewski, T.; Xu, J. Natural Movement: Or, Configuration and Attraction in Urban Pedestrian Movement. Environ. Plan. B Plan. Des. 1993, 20, 29–66. [Google Scholar] [CrossRef] [Green Version]
- Turner, A.; Penn, A. Encoding natural movemnt as an agent-based system: An investigation into human pedestrian behavior in the built environment. Environ. Plan. B Plan. Des. 2002, 9, 473–490. [Google Scholar] [CrossRef] [Green Version]
- Lee, S.J.; Lee, K.H.; Kang, S.J. Study on a Pedestrian Simulation Model of Natural Movement. AJ. Asian Arch. Build. Eng. 2013, 12, 41–48. [Google Scholar] [CrossRef]
- Lee, S.-J. Navigational Pedestrian Movement Model with Vision-driven Agents. J. Asian Arch. Build. Eng. 2015, 14, 371–378. [Google Scholar] [CrossRef]
- Martella, C.; Miraglia, A.; Frost, J.; Cattani, M.; van Steen, M. Visualizing, clustering, and predicting the behavior of museum visitors. Pervasive Mob. Comput. 2017, 38, 430–443. [Google Scholar] [CrossRef]
- Wang, W.L.; Lo, S.M.; Liu, S.B.; Kuang, H. Microscopic modeling of pedestrian movement behavior: Interacting with visual attractors in the environment. Transp. Res. Part C Emerg. Technol. 2014, 44, 21–33. [Google Scholar] [CrossRef]
- Werberich, B.R.; Pretto, C.; Cybis, H. Pedestrians’ Route Choice Model for Shopping Behavior. In Proceedings of the Ninth International Workshop on Agents in Traffic and Transportation (ATT 2016) co-located with the 25th International Joint Conference on Artificial Intelligence (IJCAI 2016), New York, NY, USA, 10 July 2016. [Google Scholar]
- Open Street Map. Available online: https://www.openstreetmap.org/ (accessed on 30 October 2020).
- Bogers, A.; Kemperman, Q.; Timmermans, H. Modeling Pedestrian Movement in Shopping Street Segments. In Pedestrian Behavior; Emerald Group Publishing Limited: Bingley, UK, 2009; Chapter 5; pp. 87–111. [Google Scholar]
- U. Wilensky NetLogo Webpage. Available online: https://ccl.northwestern.edu/netlogo (accessed on 30 October 2020).
- Grimm, V. Individual-based Models. In Encyclopedia of Ecology; Elsevier Science: Amsterdam, The Netherlands, 2008; pp. 1959–1968. [Google Scholar]
- Sutherland, D.H.; Kaufman, K.R.; Moitoza, J.R. Kinematics of normal human walking. In Human Walking; Rose, J., Gamble, J.G., Eds.; Williams and Wilkins: Baltimore, MD, USA, 1994; pp. 23–44. [Google Scholar]
- Gibson, E. Exploratory behavior in the development of perceiving, acting, and the acquiring of knowledge. Annu. Rev. Psychol. 1988, 39, 1–42. [Google Scholar] [CrossRef]


| Description | Guanshan Night Market | Xiaobei Xinchengong Night Market | Shida Night Market |
|---|---|---|---|
| Night Market Zoning Layout |  |  | 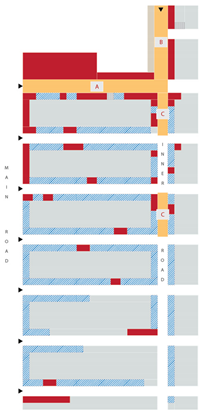 |
| Site Photos |  |  | 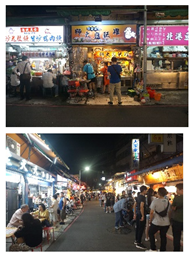 |
| Layout Type | Loop | Grid | Linear and Branching out |
| Estimate Area | 7450 sq. m. | 12,200 sq. m. | 16,170 sq. m. |
| Shop Composition | Food, Retail, Game | Food, Retail, Game | Food, Retail, Game |
| Operating Hours | Thursday only 6:00 pm to 10:00 pm | Tuesdays and Fridays 4:00 pm to 1:00 am | Everyday 8:00 am to 12:00 am |
| Observation Time | 4:45 pm to 7:45 pm | 4:30 pm to 9:30 pm | 6:00 pm to 9:00 pm |
| Observed User Group | Individual, Family | Individual, Family, Group of twos | Individual, Family, Group of twos and threes |
| Visitor Type | Patron, Casual | Patron, Casual | Patron, Casual, Passerby |
| Visit Duration | 6 to 7 min | 8 to 52 min | 5 to 60 min |
| Segment width range | 4.48 m, 3.20 m, 2.19 m | 4.14 m, 2.33 m, 0.95 m | 7.61 m, 4.87 m |
| Estimated Segment lengths | 60 m, 82 m | 8 m, 56 m, 100 m | 83 m, 185 m, 195 m |
| Number of People Observed | 3 Adults, 2 Children | 7 Adults, 2 Children | 7 Adults, 2 Children |
| User Movement |  Looping |  Meandering | 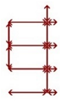 Linear |
| Shopping preference | More visitors on segments A and D which has mostly food stalls | A lot of visitors on segments with food stalls but starting from 8:30 and beyond, a lot of people visit the retail and game stalls | A lot of visitors on segments with food stalls but starting from 8:30 and beyond, a lot of people visit the retail and game stalls |
| Entry Points | |||||
|---|---|---|---|---|---|
| Total Pedestrians | % | North Side | West Side | South Side | |
| Strolling | 83 | 56% | 20 | 39 | 24 |
| Attracted | 66 | 44% | 20 | 26 | 20 |
| Total | 149 | 100% | 40 | 65 | 44 |
| Percentage | 27% | 44% | 29% | ||
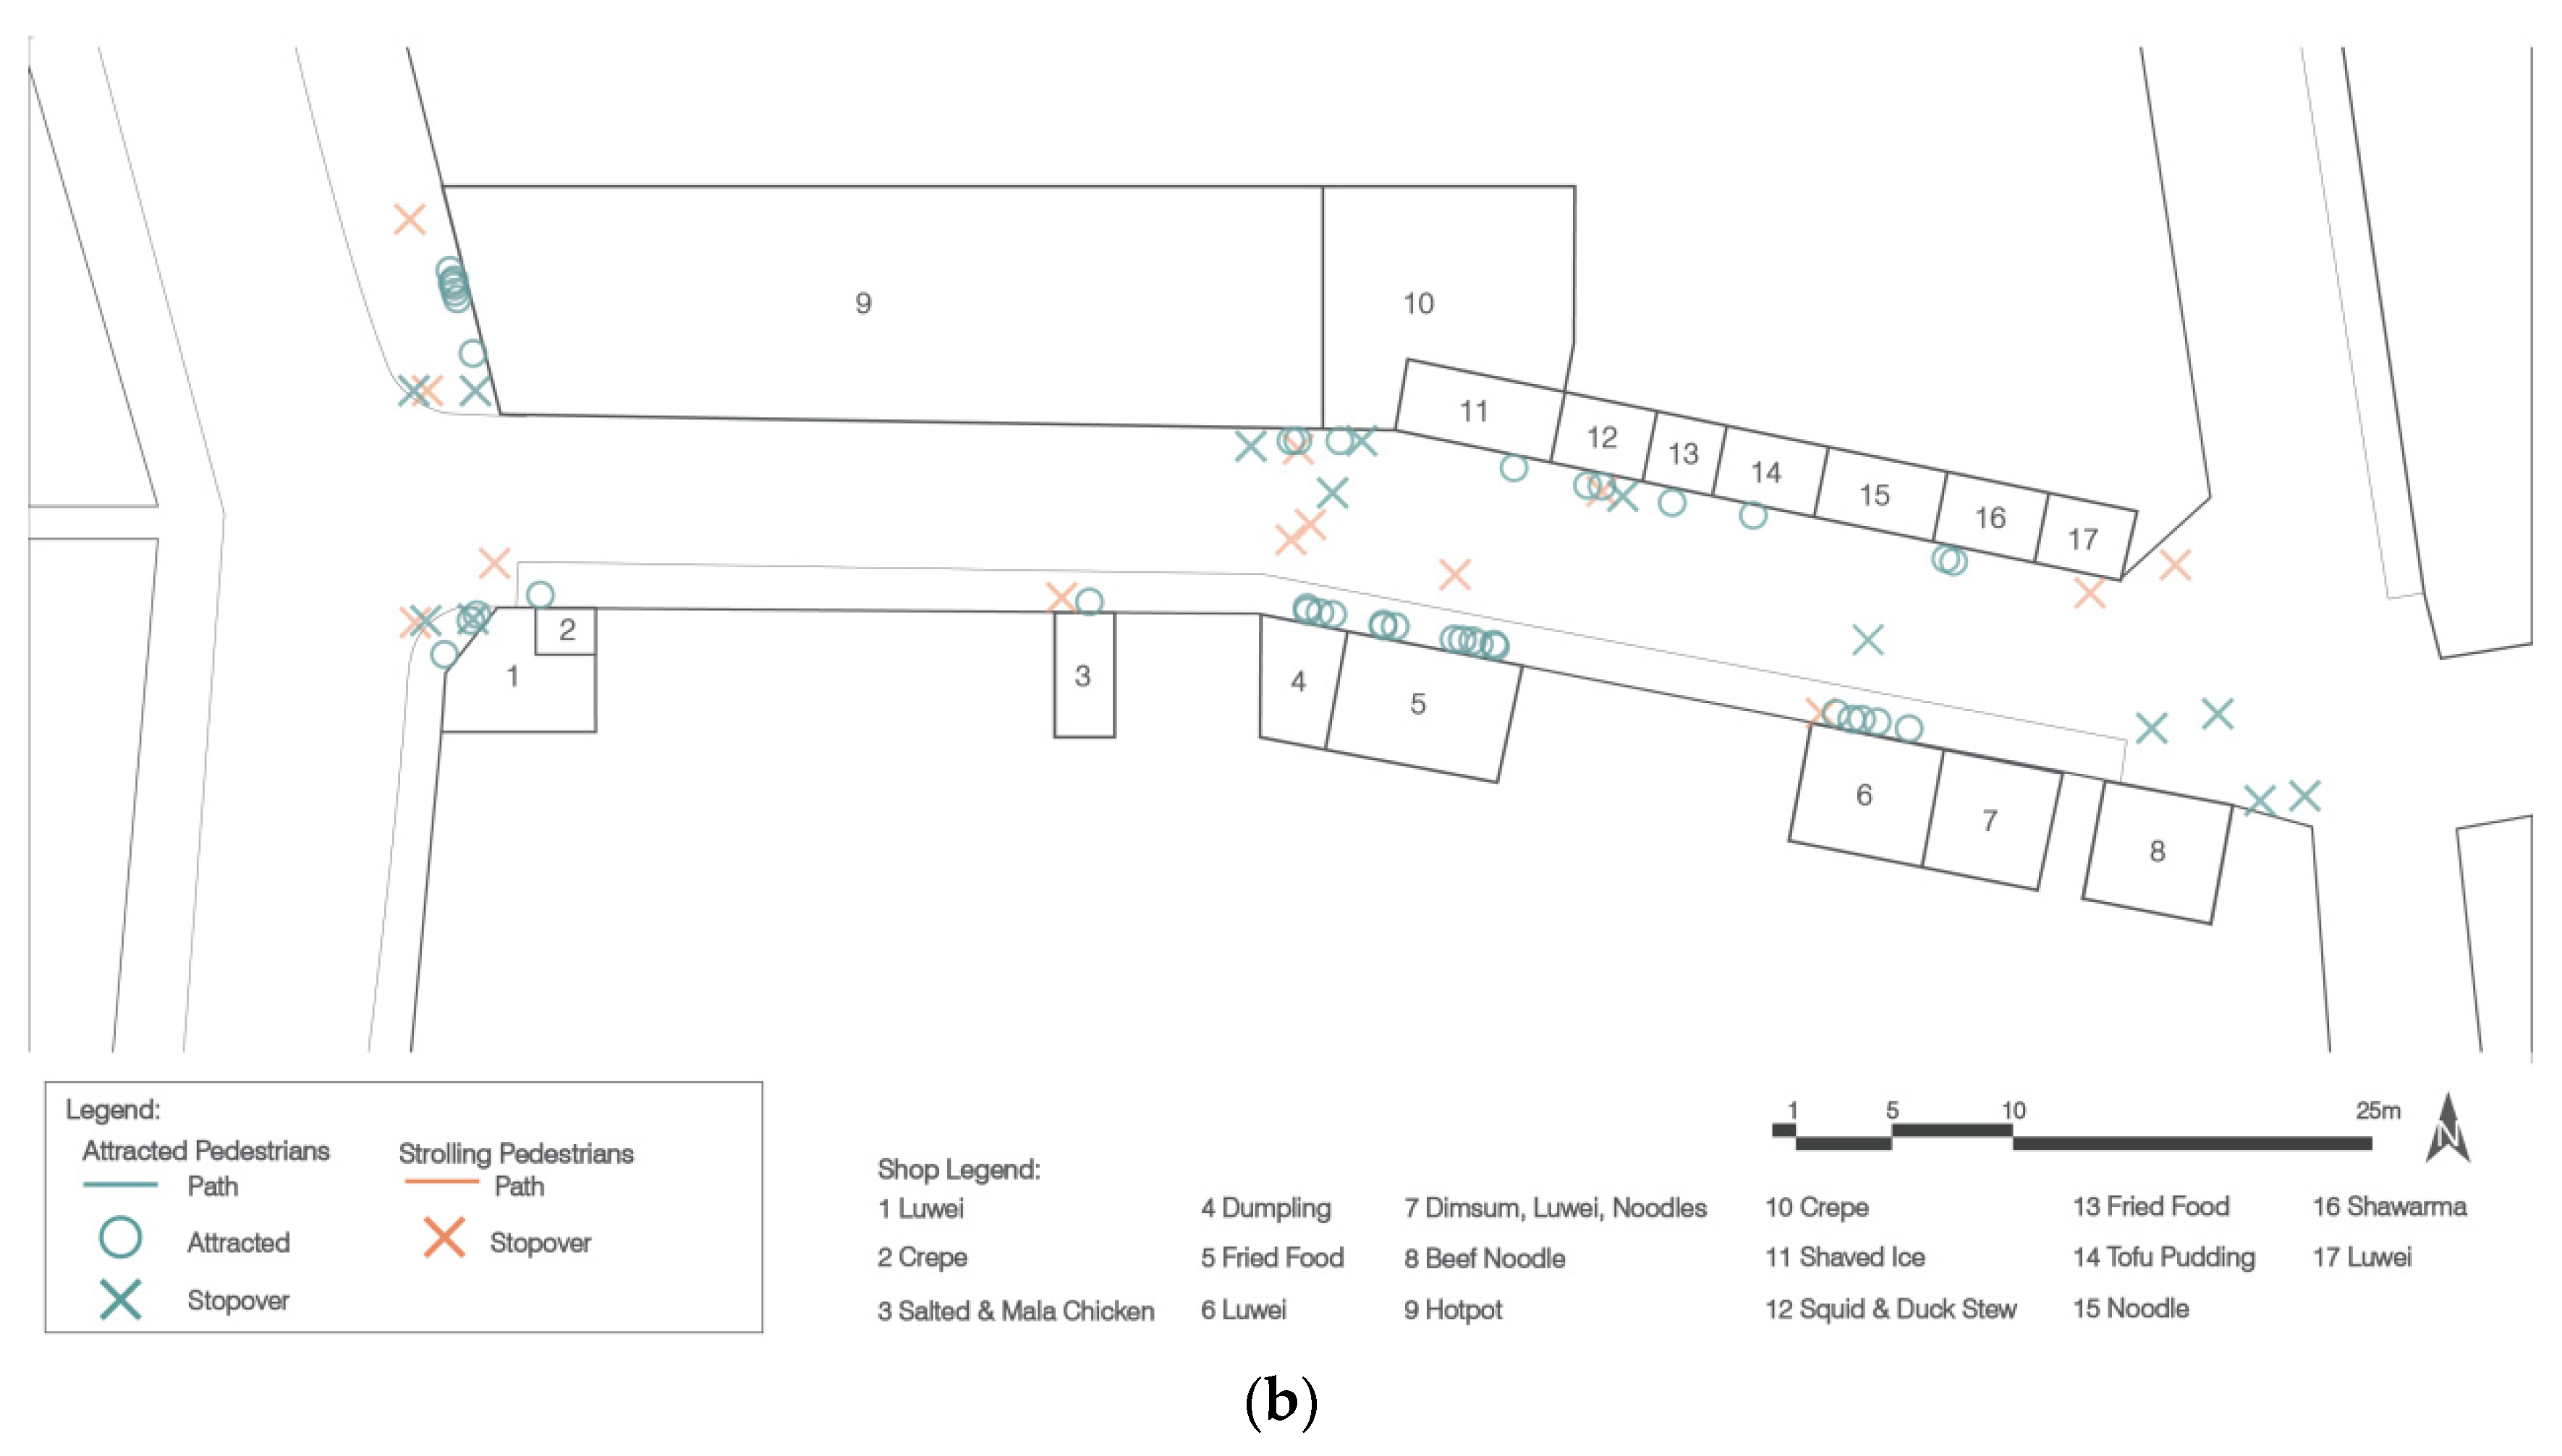
| No. of Shops | Shop No. | Food Type | Location | No. of Attractions | No. of Stopovers | Total |
|---|---|---|---|---|---|---|
| 1 | 9 | Hotpot | Front | 10 | 2 | 12 |
| 2 | 5 | Fried Food | Middle | 10 | 10 | |
| 3 | 1 | Luwei | Front | 5 | 2 | 7 |
| 4 | 6 | Luwei | Back | 5 | 5 | |
| 5 | 4 | Dumpling | Middle | 4 | 1 | 5 |
| 6 | 12 | Squid and Duck stew | Middle | 2 | 1 | 3 |
| 7 | 16 | Shawarma | Back | 2 | 2 | |
| 8 | 10 | Crepe | Middle | 1 | 1 | 2 |
| 9 | 2 | Crepe | Front | 1 | 1 | |
| 10 | 3 | Salted and Mala Chicken | Front | 1 | 1 | |
| 11 | 11 | Shaved Iced | Middle | 1 | 1 | |
| 12 | 13 | Fried Food | Back | 1 | 1 | |
| 13 | 14 | Tofu Pudding | Back | 1 | 1 | |
| 14 | 8 | Beef Noodles | Back | 4 | 4 | |
| 15 | 7 | Luwei, Noodles, Dimsum | Back | 0 | ||
| 16 | 15 | Noodles | Back | 0 | ||
| 17 | 17 | Luwei | Back | 0 | ||
| Total | 44 | 11 | 55 |
| Location | No. of Shops | No. of Attractions | % |
|---|---|---|---|
| Front | 4 | 17 | 38.64% |
| Middle | 5 | 18 | 40.91% |
| Back | 8 | 9 | 20.45% |
| Total | 17 | 44 | 100.00% |
| Agent’s Configuration Profile | Values | Simulated Values | Unit | Description |
| No. of Pedestrians | 1 to 400 | 150 | agents | total number of agents to be released in the environment |
| Average waiting time | 1 to 30 | 10 | ticks | waiting time/ticks when agent stops at the counter patches |
| Walking Speed | 0.5, 1.0 | 0.5 | patch | agent’s speed of walking when going through the environment |
| Visitor view angle | 1 to 170 | 90, 120, 150 | degrees | agent’s view angle when evaluating a current and new target patch |
| Visitor Vision Depth | 14, 26, 40 | 14, 26, 40 | patches | agent’s vision depth when evaluating a current and new target patch |
| Pedestrian Percentage per Visitor Type | % | Simulated % | Unit | Description |
| % of Goal-Oriented Visitors | 0–99 | 46 | % | agents with a predetermined destination (dest-patch) |
| % of Strolling Visitors | 0–99 | 54 | % | walking agents with no predetermined destination |
| Percentage of Visitors per Entry Point | % | Simulated % | Unit | Description |
| North Side | 0–99 | 27 | % | agents coming from the north when entering the segment |
| West Side | 0–99 | 44 | % | agents coming from the west |
| South Side | 0–99 | 29 | % | agents coming from the south |
| Shop Attraction Factor | Values | Simulated Values | Unit | Description |
| Front (red) | ||||
| Shop 1 | ||||
| Attraction Level | 1, 5, 10 | 5 | patches | amount of patch influence of a shop |
| Radius of Influence | 1, 5, 10 | 5 | patches | extension of the amount of influence of a shop |
| Shop 2 | ||||
| Attraction Level | 1, 5, 10 | 1 | patches | |
| Radius of Influence | 1, 5, 10 | 5 | patches | |
| Shop 3 | ||||
| Attraction Level | 1, 5, 10 | 5 | patches | |
| Radius of Influence | 1, 5, 10 | 1 | patches | |
| Shop 9 | ||||
| Attraction Level | 1, 5, 10 | 10 | patches | |
| Radius of Influence | 1, 5, 10 | 10 | patches | |
| Middle (blue) | ||||
| Shops 4, 12 | ||||
| Attraction Level | 1, 5, 10 | 5 | patches | |
| Radius of Influence | 1, 5, 10 | 5 | patches | |
| Shop 5 | ||||
| Attraction Level | 1, 5, 10 | 5 | patches | |
| Radius of Influence | 1, 5, 10 | 10 | patches | |
| Shop 10 | ||||
| Attraction Level | 1, 5, 10 | 5 | patches | |
| Radius of Influence | 1, 5, 10 | 1 | patches | |
| Shop 11 | ||||
| Attraction Level | 1, 5, 10 | 1 | patches | |
| Radius of Influence | 1, 5, 10 | 5 | patches | |
| Back (orange) | ||||
| Shop 6 | ||||
| Attraction Level | 1, 5, 10 | 5 | patches | |
| Radius of Influence | 1, 5, 10 | 5 | patches | |
| Shops 7, 8, 13, 14, 15, 17 | ||||
| Attraction Level | 1, 5, 10 | 1 | patches | |
| Radius of Influence | 1, 5, 10 | 1 | patches | |
| Shop 16 | ||||
| Attraction Level | 1, 5, 10 | 5 | patches | |
| Radius of Influence | 1, 5, 10 | 1 | patches |
| Simulation Groups | a | b | c |
|---|---|---|---|
| SG1 | vva90 vvd14 | vva120 vvd14 | vva150 vvd14 |
| SG2 | vva90 vvd26 | vva120 vvd26 | vva150 vvd26 |
| SG3 | vva90 vvd40 | vva120 vvd40 | vva150 vvd40 |
Publisher’s Note: MDPI stays neutral with regard to jurisdictional claims in published maps and institutional affiliations. |
© 2021 by the authors. Licensee MDPI, Basel, Switzerland. This article is an open access article distributed under the terms and conditions of the Creative Commons Attribution (CC BY) license (https://creativecommons.org/licenses/by/4.0/).
Share and Cite
Chiou, Y.-S.; Bayer, A.Y. Microscopic Modeling of Pedestrian Movement in a Shida Night Market Street Segment: Using Vision and Destination Attractiveness. Sustainability 2021, 13, 8015. https://doi.org/10.3390/su13148015
Chiou Y-S, Bayer AY. Microscopic Modeling of Pedestrian Movement in a Shida Night Market Street Segment: Using Vision and Destination Attractiveness. Sustainability. 2021; 13(14):8015. https://doi.org/10.3390/su13148015
Chicago/Turabian StyleChiou, Yun-Shang, and Ailyne Yap Bayer. 2021. "Microscopic Modeling of Pedestrian Movement in a Shida Night Market Street Segment: Using Vision and Destination Attractiveness" Sustainability 13, no. 14: 8015. https://doi.org/10.3390/su13148015